1. Introduction
The analog Ex-core Neutron Flux Monitoring System (ENFMS) has been satisfactorily performing its functions but it was implemented using older technology, subject to obsolescence and aging as well as limiting the possibility of adding new capabilities that could be beneficial to the system. Obsolescence can make the system be less reliable, especially when it is left to degrade. It can also lead to reduced availability and a compensatory increase in operation and maintenance (O&M) costs in order to maintain acceptable performance while aging and environmental degradation can reduce performance. As the industrial base has largely been moving to digital-based systems, traditional analog instrumentation and control (I&C) systems for nuclear power plants (NPPs) have been replaced with digital I&C systems. In Korea, major I&C systems in nuclear power plants have been digitalized with programmable logic controllers (PLCs) and distributed control systems (DCSs) applied to the Advanced Power Reactor 1400 (APR1400) including Shin-Kori NPPs 3, 4, 5 & 6 and Shin-Hanul NPPs 1 & 2 in operation or under construction in Korea as well as Barakah NPP 1, 2, 3 & 4 under construction in United Arab Emirates. However, the ENFMS is one of the few systems which has not yet been digitalized and which serves as the key motivation of this study.
A digitalized ENFMS will eliminate the necessity for nuclear I&C systems to maintain extra signal processing electronics such as analog-to-digital (A/D) and digital-to-analog (D/A) converters, wires, cables, etc., for the signal communications between analog and digital systems. In addition, the digital ENFMS will be essentially free of drift that afflicts analog electronics so that it will maintain its calibration better aside from improving the performance in terms of accuracy and computational capabilities. Operating conditions can also be more fully measured and displayed since it has higher handling and storage capabilities. It can be easier to use and more flexible in application if properly designed. Indeed, it has the potential for improved capabilities, namely: fault tolerance, self-testing, signal validation, and process system diagnostics that could form the basis for entirely new approaches to achieve the required reliabilities. Specifically, when the preamplifier output of detector signal is directly digitized and processed to extract information of interest through digital signal processing.
There are several significant advantages of digital signal processing compared to traditional analog signal processing. First are the analyses, which takes pulse-by-pulse differences into account, and can be used in development such as in making ballistic deficit compensations. Second, transient induced charge signals which deposit no net charge on an electrode can be analyzed to give information on the position of interaction within the detector. Third, dead times from transient overload signals are greatly reduced from tens of micro-seconds to hundreds of nano-seconds. Fourth, signals are easily captured so that more complex analyses can be postponed until the source event has been deemed interesting. Fifth, signal capture and processing may easily be based on coincidence criteria between different detectors or different parts of the same detector [
1].
State-of-the-Art Technology for Digital Signal Acquisition, Processing Modules and the Digital ENFMS
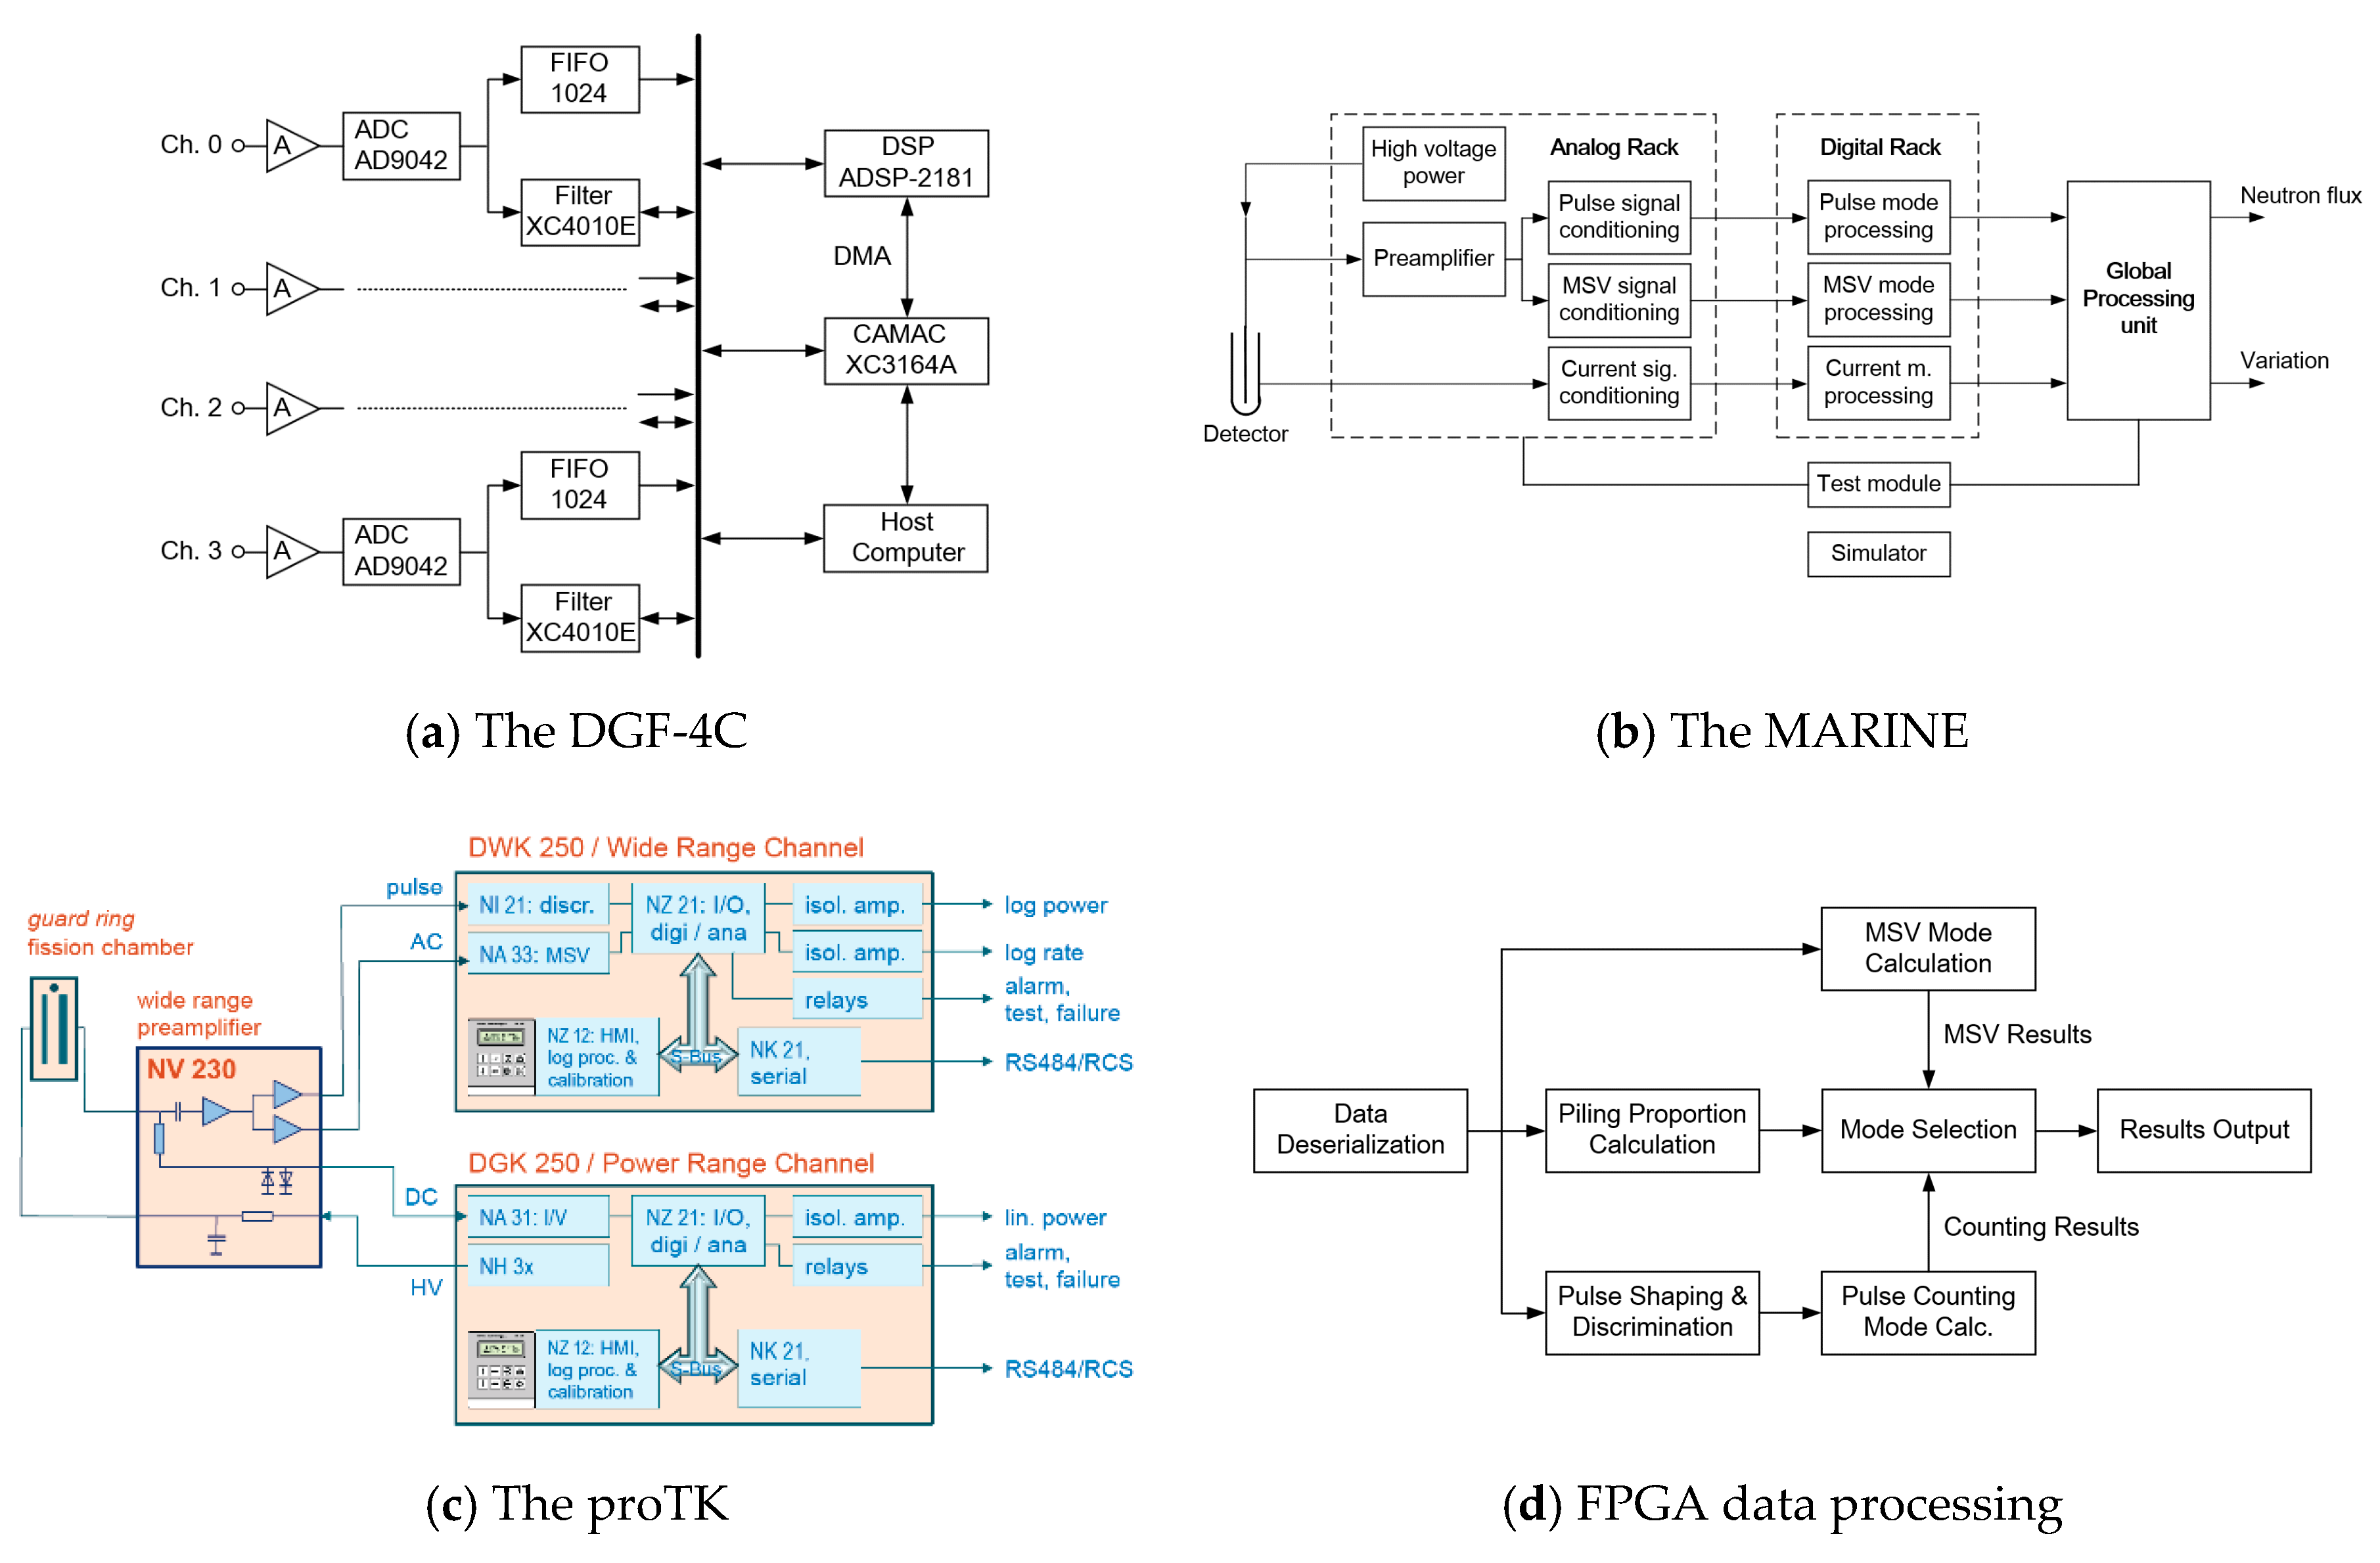
It is known that there have been several achievements on the digitalization of the data acquisition and processing system for radiation and neutron instrumentation and monitoring. XIA Corporation (formerly X-ray Instrumentation Associates, Hayward, CA 94544, USA), a digital data acquisition and processing systems supplier for x-ray, gamma ray and particle detectors in the USA, developed the DGF-4C, a model of the four-channel digital signal acquisition and processing module for nuclear applications. A block diagram of the DGF-4C is shown in
Figure 1a. The host computer communicate with the board via the Computer-Aided Measurement And Control (CAMAC) interface using a direct memory access (DMA) channel [
2]. Unfortunately, the maximum rate of pulse processing by the DGF-4C is around 50,000 counts per second per channel, which is slow for the APR1400-specific digital ENFMS.
An instrumentation and high voltage power supply provider for nuclear and particle physics in Italy, Construzioni Apparecchiature Elettroniche Nucleare (CAEN SpA, Viareggio, 55049 Italy), provides high-speed waveform digitizers and various kinds of modular digital pulse processing electronics which meet IEEE standards for nuclear and particle physics. The real-time digital data processing transforms the row sequence of samples into compressed data that preserve the information required, thereby minimizing the event data size [
3,
4].
The French Atomic Agency (CEA) and its industrial partner Technicatome (Villiers-le-Bâcle, Île-de-France, France) developed a fully digitalized wide range neutron monitoring system, named MARINE (after the French acronym for automated neutron measurement), for experimental and commercial nuclear power plants. A block diagram of the MARINE is shown in
Figure 1b [
5]. They developed the systems, TELEPERM-XS and SPINLINE, which met the requirements of International Electrotechnical Commission (IEC) Category A I&C safety function and Institute of Electrical and Electronics Engineers (IEEE) Class 1E applications, based on their own digital safety platforms.
Mirion Technologies in Germany (Munich, Germany) developed the digital neutron flux and reactor gamma monitoring system proTK which includes the source and intermediate range monitoring nodule, the wide range monitoring module, the power range monitoring module, the flux distribution monitoring module, as well as local and average power range monitoring module. A block diagram of the wide and power range monitoring instrumentation is shown in
Figure 1c. Bohunice and Mochovce NPPs in Slovakia replaced parts of the neutron flux monitoring systems with TELEPERM-XS. The new neutron flux monitoring systems, which each consists of TELEPERM-XS, SUGAN and non-standard measuring units, have been operating successfully since 1999. Outputs from the detectors are fed into the Hartman and Braun analog units which convert the signals into levels appropriate to the TELEPERM-XS [
6].
In China, a digital neutron flux measuring system based high speed data sampling, an FPGA (field-programmable gate array) and the Peripheral component interconnection eXtension for Instrumentation express (PXIe) bus was developed for the HL-2A tokamak which started its construction in 1995 under the national nuclear fusion development program. The FPGA data processing diagram is shown in
Figure 1d [
7]. Westinghouse (Cranberry Township, PA, USA) in the USA and Toshiba (Yokohama-shi, Kanagawa 235-8523, Japan) in Japan have also jointly developed FPGA-based Start-up Range Neutron Monitor (SRNM), Power Range Monitor (PRM), Oscillation Power Range Monitor (OPRM), and Traversing In-core Probe (TIP) for Boiling Water Reactors [
8].
The Korea Atomic Energy Research Institute (KAERI) has adopted the digital wide-range neutron power measurement (DWRNPM) system for the research reactor in KAERI. The DWRNPM system monitors the neutron flux across a range of over 10 decades, processes signals in the form of electric pulses or current through a series of analog circuits and digital processors. Preamplification of the detector signals, pulse shaping, the signal-to-noise discrimination, and the mean squared voltage (MSV) calculation are performed by the analog circuits. On the other hand, pulse counting and dead time correction, wide-range logarithmic signal generation with pulse and MSV signals, and the conversion of the neutron flux information to reactor power information are done by digital signal processor unit [
9].
2. Design of the Digital ENFMS for APR1400
ENFMS for APR1400 NPPs shall satisfy all requirements specified in design specifications for ENFMS [
10,
11]. The design specifications include requirements on ENFMS functions and performances which are common to both analog and digital equipment. In addition, digital ENFMS shall also satisfy specific design requirements and guidelines for the digital equipment and software in the APR1400 man-machine interface systems.
The specific requirements include software requirements, software verification and validation requirements communication requirements, test requirements, human factor engineering guidelines, system security requirements, cyber security requirements, and the secure development and operational environment (SDOE) requirements. These are based on industrial standards and nuclear regulatory guidelines of which some are listed as follows:
IEEE Std 7-4.3.2, IEEE Standard Criteria for Programmable Digital Devices in Safety Systems of Nuclear Power Generating Stations
IEEE Std 730, IEEE Standard for Software Quality Assurance Processes
IEEE Std 828, IEEE Standard Configuration Management in Systems and Software Engineering
IEEE Std 829, IEEE Standard for Software and System Test Documentation
IEEE Std 830, IEEE Recommended Practice for Software Requirements Specifications
IEEE Std 1008, IEEE Standard for Software Unit Testing
IEEE Std 1012, IEEE Standard for System, Software, and Hardware Verification and Validation
IEEE Std 1028, IEEE Standard for Software Reviews and Audits
IEEE Std 1042, IEEE Guide to Software Configuration Management
IEEE Std 1074, IEEE Standard for Developing a Software Project Life Cycle Process
USNRC Regulatory Guide 1.152, Criteria for Use of Computers in Safety Systems of Nuclear Power Plants,
USNRC Regulatory Guide 1.168, Verification, Validation, Reviews, and Audits for Digital Computer Software Used in Safety Systems of Nuclear Power Plants
USNRC Regulatory Guide 1.169, Configuration Management Plans for Digital Computer Software Used in Safety Systems of Nuclear Power Plants
USNRC Regulatory Guide 1.170, Test Documentation for Digital Computer Software Used in Safety Systems of Nuclear Power Plants
USNRC Regulatory Guide 1.171, Software Unit Testing for Digital Computer Software Used in Safety Systems of Nuclear Power Plants
USNRC Regulatory Guide 1.172, Software Requirement Specifications for Digital Computer Software and Complex Electronics Used in Safety Systems of Nuclear Power Plants
USNRC Regulatory Guide 1.173, Developing Software Life-Cycle Processes for Digital Computer Software Used in Safety Systems of Nuclear Power Plants
KINAC/RS-015, Regulatory Standard on Cyber Security for Nuclear Facilities
KINAC/RS-019, Regulatory Standard on Identification of Critical Digital Assets for Nuclear Facilities
2.1. Logarithmic Power Signal Generation
This section describes how to implement the functions of the wide-range monitoring instrumentation with the application of digital hardware and software technologies. Functions of the wide-range monitoring instrumentation are performed in both pulse and MSV modes.
2.1.1. Data Acquisition
The function of the front-end electronics of the start-up and wide-range monitoring instrumentations is to acquire the electric charge pulses generated by a neutron flux detector, and to condition them to be suitable for pulse counting and MSV calculation. Nowadays, the availability of very fast and high precision A/D converters, permits the design of data acquisition systems in which the A/D conversion occurs at the detector preamplifier outputs without any analog signal shaping. The data acquisition system captures the detailed shape of the preamplifier signals using fast A/D converters without loss of information, provided that the Nyquist criteria is satisfied, but is affected by errors due to the quantization noise and to other sources of electronic noise. To process detector signals with the rise time of 0.05 micro-seconds and to satisfy requirements on the measurement range and system accuracy, the A/D converters require the sampling rate of 500M samples/second and a resolution of 10 to 14 bits. A combination of currently available A/D converters and FPGAs with processing speeds up to 500M samples/second and 16-bit resolution makes possible the digitizing of pulse trains at speeds of 1 or 2 nanoseconds [
11].
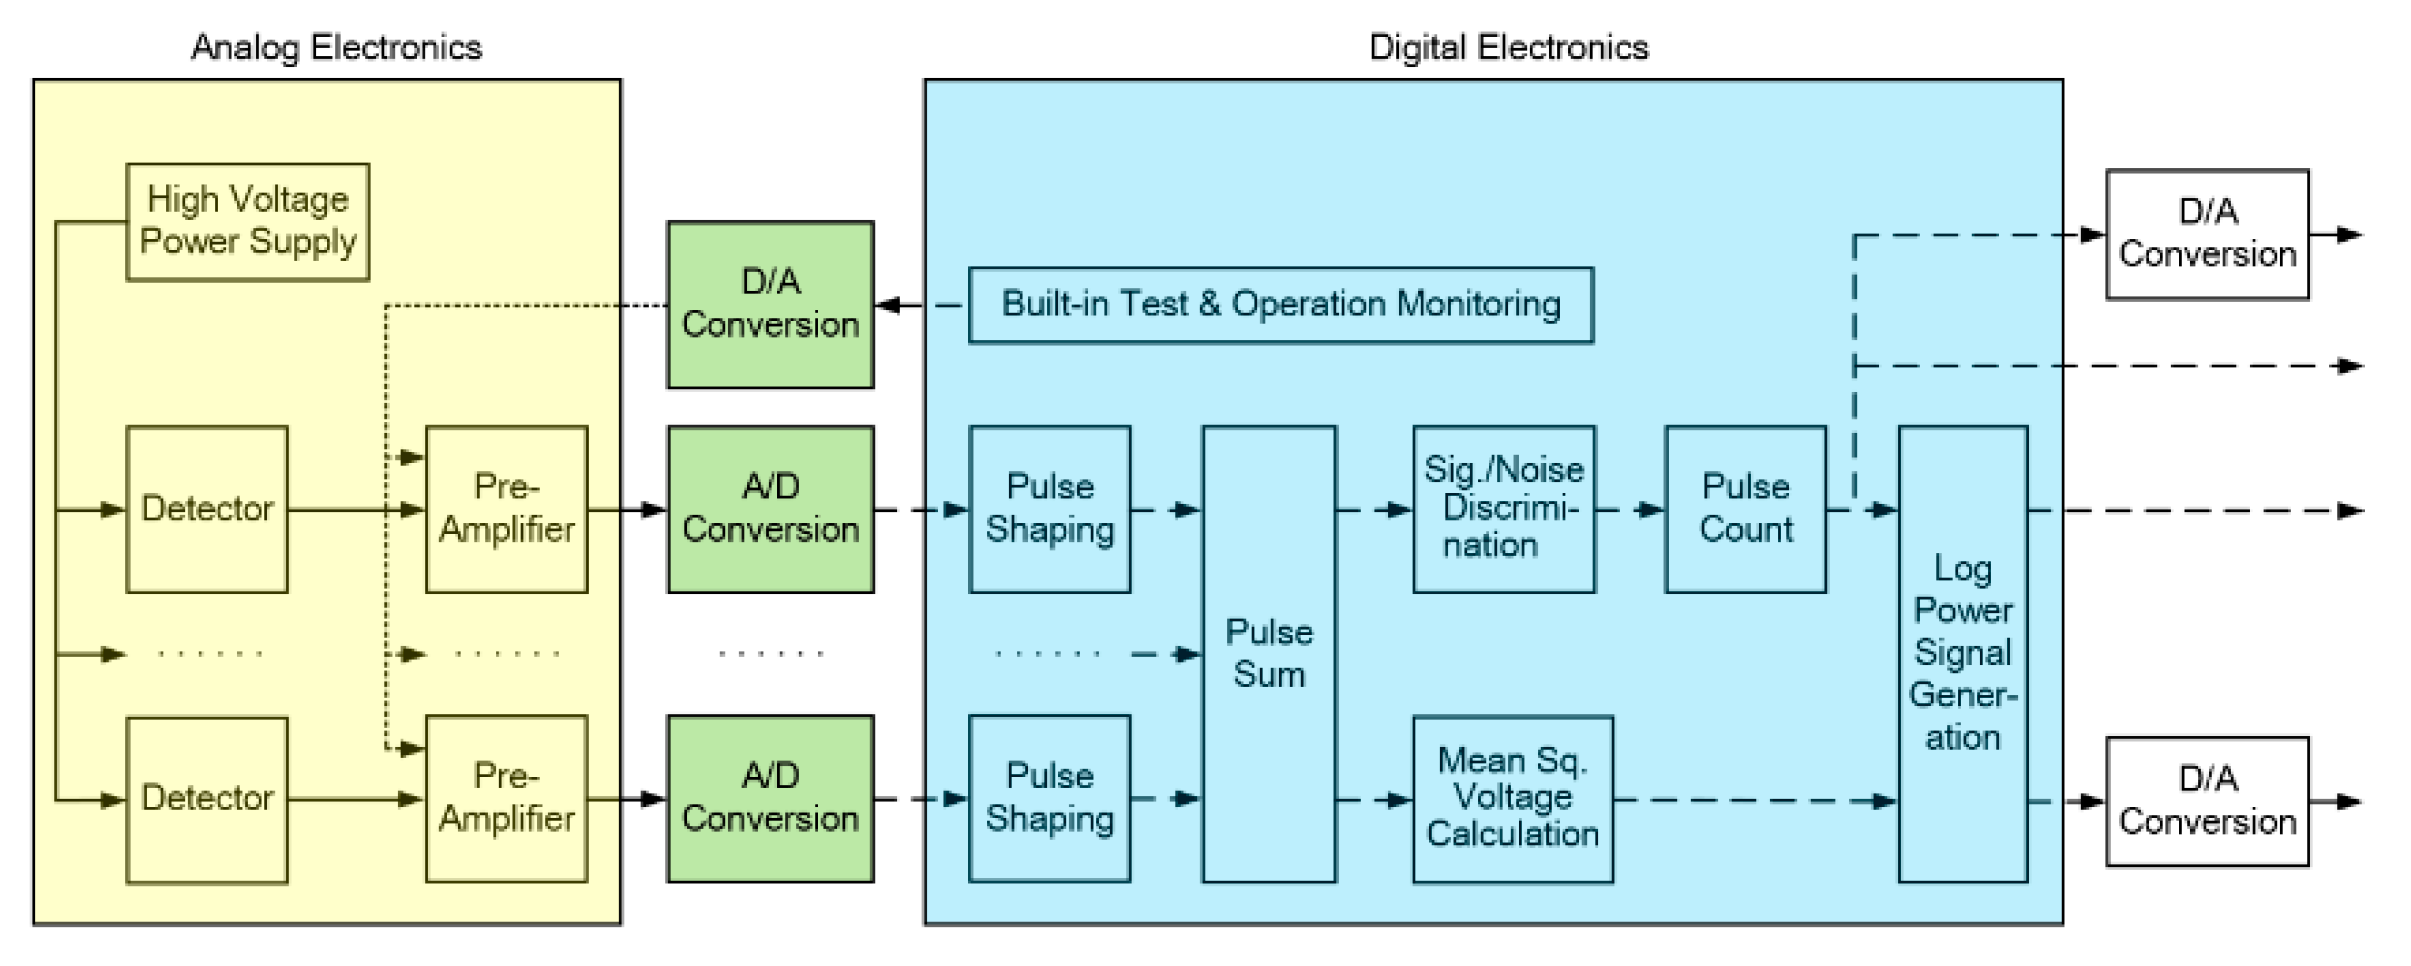
The proposed digital implementation of the logarithmic power signal generation for the start-up and wide-range monitoring instrumentations can be configured as shown in
Figure 2. The preamplifier acquires the electric pulse signals generated by the detector and converts to voltage signals with a range fit to the input span of the A/D converter. The preamplifier remains in analog form because it needs to process very low signals with high speed and short response time. However, the reactor power calculation function and other connected signal conditioning and processing functions from pulse shaping to output data and signal generation will be digitalized.
2.1.2. Hardware for the Digital Signal Processing
The digital signal processing processes the captured waveforms in real time using fast digital signal processors (DSPs) or FPGAs to perform all necessary data processing functions digitally. These functions include pulse shaping, summing, signal-to-noise discrimination, pulse counting, frequency band-pass filtering, MSV calculation, the logarithmic power and rate of power change signal generation of signals from the pulse and MSV mode processing, data communication with other interfacing systems, and, if required, D/A conversion.
2.1.3. Algorithms for the Digital Signal Processing
Pulse Shaping
The transfer function of the CR-(RC)
n shaping amplifier is given as follows, assuming that the time constants of the differentiation and the
integrations are all the same value
τ:
The impulse response function of the CR-(RC)
n shaping amplifier,
is derived from Equation (1) as:
When the input signals are assumed with a sampling time interval of
the
z-transform of the impulse response function of the CR-(RC)
n shaping amplifier,
H(
z) will be
and, the
z-transform of CR-(RC)
4 shaping amplifier with four stages of integration,
is approximated as:
where
The
z-transforms for input and output signals of CR-(RC)
4 shaping amplifier,
and
, have the relationship:
Calculating the corresponding difference by taking the inverse
z-transform of Equation (5) [
12,
13]:
The transfer function of the pole-zero cancellation is:
While the transfer function of the CR-(RC)
n shaping amplifier with the pole-zero cancellation is
The
z-transforms of input and output signals of the first CR section of the shaping amplifier with the pole-zero cancellation is approximated as:
Calculating the corresponding difference by taking the inverse z-transform of Equation (9) gives
where
Signal to Noise Discrimination
There are several digital signal processing techniques to discriminate pulse signals induced by neutrons from those by gamma rays and electric noises, including pulse height discrimination, pulse shape discrimination and discrete Fourier transform method. The pulse height discrimination is set to a discrimination threshold and to generate an output pulse when the amplitude of an input pulse exceeds the threshold. The pulse shape discrimination originates from the different properties of neutron and gamma ray pulse shapes. A ratio of two areas obtained by integration of a pulse in various time intervals is used to discriminate the neutron interaction from the gamma ray interaction.
The ratio
is defined as [
14]:
where
is the total area of the pulse and
is the area of the tail part of the pulse. The ratio of the neutron pulse is generally larger than that of the gamma ray pulse.
The discrimination point of
to classify the neutrons and gamma ray interactions can be chosen at the cross point of the neutron and the gamma ray curve. The pulse shape discrimination can also be done by evaluating the similarity of how close the patterns of two different pulse shapes are when each of the pulses is represented by a vector. The similarity
is defined as [
15]
where
is a pattern vector to be identified and
is an appropriate reference or discriminant vector,
is the scalar product,
and
are norms of the vectors, and
is the angle between the two vectors. The angle
is used as an index of the pulse shape discrimination. In the digital system, a pulse shape can be represented by the vector:
where
is the number of elements of the vector
and the elements can be obtained directly from the input of the signal-to-noise discrimination function. The typical profile of the pulse shape can be expressed as
where
is the rise time and
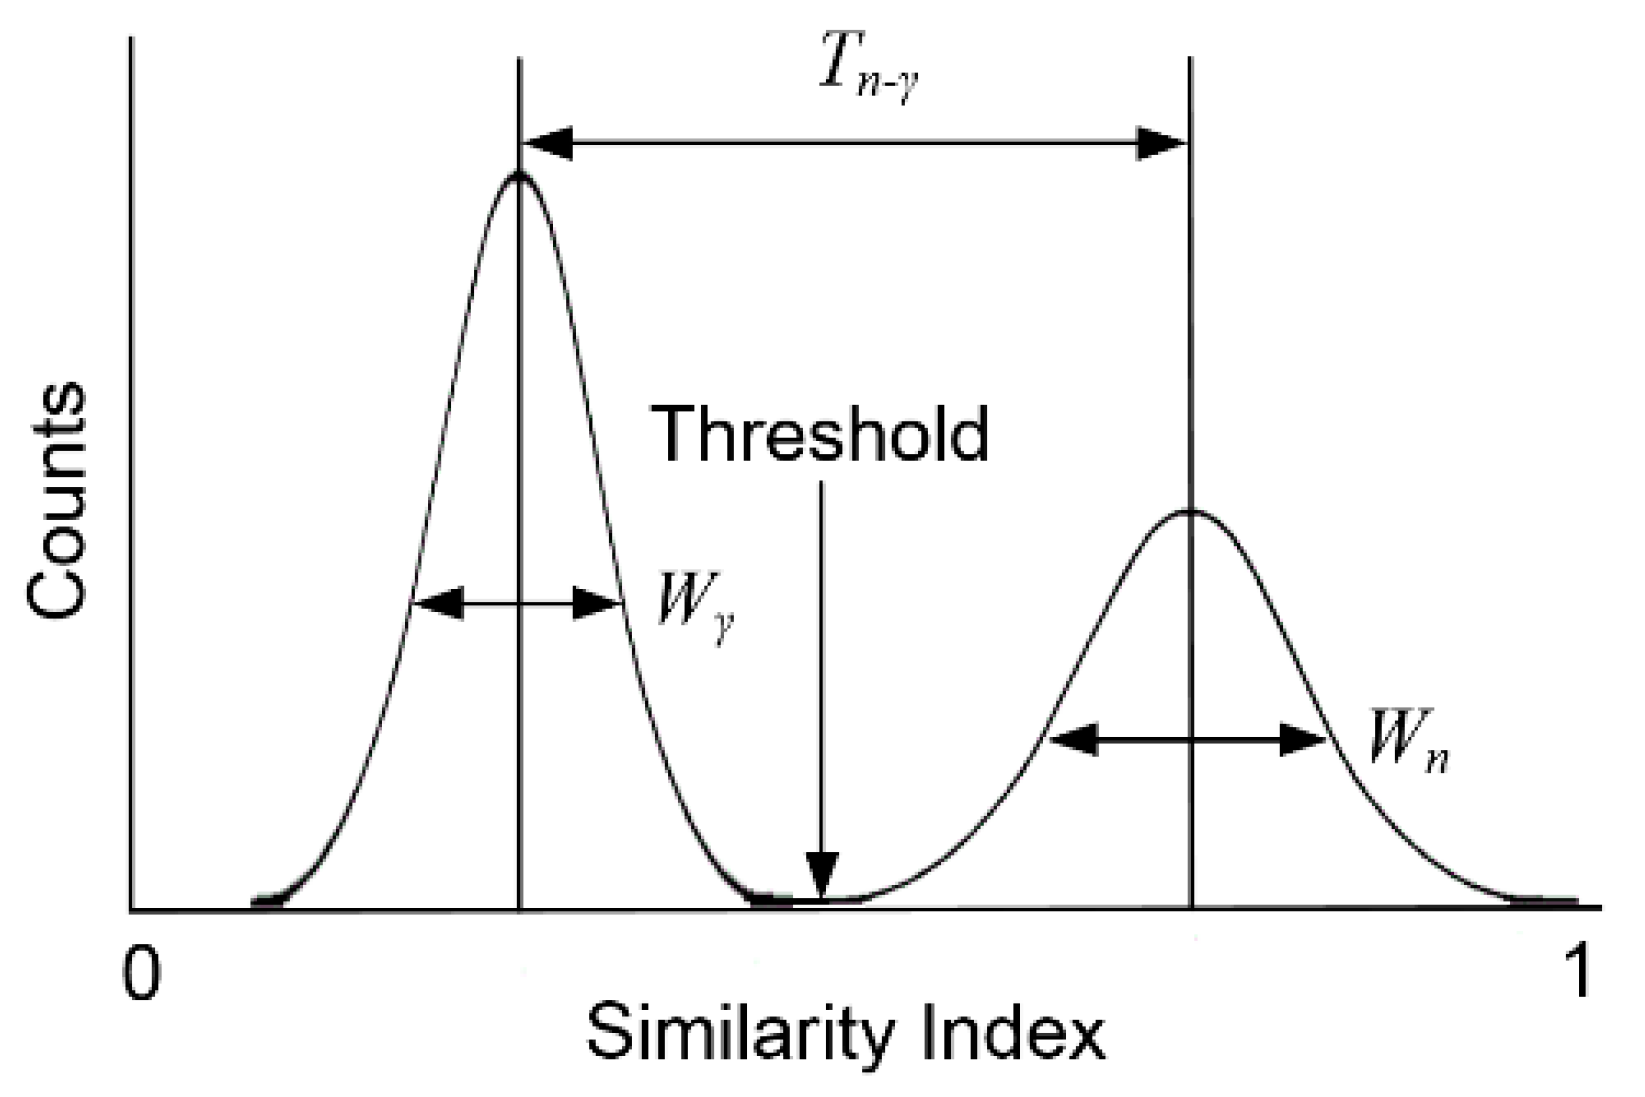
is the decay time. While taking a pulse shape from the measured data as the discriminant vector,
for each pulse signal is calculated through Equation (12) and, if a neutron pulse shape is used as the discriminant vector, then the similarity index distribution can be obtained as given in
Figure 3.
The figure of merit,
which is the quantity to represent the discrimination power, is defined as:
where
and
are the distance between the neutron and gamma ray peaks, the full width at half maximum (FWHM) of the gamma ray interactions and the FWHM of neutron interactions, respectively. The discrimination threshold of
to classify the neutrons and gamma ray interactions can be chosen at the cross point of the neutron and the gamma ray curve, which is at around 0.5 (
Figure 3). The rise time method and the discrete Fourier transform method can be applied as a pulse shape discrimination technique in the mixed neutron and gamma ray fields [
15,
16].
Mean Squared Voltage Calculation
The MSV signal,
and
relationship is given as:
Logarithmic Power Signal Generation
The logarithmic reactor power signal,
is generated by combining the pulse count signal and the MSV signal, which are then adjusted by a reactor power calibration factor
. The key parameters for the calibration of the logarithmic reactor power signal are the start and end points of the overlapping region between the pulse count signal and the MSV signals
and
. The overlapping region of the pulse signal
and
is characterized by
and
and is used for signal selection and interpolation as follows [
1]:
where
and
is the calibration factor.
2.2. Linear Power Signal Generation
2.2.1. Data Acquisition
The front-end electronics for the linear power signal generation of the wide-range monitoring instrumentation acquire mean values of current signals from neutron flux detectors for a fixed response time which is much longer than the average time between individual current pulses. Analog linear amplifiers acquire, amplify and then convert the current signals generated by detectors into voltage signals within the range fit to the respective input span of A/D converter. The rate of A/D conversion applicable to process component controls in nuclear power plants is also sufficient to this application.
2.2.2. Hardware and Software for the Digital Signal Processing
Digital signal processing for linear power signal generation requires filtering and arithmetic operations. Therefore, DSPs which have been utilized for safety I&C systems in nuclear power plants such as COMMON-Q and POSAFE-Q are also appropriate for this application. Analog input and processor modules shall be selected to meet response time and accuracy requirements of the instrumentation channel.
2.3. Application of the Extended Kalman Filter Algorithm
Extended Kalman filter (EKF) is utilized for optimal estimation of neutron flux level and reactor period information. The neutron flux and the reactor period have the relationship [
17,
18]:
where
is reactor power at time
[%],
is reactor power at
[sec.],
is the reactor period [sec.] (time required for reactor power to change by a factor
controlled by plant operators through movement of control rods and changing the boron concentration), and
is the reactor start-up rate [min
−1] (number of factors of ten that reactor power changes in a minute).
When the logarithmic reactor power
is assumed to have a logarithmic relationship with
and ranges from 0 to 10 corresponding to the reactor power from 2 × 10
−8 to 2 × 10
2 [%], it gives:
The discrete-time version of Equation (22) and the inverse of reactor time can be expressed as:
where
is the discrete-time sampling interval. If
is too small, Equations (23) and (24) can be approximated as:
The perturbed process can be described by the following discrete-time state space realization:
where
and
are the state error covariances. With a two-dimensional state vector,
is defined as
and Equation (27) can be expressed as
where
and
are the state transition matrix, input coupling matrix, input vector, and state error vector.
The reactor power measurement with measurement noise can be described as
where
and
are the observation matrix and the measurement error vector. Based on the noise measurement
and the change of the reactor period during
at time
the best estimates of
and
can be obtained by EKF as:
where
is the Kalman gain,
is the estimation error variance, and
is the prediction error variance.
3. Simulation
3.1. Modelling of the Neutron Flux Detector Current
A simplified model of a fission chamber is designed to describe the relationship between the reactor power and the current output from the fission chamber. The characteristics of the fission chamber and preamplifier is given in
Table 1 while the relationship between reactor power and neutron flux is listed in
Table 2. The electric charge collected by the electrodes,
and the resulting current pulse,
are expressed as [
19]:
where
is the maximum amplitude of the electric charge generated by the
interaction,
is the time when the
interaction occurs, and
is the rise time of the electric charge generated by the
interaction.
MATLAB Simulink was used to design a model for realizing Equations (38) and (39).
is assumed as a pulse with random maximum amplitude, mean of 0.9524 × 10
−6 [A] and variance of 0.0286 × 10
−12 [A
2].
is also random with a mean of
multiplied by
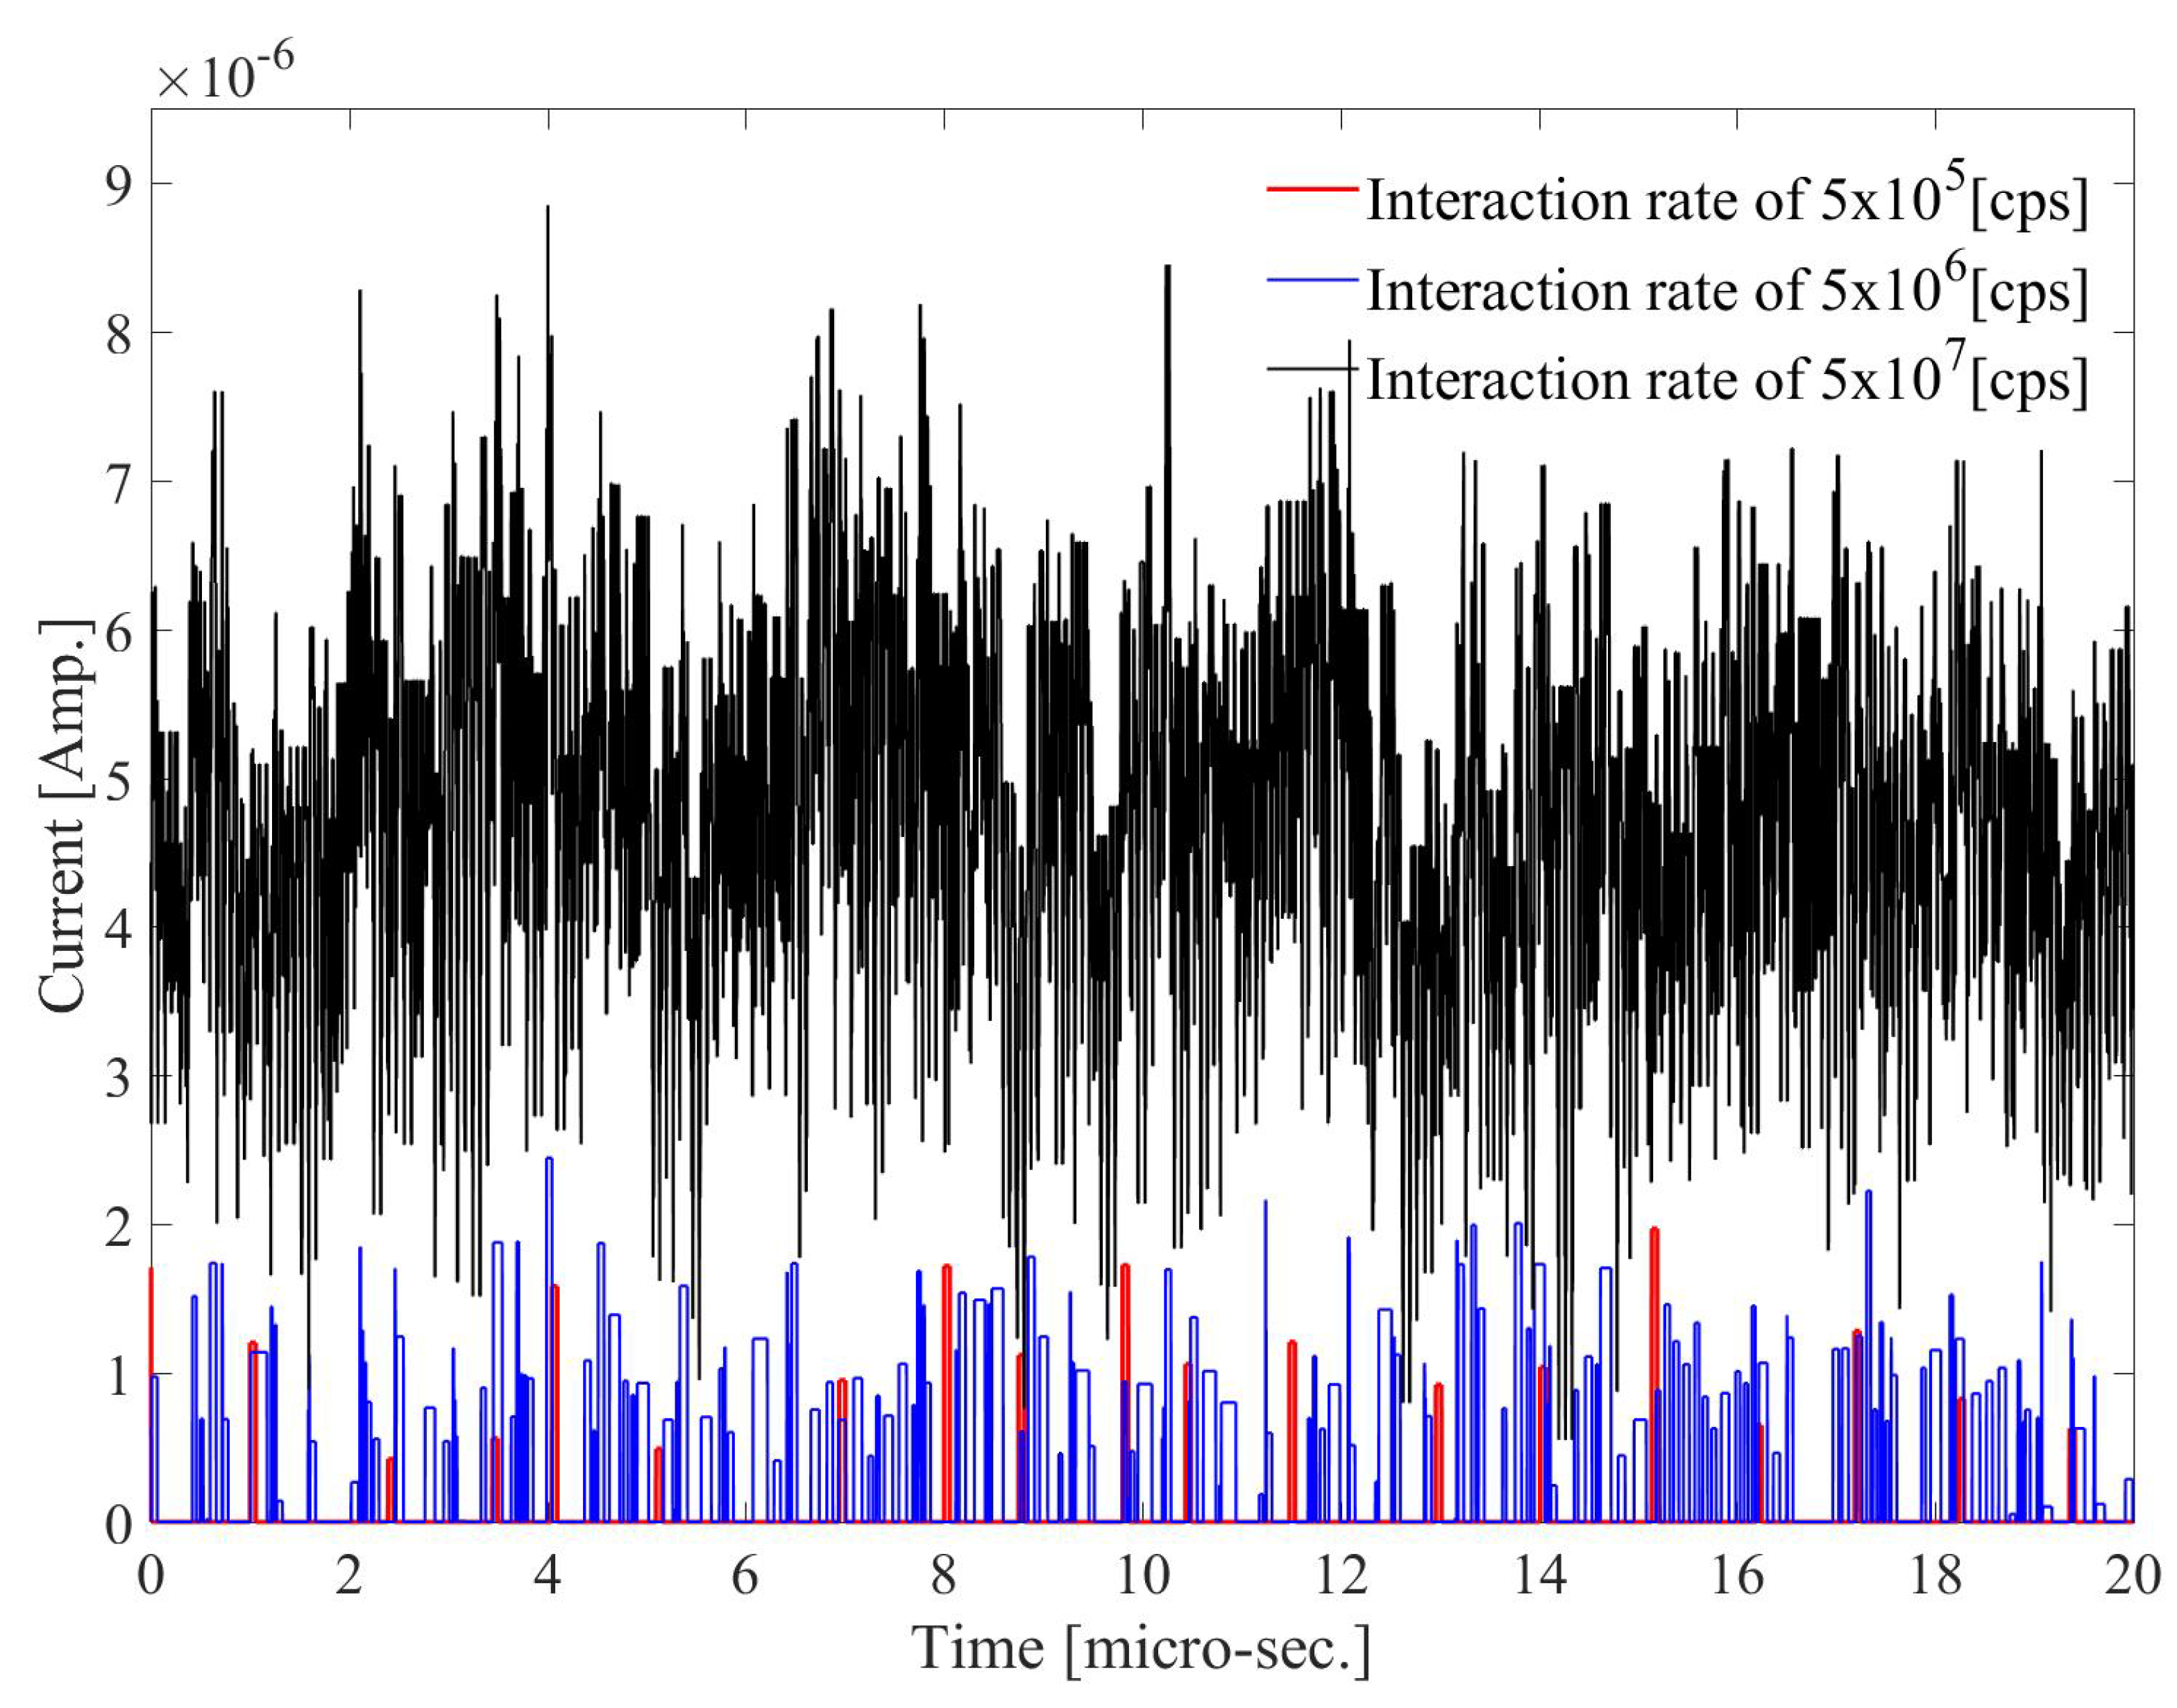
which is the nominal period of pulse at a certain interaction rate, and with variance. Simulated current signals at interaction rates of 5 × 10
5, 5 × 10
6, and 5 × 10
7 [events/sec.] between incident neutrons and the gas in the detector is shown in
Figure 4. The detector signal does not show pulse overlaps at 5 × 10
5 while the pulse signal processing can produce reliable information on the neutron interaction rate. So much pulse pile-ups occur between successive neutron interactions at 5 × 10
6 that the pulse signal processing loses count and leads to misreading of the interaction rate. In the case of 5 × 10
7, the fluctuation signal is produced by the overlapping of individual pulses, hence, MSV signal processing is required.
The pulse height distribution with pulse pile-ups is shifted to the right of those without the pile-ups in
Figure 5a.
Figure 5b shows that the pile-up of multiple gamma ray events may be erroneously counted as a neutron interaction event, and that the pile-up between neutron and gamma ray interaction events increases the amplitude of the pulse signal relative to those of single events.
3.2. Estimation of Reactor Power by MSV and Current Mode Calculations
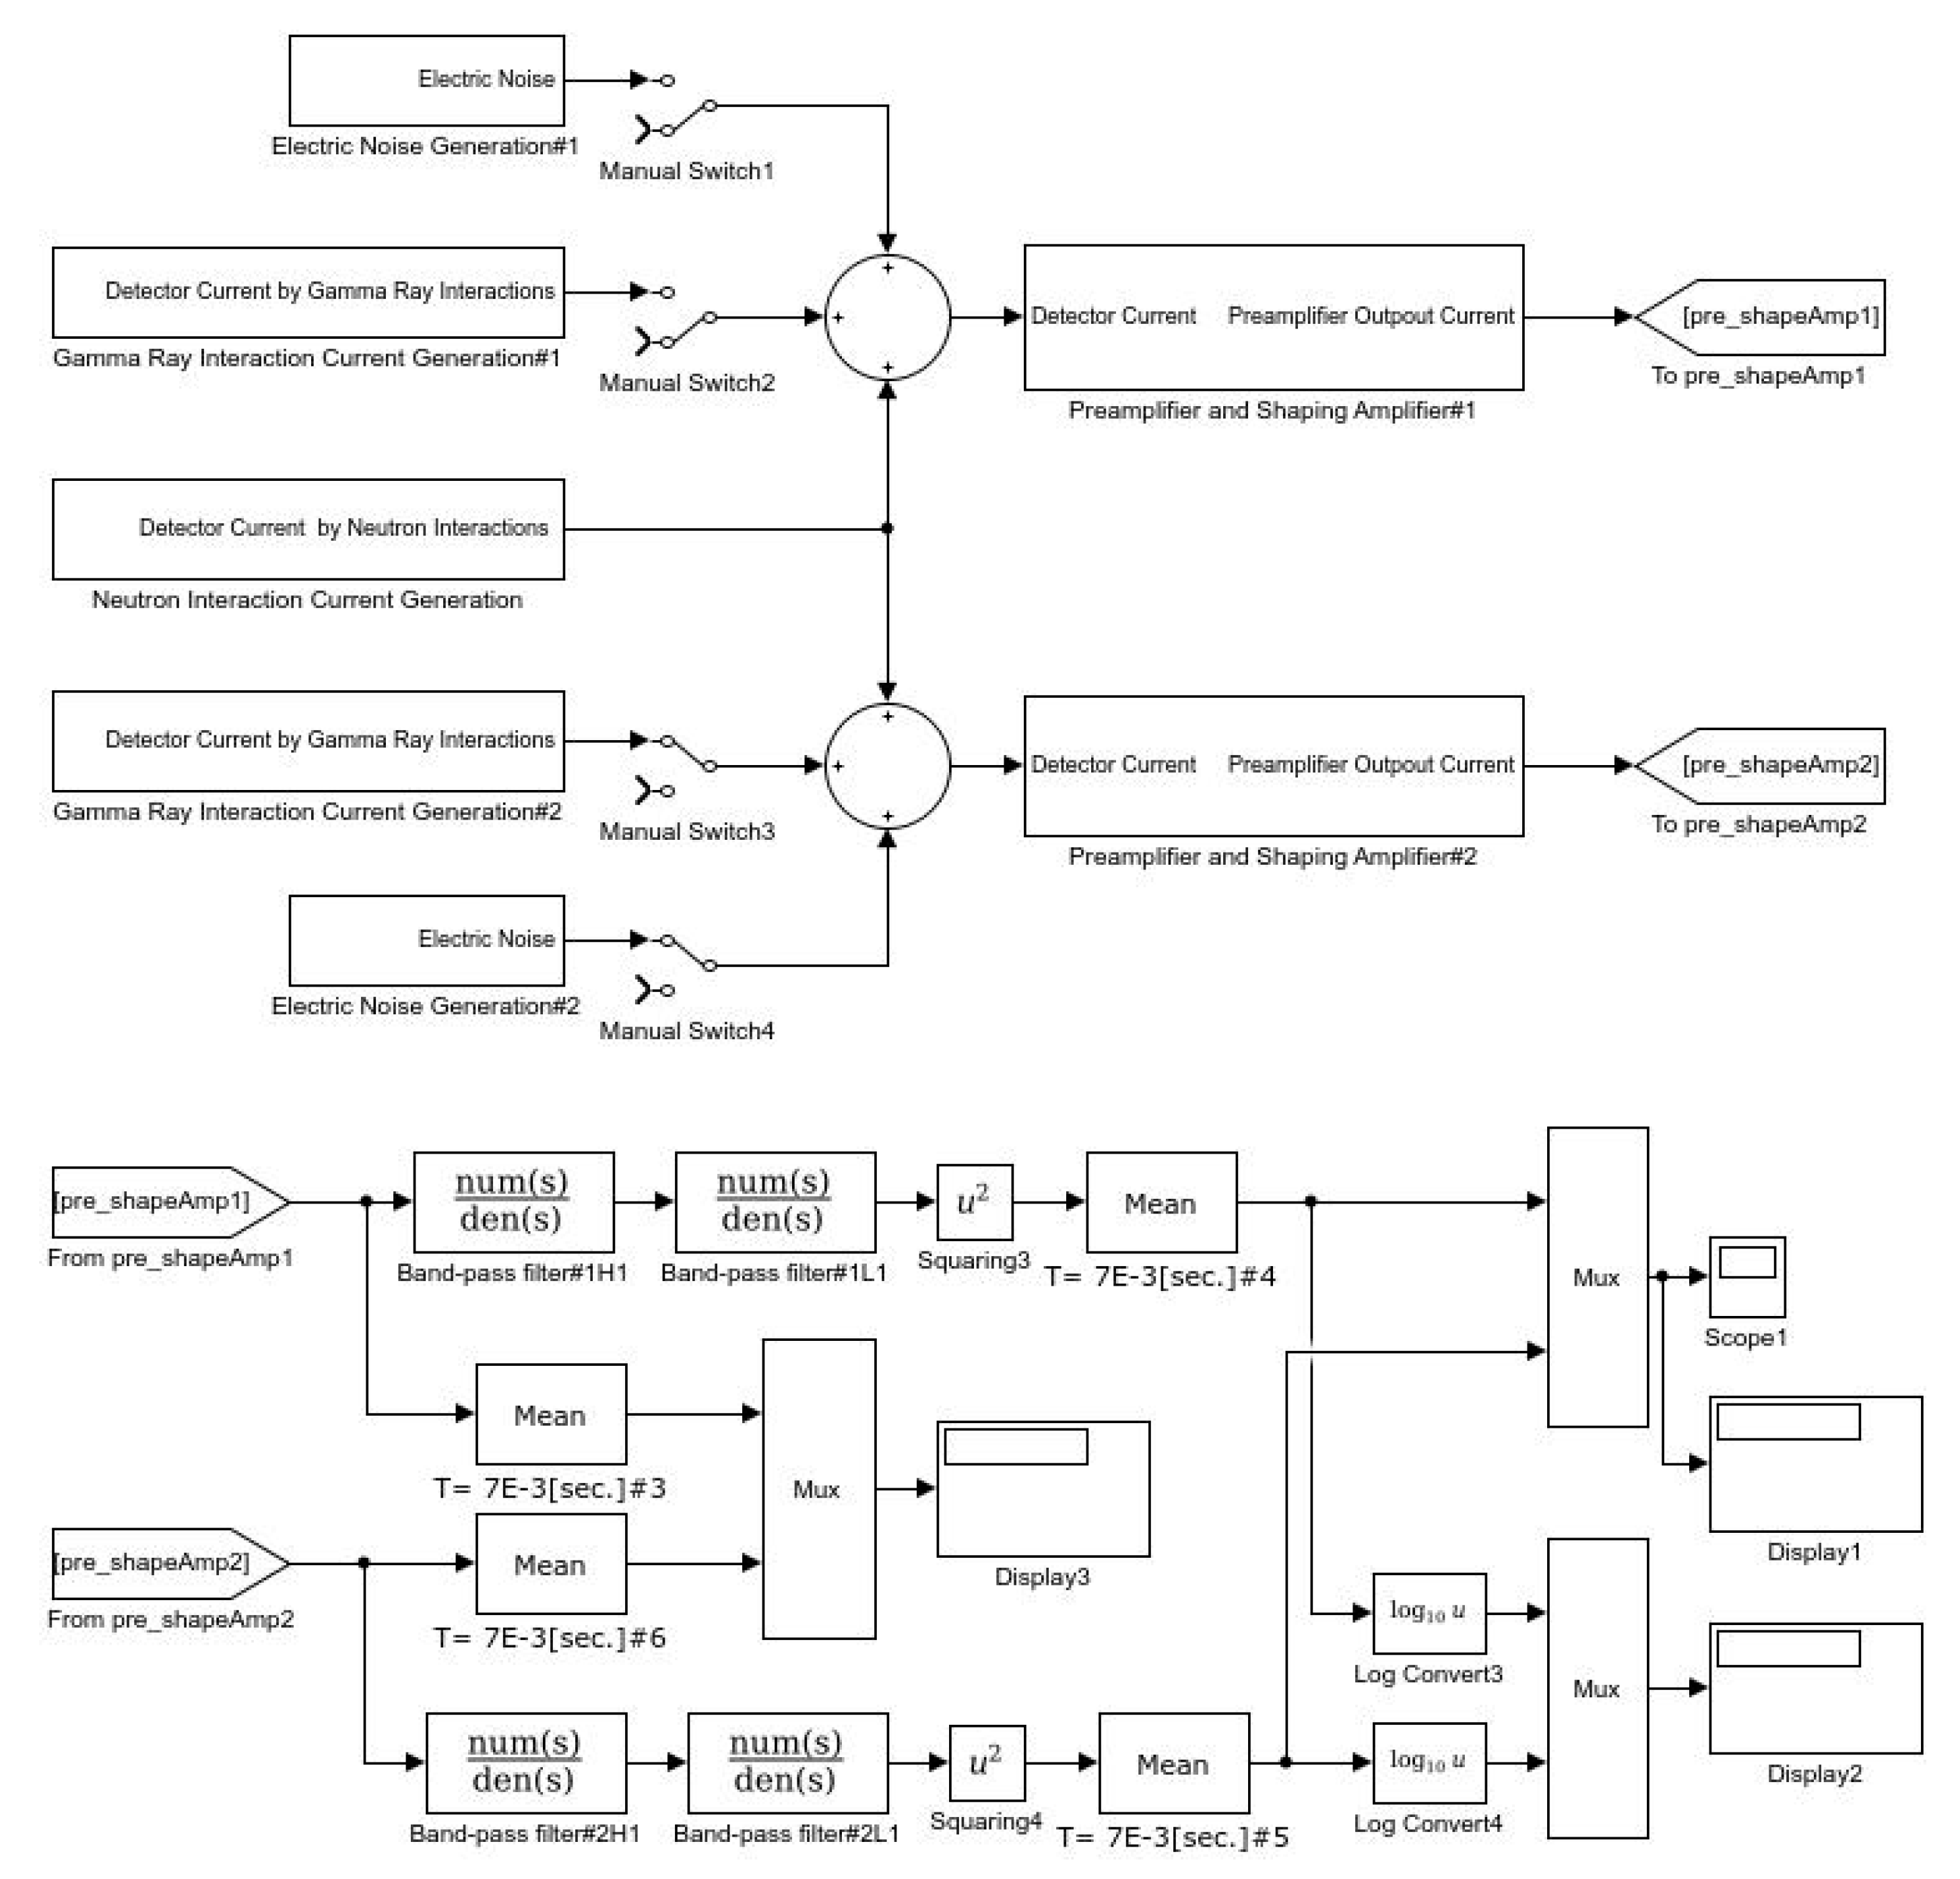
The performance of MSV and current mode signal processing in terms of rejecting the influence of signals generated by gamma ray interactions and electric noise for the estimation of reactor power level were compared through simulations. Two detector signals were assumed, one signal generated by neutron interactions only while the other signal includes components of neutron and gamma interactions as well as electric noise. For MSV mode signal processing, the detector current signal pass through the amplifier and the band-pass filter, and then the mean values of the currents are calculated. In terms of current mode signal processing, the detector current signals also pass through preamplifier and low-pass filter, and then the mean values of the currents are calculated. The block diagram for MSV and current mode signal processing simulation is given in
Figure 6 wherein gamma ray interactions are assumed to occur at the rate of 3.3 × 10
6 [events/sec] and produce a pulse current per interaction with an amplitude of 0.42 micro-amperes and a pulse width of 50 [nsec].
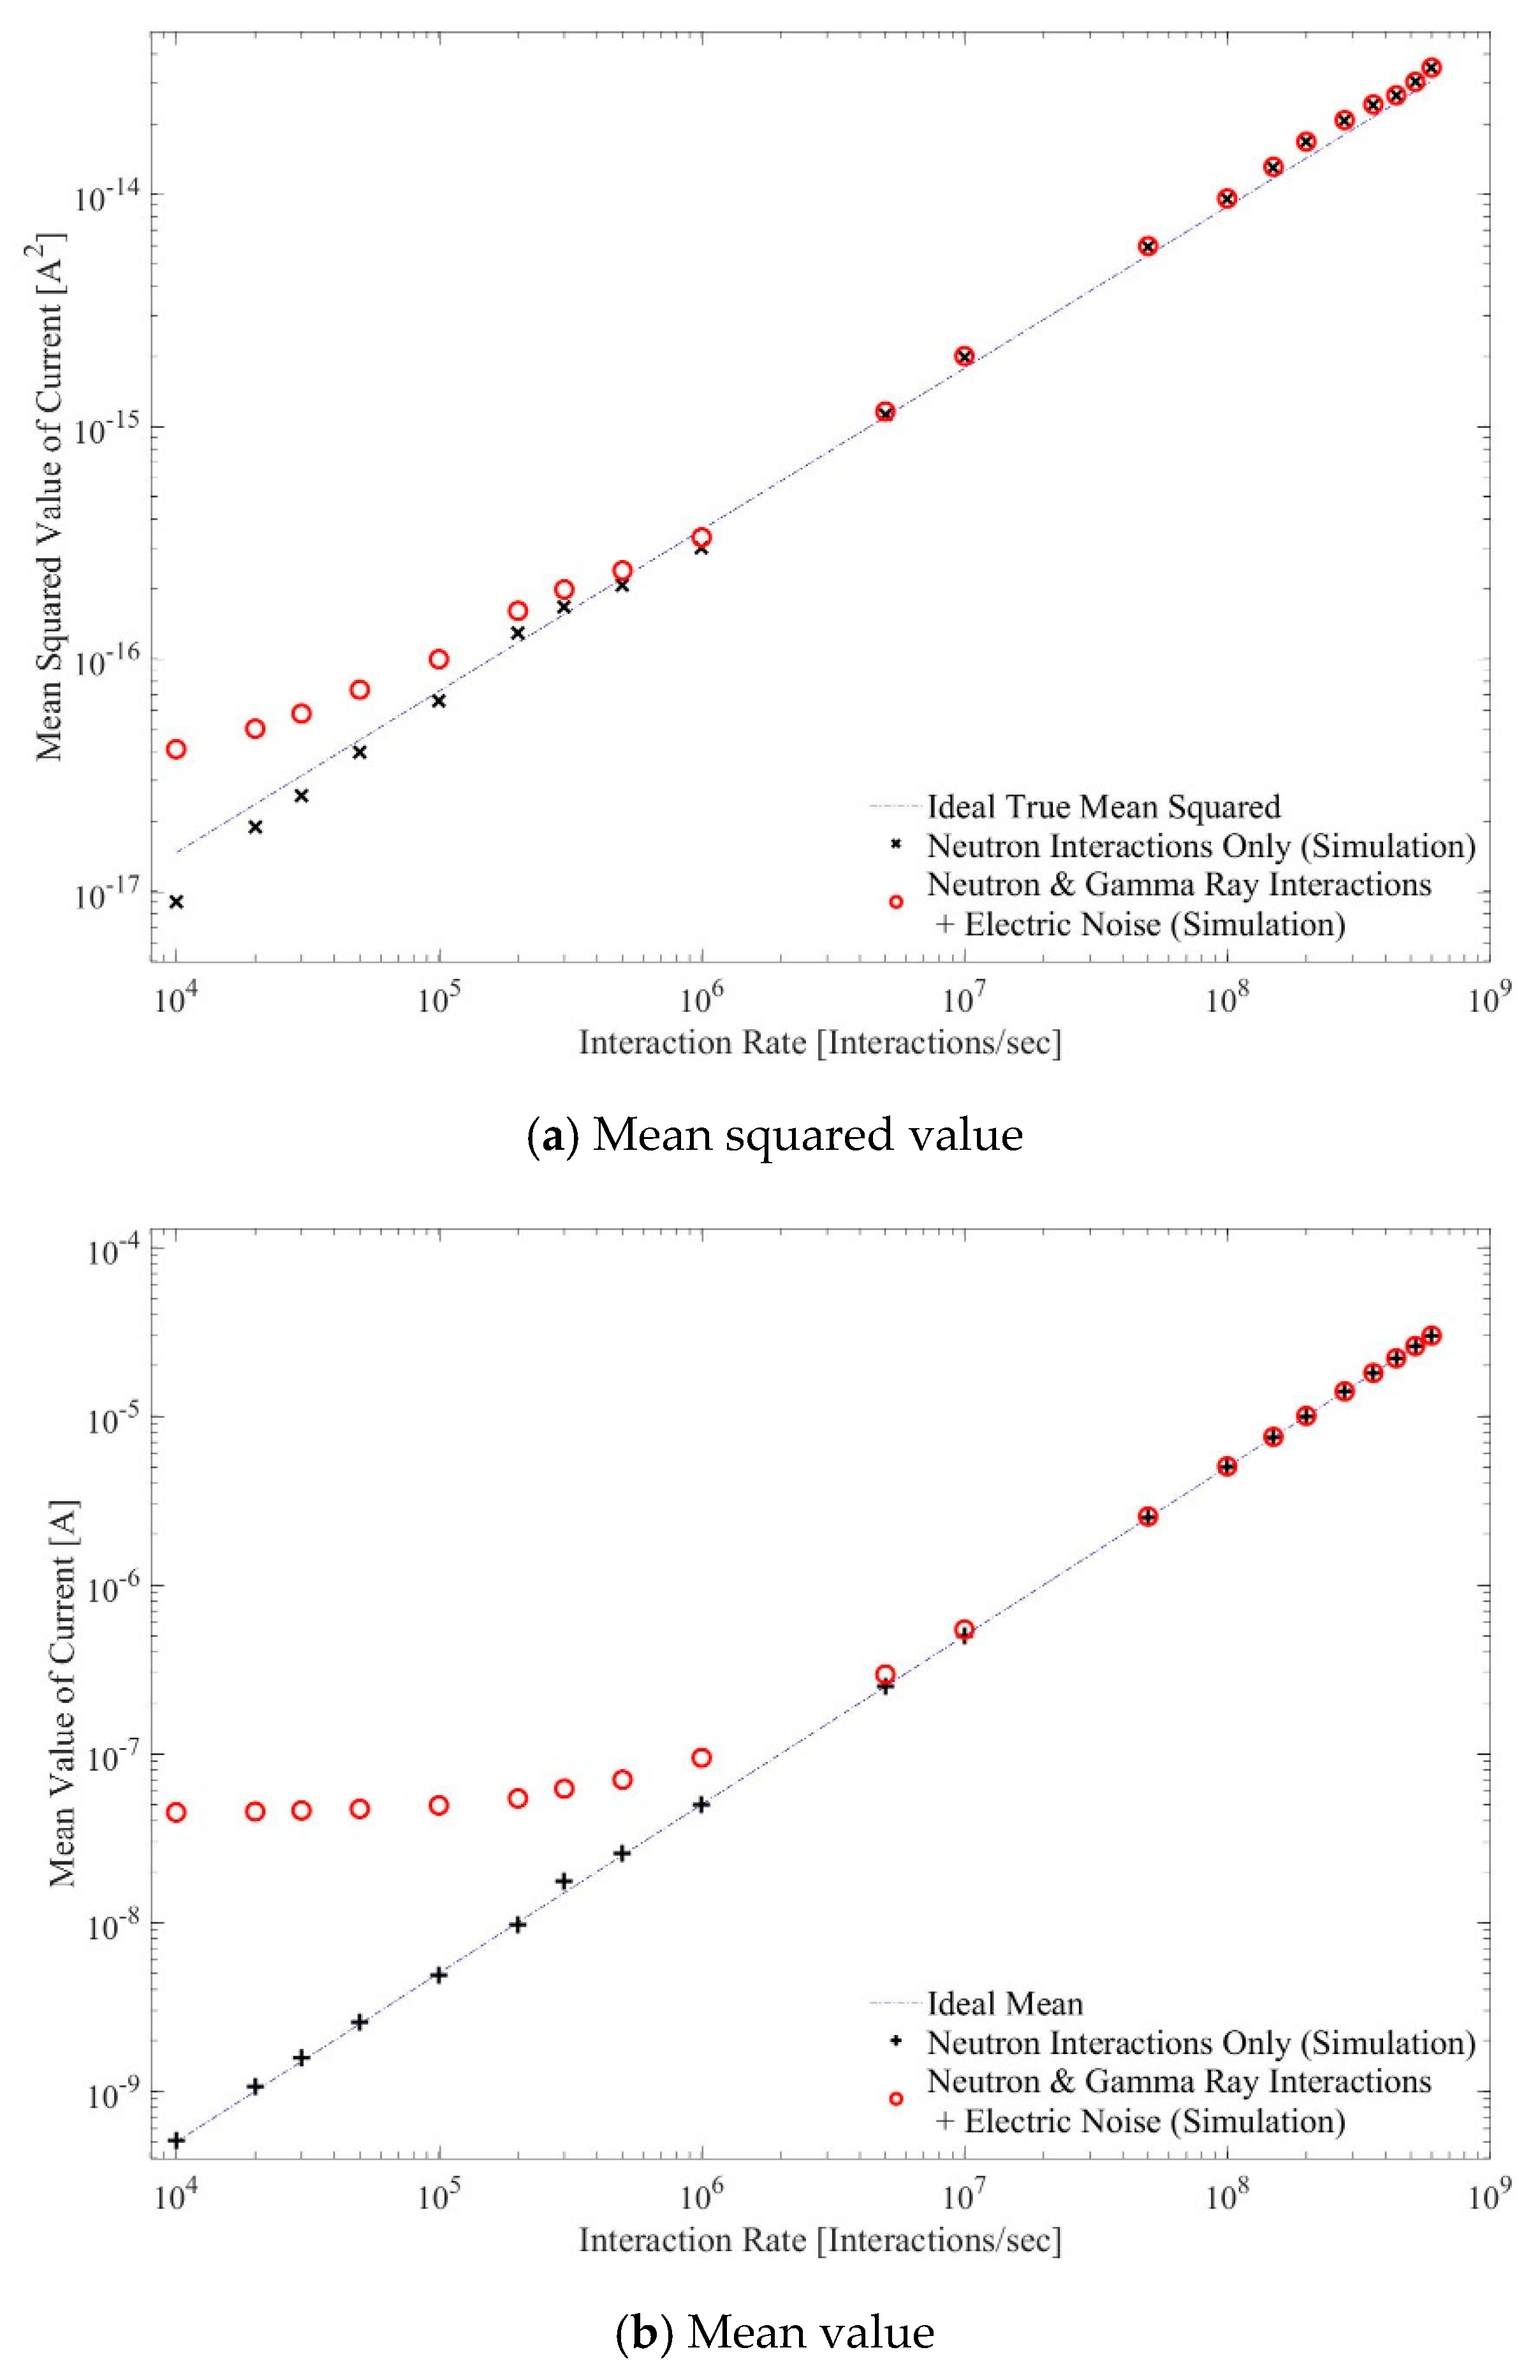
It can be seen in
Figure 7a that the mean squared current values at interaction rates higher than 3 × 10
5 [events/sec] are almost the same between the detector current signals with and without gamma ray interactions and electric noise. Although the elements of gamma ray interactions and electric noise are dominant when the rates are lower than 1 × 10
5 [events/sec]. Therefore, the reactor power can be reliably estimated through MSV calculation at levels corresponding to the interaction rates higher than 3 × 10
5 [events/sec.]. The simulated values of the MSV which are only by neutron interactions, are smaller than expected at interaction rates lower than 2 × 10
4 [events/sec] because the pulses are not adequately overlapped at the range of rates. Pulses are considered sufficiently overlapped when the product of pulse rate and pulse width exceeds one.
On the other hand,
Figure 7b shows that the mean values of current at interaction rates higher than 1 × 10
7 [events/sec] are also almost the same between the detector current signals with and without including gamma ray interactions and electric noise. Elements of the gamma ray interactions and electric noise are dominant when the rates are lower than 1 × 10
6 [events/sec]. Therefore, the reactor power can be estimated reliably by mean of current calculation at levels corresponding to the interaction rates higher than 1 × 10
7 [events/sec.]. The RMSE values for each calculation of Mean, MSV and Average MSV for both neutron only interaction and neutron plus gamma ray with noise is given in
Table 3.
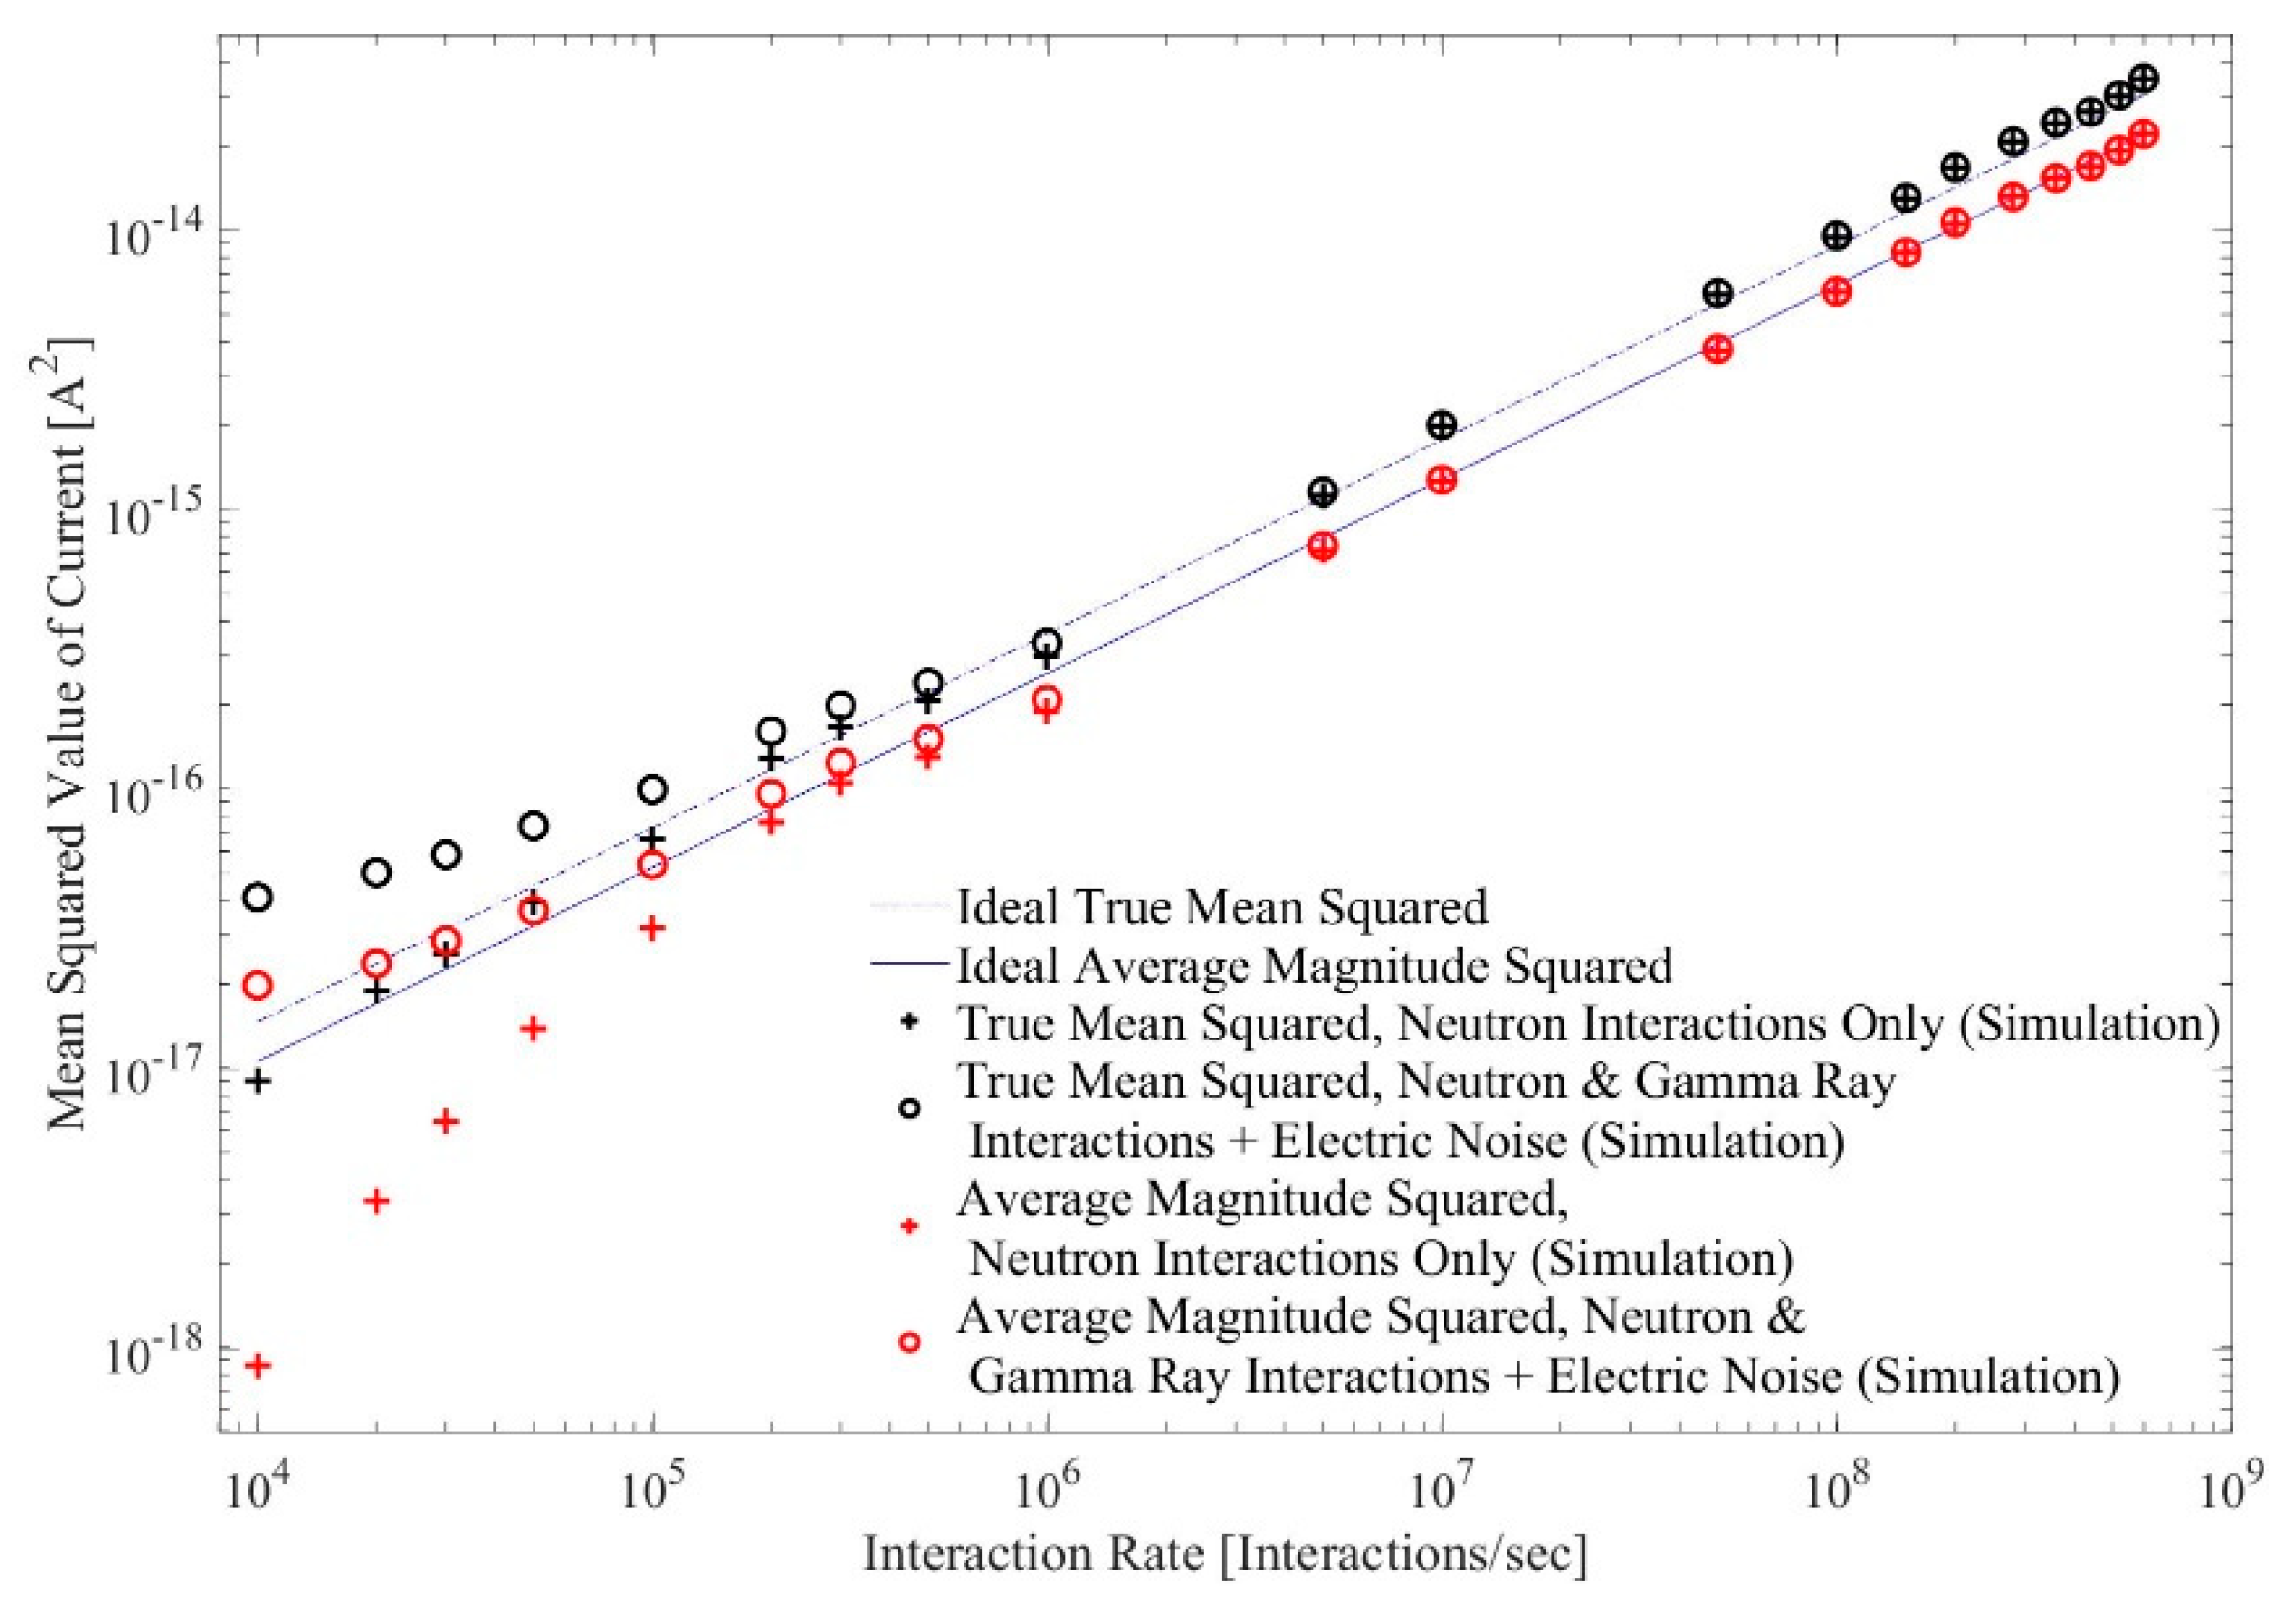
The comparison between true mean squared values and the averaged magnitude squared values is given in
Figure 8. For neutron interaction rates over 5 × 10
5 [events/sec.], the average magnitude squared values by neutron interactions only are about 63.5 % of the true mean squared values, and the ratio decreases sharply when the neutron interaction rate is lower than 1 × 10
5 [events/sec]. Therefore, the use of digital ENFMS in calculating the true mean squared values can increase the effective range of signal linearity by one decade compared to analog ENFMS which calculates the averaged magnitude squared values.
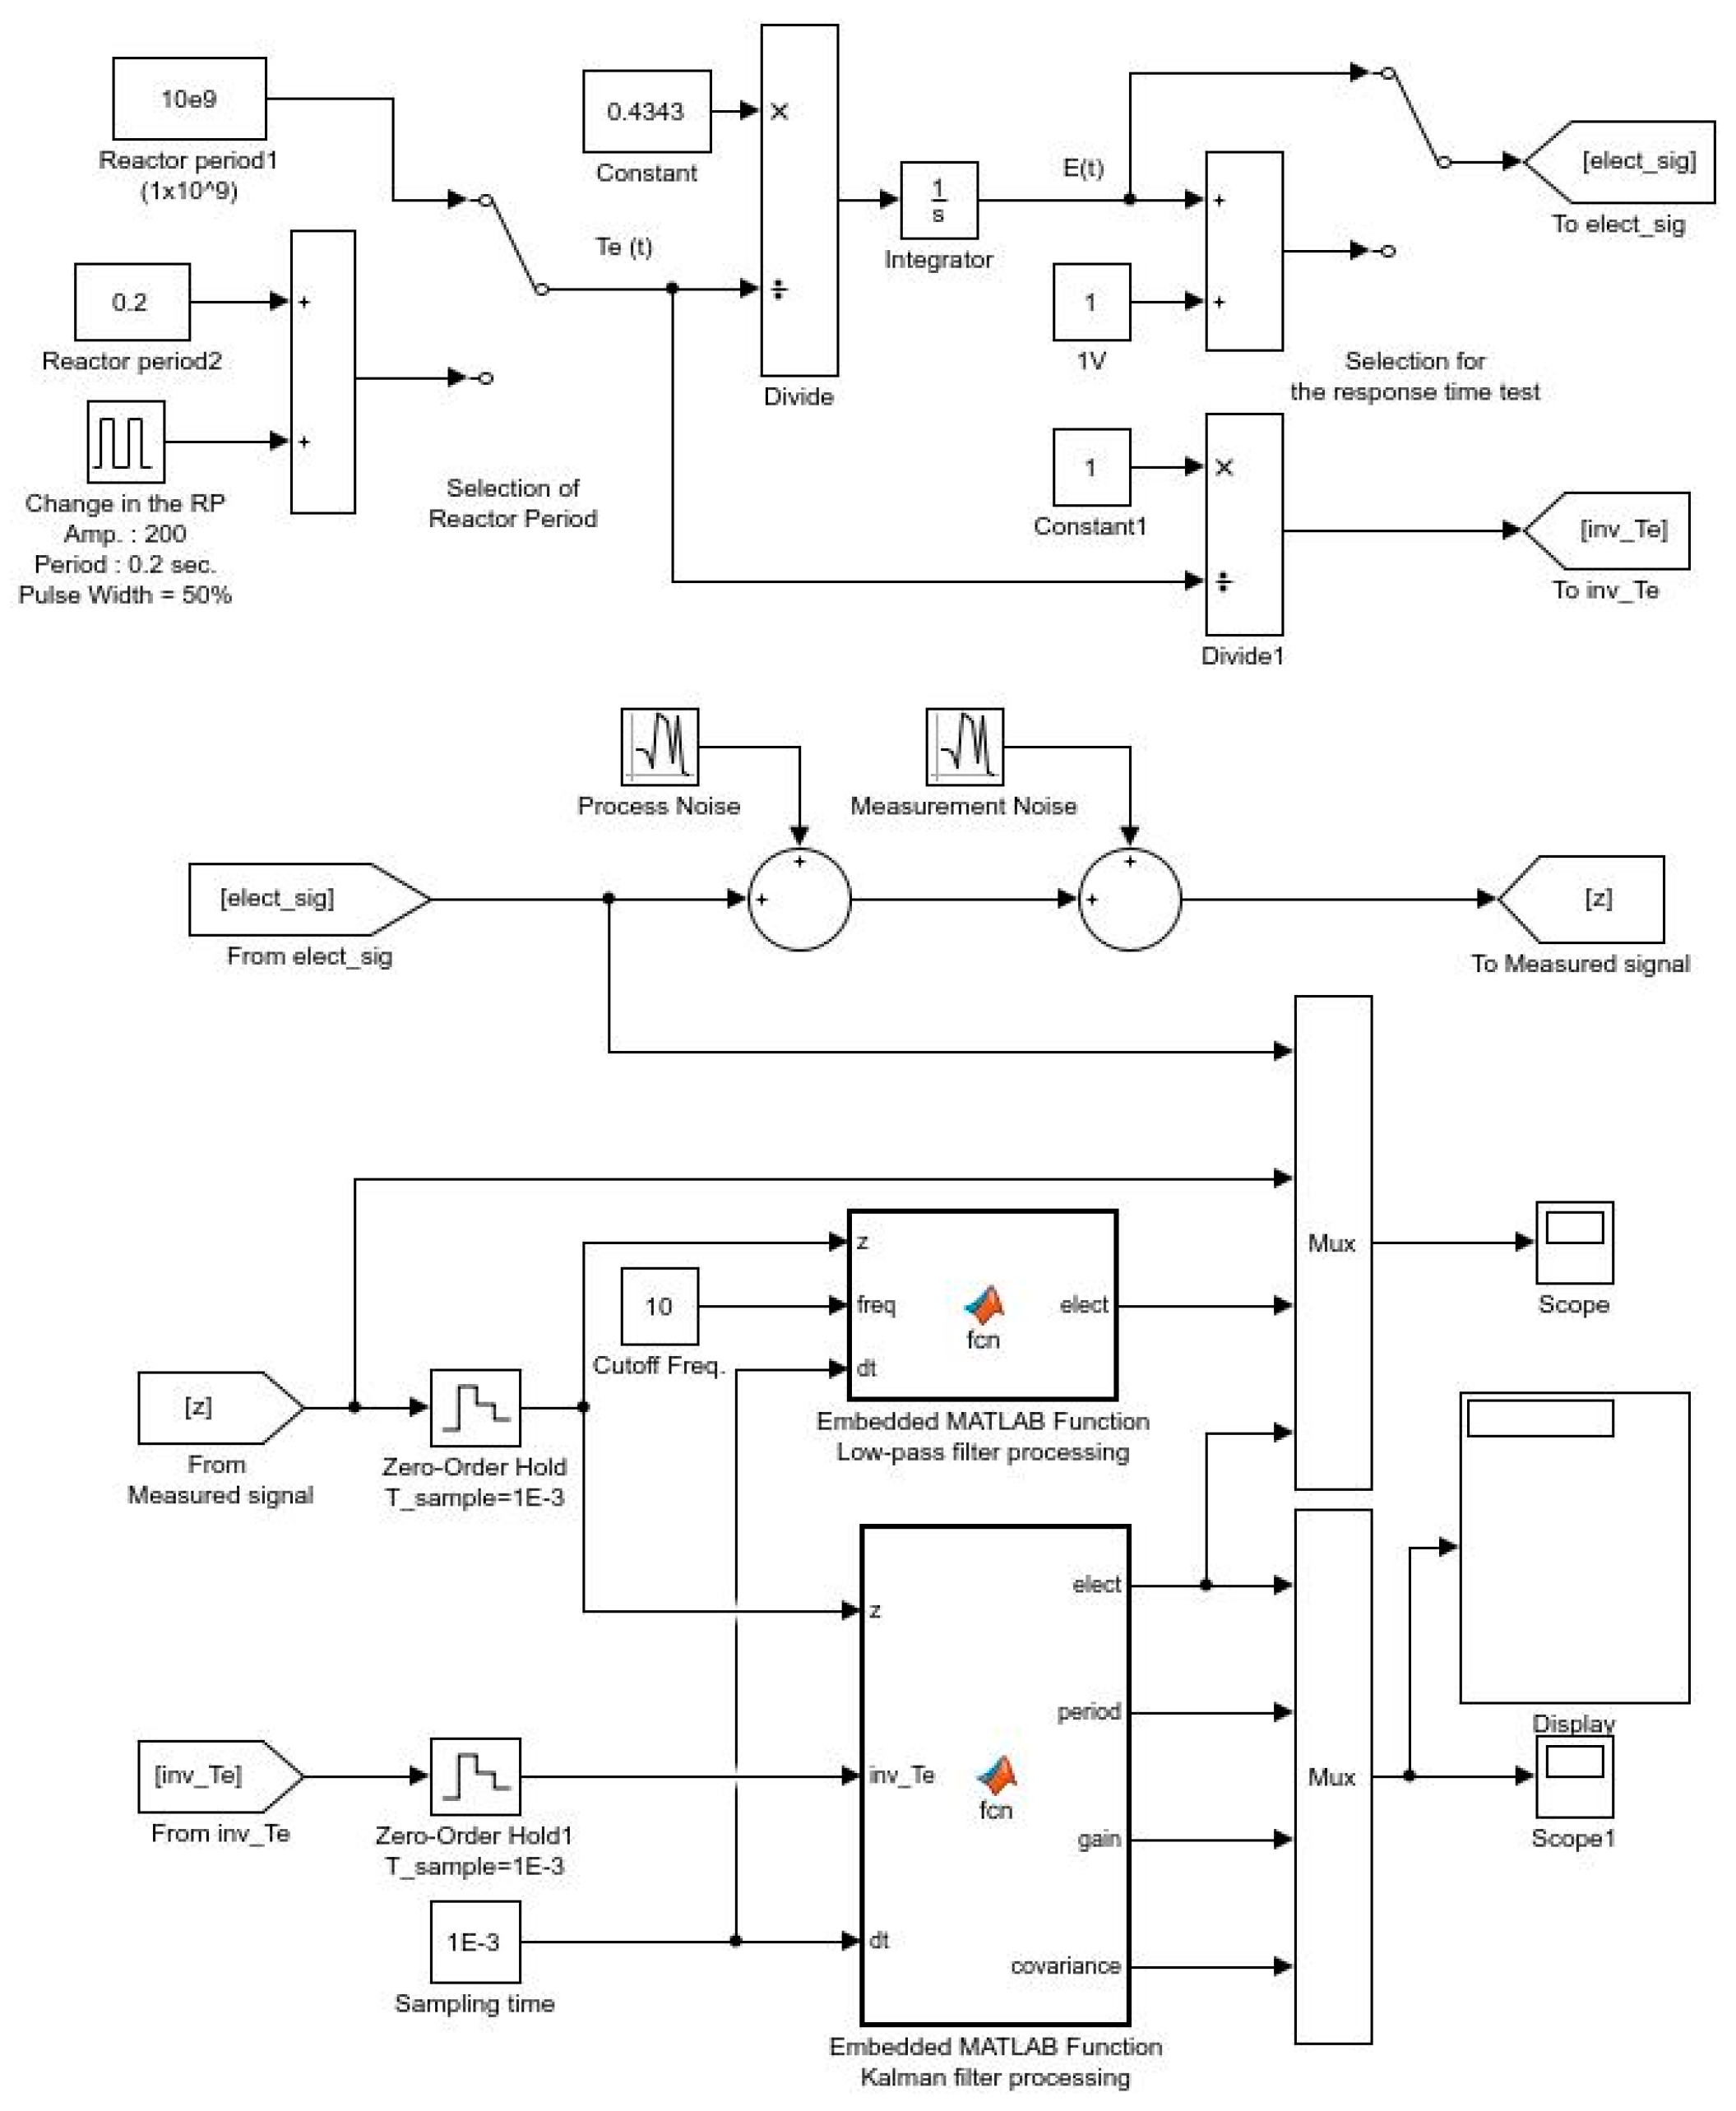
3.3. Application of the Kalman Filtering
Simulations were performed to evaluate the performance in terms of noise rejection and response time for the EKF to estimate the reactor power when measurement data of the reactor power and the reactor period are assumed to be available. The simulation model composed of several function blocks is given in
Figure 9.
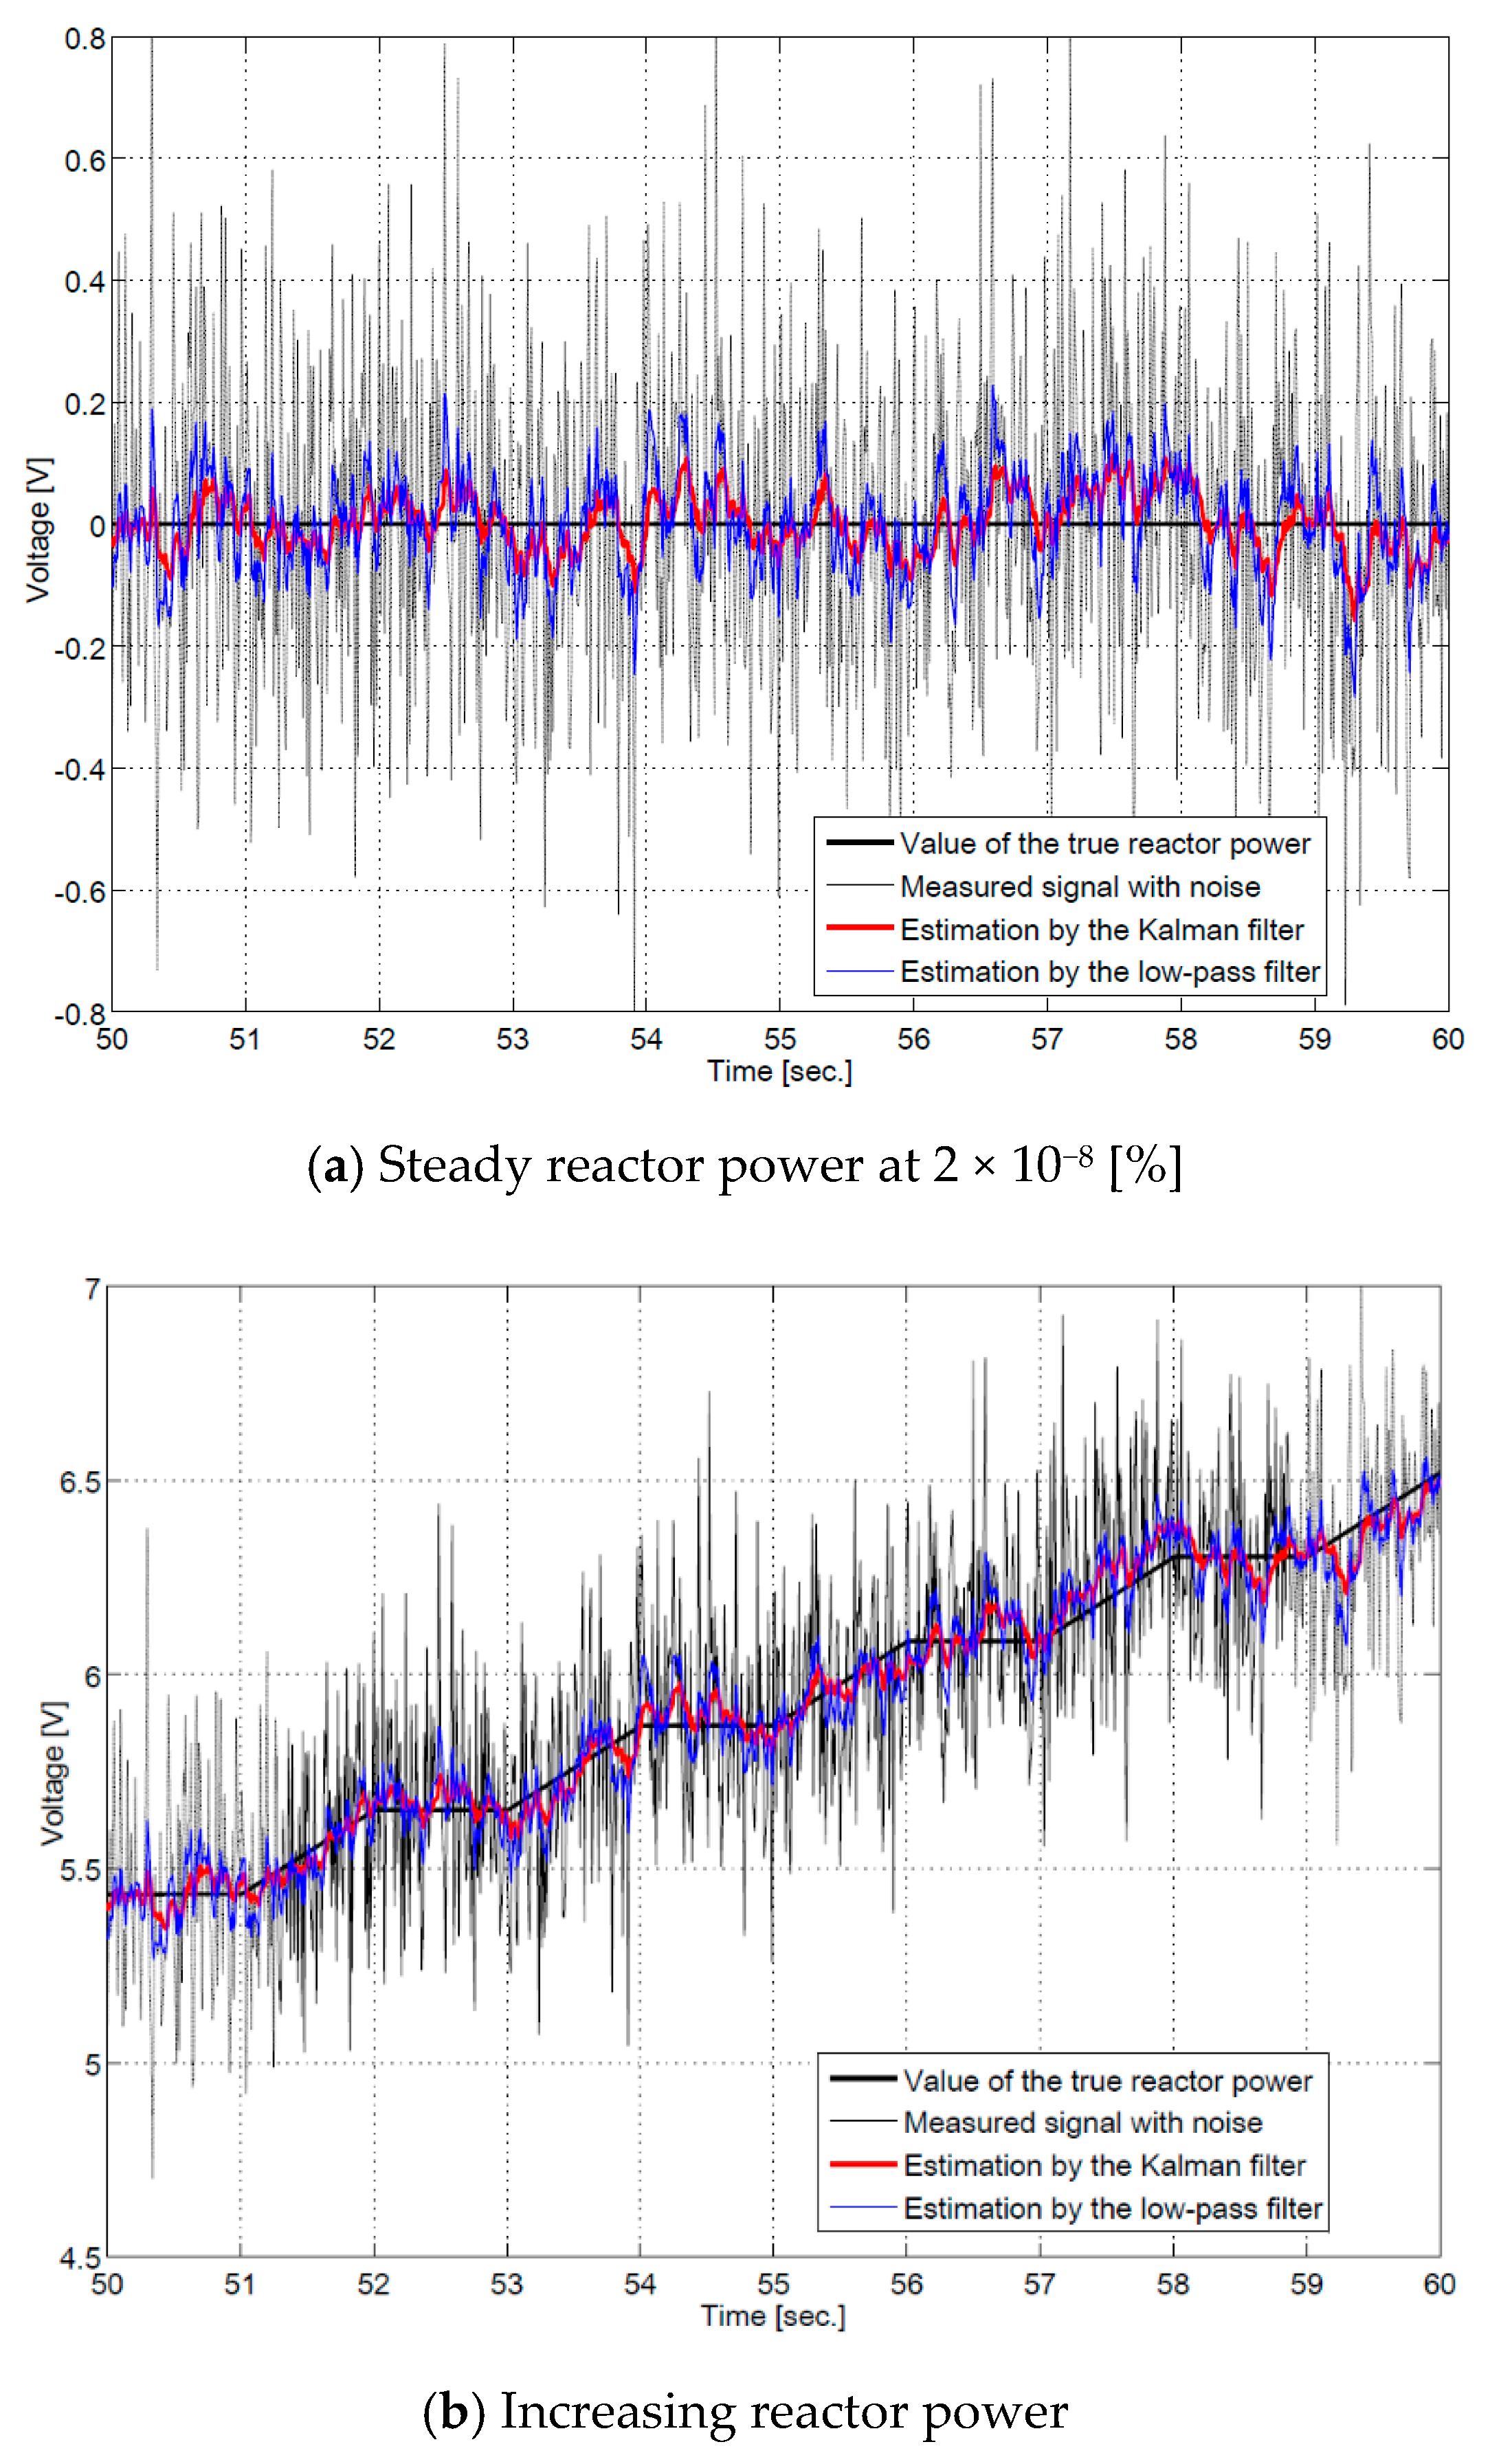
The process model implements the relationship between reactor period and logarithmic reactor power as defined in Equation (32). Measurement data of the reactor power is perturbed by process and measurement noises which are assumed as gaussian random numbers with zero means and variances of 0.005 [V2] and 0.057 [V2] respectively. But the measurement data of reactor power is assumed to be free of any external noise for simplicity. The EKF algorithm is implemented in the embedded MATLAB function block.
Simulation results in
Figure 10a show the estimates through EKF and discrete low-pass filter when the reactor power is steady at 2 × 10
−8 [%] and a cut-off frequency of 30 [Hz] for the low-pass filter. On the other hand, simulation results with increasing reactor power due to continuous step changes with a period of 2 [sec.] and duty cycle of 50% between 0.2 to 200.2 [sec] is in
Figure 10b.
The comparative REMS for reactor power estimation when using extended Kalman filter and discrete low pass filter (with cut-off frequencies of 1, 10 & 30) is shown in
Table 4. It showed that the error became lesser as cutoff frequency was zero for steady state but the RMSE jumped to 0.1755, which is much bigger than that of EKF, for increasing reactor power state with the same cutoff frequency. It can be seen that EKF performing steadily with an RMSE of 0.0457 for both steady state and increasing power. The response times of both filters satisfy the system requirements. Therefore, it can be concluded that the application of EKF is beneficial for signal processing of the wide range monitoring instrumentation in order to efficiently reject both signals due to gamma ray interactions and electric noises from the logarithmic reactor power signal. This improved performance in noise rejection can reduce the possibility of unwanted reactor trips and boron dilution alarms.
4. Conclusions
The Ex-core Neutron Flux Monitoring System (ENFMS), which is one of the core systems in a nuclear power plant (NPP), controls the reactor power level and protects the reactor from excessive thermal power. These functions are required to meet relevant nuclear regulations for every type of nuclear reactor: from research reactors to commercial power reactors or fusion reactors. All the ENFMSs operating in Korea, as well as Korean-built ones abroad, are analog-based. Thus, there have been repeated demands for improvements using new digital technologies. As an effort to respond to these demands, this study was performed to review the feasibility of the digitalization of the analog ENFMS currently being used for Advanced Power Reactor 1400 (APR1400) NPPs. As such, the feasibility study aims to answer whether a digitalization of the analog ENFMS is possible; and if so, which strategies and steps must be taken for a successful and effective digitalization.
Based on the literature review, a simplified model of a fission chamber neutron flux detection and instrumentation using the MATLAB software (R2010b) was designed. The accuracy of the model was evaluated by comparing the simulation results of the model with data gathered from tests and plant operations of currently operating ENFMSs. Simulation results showed that the model data was in good agreement with actual data and hence was used to evaluate the performance of the proposed digital ENFMS.
A conceptual design for the digitalization of the ENFMS for APR1400 nuclear power plants is proposed through a combined structure that digitalizes only part of the system. In this design, the detector signal pre-amplification, which needs to process very low signals with high speed and short response time, remains in analog form. However, the reactor power calculation function and other connected signal conditioning and processing functions from pulse shaping to output data and signal generation will be digitalized. Grounded on the technical analysis of currently used digital components and equipment, it is judged that the proposed scheme of the digital ENFMS can satisfy all the functional and performance requirements of the ENFMS. Furthermore, it can provide design flexibility to implement advanced instrumentation algorithms and functions in the ENFMS. Simulation results showed that the true MSV calculated by the digital ENFMS maintained a linear relationship between the real and estimated reactor powers in the wide-range compared to the averaged magnitude squared value calculation of analog ENFMS. It proved that the proposed digital ENFMS has a better performance than the analog ENFMS for the wide-range monitoring instrumentation.
This work also utilized extended Kalman filter (EKF) algorithm to estimate the reactor power and the reactor period from the measurement signals that are contaminated with gamma ray interactions and electric noise. EKF was chosen since it performed better compared to the discrete low-pass filter in reducing the noise.
In conclusion, this study proved that a successful digitalization can be realized which will satisfy all functional and performance requirements of the ENFMS. Furthermore, it will improve the system functions and performances due to application of sophisticated digital signal processing algorithms such as the EKF and true MSV calculation. The designed model can also be used further for various activities including diagnosis on the abnormal operations of the system, training of operators, as well as evaluation of functions and performances of ENFMSs and related instrumentation algorithms.
However, there are key challenging issues for the digitalization of I&C systems in nuclear power plants that require further study. First, a digital I&C system has more connections among its major components and is more complex than the analog system. Second, the digital system is more dependent on software. Third, the overall dependency on computers and software raises the importance of cyber security. Fourth, the complexity and software-dependency introduce the possibility of common cause failure. Finally, the response time of the digital system is inherently longer than that of the analog system.
Author Contributions
Y.B.K., F.P.V.IV and S.B.C. conceptualized, investigated, designed and analyzed the system. Y.B.K and F.P.V.IV prepared the original draft as well as review and editing with supervision and support from K.T.C. All authors discussed and contributed to the final version of the manuscript. All authors have read and agreed to the published version of the manuscript.
Funding
This research was funded by Ministry of Trade, Industry & Energy, Republic of Korea, grant number 20204010600470 and National Research Foundation of Korea (NRF), grant number NRF-2017M3C7A1044816.
Acknowledgments
This work was supported by “Human Resources Program in Energy Technology” of the Korea Institute of Energy Technology Evaluation and Planning (KETEP), granted financial resource from the Ministry of Trade, Industry & Energy, Republic of Korea. (No. 20204010600470). It is also supported in part by the Brain Research Program of the National Research Foundation (NRF), funded by the Korean Government (MSIT) (No. NRF-2017M3C7A1044816).
Conflicts of Interest
The authors declare no conflict of interest.
References
- Warburton, W.; Momayezi, M.; Hubbard-Nelson, B.; Skulski, W. Digital pulse processing: New possibilities in nuclear spectroscopy. Appl. Radiat. Isot. 2000, 53, 913–920. [Google Scholar] [CrossRef]
- Hubbard-Nelson, B.; Momayezi, M.; Warburton, W.K. A module for energy and pulse shape data acquisition. Nucl. Instrum. Methods Phys. Res. Sect. A 1999, 422, 411–416. [Google Scholar] [CrossRef]
- Paepen, J.; Peerani, P.; Schillebeeckx, P.; Tomanin, A.; Wynants, R. Use of a CAEN Digitiser for Nuclear Safeguards and Security Applications with a Scintillator Detector; European Commission: Luxembourg, 2013. [Google Scholar]
- Taggart, M.; Payne, C.; Sellin, P.J. Neutron-gamma discrimination via PSD plastic scintillator and SiPMs. J. Phys. Conf. Ser. 2016, 763, 012007. [Google Scholar] [CrossRef]
- Lescop, B.; Pasdeloup, P.; Falaise, J.; Lefevre, J.; Nguyen, T.; Sudres, C.; Trama, J.-C. Marine: A fast fully digitalized wide range neutron monitor system. In Proceedings of the 2000 IEEE Nuclear Science Symposium. Conference Record (Cat. No.00CH37149), Lyon, France, 15–20 October 2000; Volume 1, pp. 5–86. [Google Scholar]
- Hascik, R. Testing of measuring systems TELEPERM-XS and SUGAN at Bohunice NPP during physical start-up tests commissioning in year 2000. In Proceedings of the International Conference Nuclear Energy in Central Europe 2001, Ljubljana, Slovenia, 10–13 September 2001; pp. 105-1–105-8. [Google Scholar]
- Yuan, C.; Wu, J.; Yin, Z. A digital wide range neutron flux measuring system for HL-2A. Plasma Sci. Technol. 2017, 19, 084004. [Google Scholar] [CrossRef]
- Tai, I.; Hanai, K.; Fukumoto, A.; Endo, Y.; Itoh, T. Digital power range neutron monitoring system. In In Core Instrumentation and Reactor Assessment; Nuclear Energy Agency of the OECD: Cadarache, France, 1989; pp. 175–185. [Google Scholar]
- Joo, S.; Lee, J.B.; Seo, S.M. Calibration of digital wide-range neutron power measurement channel for open-pool type research reactor. Nucl. Eng. Technol. 2018, 50, 203–210. [Google Scholar] [CrossRef]
- Kim, Y.B.; Jeong, K.H.; Yun, J.H.; Kim, S.C. Design Specification for Startup and Control Channel in the Ex-core Neutron Flux Monitoring System, 3N649- IC-DS810-02, Rev. 3. KEPCO E&C (NSSS Division). March 2017. [Google Scholar]
- Aryaeinejad, R.; Hartwell, J.; Spencer, D. Comparison Between Digital and Analog Pulse Shape Discrimination Techniques for Neutron and Gamma Ray Separation. In Proceedings of the IEEE Nuclear Science Symposium Conference Record, Fajardo, Puerto Rico, 23–29 October 2005; Institute of Electrical and Electronics Engineers (IEEE): New York, NY, USA, 2006; Volume 1, pp. 500–504. [Google Scholar]
- Nakhostin, M. Signal Processing for Radiation Detectors; John Wiley & Sons: Hoboken, NJ, USA, 2017. [Google Scholar]
- Nakhostin, M. Recursive Algorithms for Real-Time Digital CR−(RC)n Pulse Shaping. IEEE Trans. Nucl. Sci. 2011, 58, 2378–2381. [Google Scholar] [CrossRef]
- Flaska, M.; Pozzi, S. Pulse-shape discrimination for identification of neutron sources using the BC-501A liquid scintillator. In Proceedings of the 8th Joint International Topical Meeting on Mathematics & Computation and Supercomputing in Nuclear Applications (M&C+ SNA 2007), Monterey, CA, USA, 15–19 April 2007; pp. 15–19. [Google Scholar]
- Mardiyanto, M. Neutron-Gamma Pulse Shape Discrimination with a NE-213 Liquid Scintillator by Using Digital Signal Processing Combined with Similarity Method. At. Indones. 2012, 34, 103–115. [Google Scholar] [CrossRef][Green Version]
- Safari, M.J.; Davani, F.A.; Afarideh, H.; Jamili, S.; Bayat, E. Discrete Fourier Transform Method for Discrimination of Digital Scintillation Pulses in Mixed Neutron-Gamma Fields. IEEE Trans. Nucl. Sci. 2016, 63, 325–332. [Google Scholar] [CrossRef]
- US Department of Energy. U.S. DoE Fundamentals Handbook—Nuclear Physics and Reactor Theory (DOE-HDBK-1019/2-93). US Department of Energy, January 1993. Available online: http://large.stanford.edu/courses/2014/ph241/alnoaimi2/docs/Nuclear-Volume2.pdf (accessed on 21 September 2020).
- Trama, J.-C.; Lescop, B.; Aussignac, P.; Falaise, J.; Lefevre, J.; Nguyen, T.; Pasdeloup, P.; Sudres, C. Advanced digital signal processing technique for neutron flux measurement in a nuclear power plant. In Proceedings of the 2000 IEEE Nuclear Science Symposium. Conference Record (Cat. No.00CH37149), Lyon, France, 15–20 October 2000; Volume 3. [Google Scholar]
- Pongpun, S. A Neutron Measurement System Design for Pulsed Triga Reactor Experiment at Texas A&M University. Ph.D. Thesis, Faculty of Graduate Studies and Research, University of Regina, Regina, SK, Canada, 2016. [Google Scholar]
- International Atomic Energy Agency. IAEA Specification: Equipment and Services for Installation of a Neutron Monitoring Start-Up Safety Channel at the Maria Research Reactor. 13 February 2018. Available online: https://www.ungm.org/UNUser/Documents/DownloadPublicDocument?docId=692710 (accessed on 21 September 2020).
| Publisher’s Note: MDPI stays neutral with regard to jurisdictional claims in published maps and institutional affiliations. |
© 2020 by the authors. Licensee MDPI, Basel, Switzerland. This article is an open access article distributed under the terms and conditions of the Creative Commons Attribution (CC BY) license (http://creativecommons.org/licenses/by/4.0/).


