Abstract
Lighting projects that consider parameters related to circadian light remain rare. Using controlled lighting on both photopic and melanopic levels, this study aims to simplify the design of circadian lighting projects based on traditional photometric parameters and calculations. A real classroom is used to illustrate the behavior of horizontal (visual stimuli) and vertical (circadian contribution) illuminances under different design parameters, such as the varied reflectance of walls, ceiling, and floor; varied spatial distribution curves, including the number and position of luminaires; and across the spectral power distribution of a variety of LEDs. In this work, we seek to clarify and simplify to the greatest possible extent the meaning and scope of various lighting standards while establishing simple protocols. Our results will enable designers to carry out optimized lighting projects from both the photometric and circadian perspectives.
1. Introduction
Most interior lighting projects must comply with a series of requirements imposed by current regulations for various spaces, including levels of illuminance, uniformity, glare, correlated color temperature (CCT), or color rendering index (CRI) [1,2], and nearly always including budgetary concerns and a desire for low energy consumption [3,4]. Recently, there has been an increase in lighting projects that include, as new criteria, temporal variations in the light, both spectrally and in terms of intensity, with which our body is familiar and that regulate the circadian cycles of our biological clocks. Such projects represent the response to the presence of intrinsic photosensitive retinal ganglion cells (ipRGCs) in humans and the nonvisual effects of light [5,6,7,8,9], and there are numerous studies that highlight the substantial influence that variations in the intensity and tone of light have on health, mood, and many other factors related to the tasks performed by individuals who work for long periods of time under artificial light [10,11]. These lighting projects that consider the possible effects of light on people, optimizing them to create the greatest possible well-being in the short-, medium-, or long- term, are termed human-centric lighting (HCL) projects. However, the increasing number of such projects does not correspond to the importance that circadian light should have according to relevant studies, perhaps for several reasons, including the absence of specific clear regulations; manufacturer and market inertia; unacceptable costs; a lack of appropriate and properly characterized products; and a lack of a sufficient number of trained technicians, product promotion managers, or lighting designers.
Biologically, there are two dependent pathways for light in the brain: visual and nonvisual. The well-known visual tasks of rods, S-cones, M-cones, and L-cones have been widely described, however the role of ipRGCs remains under study; their contribution to both functions has been described [12]. Since the discovery of ipRGCs, different action spectra and metrics have been proposed to estimate the potential melanopic contribution of lighting. A phototransduction model was introduced by Rea et al. [13], whose mathematical model was designed to be consistent with data obtained from psychophysics, electrophysiology, and neuroanatomy and with new parameters such as circadian stimuli (CS) and circadian light (CLA). Their model considered a nonlinear neural behavior response in terms of threshold, saturation, and response to light stimulation and was described in several experiments. Light sources containing a high short-wavelength content have been correlated with sleep, mood, and behavior under exposure to a CS ≥ 0.3 in the eye for at least 1 h in the morning [14]. The five equivalent α-opic illuminance approach proposed by Lucas et al. [15] and adopted by the International Commission on Illumination (CIE) employed light measurement methods to quantify the effective irradiance for each of the photoreceptive inputs to the visual system independently [16]. Recently, the CIE adopted the previously defined melanopic equivalent daylight (D65) illuminance, EDI, which reflects the Deutsches Institut für Normung (DIN) standards [17] and is designed to facilitate calculation. This parameter is defined as a light source-type D65 which employs photopic illuminance to provide the same melanopic irradiance as a light source with spectral power distribution (SPD) and photopic illuminance . However, the CIE S 026/E:2018 standard includes information concerning the effects of age and field of view (FOV) when quantifying retinal photoreceptor stimulation for ipRGC-influenced responses to light (IIL responses). These effects are related to SPD, spatial distribution in a room (light in the upper hemisphere of the FOV is more effective), and temporal distribution or photoperiod (dynamic light; the right light at the right time) [18]. The third proposal, the WELL Building Standard, offers lighting guidelines to provide appropriate photopic and scotopic light levels, minimize disruption to the body’s circadian system, and support good sleep quality. Feature 54: Circadian lighting design recommends as an approximation a parameter known as equivalent melanopic lux (EML), which is one of the five α-opic illuminance outputs used as criteria for “circadian lighting design”, with reference to the equi-energy illuminant instead of D65 [19].
Broadly, visual function is widely studied with common illumination systems. The emergence of light-emitting diode (LED) systems and screen devices that are widely used represents a revolution in environmental conditions. LEDs have been used as replacements for other traditional lamps, such as incandescent, fluorescent, or high-intensity discharge bulbs. The CCT, CRI, Fidelity Index (Rf), Relative Gamut Index (Rg), Local Chroma Shift (Rcs,hj(%)), and Local Color Fidelity (Rf,hj) are parameters used to quantify different objective aspects of color rendition, including average color fidelity and gamut area, as well as 16 values (j from 1 to 16) each for hue-specific chroma shift, hue shift, and color fidelity in lighting devices [20,21]. Recently, several measuring experimental setups have been described for standardizing lighting experiments given the variability in the lighting results [22,23,24]; in addition, scholars have discussed the complexity of lighting design, described potential effects that should be considered by researchers [25], and reported the physiological and seasonal changes that can occur [10,26]. To improve both visual and nonvisual effects in lighting projects, it seems that SPD optimization is required.
Standards (CIE) and recommended practices (WELL) or the recent UL DG 2448022 (which is not a consensus (ANSI) document) [27] for lighting design have been developed and will play an important role in architectural projects, scientific studies, and understanding human behavior, although these methodological suggestions should be treated with caution and only standards should be recommended. It is important to be able to avail oneself of metrics and other guidance when designing projects and evaluating project performance, both with respect to visual and nonvisual effects. In this paper, we use different models to investigate the spectral optimization of LED sources in terms of SPD at corneal-level light exposure and to compare these results with those of other metrics. The research is conducted using a simple protocol that should enable even novice designers to develop lighting projects using the basic parameters related to the visual path and performance (present in current lighting standards) and the new parameters (non-visual path) referenced in recommendations based on the WELL, CIE, or Rea et al. models, all of which are normally based on irradiance (or melanopic illuminance) in the plane of the pupil of the eye. The novelty of the paper is the proposed method, in which both photopic and melanopic contributions can be easily quantified and interrelated between current metrics, applying it to a group of commercial LEDs and a lighting project. In this initial approximation, it is assumed that the materials of the luminaires and walls of the rooms do not modify the SPD of the vertical illumination that reaches the corneal plane.
2. Photometric and Melanopic Relationships among Different Standards
2.1. Theoretical Considerations
In this section, basic expressions required to develop illumination projects, considering both the photopic and melanopic pathways, are clearly and briefly introduced. The method that we propose is calculated from the traditional relationship between radiometric and photometric magnitudes and from the current standards as follows:
To establish a full analogy between photopic and melanopic components, must be defined. The factor is well defined by the normalizations imposed by the different standards.
Equivalent melanopic lux (EML) is defined by the WELL standard [19] with reference to the equi-energy illuminant (E) and can be calculated as follows:
where to the equal-energy illuminant.
For any source, in terms of melanopic parameters, the EML is defined as follows:
With .
In addition, EML’s relation to photometric illuminance is as follows:
In accordance with EDI as defined by the CIE standard [16], normalization is proposed with the melanopic illuminance provided by the standard illuminant D65 (daylight CCT = 6500 K). A light-source type D65 furnishing photopic illuminance to provide the same melanopic illuminance can be calculated.
If the photometric quantity is defined by , the same melanopic for light source D65 can be described in terms of equality as follows:
For any source:
In addition, EML’s relation with photometric illuminance can be deduced as follows:
Using these conversion factors and photopic values of illuminance, transformations from one melanopic metric to another are easily calculated:
Similarly, Rea et al. [13,28] mathematically define the modelled spectral sensitivity of the human circadian system by the circadian light (CLA) expression in terms of the spectrally weighted lux per unit area. In this model, all known photoreceptors contribute to the spectral sensitivity of the circadian system [29]. There is a sudden transition in the modelled spectral efficiency at 497 nm. The CLA efficiency at shorter wavelengths reflects both ipRGC-melanopsin and S-cone sensitivities, whereas efficiency at longer wavelengths is modelled by the ipRGC-melanopsin spectral sensitivity alone. By definition, 1000 lux of CIE illuminant A equals 1000 lux on the CLA scale and is identified by the subscript “A”, as in Equation (12):
CLA is the circadian light and CS is the circadian stimuli. The constant, 1548 lm/W, sets the normalization of CLA so that 2856 K blackbody radiation at 1000 lux has a CLA value of 1000 lux. SPDλ is the light source spectral irradiance distribution; MCλ is the melanopsin (corrected for crystalline lens transmittance) [30,31]; Sλ is the S-cone fundamental; mpλ is the macular pigment transmittance; Vλ is the photopic luminous efficiency function; V’λ is the scotopic luminous efficiency function; RodSat is the half-saturation constant for bleaching (rods = 6.5 W/m2, k = 0.2616, ab–y = 0.700, and arod = 3.300).
The WELL standard, based on the model developed by Lucas et al. [15], and the CIE model assume equal-energetic and D65 theoretical illuminants, respectively, as references for their calculations. This approach represents one of the main conceptual differences of these proposals from the Rea et al. model, which adopts the A illuminant as its standard. Another important difference is the discrepancy in the circadian spectral sensitivity of the retinal ganglion cells; while the CIE model is based on the spectral response of the photopigments in the ipRGC, cone, and rod photoreceptors, the CS model is based on the suppression of the hormone melatonin. Considering all the proposed models as valid, it is necessary to determine the congruencies among these theories to simplify matters for designers and architects.
2.2. Radiometric and Photometric Characterization of LEDs
In this study, 39 commercial light-emitting diodes (LEDs) from NICHIA Corp. (Tokushima, Japan); Bridgelux, Inc. (Fremont, CA, USA); Open Photonics, Inc. (Orlando, FL, USA); Seoul Semiconductor Co., Ltd. (Gyeonggi, South Korea); and SORAA Corporation (Fremont, CA, USA) were characterized and analyzed. These lamps have diverse SPDs and different CCTs (from approximately 2200 K to 6700 K) and CRI > 80 (Figure 1). Based on photometric principles, their properties were calculated from their SPDs (Table 1).
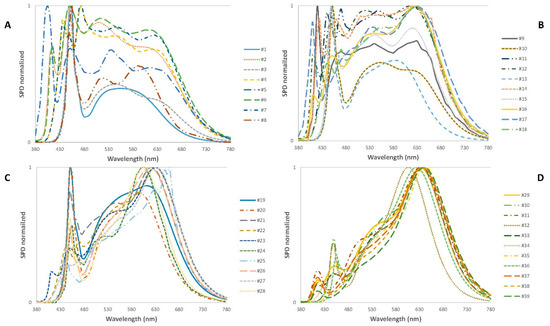
Figure 1.
Spectral power distributions of LEDs divided by Correlated Color Temperature (CCT). (A) >5001 K series, (B) 4001–5000 K series, (C) 3001–4000 K series, and (D) <3000 K series.

Table 1.
Photometric characteristics of the LED sources. Color Rendering Index (CRI), Fidelity Index (Rf), Gamut Index (Rg), Local Chroma Shift (Rcs,h1; average relative change in chroma for colors within 1 of 16 hue angle bins (in this case j = 1)), Local Color Fidelity (Rf,h1; average similarity for color within 1 of 16 hue angle bins (in this case j = 1)).
Based on the spectral distribution data in Figure 1, EDI (according to CIE S026:2018) and EML (according to WELL) for the different lamps at different CCTs were calculated for equal photopic illuminance (100 lux). These results were estimated at eye level. Based on the same spectral distributions, the circadian light (CLA) and circadian stimulus (CS) as described by Rea et al. [14] were also calculated (Table 2). To these calculations, we added calculations for the theoretical A, D65, and equal-energy illuminant, as described by the CIE. Table 2 shows the MAF calculated using Equation (4) from SPD, which is employed to find the melanopic illuminance with the different metrics. Differences among the outcomes occur, first, because of the normalization that is performed in the WELL metric with respect to the equal-energy illuminant, in the CIE metric with respect to the D65 illuminant, and in the study by Rea et al. with respect to the A illuminant. The WELL values are always higher than those described by the CIE, with a factor 1.104 according to Equations (7) and (10). Rea et al. [14] adopted the function described in Equation (12); its discontinuity is found in Table 2 due to the differences in the definition of luminous efficiency in warm or cool lamps (part of the luminous efficiency has a negative contribution), where the circadian values that correspond to LEDs #16 to #21 (CCT from approximately 4100 K to 3500 K) have a lower melanopic efficiency when the calculations are performed with this metric rather than the other two (Figure 2).

Table 2.
Melanopic and circadian values calculated with the CIE (EDI), WELL (EML), and Rea metrics (CLA and CS).
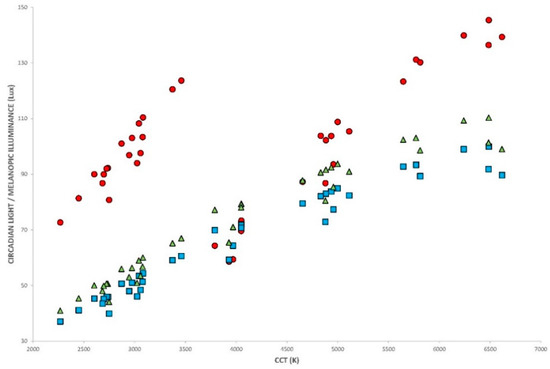
Figure 2.
○ CLA, circadian light; □ CIE (EDI) and Δ WELL(EML), melanopic illuminance as a function of the CCT.
Regarding CCT, it has been determined that for the same CCT and equal photopic illuminance (100 lux), in general terms EDI and EML linearly increase with an increase in CRI (Figure 3). The same behavior can be observed in the Rea metric, particularly at higher CCTs. At lower CCTs, it is more difficult to determine a fixed rule, perhaps because of the low number of LEDs evaluated with CRI90 and CRI95. These characteristics are often observed. However, each lamp must be analyzed in detail, not only by CCT or CRI but also by its SPD. The MAF calculated with Equation (4) has a linear relationship with CCT, and it seems that the two well-correlated parameters can be used as references for the properties of the LEDs.
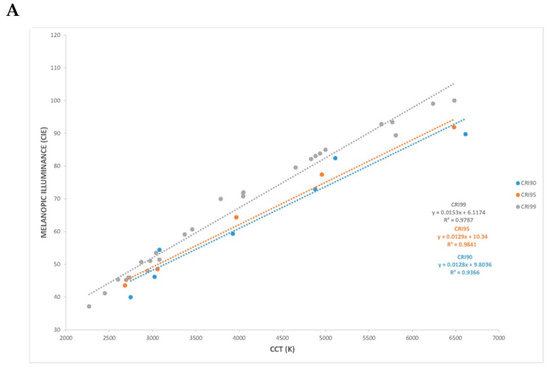
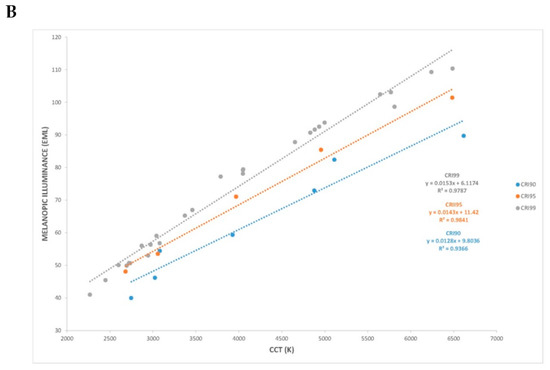
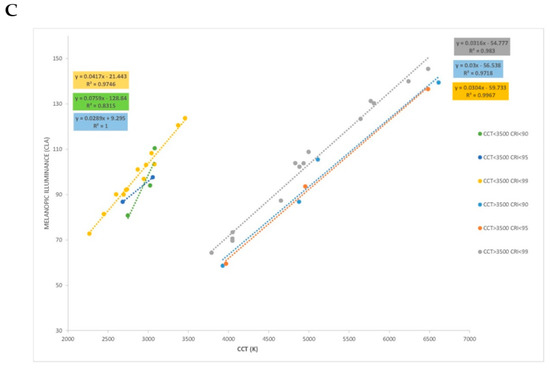
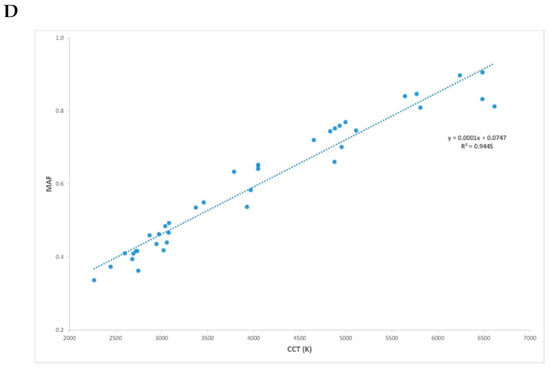
Figure 3.
Melanopic illuminance calculated (for 100 lux photopic) using the CIE (A), WELL (B), and Rea (C) metrics with the LEDs divided by CRI90, CRI95, and CRI99. The MAF parameter (calculated by Equation (4) is a function of the CCT (D).
3. Indoor Lighting Simulations
3.1. Lighting Project
This section describes the detailed parameters used in several lighting simulations visualized using the 3D modelling software program Dialux-EVO. Three virtual rooms measuring 10 m wide × 10 m deep × 2.80 m high were designed, and luminaires with regulation and different spectral distribution curves were chosen for each room: Lambertian (beam spread 120°), intensive (beam spread 54°), and extensive (beam spread 90°), (Figure 4).
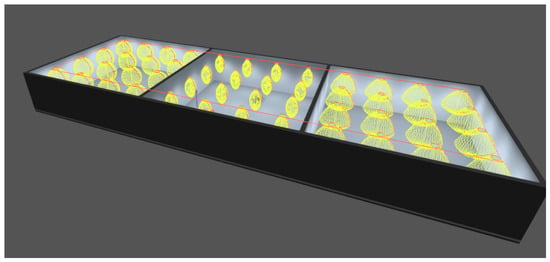
Figure 4.
Designed rooms. Left, Lambertian luminaire (beam spread 120°); middle, intensive luminaire (beam spread 54°); right, extensive luminaire (beam spread 90°).
In each room, 16 luminaires were regularly distributed in the ceiling. Their flux was 3750 lm. These luminaires can be equipped with LEDs with different SPDs and UGRs < 19, using an identical number of LEDs in the same Printed Circuit Board (PCB) format. The inner surface of the rooms was originally assumed to be ideally diffusive, with a reflectance of 80%. These parameters enable us to address the experimental design and analyze the importance of the deviations due to the spatial and spectral distribution curves of the LEDs with the materials that were employed. The effect on the luminous environment due to spectral reflectance of both furniture and surfaces (walls, ceiling, and floor) was analyzed using several specific cases. Illuminances in different planes (76 cm horizontal, 120 cm vertical) were calculated. The results exhibit varying reflectance factors (0%, 30%, 50%, and 80%), and different proportions of walls painted in black or white were analyzed in the same room (80% up and 0% down, 0% up and 80% down). These results reveal the maximum and minimum limits between which the variations in the illuminance are found.
A horizontal measurement grid was positioned 76 cm above the floor to represent a working plane, and a second grid was positioned vertically at the same 120 cm height to represent the corneal plane of the eye. The nine measuring points of the calculation area were chosen to have equidistant spacing, and we established an exclusion zone of 0.5 m wide from the walls to avoid untraveled areas. The adopted calculation parameters and the simulation results are provided in Table 3. All the results are for photopic illuminance. The intensive mode shows higher variations between the maximum and minimum values (horizontal and vertical), followed by the Lambertian and, in the third position, the extensive luminaire. The melanopic illuminance can be easily calculated from these values based on Equations (7), (10) and (12).

Table 3.
Relationship between the horizontal photopic illuminance (lux) in the work plane (76 cm) and the vertical photopic illuminance (lux) in the pupillary plane of the eye (120 cm). The variation in these values with the spatial distribution curves of the luminaires and with the reflectance of the environment is shown.
The preceding results were calculated under the assumption that the observer is static. The same analysis can be performed for a dynamic observer with the ability to rotate his or her corneal plane around a vertical axis (horizontal plane located 120 cm from the floor) (Figure 5). The results are shown in Table 4, where, to simplify the analysis, a wall reflectance of 80% was exclusively selected. These values clearly reflect a real situation in which the subject rotates his or her neck while, for example, performing an activity. Depending on the spatial location of the luminaire and the angle of vision, diverse illumination reaches the corneal plane, and as a consequence the melanopic contribution changes.

Figure 5.
Graphical representation of the angular variation of the vision axis with respect to the vertical axis; vertical illuminance at the eye-level plane (120 cm); wall reflectance 80%.

Table 4.
Relationship between the vertical illuminance at the eye-level plane (120 cm), 80% reflectance, and angular variation in the vertical axis.
In another step, a more realistic scenario has been added. That is, the dynamic situation has been completed with a rotation with respect to a horizontal axis passing through the corneal vertex (120 cm from the floor), simulating a reading position (Figure 6). To avoid excessive and repetitive simulations, two limit values of reflectance in the work plane (76 cm from the floor) are considered (Table 5). The reflectance of the surfaces that is observed by a subject influences the illuminance at the eye level. Not only the reflectance of the wall or ceiling can elevate or diminish the amount of the light that reaches the corneal surface. To perform a more accurate simulation, the time that a subject spends looking in each position could be analyzed with an eye tracker. This approach could be useful to analyze realistic exposition times during working time.

Figure 6.
Graphical representation of the angular variation of the vision axis with respect to the horizontal axis; vertical illuminance at the eye-level plane (120 cm); wall reflectance of 80%.

Table 5.
Relationship between vertical illuminance at the eye-level plane (120 cm) with a wall reflectance of 80% and angular variation with respect to the horizontal axis.
The design of the virtual room was carried out with dimensions and characteristics similar to a workspace or an office; the same procedure can be performed with other sizes and luminaires with different SPD and reflectance factors without a loss of generality.
3.2. Lighting for Elderly Individuals
The age-dependent spectral correction factor for lens transmission k(λ,Y) defined for an observer of age Y is a parameter that should be considered to address nonvisual effects of light in lighting designs in which the age of the user is a key factor [32]. This value is defined as k(λ,32 years) = 1, and the higher that the age is, the lower the value. This correction factor enables us to estimate the real transmission factor of the eye, the lens in particular, and to determine how much light passes through the pupil and reaches the retina. Table 6 shows the calculations for 4 LEDs whose characteristics are provided in Table 1.

Table 6.
Age-dependent correction factor for lens transmission at four ages calculated for four LEDs.
The higher the CCT is, the lower the kmel,trans. This phenomenon combined with the age of the subject creates a wide spectrum of possibilities that must be considered in lighting projects. As described below, Equations (7), (10), and (12) were defined at the corneal plane or entrance of the pupil (EP). Now, they must be modified to determine how much melanopic illuminance reaches the retina:
where , and are the effective values required by their respective standards—for example, illumination levels in different hospital areas, schools, or residential homes—and that should be considered in lighting projects.
3.3. Example of Lighting Project
The transition from the photopic metric based on horizontal illuminance on the work plane to the melanopic metric based on vertical illuminance at the corneal level is illustrated with a particular lighting project, which was selected to clarify the previously described procedure. To optimize the photopic and circadian contributions, three main considerations must be considered.
- Luminaires should have the most extensive spatial distribution curve possible, satisfying the UGR requirements characterized by the current normative for each area.
- Diffusive walls and ceiling with the highest reflectance values.
- LEDs with suitable CCT and CRI, correct price requisites and with the highest MAF possible.
A sample lighting project that accords with the normative with reference to the horizontal illuminance requirements was analyzed, and the vertical illuminance (120 cm from the floor) was calculated at several points. If a value of, for example, 200 EML is required to qualify for WELL certification, the MAF of the lamp could be calculated as follows:
Analogously, to satisfy the CIE requirements and if a value of 200 EDI lux is required, the verification is as follows:
When values are expressed in terms of CLA and CS, the recommended values could be and must be divided by the CLA or CS of the source. To obtain the EV value, the result must be multiplied by 100:
In all cases, to obtain the best combination of parameters three approaches are feasible:
- Substitute the simulated EV value obtained with the illumination program to obtain the minimum allowed MAF that can include LEDs in the luminaires. If the LEDs do not reach this value, another LED with a higher MAF must be selected.
- Modify the design of the luminaire; another luminaire with a more extensive profile should be used because it contributes higher EV.
- Increase the value of the reflectance in the walls and ceiling, which increases the EV.
One should be careful when increasing the flux of the luminaires or their number to obtain a higher EV. This procedure could be flawed because EH will also increase, even at higher values than those required (and not recommended by the normative), and the installation could become energy-inefficient.
A numerical example with a classroom with exclusively artificial indoor lighting and insignificant natural daylight, providing the established minimum flux according to the normative EN 12464-1 (EH = 500 lux, UGR ≤ 19, and CRI ≥ 80), has been simulated [1]. The contribution of light necessary to stimulate the circadian system during daytime hours was stipulated at a minimum of 200 EML, 200 EDI, and 220 CLA, with 0.3 CS.
The values provided in Table 3 are required. The EH values that achieve the normative EN 12464-1 [1] are 500 lux ≤ EH ≤ 600 lux (upper limit calculated with the condition of avoiding exceeding the established medium levels by 20%). Lambertian illumination with a reflectance of 80% was selected to create a photopic lighting design according to the three described metrics. The circadian illuminance at eye level can be calculated as follows.
In the WELL metric, MAF = 164/288 = 0.569. Any LED from #1 to #19 can be selected for installation. Based on our experience, in a classroom a medium CCT (from #14 to #19) and CRI ≥ 80 are most appropriate.
According to the CIE metric, MAF = 181/288 = 0.628. Based on the previous reasoning, any LED from #1 to #18 can be selected.
In the Rea metric, two conditions must be simultaneously satisfied: CLA = 220/288 x 100 = 76 and CS = 0.3/288 x 100 = 0.104. Here, the LEDs that may be selected are #1 to #15 and #23 to #38.
To summarize this discussion, LED #18 can be selected according to the WELL and CIE models but cannot be selected according to Rea, while #23 is adequate according to Rea but does not satisfy the other models. A generally satisfactory solution would be to select LED #15 (CCT 4654K, CRI 97), which would be the best option for photopic norms while also meeting requirements based on the three circadian metrics. Another approach would be to modify the reflectance of the surroundings. A third would be to change the spatial distribution of the luminaires while searching for the best combination of the parameters.
To provide options, we can increase the number of luminaires of the project. We started with an equidistant distribution of 16 luminaires. This number can be changed to 25 adjustable luminaires. The normative limit of EH = 600 lux has been maintained to recalculate the circadian contribution of the installation. In this case, EV = 351 lux, MAFCIE = 0.515, MAFWELL = 0.467; CLA = 62.67 and CS = 0.085, indicating that the best circadian solution for the three metrics is LED #22 (CCT 3460K, CRI 99).
4. Discussion
The health of the visual and non-visual system is critical and has become one of the main concerns of modern society. Lighting designers require a precise and simple tool or guide to estimate eye-level photopic and melanopic illuminance and to determine how such illuminance can be improved in each situation according to the current normative. Illumination is a key factor in the environment but has not been accurately evaluated despite the recommendations that are available according to various measurement methods and equipment [25,33]. Improving the environment and appropriately regulating the amount of light that reaches eye level could have a positive impact on quality of life, well-being, and aging-related concerns.
This objective could be achieved by analyzing illuminance characteristics and regardless of the metric used. Having confirmed that the MAF represents a satisfactory parameter for calculating the melanopic contribution to a fixed photopic illuminance level (or vice versa), we have described several illumination designs to elucidate an appropriate method for quantifying these light types. We further show that measuring light in these terms facilitates predicting light levels, both photopic and melanopic, with different spectral distributions much more reliably than other methods that quantify metric-dependent contributions. To make the parameters more readily understandable, our approach is described based on three common metrics which seem entrenched in the lighting sector and whose interconnection and relationship with photopic illuminance is discussed in the first part of the paper. This approach seems to face more difficulty in extrapolating the CLA and CS parameters because of the intrinsic definition of these values, in particular for LEDs with CCTs ranging from 3500 K to 4100 K, where the differences related to melanopic performance reach their maximum values depending on the metric used.
Illuminations, both horizontal and vertical, critically depend on the dimensions of the room and the reflectance of its walls and furniture [23,34,35]. Room surface reflectance is an important factor in achieving a high illuminance and has even been described as being much more important than the light that arrives through the windows, particularly in the winter months and depending on the orientation of and the distance from the windows to the workstation [34]. Our results confirm those of the cited studies and add the reflectance of the observed surface (in our case, a table) as a parameter to be considered in calculations, whether for photopic or melanopic illuminance. The level of illuminance that arrives at the corneal plane, depending on the spatial distribution curve of the luminaires and the flow emitted by them, was investigated. The simulations using three selected profiles performed in this paper, which include the reflectance of the surfaces, facilitate verifying the importance of such reflectance in circadian lighting applications as a key tool with which to modify and control eye-level illumination [36].
When the melanopic component must be controlled, the SPD of the luminaires should be the parameter to be evaluated [25]. In a first approach, it would be sufficient to know the spectral parameters of the light sources to evaluate the contribution of the circadian component in the lighting project related to circadian rhythms (either WELL, CIE, Rea, or any other requirement imposed according to the objectives). However, in a second step knowledge of the characteristics of the luminaire and the surroundings will be necessary in order to design a complete and accurate lighting project. Comparisons among metrics have been proposed by various organizations [37]. A solution for a minimum circadian effect with optimal CRI requirements has been described using white LED solutions based on RGB LEDs [38,39,40], the combination and optimization of circadian effect and visual lit appearance (brightness or dimness) can be obtained [41], and spaces have been designed that accommodate seasonal changes in illumination at the eye level [34,42]. However, actual lighting projects are designed using the photometric characteristics of the luminaires, with specific SPDs as well as CCT or CRI. An easy procedure must be provided that includes a circadian technical solution. The described analysis enables us to recommend an approach for optimizing well-being lighting projects by considering together the parameters that influence the visual and nonvisual pathways.
5. Conclusions
We propose that illumination designers study real environments with commercial lights and evaluate the light from visual and nonvisual perspectives to determine a method to improve design feedback based on photometric parameters and in accordance with the current normative. Quantitative models have been proposed to evaluate light’s nonvisual effects, resulting in confusing calculations, interpretations, inter-comparisons, and applications. It is important to develop a lighting design method that takes into account visual considerations according to current international standards and that can be easily interpreted and achieved independently of the nonvisual metric used. In this study, we define the parameter MAF, which is SPD-dependent and which facilitates the quantification and comparison of different metrics of circadian effects and visual appearance. These different circadian effects are discussed and contrasted using case studies to establish a pattern that lighting designers can follow in their illumination projects with commercial lights. Our paper introduces a simple protocol that should enable even novice designers to develop lighting projects using basic photopic and melanopic parameters with commercial luminaires and lamps.
The proper method for light measurement is preferably based on the SPD of the light source. The described conditions and control systems are critical to estimate the effects and to construct robust optic models. To study the effect of light on health, a multidisciplinary approach is required. Light and illumination are based on illuminance and color appearance. The spectral action of the photoreceptors with their three cone types and rods and that of the ipRGCs are completely different. The melanopsin function and illuminance equivalent to D65 considered by the CIE, the equal-energetic illuminant considered by WELL, and the CLA or CS parameters of Rea are widely accepted as methods for light measurements at the corneal level in laboratory studies, although Chartered Institution of Building Services Engineers (CIBSE) and the BRE Group concluded in a literature review that the existing recommendations in the WELL Building Standard and DIN SPEC 67600 should be treated with caution. However, a standard for the visual field and environmental illumination does not exist in terms of spectral resolution. The most important contributions of this study are summarized as follows:
- Simple equations are proposed to calculate circadian lighting from values of photopic illuminance. The relationships are and with , which are calculated for a variety of lamps. The Rea proposal should be considered as it has previously been described. These equations can provide quick feedback for lighting manufacturers and designers regarding healthy circadian effects, and the correspondence between both metrics is easily determined.
- An example of our method’s application is provided using numerical simulation data obtained with DIAlux. Various lighting conditions are described, including different types of luminaire, various combinations of room surface reflectance, various orientations of the visual axis, and the observer’s age.
- Three ways are described to obtain the best photopic and melanopic illuminance levels in lighting projects:
- ○
- Substitute the simulated EV value obtained with the illumination program to obtain the minimum allowed MAF, CLA, and CS that can include LEDs in the luminaires. If the LEDs do not reach this value, other LEDs with a higher proportion must be selected.
- ○
- Modify the design of the luminaire; another luminaire with a more extensive profile should be used if it contributes a higher EV.
- ○
- Increase the value of the reflectance in the walls and ceiling, which will increase the EV.
- In this initial approximation, to perform a lighting project MAF, the CLA and CS parameters should be provided in the datasheet of the lamps. However, we have several limitations; the results reported in this study are based on a sample of SPDs, and our results could not be generalized to all LED spectra. In particular, these results should not be expected to have any predictive power for color-mixed LED solutions that employ arrays of narrow-emitting LEDs to generate nominally white light. It is assumed that the materials of the luminaires and walls of the rooms do not modify the SPD of the vertical illumination that reaches the corneal plane. In future research, these limitations should be considered.
Author Contributions
Conceptualization, A.S.-C. and J.A.; data curation, A.S.-C. and J.A.; writing-original draft preparation, A.S.-C. and J.A.; writing-review and editing, A.S.-C. and J.A. All authors have read and agreed to the published version of the manuscript.
Funding
This research was partially funded by Ministerio de Ciencia e Innovación, grant number PID2019-107058RB-I00.
Acknowledgments
We would like to thank Alba Aporta for her collaboration with the simulations during the study.
Conflicts of Interest
The authors declare no conflict of interest.
References
- CEN/TC 169-Light and lighting EN 12464-1:Lighting of Work Places-Part 1: Indoor Work Places; European Committee For Standardization: Brussels, Belgium, 2011.
- Illuminating Engineering Society of North America. The Lighting Handbook, 10th ed.; Illuminating Engineering Society of North America: New York, NY, USA, 2011. [Google Scholar]
- CEN/TC 169-Light and Lighting EN 15193-1: Energy Performance of Buildings-Energy Requirements for Lighting-Part 1: Specifications, Module M9; European Committee For Standardization: Brussels, Belgium, 2017.
- CIBSE SLL Lighting Guide 07: Offices; Chartered Institution of Building Services Engineers (CIBSE): London, UK, 2005.
- Lewy, A.J.; Wehr, T.A.; Goodwin, F.K.; Newsome, D.A.; Markey, S.P. Light suppresses melatonin secretion in humans. Science 1980, 210, 1267–1269. [Google Scholar] [CrossRef]
- Benarroch, E.E. The melanopsin system: Phototransduction, projections, functions, and clinical implications. Neurology 2011, 76, 1422–1427. [Google Scholar] [CrossRef]
- LeGates, T.A.; Fernandez, D.C.; Hattar, S. Light as a central modulator of circadian rhythms, sleep and affect. Nat. Rev. Neurosci. 2014, 15, 443–454. [Google Scholar] [CrossRef]
- Gaggioni, G.; Maquet, P.; Schmidt, C.; Dijk, D.; Vandewalle, G. Neuroimaging, cognition, light and circadian rhythms. Front. Syst. Neurosci. 2014, 8, 126. [Google Scholar] [CrossRef] [PubMed]
- Daneault, V.; Dumont, M.; Masse, E.; Vandewalle, G.; Carrier, J. Light-sensitive brain pathways and aging. J. Physiol. Anthropol. 2016, 35, 1–12. [Google Scholar] [CrossRef] [PubMed]
- de Vries, A.; Souman, J.L.; de Ruyter, B.; Heynderickx, I.; de Kort, Y.A. Lighting up the office: The effect of wall luminance on room appraisal, office workers’ performance, and subjective alertness. Build. Environ. 2018, 142, 534–543. [Google Scholar] [CrossRef]
- Aries, M.B.C.; Aarts, M.P.J.; Van Hoof, J. Daylight and health: A review of the evidence and consequences for the built environment. Light. Res. Technol. 2015, 47, 6–27. [Google Scholar] [CrossRef]
- Schmidt, T.M.; Chen, S.; Hattar, S. Intrinsically photosensitive retinal ganglion cells: Many subtypes, diverse functions. Trends Neurosci. 2011, 34, 572–580. [Google Scholar] [CrossRef]
- Rea, M.S.; Figueiro, M.G.; Bierman, A.; Hamner, R. Modelling the spectral sensitivity of the human circadian system. Light. Res. Technol. 2012, 44, 386–396, Corrigendum in 2012, 44, 516. [Google Scholar] [CrossRef]
- Rea, M.S.; Figueiro, M.G. Light as a circadian stimulus for architectural lighting. Light. Res. Technol. 2018, 50, 497–510. [Google Scholar] [CrossRef]
- Lucas, R.J.; Peirson, S.N.; Berson, D.M.; Brown, T.M.; Cooper, H.M.; Czeisler, C.A.; Figueiro, M.G.; Gamlin, P.D.; Lockley, S.W.; O’Hagan, J.B.; et al. Measuring and using light in the melanopsin age. Trends Neurosci. 2014, 37, 1–9. [Google Scholar] [CrossRef] [PubMed]
- CIE S 026/E:2018 CIE System for Metrology of Optical Radiation for ipRGC-Influenced Responses to Light; CIE Central Bureau: Vienna, Austria, 2018.
- DIN SPEC 5031-100:2015-08. Optical Radiation Physics and Illuminating Engineering-Part 100: Melanopic Effects of Ocular Light on Human Beings-Quantities, Symbols and Action Spectra; Deutsches Institut für Normung (DIN): Berlin, Germany, 2015. [Google Scholar]
- Khademagha, P.; Aries, M.; Rosemann, A.; van Loenen, E.J. Implementing non-image-forming effects of light in the built environment: A review on what we need. Build. Environ. 2016, 108, 263–272. [Google Scholar] [CrossRef]
- WELL Building Standard. LIGHT. Feature 53. Visual Lighting Design; International WELL Building Institute: New York, NY, USA, 2020. [Google Scholar]
- ANSI/IES-TM-30-18 Method for Evaluating Light Source Colour Rendition; IESNA: New York, NY, USA, 2018.
- CIE 224:2017 Colour Fidelity Index for Accurate Scientific Use; CIE Central Bureau: Vienna, Austria, 2017.
- Knoop, M.; Broszio, K.; Diakite, A.; Liedtke, C.; Niedling, M.; Rothert, I.; Rudawski, F.; Weber, N. Methods to describe and measure lighting conditions in experiments on non-image-forming aspects. LEUKOS J. Illum. Eng. Soc. 2019, 15, 163–179. [Google Scholar] [CrossRef]
- Sánchez-Cano, A.; Pérez, O.L.; Aporta, J. Proposal to calculate the circadian component in lighting projects. Opt. Pura Apl. 2019, 52, 1–11. [Google Scholar] [CrossRef]
- Spitschan, M.; Stefani, O.; Blattner, P.; Gronfier, C.; Lockley, S.W.; Lucas, R.J. How to report light exposure in human chronobiology and sleep research experiments. Clocks Sleep 2019, 1, 280–289. [Google Scholar] [CrossRef] [PubMed]
- de Kort, Y.A.W. Tutorial: Theoretical considerations when planning research on human factors in lighting. LEUKOS J. Illum. Eng. Soc. 2019, 15, 85–96. [Google Scholar] [CrossRef]
- Tähkämö, L.; Partonen, T.; Pesonen, A.-K. Systematic review of light exposure impact on human circadian rhythm. Chronobiol. Int. 2019, 36, 151–170. [Google Scholar] [CrossRef]
- UL DG 24480: Design Guideline for Promoting Circadian Entrainment with Light for Day-Active People; Underwriters Laboratories (UL): Northbrook, IL, USA, 2020.
- Rea, M.S.; Figueiro, M.G.; Bullough, J.D.; Bierman, A. A model of phototransduction by the human circadian system. Brain Res. Rev. 2005, 50, 213–228. [Google Scholar] [CrossRef]
- Rea, M. Circadian Stimulus Calculator. Available online: https://www.lrc.rpi.edu/cscalculator/ (accessed on 6 November 2020).
- Rea, M.S.; Figueiro, M.G.; Bierman, A.; Bullough, J.D. Circadian light. J. Circad. Rhythm. 2010, 8, 2. [Google Scholar] [CrossRef]
- Wyszecki, G.; Stiles, W.S. Color Science; Wiley: New York, NY, USA, 1982; Volume 8. [Google Scholar]
- CEN/TR 16791: Quantifying Irradiance for Eye-Mediated Non-Image-Forming Effects of Light in Humans; European Committee for Standardization: Brussels, Belgium, 2017.
- Ochoa, C.E.; Aries, M.B.C.; Hensen, J.L.M. State of the art in lighting simulation for building science: A literature review. J. Build. Perform. Simul. 2012, 5, 209–233. [Google Scholar] [CrossRef]
- Yao, Q.; Cai, W.; Li, M.; Hu, Z.; Xue, P.; Dai, Q. Efficient circadian daylighting: A proposed equation, experimental validation, and the consequent importance of room surface reflectance. Energy Build. 2020, 210, 109784. [Google Scholar] [CrossRef]
- Cai, W.; Yue, J.; Dai, Q.; Hao, L.; Lin, Y.; Shi, W.; Huang, Y.; Wei, M. The impact of room surface reflectance on corneal illuminance and rule-of-thumb equations for circadian lighting design. Build. Environ. 2018, 141, 288–297. [Google Scholar] [CrossRef]
- Dai, Q.; Huang, Y.; Hao, L.; Lin, Y.; Chen, K. Spatial and spectral illumination design for energy-efficient circadian lighting. Build. Environ. 2018, 146, 216–225. [Google Scholar] [CrossRef]
- Lowry, G.D. A comparison of metrics proposed for circadian lighting and the criterion adopted in the WELL Building Standard. In CIBSE Technical Symposium, Stretching the Envelope; London South Bank University: London, UK, 2018. [Google Scholar]
- Dai, Q.; Shan, Q.; Lam, H.; Hao, L.; Lin, Y.; Cui, Z. Circadian-effect engineering of solid-state lighting spectra for beneficial and tunable lighting. Opt. Express 2016, 24, 20049–20059. [Google Scholar] [CrossRef]
- Nie, J.; Chen, Z.; Jiao, F.; Li, C.; Zhan, J.; Chen, Y.; Chen, Y.; Kang, X.; Wang, Y.; Wang, Q. Tunable LED lighting with five channels of RGCWW for high circadian and visual performances. IEEE Photonics J. 2019, 11, 1–12. [Google Scholar] [CrossRef]
- Aderneuer, T.; Stefani, O.; Fernández, O.; Cajochen, C.; Ferrini, R. Circadian tuning with metameric white light: Visual and non-visual aspects. Preprints 2019. [Google Scholar] [CrossRef]
- Dai, Q.; Cai, W.; Shi, W.; Hao, L.; Wei, M. A proposed lighting-design space: Circadian effect versus visual illuminance. Build. Environ. 2017, 122, 287–293. [Google Scholar] [CrossRef]
- Konis, K. A novel circadian daylight metric for building design and evaluation. Build. Environ. 2017, 113, 22–38. [Google Scholar] [CrossRef]
Publisher’s Note: MDPI stays neutral with regard to jurisdictional claims in published maps and institutional affiliations. |
© 2020 by the authors. Licensee MDPI, Basel, Switzerland. This article is an open access article distributed under the terms and conditions of the Creative Commons Attribution (CC BY) license (http://creativecommons.org/licenses/by/4.0/).