Abstract
In this study, the frequency characteristics of series DC arcs are analyzed according to the types of frequency fluctuations caused by inverters in photovoltaic (PV) systems. These frequency fluctuation types used in analysis include centralized frequency fluctuations by three-phase inverter, spread frequency fluctuations by three-phase inverter, and centralized frequency fluctuations by single-phase inverter. To collect arc current data, the frequency fluctuations are generated by inverters in the arc-generating circuit, designed by referring to UL1699B, and the arcs are generated by separating the arc rods of the arc generator. The frequency analysis of the arc current data, collected using an oscilloscope, is conducted using MATLAB. From the results of the frequency characteristics analysis, it is confirmed that the frequencies in the range from 5 to 40 kHz increase after arc generation regardless of the type of frequency fluctuation. In addition, the smaller the current, the greater the increase in frequencies between 5 and 40 kHz after arc generation. Further, in case of arc currents with centralized frequency fluctuations, for larger switching frequencies, the 5 to 40 kHz components increase to a greater extent after arcing.
1. Introduction
Arcing is a phenomenon in which the gas insulation between electrodes is continuously destroyed and discharged by the potential difference generated between the electrodes. The DC arcs generated by DC currents are less likely to be extinguished naturally than ac arcs. This is because there is no zero-crossing point, as in the ac current. Therefore, the risk of accidents, such as fire damage caused by DC arcs, is greater [1,2]. Among the various DC arcs, series DC arcs tend to change the magnitude of the arc current a little in the event of an arc accident, thereby making it difficult to prevent arc faults with conventional circuit breakers, which detect large currents [3,4]. Therefore, a fire accident caused by a series DC arc can be aggravated into a very large fire accident. The series DC arc occurs when the connectors between the conductors are loosely connected or when the conductors are damaged. Series DC arc accidents occur frequently, especially in photovoltaic (PV) systems; the reason for this is attributed to the nature of the PV system, where there is a high possibility of damage to the conductor wire because it is installed in an outdoor environment. Moreover, because PV systems are generally installed as modules, there are many points in the system where arc accidents can occur [5]. Various studies have been conducted to analyze the characteristics of series DC arcs [6,7,8].Arcs were studied via an experimental method that mathematically modeled the arc voltage, i.e., the voltage between the arcing conductors, and arc current, i.e., the current flowing through the arcing conductors [6]. Moreover, the frequency characteristics were analyzed for arcs occurring in PV systems with single-phase and three-phase inverters as loads [7]. Meanwhile, a new arc model equation was proposed through arc analysis according to the input voltage, arc current, and distance between the arc rods [8]. Moreover, techniques for detecting series DC arcs using various characteristics observed after arcing have been proposed [8,9,10,11,12,13,14,15,16,17,18,19,20,21]. Despite these studies on arcs, a frequency analysis of the arc current based on the type of frequency fluctuation generated by the inverter has not been conducted.
In this study, the frequency characteristics of series DC arcs are analyzed according to the types of frequency fluctuations caused by inverters in PV systems. The frequency fluctuation types used in the analysis are centralized frequency fluctuations by three-phase inverters, spread frequency fluctuations by three-phase inverters, and centralized frequency fluctuations by single-phase inverters. To collect arc current data, frequency fluctuation was generated by the inverter in the arc-generating circuit that was designed with reference to UL1699B (Underwriters Laboratories, Northbrook, IL, USA). Further, the arc is generated by separating the arc rods of the arc generator. The currents flowing through the arc rods before and after arcing are saved as data using an oscilloscope, and the frequency analysis of the arc currents for the collected data are conducted using MATLAB (The MathWorks, Natick, MA, USA). From the analysis of the frequency characteristics, it was confirmed that the frequencies between 5 and 40 kHz increased after arc generation regardless of the type of frequency fluctuation. Specifically, increase in the 5 to 20 kHz components was evident. In the case of centralized frequency fluctuations by three-phase inverters, the larger the switching frequency, the greater was the increase in the 5 to 40 kHz band after arcing. In addition, when the switching frequency was 5 and 20 kHz, there was little difference in the increase in the 5 to 40 kHz band after arcing based on the current magnitude. However, when the switching frequency was 10 and 15 kHz, the smaller the current, the larger the 5 to 40 kHz band increase after arcing. In case of spread frequency fluctuations by three-phase inverters, there are no clear trends for the average switching frequencies. However, the smaller the current, the larger the increase in frequency in the 5 to 40 kHz band after arcing. In the case of centralized frequency fluctuations by single-phase inverters, as the switching frequency increased, the 5 to 40 kHz components increased significantly after arc generation. In the case where the frequency fluctuation characteristics were centralized, it was confirmed that the switching frequency and its multiples decreased after arcing. Moreover, when the frequency fluctuation was spread, there was no significant change in the average switching frequency and its multiples. These results can be utilized in the development of the series DC arc detection technique that can occur in the system with various frequency fluctuations.
2. Analysis of Frequency Characteristics of Series DC Arcs According to Type of Frequency Fluctuation Caused by Inverters
This section presents analysis of the frequency characteristics of the arc current according to the type of frequency fluctuation caused by the inverter of the PV system. These arc currents according to the frequency fluctuation of the inverter are defined as shown in Table 1.

Table 1.
Arc currents according to the frequency fluctuation.
To gather arc current data, the arc generator and experimental setup were configured as shown in Figure 1 by referring to UL1699B, which contains regulations for verifications of an arc fault circuit interrupter (AFCI) which is a device for detecting and blocking serial DC arcs in PV systems. [22].
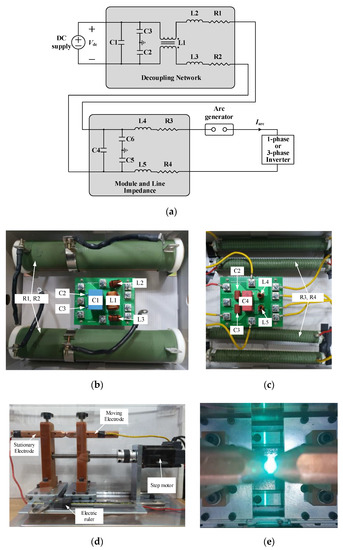
Figure 1.
(a) Arc generation experiment setup; (b) decoupling network; (c) module and line impedances; (d) arc generator; (e) arc generation.
Figure 1a shows the arc generation experiment setup used to obtain the series DC arcs and collect arc current data. In Figure 1a, represents the voltage of the DC supply, and represents the arc current passing through the arc rods. The arc generation experiment setup is composed of a DC supply, decoupling network, module and line impedances, arc generator, and inverter load. Figure 1b–d depicts the decoupling network, module and line impedances, and arc generator used in the arc experiment, respectively. Frequency analysis of series DC arcs in PV systems focuses on high-frequency components rather than DC components [7]. Therefore, in this study, the DC supply was used as the voltage source, not the PV source. The DC supply used in the experiment is KEYSIGHT N8741A (maximum voltage 300 V, maximum current 11 A, maximum power 3.3 Kw, KEYSIGHT TECHNOLOGIES, Santa Rosa, CA, USA). To generate arcs safely and evenly, the step motor shown in Figure 1d is used to separate the rods. Further, the separated distance of the rods is checked with an electric ruler installed parallel to the rod, as in Figure 1d. Figure 1e shows a picture of the arc generated by the generator, and Table 2 summarizes the resistances, capacitances, and inductances used in the decoupling network, as well as module and line impedances.

Table 2.
Parameters used in the decoupling network as well as module and line impedances.
The single-phase and three-phase inverters used in the experiments are composed of an insulated-gate bipolar transistor (IGBT) module (SKM50GB123D, SEMIKRON, Nuremberg, Germany). A resistance and an inductance of 10 Ω and 10 mH are used as the loads for three-phase and single-phase inverter; Table 3 shows the arc generation test conditions for each arc current. To use the concept of switching frequency for the arc current with spread frequency fluctuations, the average switching frequency was calculated by measuring the number of times that the switch was operated during a certain period. In Table 3, the current is represented by the arc current magnitude before arc generation. For reference, the arc current before arcing is the inverter input current, and after arc generation, the inverter input current becomes the arc current.

Table 3.
Arc generation test conditions according to arc currents.
Figure 2 shows the flowchart for the data accumulation and frequency analysis in this work. To collect arc current data, first, a DC voltage is applied to drive an inverter load, as in Figure 1a. Then, the arc rods are separated by the step motor connected to the rods. Then, the arc current data are stored at 250 kHz using the oscilloscope (Tektronix MSO3054, OR, USA) so that the data before and after arcing are included. The current probe used for the current measurement is Tektronix TCP312 (Tektronix, OR, USA) that can measure frequency components from 0 to 100 MHz. Using the saved data, frequency analysis was performed in MATLAB, and the fast Fourier transform (FFT) was used for the analysis.

Figure 2.
Flowchart of data accumulation and frequency analysis in this study.
2.1. Frequency Analysis of Arc Current with Centralized Frequency Fluctuationsby Three-Phase Inverter
For frequency analysis before and after arcing, arc currents are generated under the conditions noted in Table 3. Figure 3 shows an example of frequency analysis for arc current under the various conditions in Table 3.
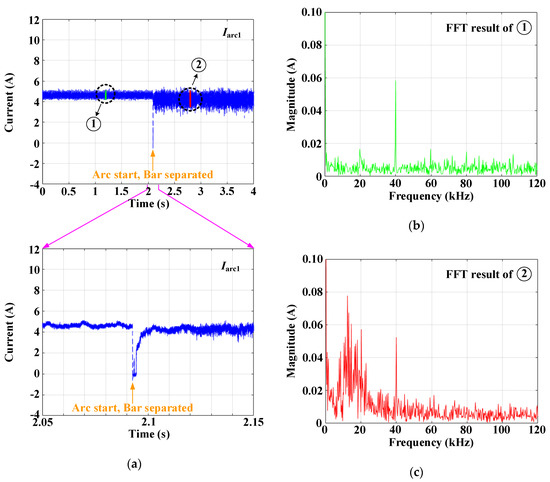
Figure 3.
Current waveform and FFT results of when the magnitude of current is 5 A and switching frequency is 20 kHz: (a) current waveform, (b) FFT result before arcing, and (c) FFT result after arcing.
Figure 3 shows the current waveform and FFT results of when the magnitude of current is 5 A and switching frequency is 20 kHz. As can be seen from the first waveform in Figure 3, when the arc rods are separated, an arc is generated, and the harmonic components are added in . Further, it can be seen that the magnitude of the DC component of the arc current changes a little. Owing to this property, conventional circuit breakers meant for detecting large currents cannot detect such series DC arcs.
The FFT was applied to determine the frequency changes before and after arcing. The current data before arcing are that of the green part marked as ➀; the current data after arcing are that of the red part marked as ➁; the result of FFT using the data in ➀ is shown in Figure 3b. From Figure 3b, it is seen that the switching frequency and its multiples are identified from the FFT of before arcing. In particular, the doubled switching frequency is distinctly observed.
In Figure 3c, it is seen that the multiples of the switching frequency are clearly visible, similar to that before arcing. However, their magnitudes are smaller than those before arcing. Further, the frequencies between 5 and 40 kHz increase after arcing. Particularly, the components in the 5 to 20 kHz band increase significantly. To investigate this frequency change tendency based on the current magnitude and switching frequency, the FFT results after and before arcing are subtracted.
Figure 4 shows the FFT differences after and before arc generation based on the current magnitude and switching frequency in . To reduce deviations in the FFT results, the average of 100 consecutive FFT results is used. In other words, Figure 4 shows the differences between the averages of 100 consecutive FFT results after and before arcing.
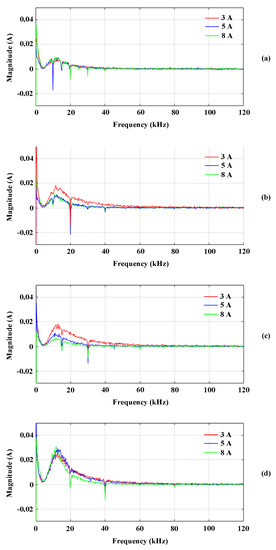
Figure 4.
FFT differences after and before arc generation based on the current magnitude and switching frequency in : (a) 5 kHz, (b) 10 kHz, (c) 15 kHz, and (d) 20 kHz.
It can be seen from Figure 4 that frequencies between 5 and 40 kHz increase after arcing under all conditions. However, the magnitudes of the frequencies in the 5 to 40 kHz band that increase after arcing are different. From Figure 4, it is seen that for 5 and 20 kHz switching frequencies, the magnitudes of the 5 to 40 kHz components that increase after arcing are almost the same, regardless of the current magnitude. In the case where the magnitude of the switching frequency is 10 and 15 kHz, it is confirmed that for smaller currents, the 5 to 40 kHz components increase to a greater extent after arcing. Furthermore, the higher the switching frequency, the larger the increase in the magnitudes of the 5 to 40 kHz components after arcing. The magnitudes of the switching frequency and its multiples are negative values, which indicate that these multiples of the switching frequency decrease after arcing.
To understand the increase in frequencies in the 5 to 40 kHz range based on each examined current condition, the results of Figure 4 in the range of 5 to 40 kHz are integrated. The large integral results indicate that the 5 to 40 kHz band increases significantly after arcing. Figure 5 shows the trend of increment in the 5 to 40 kHz band depending on the switching frequency. In addition, it is seen that the integral result for 5 to 40 kHz frequencies for a switching frequency of 20 kHz is three times greater than that for the switching frequency of 5 kHz.
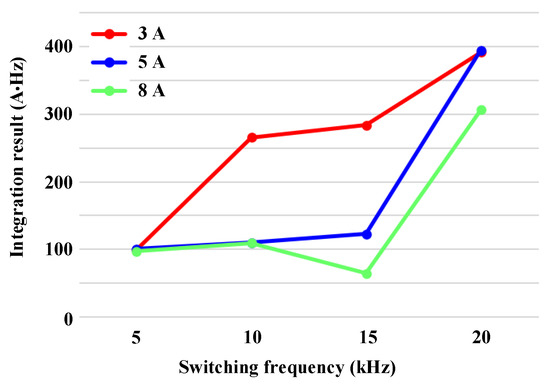
Figure 5.
Integral results from 5 kHz to 40 kHz for Figure 4.
2.2. Frequency Analysis of Arc Current with Spread Frequency Fluctuationsby Three-Phase Inverter
Figure 6 represents the current waveform and FFT results of when the magnitude of current is 5 A and average switching frequency is 20 kHz. As in the case of Figure 3, the arc commences at the same time that the arc rods are separated. In addition, it is seen that the magnitude of the DC component of the arc current changes a little, as in the case of the arc current with centralized frequency fluctuations by the three-phase inverter.
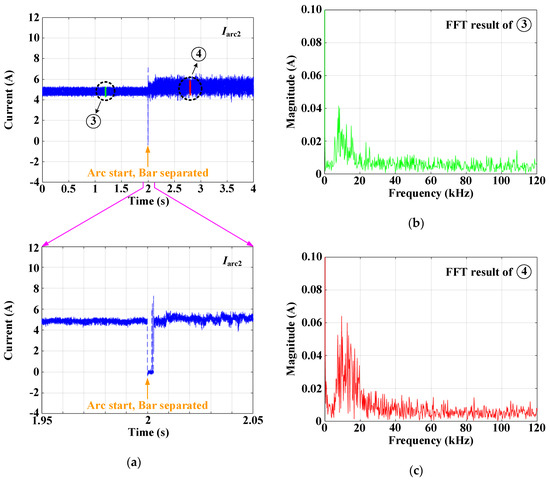
Figure 6.
Current waveform and FFT results of when the magnitude of current is 5 A and average switching frequency is 20 kHz: (a) current waveform, (b) FFT result before arcing, and (c) FFT result after arcing.
The FFT results for the regions➂ and ➃in are shown in Figure 6b,c, respectively. From the FFT results of ➂, it is seen that the frequency distribution is not concentrated but is spread between 5 and 20 kHz because of the spread frequency fluctuationsin . From the FFT results of ➃, which is the result after arcing, it is confirmed that the components in the 5 to 40 kHz band increase after arcing.
Figure 7 shows the FFT differences after and before arc generation based on the current magnitude and average switching frequency in . As in the case of Figure 4, Figure 7 is obtained from the differences between the averages of 100 consecutive FFT results after and before arcing. In addition, when the frequency fluctuation was spread, arcing did not occur at the low current of 3 A, so only the results of 5 and 8 A are shown in Figure 7.
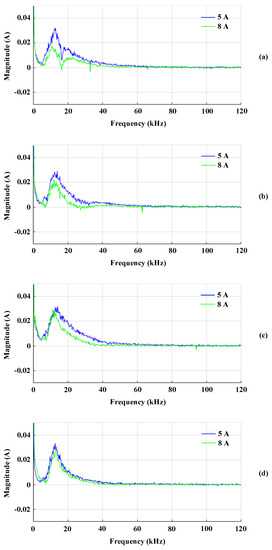
Figure 7.
FFT differences after and before arc generation based on the current magnitude and average switching frequency in : (a) 5 kHz, (b) 10 kHz, (c) 15 kHz, and (d) 20 kHz.
From Figure 7, it is seen that the frequency components that increase after arcing are between 5 and 40 kHz. Particularly, the components in the 5 to 20 kHz band increased significantly. Unlike the case of the arc current with centralized frequency fluctuations by three-phase inverter, there was no clear trend inthe average switching frequency. However, smaller currents caused larger increases in the frequency magnitudes in the 5 to 40 kHz band after arcing. Moreover, in the case of , since the frequency fluctuation was spread, unlike the case of in Figure 4, there was no distinct reduction in the average switching frequency component and its multiples.
Figure 8 shows the integral results from 5 to 40 kHz for Figure 7. Compared to Figure 5, which is the case of the centralized frequency fluctuations by three-phase inverter, no distinct increase is observed in the 5to 40 kHz band for the average switching frequency. However, smaller currents cause larger integral results in the range of 5 to 40 kHz. The difference between the 5 to 40 kHz integral result for 5 and 8 A is greatest when the average switching frequency is 5 kHz, and the difference between the 5 to 40 kHz integral result for 5 and 8 A decreases as the average switching frequency increases.
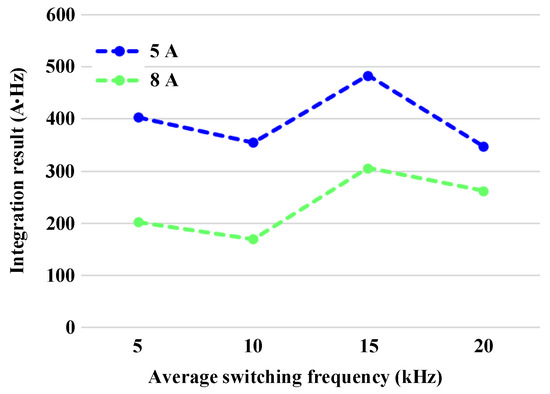
Figure 8.
Integral results from 5 kHz to 40 kHz for Figure 7.
2.3. Frequency Analysis of Arc Current with Centralized Frequency Fluctuationsby Single-Phase Inverter
Figure 9 shows the current waveforms and FFT results of when the magnitude of current is 5 A and switching frequency is 20 kHz. Unlike and , it can be seen from Figure 9a that the 120 Hz component, which is double the fundamental frequency of the inverter load current, exists before the arcing. Further, unlike the three-phase inverter load, it can be seen that arcing occurs after a time delay once the arc rods are separated. In addition, it is seen that the magnitude of the DC component of the arc current changes a little, as in the case of and .
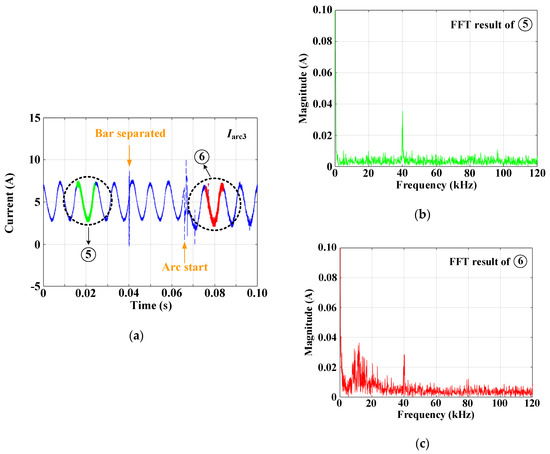
Figure 9.
Current waveform and FFT results of when the magnitude of current is 5 A and switching frequency is 20 kHz: (a) current waveform, (b) FFT result before arcing, and (c) FFT result after arcing.
The FFT result of ➄, which is the instant before arcing, can be seen in Figure 9b. Since the frequency fluctuation has a centralized characteristic, the doubled component of the switching frequency is clearly seen. From the FFT of ⑥in Figure 9c, which is the moment after arcing, multiples of the switching frequency are visible. However, their magnitudes are smaller than those before arcing. Moreover, it is seen that the 5 to 40 kHz components increase compared to before arcing, especially the components in the 5 to 20 kHz band, which increase significantly.
Figure 10 shows the FFT differences after and before arc generation according to the current magnitude and switching frequency in . Figure 10 is obtained using the averages of 10 consecutive FFT results instead of 100 because the arc did not last long in the single-phase inverter load. In addition, when the current was 3 or 8 A, arcing was not adequate, so only the results of 5 A are shown. Figure 10 shows that even in arc currents with centralized frequency fluctuations emitted by the single-phase inverter, the frequency component in the 5 to 40 kHz band increased after arcing. In particular, the components in the 5 to 20 kHz band clearly increased. Further, the higher the switching frequency, the larger the increase in magnitudes of the 5 to 40 kHz components after arcing. Similar to the arc current with centralized frequency fluctuations by three-phase inverters, as in Figure 4, it can be seen from Figure 10 that the switching frequency and its multiples decrease after arcing.
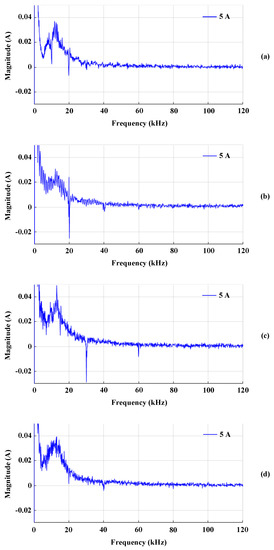
Figure 10.
FFT differences after and before arc generation based on the current magnitude and switching frequency in : (a) 5 kHz, (b) 10 kHz, (c) 15 kHz, and (d) 20 kHz.
Figure 11 shows the integral results from 5 to 40 kHz for Figure 10, similar to that of Figure 5, which is the case of centralized frequency fluctuations by three-phase inverters, with an increasing tendency in the 5 to 40 kHz band. When the switching frequency was 5 and 10 kHz, the values of the integral results were almost the same. However, the integral result increased rapidly at 15 kHz. In addition, the values of the integral results at switching frequencies of 15 and 20 kHz are similar.
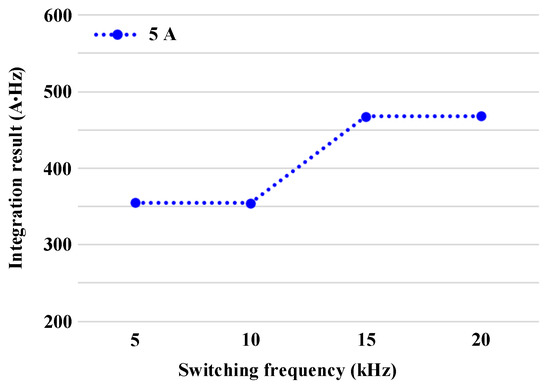
Figure 11.
Integral results from 5 kHz to 40 kHz for Figure 10.
Through frequency analysis of , , and , it was confirmed that the 5 to 40 kHz components commonly increased after arcing. In particular, increase in the 5 to 20 kHz components was noticeable, and in the arc currents with centralized frequency fluctuations by three-phase and single-phase inverters, the larger the switching frequency, the greater the increase in the 5 to 40 kHz component after arcing. In the arc currents for all cases of frequency fluctuations, the smaller the current, the larger the magnitude of the increase in frequency in the 5 to 40 kHz band after arcing. Table 4 summarizes the analysis results of the arc current frequencies for various frequency fluctuations.

Table 4.
Results of analysis of arc current frequencies for various frequency fluctuations.
3. Conclusions
In this study, the frequency characteristics of series DC arcs are analyzed based on the types of frequency fluctuations caused by inverters in PV systems. The frequency fluctuation types used in the analysis are centralized frequency fluctuations by three-phase inverters, spread frequency fluctuations by three-phase inverters, and centralized frequency fluctuations by single-phase inverters. From the frequency analysis, it was confirmed that the frequencies in 5 to 40 kHz increased after arcing in all three types of frequency fluctuation conditions. Specifically, increase in the 5 to 20 kHz components was evident. In the case of centralized frequency fluctuations by three-phase inverters, the larger the switching frequency, the greater the increase in the 5 to 40 kHz band after arcing. In addition, when the switching frequency was 5 and 20 kHz, there was little difference in the increase in the 5 to 40 kHz band after arcing based on the current magnitude. On the other hand, when the switching frequency was 10 and 15 kHz, the smaller the current, the larger the 5 to 40 kHz band increase after arcing. In the case of spread frequency fluctuations by three-phase inverters, there was no clear trend for the average switching frequency. However, the smaller the current, the larger the increase in frequency in the 5 to 40 kHz band after arcing. In the case of centralized frequency fluctuations by single-phase inverters, as the switching frequency increased, the 5 to 40 kHz components increased significantly after arc generation. In the case where the frequency fluctuation characteristics were centralized, it was confirmed that the switching frequency and its multiples decreased after arcing. On the other hand, when the frequency fluctuation was spread, there was no significant change in the average switching frequency and its multiples.
Author Contributions
Data curation, J.-C.K.; formal analysis, J.-C.K. and S.-S.K.; funding acquisition, S.-S.K.; methodology, J.-C.K. and S.-S.K.; project administration, S.-S.K.; resources, S.-S.K.; software, J.-C.K.; supervision, S.-S.K.; validation, J.-C.K.; visualization, J.-C.K.; writing—original draft, J.-C.K. All authors have read and agreed to the published version of the manuscript.
Funding
This research was supported by the National Research Foundation of Korea (NRF) grant funded by the Korean government (MSIT) (No. 2020R1A2C1013413), and funded and conducted under the Competency Development Program for Industry Specialists of the Korean Ministry of Trade, Industry and Energy (MOTIE), operated by Korea Institute for Advancement of Technology (KIAT) (No. P0012453, Next-generation Display Expert Training Project for Innovation Process and Equipment, Materials Engineers).
Conflicts of Interest
The authors declare no conflict of interest.
References
- Gu, J.-C.; Lai, D.-S.; Huang, J.-J.; Yang, M.-T. Design of a DC series arc fault detector for photovoltaic systems protection. In Proceedings of the 2018 IEEE/IAS 54th Industrial and Commercial Power Systems Technical Conference (I&CPS), Niagara Falls, ON, Canada, 7–10 May 2018; Institute of Electrical and Electronics Engineers (IEEE): New York, NY, USA; 2018; pp. 1–5. [Google Scholar]
- Gu, J.-C.; Lai, D.-S.; Yang, M.-T. A new DC series Arc fault detector for household photovoltaic systems. In Proceedings of the 2017 IEEE Power Energy Society General Meeting, Chicago, IL, USA, 16–20 July 2017; pp. 1–5. [Google Scholar] [CrossRef]
- Gu, J.-C.; Lai, D.-S.; Wang, J.-M.; Huang, J.-J.; Yang, M.-T. Design of a DC Series Arc Fault Detector for Photovoltaic System Protection. IEEE Trans. Ind. Appl. 2019, 55, 2464–2471. [Google Scholar] [CrossRef]
- Xiong, Q.; Liu, X.; Feng, X.; Gattozzi, A.; Shi, Y.; Zhu, L.; Ji, S.; Hebner, R. Arc Fault Detection and Localization in Photovoltaic Systems Using Feature Distribution Maps of Parallel Capacitor Currents. IEEE J. Photovolt. 2018, 8, 1090–1097. [Google Scholar] [CrossRef]
- Lu, S.; Phung, B.; Zhang, D. A comprehensive review on DC arc faults and their diagnosis methods in photovoltaic systems. Renew. Sustain. Energy Rev. 2018, 89, 88–98. [Google Scholar] [CrossRef]
- Ammerman, R.F.; Gammon, T.; Sen, P.K.; Nelson, J.P. DC-Arc Models and Incident-Energy Calculations. IEEE Trans. Ind. Appl. 2010, 46, 1810–1819. [Google Scholar] [CrossRef]
- Johnson, J.; Pahl, B.; Luebke, C.J.; Pier, T.; Miller, T.; Strauch, J.; Kuszmaul, S.S.; Bower, W. Photovoltaic DC Arc Fault Detector testing at Sandia National Laboratories. In Proceedings of the 2011 37th IEEE Photovoltaic Specialists Conference, Seattle, WA, USA, 19–24 June 2011; Institute of Electrical and Electronics Engineers (IEEE): New York, NY, USA, 2011; pp. 003614–003619. [Google Scholar]
- Yao, X.; Herrera, L.; Ji, S.; Zou, K.; Wang, J. Characteristic Study and Time-Domain Discrete- Wavelet-Transform Based Hybrid Detection of Series DC Arc Faults. IEEE Trans. Power Electron. 2013, 29, 3103–3115. [Google Scholar] [CrossRef]
- Shekhar, A.; Ramirez-Elizondo, L.; Bandyopadhyay, S.; Mackay, L.; Bauera, P.; Bauer, P. Detection of Series Arcs Using Load Side Voltage Drop for Protection of Low Voltage DC Systems. IEEE Trans. Smart Grid 2017, 9, 6288–6297. [Google Scholar] [CrossRef]
- Dhar, S.; Patnaik, R.K.; Dash, P. Fault Detection and Location of Photovoltaic Based DC Microgrid Using Differential Protection Strategy. IEEE Trans. Smart Grid 2017, 9, 4303–4312. [Google Scholar] [CrossRef]
- Bao, G.; Jiang, R.; Gao, X. Novel Series Arc Fault Detector Using High-Frequency Coupling Analysis and Multi-Indicator Algorithm. IEEE Access 2019, 7, 92161–92170. [Google Scholar] [CrossRef]
- Ahmadi, M.; Samet, H.; Ghanbari, T. A New Method for Detecting Series Arc Fault in Photovoltaic Systems Based on the Blind-Source Separation. IEEE Trans. Ind. Electron. 2020, 67, 5041–5049. [Google Scholar] [CrossRef]
- Ahmadi, M.; Samet, H.; Ghanbari, T. Series Arc Fault Detection in Photovoltaic Systems Based on Signal-to-Noise Ratio Characteristics Using Cross-Correlation Function. IEEE Trans. Ind. Informatics 2019, 16, 3198–3209. [Google Scholar] [CrossRef]
- Xiong, Q.; Feng, X.; Gattozzi, A.L.; Liu, X.; Zheng, L.; Zhu, L.; Ji, S.; Hebner, R.E. Series Arc Fault Detection and Localization in DC Distribution System. IEEE Trans. Instrum. Meas. 2019, 69, 122–134. [Google Scholar] [CrossRef]
- Wang, Z.; Balog, R.S. Arc Fault and Flash Signal Analysis in DC Distribution Systems Using Wavelet Transformation. IEEE Trans. Smart Grid 2015, 6, 1. [Google Scholar] [CrossRef]
- Chae, S.; Park, J.; Oh, S. Series DC Arc Fault Detection Algorithm for DC Microgrids Using Relative Magnitude Comparison. IEEE J. Emerg. Sel. Top. Power Electron. 2016, 4, 1270–1278. [Google Scholar] [CrossRef]
- Chen, S.; Li, X.; Xiong, J. Series Arc Fault Identification for Photovoltaic System Based on Time-Domain and Time-Frequency-Domain Analysis. IEEE J. Photovolt. 2017, 7, 1105–1114. [Google Scholar] [CrossRef]
- Liu, S.; Dong, L.; Liao, X.; Cao, X.; Wang, X.; Wang, B. Application of the Variational Mode Decomposition-Based Time and Time–Frequency Domain Analysis on Series DC Arc Fault Detection of Photovoltaic Arrays. IEEE Access 2019, 7, 126177–126190. [Google Scholar] [CrossRef]
- Wang, Y.; Zhang, F.; Zhang, X.; Zhang, S. Series AC Arc Fault Detection Method Based on Hybrid Time and Frequency Analysis and Fully Connected Neural Network. IEEE Trans. Ind. Inform. 2018, 15, 6210–6219. [Google Scholar] [CrossRef]
- Le, V.; Yao, X.; Miller, C.; Tsao, B.-H.; Hung, T.-B. Series DC Arc Fault Detection Based on Ensemble Machine Learning. IEEE Trans. Power Electron. 2020, 35, 7826–7839. [Google Scholar] [CrossRef]
- Zhao, L.; Zhou, Y.; Chen, K.-L.; Rau, S.-H.; Lee, W.-J. High-Speed Arcing Fault Detection: Using the Light Spectrum. IEEE Ind. Appl. Mag. 2020, 26, 29–36. [Google Scholar] [CrossRef]
- UL 1699B, Outline of Investigation for Photovoltaic (PV) dc Arc-Fault Circuit Protection, Issue 2; Underwriters Laboratories, Inc.: Northbrook, IL, USA, 2013.
Publisher’s Note: MDPI stays neutral with regard to jurisdictional claims in published maps and institutional affiliations. |
© 2020 by the authors. Licensee MDPI, Basel, Switzerland. This article is an open access article distributed under the terms and conditions of the Creative Commons Attribution (CC BY) license (http://creativecommons.org/licenses/by/4.0/).