Article

Combining Post Sentiments and User Participation for Extracting Public Stances from Twitter

1
Department of Computer Science and Information Engineering, National Taipei University of Technology, Taipei 106344, Taiwan
2
PChome eBay Co. Ltd., Taipei 106424, Taiwan
3
School of Computer and Communication Engineering, University of Science and Technology Beijing, Beijing 100083, China
*
Authors to whom correspondence should be addressed.
Appl. Sci. 2020, 10(22), 8035; https://doi.org/10.3390/app10228035
Submission received: 4 October 2020 / Revised: 5 November 2020 / Accepted: 10 November 2020 / Published: 12 November 2020
(This article belongs to the Special Issue Sentiment Analysis for Social Media Ⅱ)

Abstract

:

Featured Application

A potential application of the work is to predict the public stances towards a specific topic, or to predict election results using social media.

Abstract

With the wide popularity of social media, it’s becoming more convenient for people to express their opinions online. To better understand what the public think about a topic, sentiment classification techniques have been widely used to estimate the overall orientation of opinions in post contents. However, users might have various degrees of influence depending on their participation in discussions on different topics. In this paper, we address the issues of combining sentiment classification and link analysis techniques for extracting stances of the public from social media. Since social media posts are usually very short, word embedding models are first used to learn different word usages in various contexts. Then, deep learning methods such as Long Short-Term Memory (LSTM) are used to learn the long-distance context dependency among words for better estimation of sentiments. Third, we consider the major user participation in popular social media by adjusting the users weights to reflect their relative influence in user-post interaction graphs. Finally, we combine post sentiments and user influences into a total opinion score for extracting public stances. In the experiments, we evaluated the performance of our proposed approach for tweets about the 2016 U.S. Presidential Election. The best performance of sentiment classification can be observed with an F-measure of 72.97% for LSTM classifiers. This shows the effectiveness of deep learning methods in learning word usage in social media contexts. The experimental results on stance extraction showed the best performance of 0.68% Mean Absolute Error (MAE) in aggregating public stances on election candidates. This shows the potential of combining tweet sentiments and user participation structures for extracting the aggregate stances of the public on popular topics. Further investigation is needed to verify the performance in different social media sources.

1. Introduction

Public opinions are important in a society where policy makers need to collect data, especially when there are major issues for the general public. Conventionally, public opinions are usually gathered by questionnaires, which is a tedious and time-consuming task. With the popularity of social networking platforms, it’s becoming more convenient for people to express their opinions online, and the availability of social Application Programming Interfaces (APIs) facilitates collecting opinions more easily. To better understand what people think about a topic, there are generally two approaches to sentiment analysis: content-based and structure-based. For content-based analysis, sentiment classification techniques have been extensively investigated and compared such as the bag-of-words model using Term Frequency-Inverse Document Frequency (TF-IDF), the probabilistic model using Naïve Bayes and the blackbox model using neural networks. However, these methods usually need hand-crafted features. For social media which are very short and diverse in topic, it’s more difficult to obtain useful features for classification and without suitable features, it’s hard to achieve good classification results. Thus, a more effective method for short text sentiment classification is needed. To obtain more useful features for short texts in social media, we utilize the idea of distributed representation of documents where each input is represented by many features and each feature is involved in many possible inputs. Specifically, for social media texts, word embedding models such as Word2Vec [1] and GloVe [2] are often used for distributed representation.
In addition to text contents, public opinions can also be affected by social relations and societal status. People tend to follow what famous people say or do. Thus, user authority is one of the important factors in public opinion analysis. There are two major ways to judge user authority. One is the use of static social relations such as friends, fans, or followers in different social networking platforms. These are explicit relationships that can be evident from the user profile in the platform. Link analysis methods such as HITS algorithm [3] or PageRank [4] are often used to analyze such relationships. The other is the dynamic structures formed from user participation in social media. For example, users can like, retweet, and forward messages to their acquaintances. These are implicit relationships that can only be learned from the history of user activities. Information diffusion models [5] investigate how information is propagated through social networks. Influential actors might play key roles since they tend to forward information to the largest extent by their number of acquaintances and the degree of penetration.
To exploit these social relations, online identity verification is a challenge. Social networking platforms are considered publicly shared assets for the general public to freely express their ideas and opinions. For users in social networks such as Twitter, it’s not required to provide authentic information in user profiles. The real identity of users cannot be reliably verified. This can cause problems if the user accounts were faked by spammers or fraud groups who deploy bots or programs that could be easily reproduced in a large scale for advertisements, spreading inappropriate speech (sex, violence, hate, to name a few), or impersonating people for fun or fraudulent intent. To deal with such a problem of “source credibility”, there are lots of efforts. On the one hand, major social networking platforms enforce different rules for protecting the public venues from inappropriate behaviors and languages. When users violate these rules, their messages will be deleted and their accounts will be suspended. On the other hand, there are technical methods to detect such malicious behaviors in different ways. For example, methods have been developed for spam detection [6], detection of spam accounts or spammers [7], or even spammer groups [8] or link farming [9]. Using features from user profiles, social relation graph, and propagation path, there are many ongoing research efforts to distinguish between normal users and bots.
Since online identities cannot be reliably verified, we do not intend to detect the stance that each single person holds on the target accurately. In contrast, the goal of this paper is to extract the “public stance”, which is the aggregate stance of the general public on a given target from online posts in social networks. By summarizing post sentiments for opinion holders on the target and user participation in discussions on related topics, we expect to get the general idea about what the public thinks about the target. In this paper, we investigate the effectiveness of deep learning methods for sentiment classification of short texts and the impact of combining dynamic user participation in influence analysis for extracting public stances on popular topics. First, sentiment classification is done by long short-term memory (LSTM) [10], which learns the long-term dependency between words in short texts, with the representation of words as vectors by word embedding models such as Word2Vec. Second, for user influence estimation, different types of user actions on tweets, such as posting, sharing, and retweeting are modeled as a user-post interaction graph. Then, we modify TURank [11] by assigning different edge weightings for different actions on the graph for link analysis. Finally, we estimate the public stance on a specific topic or a set of comparable topics by the ratio of positive, negative, and neutral scores, which are calculated by a weighted sum of content sentiments by the user structural influence on the topic.
In our experiments, we compare the performance of LSTM with Naïve Bayes (NB), extreme learning machine (ELM) [12], and convolutional neural networks (CNNs) for sentiment classification of several social datasets. Then, we apply the proposed method to extract public stances about the 2016 U.S. Presidential Election. As the experimental results show, for sentiment classification of tweets, LSTM can perform better than conventional probabilistic model and neural networks with the best F-measure of 72.97%. For stance extraction, our proposed method can achieve better performance than different sentiment measures as in Bermingham and Smeaton [13], including the unweighted Sent, SoV, SoVp, SoVn, with a mean absolute error (MAE) of 5.34%. With the inclusion of content weighting by user authority, we can further obtain the best performance with a MAE of 0.68%. This shows the potential of using deep learning methods for sentiment analysis and combining user participation for extracting public stances from social media. Further investigation is needed to verify the effectiveness of the proposed approach on different social media in larger scale. The major contribution of this paper can be summarized as follows:
(1)
We focus on extracting the aggregate stance of the general public on a single topic and a set of comparable topics, where no datasets are available. This task is different from existing research on stance detection where stance labels are available in open datasets.
(2)
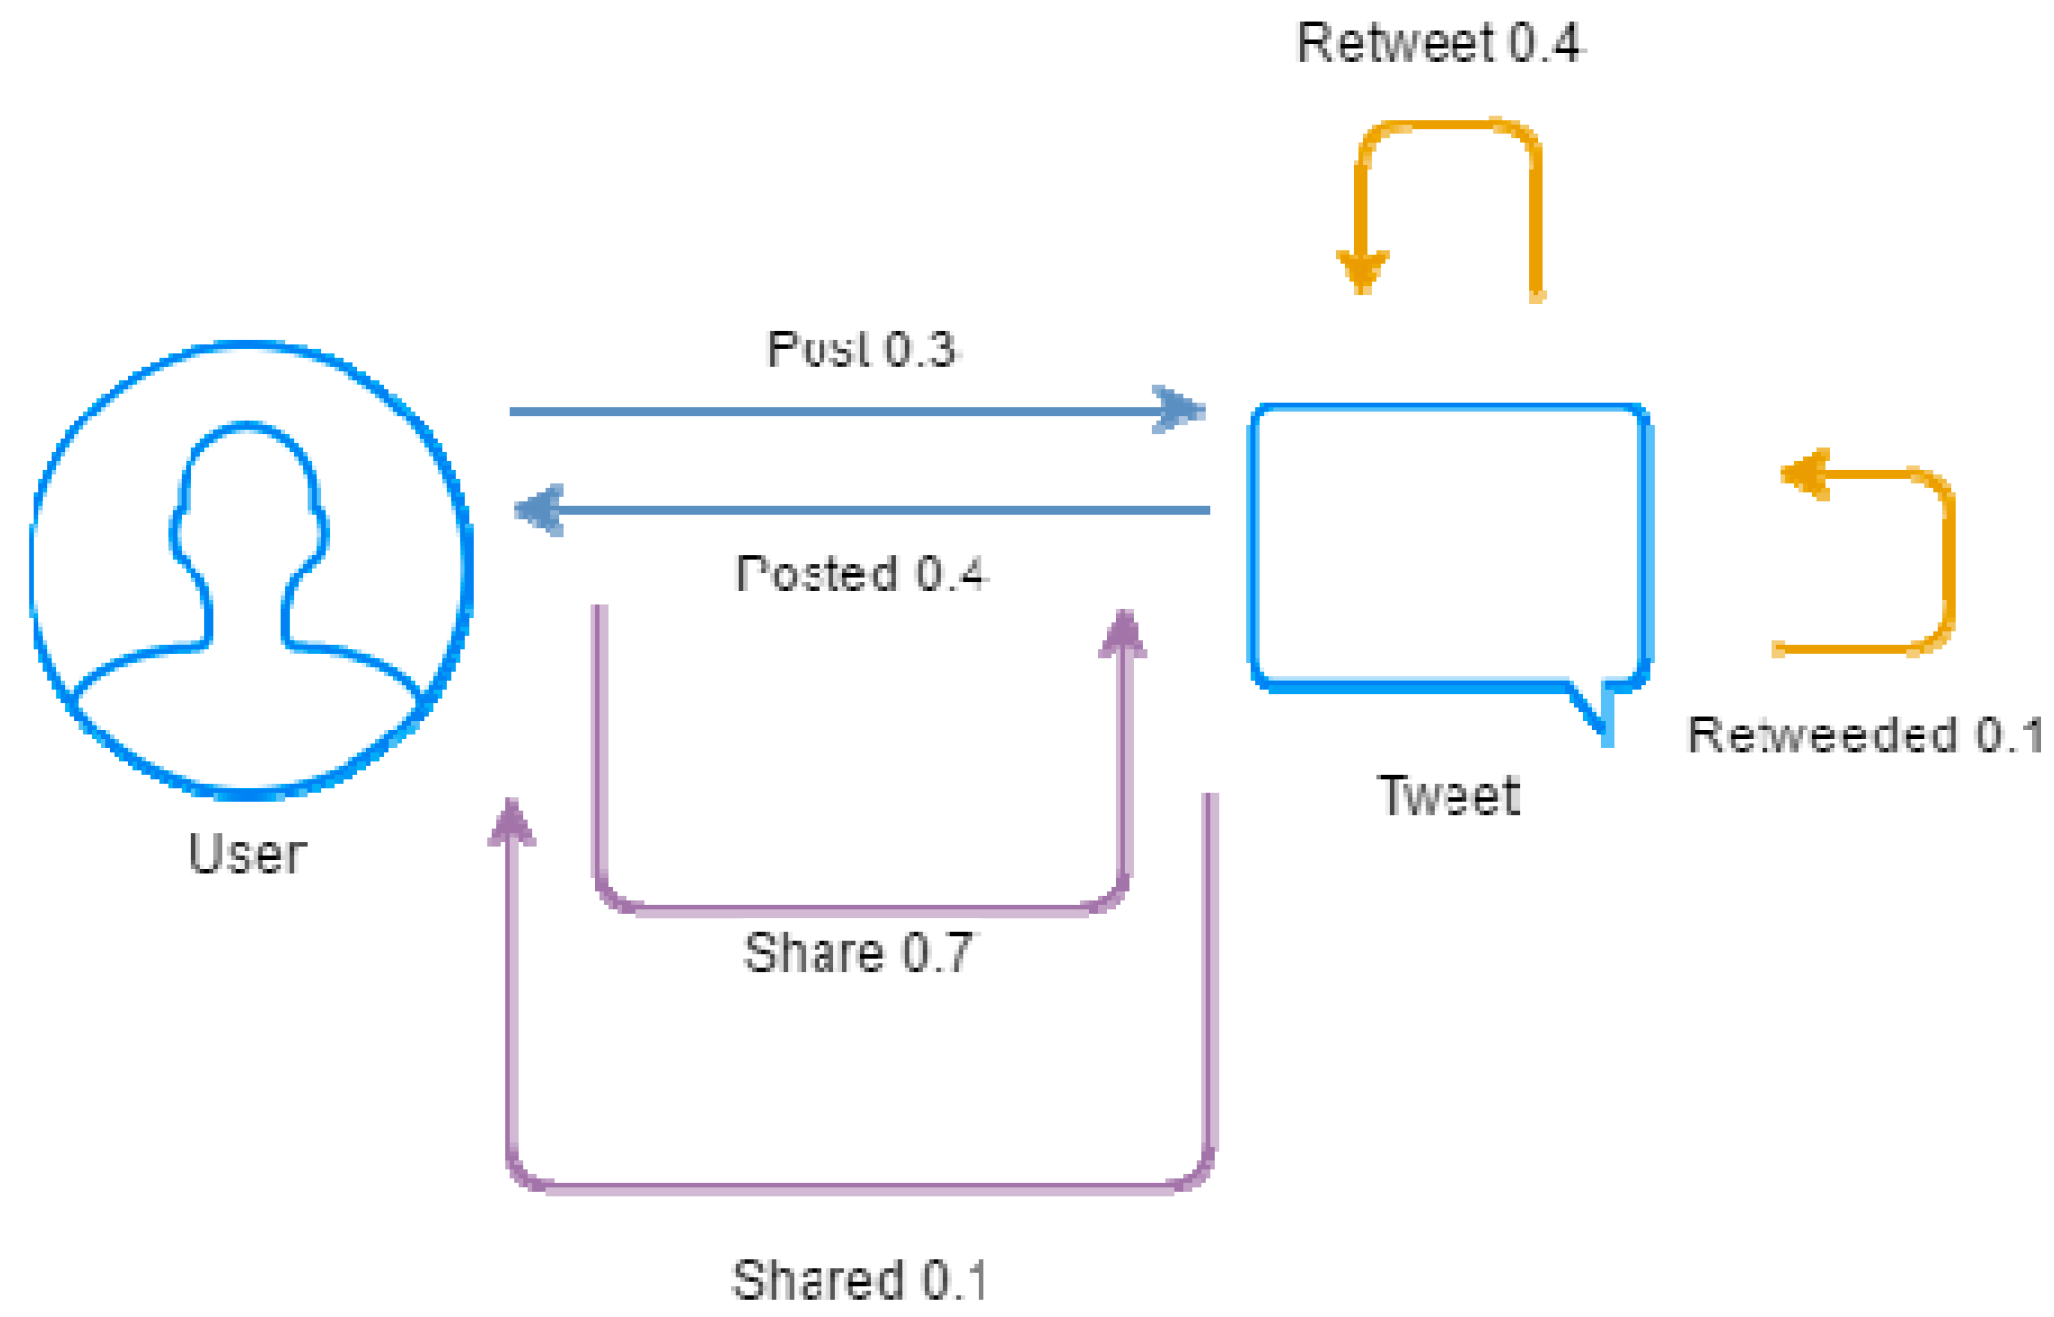
We modify existing methods of link analysis such as TURank to consider the different edge weighting for posting, sharing, and retweeting actions.
(3)
We design a feasible method to calculate user influence scores and combine tweets content sentiments for extracting public stances on popular topics such as election.
The remainder of this paper is organized as follows: Section 2 lists the related works, and Section 3 describes the proposed method. The experimental results and discussions are described in Section 4 and Section 5, respectively. Finally, Section 6 presents our conclusions.

2. Related Work

Public opinion analysis is becoming more important since opinions can be immediately expressed in social media. To understand public opinions in social media, the contents of user posts are usually analyzed. Words are the basic units of documents in natural language processing. It’s useful to analyze the distributional relations of word occurrences in documents. Thus, word embedding models are usually used to map from the one-hot vector space to a continuous vector space with much lower dimension, such as Word2Vec [1] and GloVe [2]. They both use neural networks to train the occurrence relations between words and documents in the contexts of training data. Specifically, Maas et al. [14] tried to learn word vectors for sentiment analysis.
Sentiment analysis techniques are often used to classify sentiment orientation of user opinions contained in social posts. They are useful in many applications such as analyzing user reviews. For example, Pang et al. [15] conducted sentiment classification on movie reviews using machine learning methods. Paul et al. [16] investigated spatial-temporal sentiment analysis of Tweets for US election. With the advances in deep learning methods, they have gradually shown better performance in sentiment classification. For example, convolutional neural networks (CNNs) have been shown to learn local features from words or phrases [17]. Severyn and Moschitti [18] used deep CNNs for Twitter sentiment analysis at both message and phrase levels. On the other hand, recurrent neural networks (RNNs) allow the same hidden layers to process data in a temporal sequence. According to previous comparative study of RNN and CNN in natural language processing [19], RNNs are found to be more effective in sentiment analysis than CNNs. However, as the time sequence grows in RNNs, it’s possible for weights to grow beyond control or to vanish. To deal with the vanishing gradient problem [20] in training conventional RNNs, long short-term memory (LSTM) [10] was proposed to learn long-term dependency during longer time period. For example, Zhou et al. [21] proposed to use attention-based LSTM for cross-lingual sentiment classification. Al-Twairesh and Al-Negheimish [22] proposed a feature ensemble model of surface and deep features for sentiment analysis of Arabic tweets. In this paper, we utilize LSTM in learning classifiers of sentiments in tweet contents.
Stance detection is one of the research topics that are closely related to sentiment analysis. It aims at detecting if opinion holders are in favor or against a target. For example, Sun et al. [23] proposed a joint neural network model to learn the stance and sentiment of a post at the same time. With shared representation of stance and sentiment information, their neural stacking framework with LSTM achieves the best performance on SemEval 2016 stance detection dataset [24] with F-measure of 63.54% and 74.89% for favor and against, respectively. Ghanem et al. [25] combined feature representation for stance detection and fake news. For the FNC-1 dataset, they obtained an accuracy of 59.6%. Current research on stance detection assumes the availability of labels for user stances in a few selected topics in the dataset. For example, the Stance Detection dataset for Task 6: “Detecting Stance in Tweets” in SemEval 2016 [24] gives the corresponding labels of “favor”, “against”, and “none of the above” for about 2900 labeled training data instances in five different topics or targets, including: “atheism”, “climate change is a real concern”, “feminist movement”, “Hillary Clinton”, and “legalization of abortion”. However, in this paper, we focus on extracting the aggregate stance of the public on a single topic and a set of comparable topics. Since there’s no such corpus available, we have to construct our own dataset. In order to make the proposed method more applicable to real scenarios, we chose the election-related topics in Twitter.
In addition to post contents, social media contain other features for sentiment analysis. For example, Wang et al. [26] proposed to combine textual information and sentiment diffusion patterns for Twitter sentiment analysis. Another important characteristic of social media is the structural information that can also be very useful since different users and posts might exhibit various influence through the communication structures. There are many research works on finding more influential posts or influential users in social networks, respectively. For example, Yao et al. [27] proposed to rank the user influence by user relationships. Hong et al. [28] considered the post forwarding relations to improve popular message prediction in Twitter. Uysal and Croft [29] proposed to predict the chances of a tweet being forwarded in future, and then predict the most likely forwarding user. Weng et al. [30] proposed to apply PageRank to rank users according to the user-following relations. Conventional link analysis methods such as PageRank [4] and HITS algorithm [3] are used to analyze the relative importance of Web pages. ObjectRank [31] was proposed to extend the idea of PageRank to more general relations among objects in databases. Since the objects in databases can be of many different types, there could be many possible relations among objects. The main idea of ObjectRank is to pre-define the bi-directional inter-object relations and set the corresponding weights manually according to the relative importance of each relation. To evaluate users’ authority in Twitter based on link analysis, TURank [11] was proposed to model the relations among users and tweets in a user-tweet graph (UTG). In this paper, we further modify TURank by representing different user actions such as posting, sharing, and retweeting by different types of edges whose weights correspond to their relative importance on determining user influence. Then, user influence scores are used as the weights of content sentiments for improving the estimation of user influences for extracting public stances.

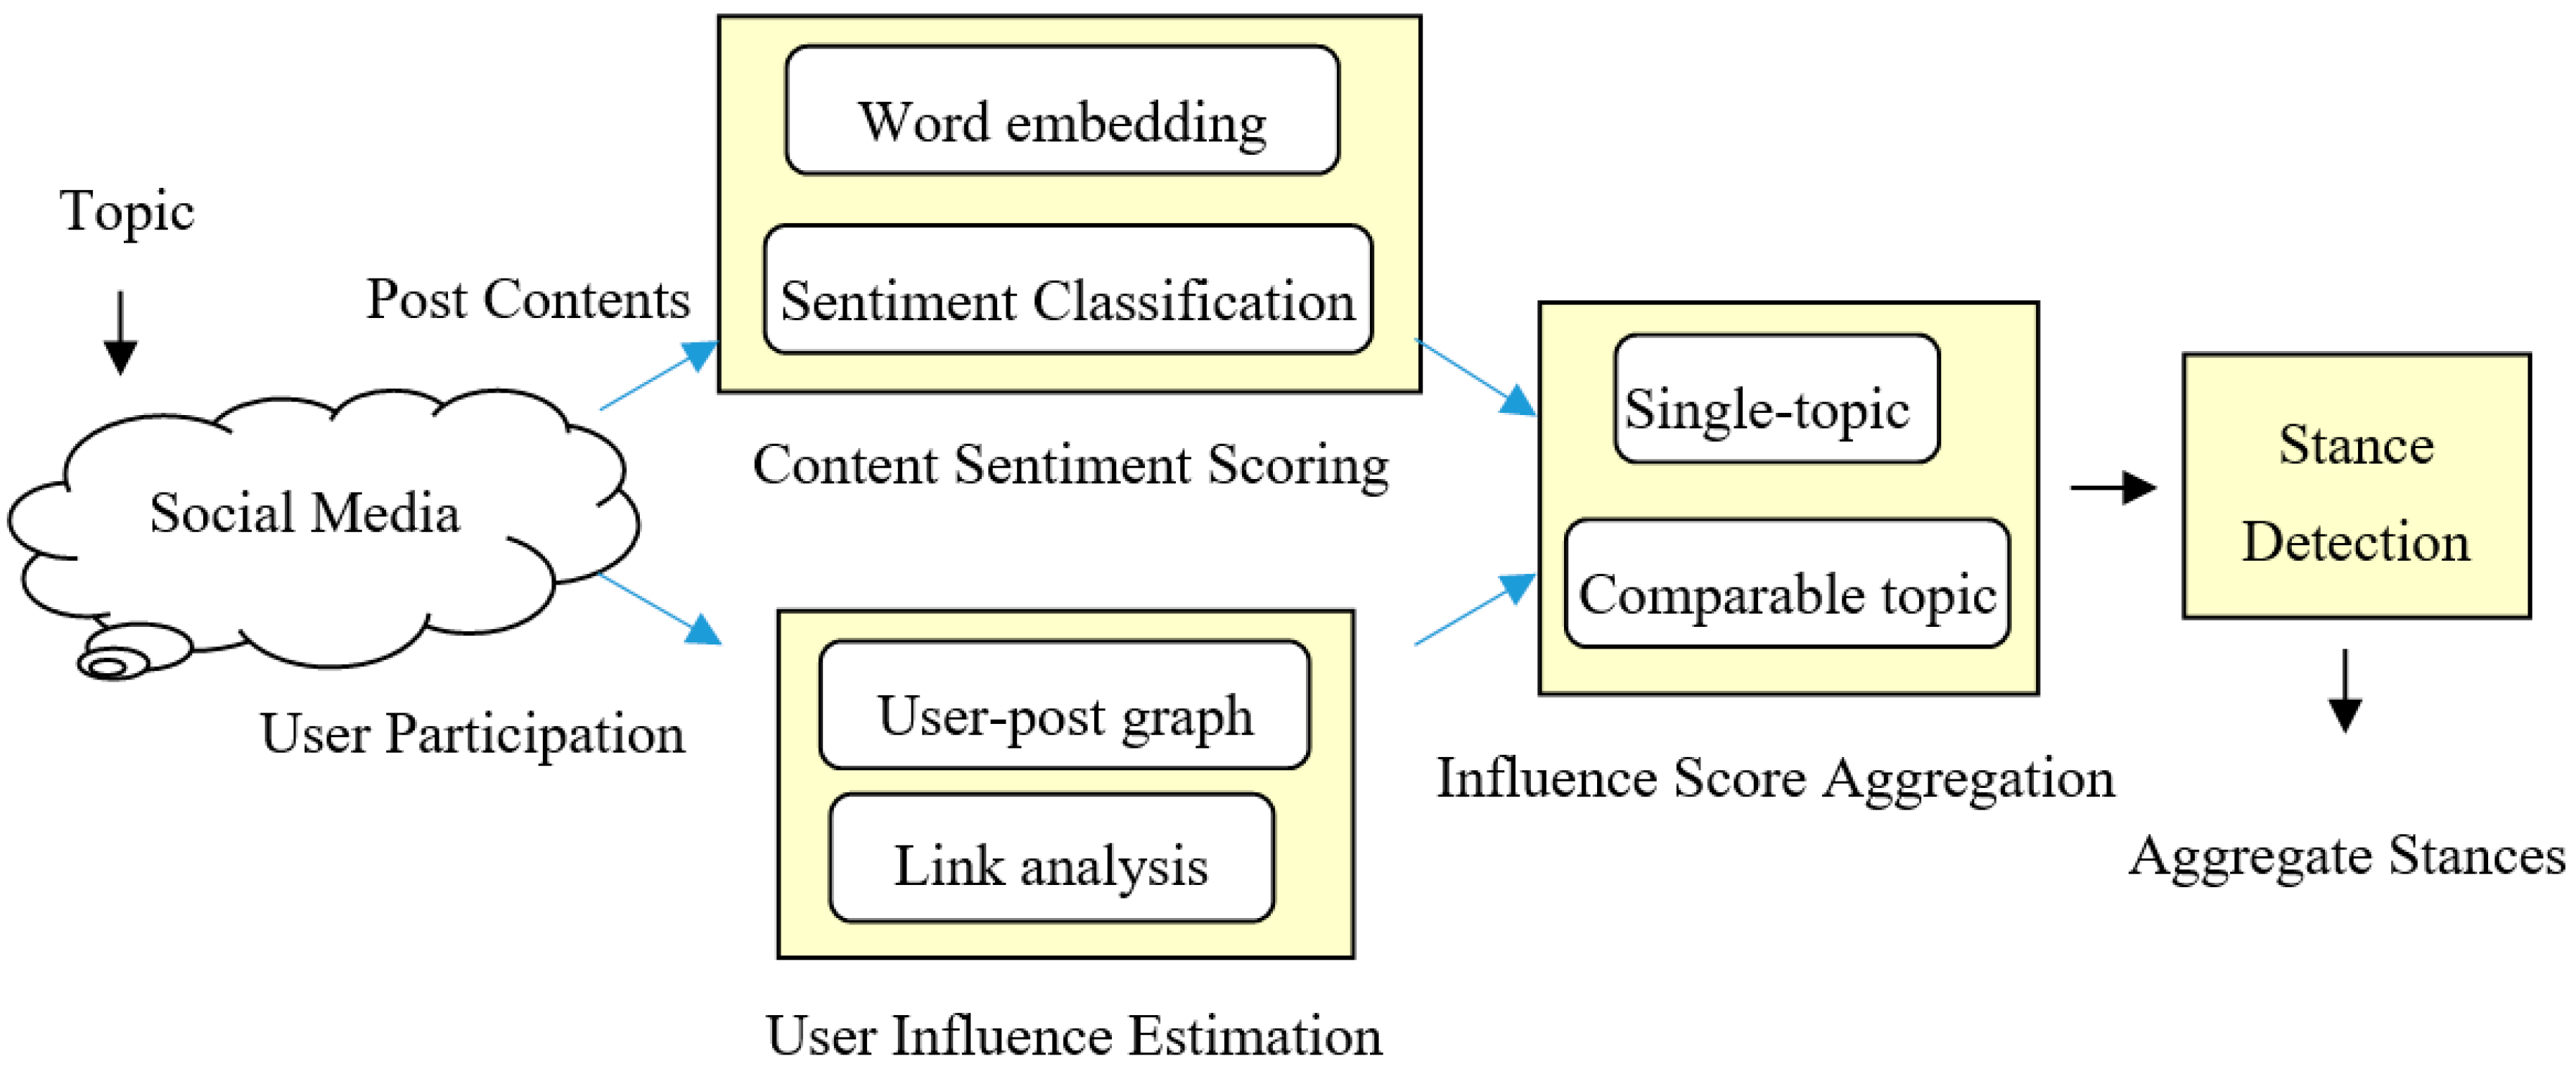
3. The Proposed Method

In the proposed stance extraction method, there are three major components: content sentiment scoring, user influence estimation, and influence score aggregation. The architecture of the proposed approach is illustrated in Figure 1.
As shown in Figure 1, given a specific topic, related post contents and user participation such as likes, replies, and forwarding are first extracted from social media. For post contents, they are first represented by a word embedding model such as Word2Vec [1] as word vectors. Deep learning methods such as long short-term memory (LSTM) [10] are used for classifying sentiments of post contents. Then, link analysis techniques based on modification to TURank [11] are applied to user-post interaction relations, and user influence weights are calculated. Finally, user influence is used as the weight of sentiment orientation of post content, from which the aggregate stances on the given topic are extracted. Next, we describe the details of each component in the following subsections.

3.1. Preprocessing and Feature Extraction

First, we use Twitter Search API with selected topical keywords to retrieve topic-related short texts from social media. Specifically, we collected posts with emoticons as the training data for sentiment classification. Then, preprocessing tasks are needed to better represent the important features. Specifically, we filter out the URL links, hashtags, and emoticons from post contents. Also, stopword removal is performed to enable better feature representation. Then, we extract metadata such as the ID of the author, the posting time, and the number of retweets and likes. These will be used as additional features for classification.
Due to the limitation of conventional bag of words model for very high dimensional space and the lack of contextual relations between words, we use word embedding models such as Word2Vec [1] to better represent the limited content in short texts, and learn the word contexts in training data. Also, the fixed number of dimensions in word embedding model can facilitate more efficient computations. Among the two models in Word2Vec, continuous bag-of-words (CBOW) and Skip-gram, we use word vectors trained via Skip-gram model as the inputs to the following stage of sentiment classification. This is due to the much better performance for skip-gram model in semantic analysis [1].
After each post is represented using word embedding models, the sequence of word vectors are then used as inputs to the long short-term memory (LSTM) [10] neural networks one by one. The idea is that: we want to learn the longer distance dependency among sequence of words in different posts using LSTM. To comply with the sequential input of LSTM, we first convert posts into three-dimensional matrix M(X, Y, Z), where X is the dimension of Word2Vec word embedding model, Y is the number of words in the post, and Z is the number of posts. To avoid a very long training time, we adopt a single hidden-layer neural network. The number of neurons in input layer is the dimension of Word2Vec model, and the number of neurons in output layer is the number of classes, which is 2 in our case. By gradient-based back propagation through time, we can adjust the edge weights in the hidden layer at each point of time. After several epochs of training, we can obtain the sentiment model for classifying sentiments in post contents in the following section.

3.2. Content Sentiment Scoring

After the sentiment classification model is trained, it’s used to classify sentiments in post contents. Since the dataset was collected using emoticons, each post is either positive or negative. Due to the lack of training instances with neutral labels, we can only train binary classifiers for positive and negative posts. But in real cases, posts could be neutral, positive, or negative. So, we need to filter out tweets without sentiments before applying the classification model.
In this paper, we first perform subjectivity detection by extracting hashtags from posts, and calculating the sentiment score of hashtags using Equation (1):
S c o r e h a s h t a g ( p ) = s g n ( h i h a s h t a g ( p ) S c o r e ( h i ) )
where hi is the hashtag in post p, and the sentiment score score(hi) of hashtag hi is calculated by matching them with terms in the sentiment lexicon. Note that we only take the sign of the accumulated sentiment score using the sgn() function.
For posts with a score of 0, we further calculate the sentiment score of post content by accumulating sentiment score of content words as in Equation (2):
S c o r e c o n t e n t ( p ) = s g n ( w i c o n t e n t ( p ) S c o r e ( w i ) )
where score(wi) is sentiment score of content word wi in post p, and only the sign of the accumulated sentiment score is kept using the sgn() function with a score of 1 for positive sentiment, and −1 for negative one. These are also used as the labels of the posts. Finally, after filtering out tweets with neutral score, the sentiment model trained using LSTM will be used for sentiment classification. For posts in test set, they are preprocessed with the same procedure as the training set, and represented using the same word embedding model.

3.3. User Influence Estimation

In addition to determining the sentiment score of post contents, we further consider the user influence on public opinions. Users might have different impacts to other people according to their social relationships. In addition to acquiring users’ friend relationship, we can also learn from their interactions with other people. In this paper, we define the user authority in terms of their post-response interactions with other users. Specifically, the linking structures inherent in the interactions are extracted to represent the corresponding relations among users and posts. Then, the social influence of each person can be estimated based on link analysis.
After observing the major functions in popular social networking platforms such as Twitter and Facebook, we can find the major types of interactions including: posting, retweeting (forwarding), replying, like, and following in different social networking platforms. The assumption is that: if a user posts more articles with more people participating in related discussions, he (or she) will be more influential to the related topics. In this paper, we construct user-post graphs G = {V, E}, where the nodes V include users U and posts P, and the edges E represent various user actions on posts. Since we only consider the interactions between users and posts, there will be no edge between the same types of nodes. It’s therefore a bipartite graph. For example, user ui can post, forward, reply, and like a post pj, which forms an edge eij.
Different types of interactions might have different meanings and thus different influence weights. If we do not distinguish between these types, it becomes an unweighted graph, which can be simply calculated using the idea of PageRank [4] or ObjectRank [31]. In this paper, we assume a different but fixed weight for each type of interactions. Thus, we extend the idea of TURank [11] by considering more types of edges for different user-post relations. In our preliminary experiments, due to the limitation of Twitter API, the real data collected are limited in the amount of follows, replies, and likes. Without appropriate amounts of data, we cannot successfully learn these relations for the estimation of influence weights. Thus, in this paper, we only consider the bi-directional user-post interaction graphs as constructed using posting and forwarding relations. Specifically, since the retweeting function in Twitter can be either simply forwarding a message, or commenting on the post, we further distinguish them into two types: sharing, and retweeting. From the initial observation, an example configuration of edge weights are set as shown in Figure 2.
As shown in Figure 2, we focus on user-post graphs consisting of three types of user actions: posting, sharing, and retweeting, together with the corresponding reactions on posts: posted, shared, and retweeted. After constructing the user-post graphs, the corresponding influence scores can be calculated based on the idea of PageRank [4], except that the weight w(e) of an edge e in the transition matrix is modified as in Equation (3):
w ( e ) = w ( e s ) o u t d e g ( v , e s )
where edge e can belong to different type es with the corresponding weight w(es). The outdeg(v, es) denotes the out-degree of node v with edges of type es.
In real cases such as Facebook or Twitter, the number of users and posts can easily reach the order of millions or more. Thus, the user-post graph and the corresponding adjacency matrix can be very huge in size. In addition to the storage size required, the computational costs can be tremendous for a typical off-the-shelf personal computer.
We propose two solutions. First, we divide the dataset into subsets by dates. Since users usually browse the first few posts without reading them all, we observe that users will only read, share, and like a post within no more than one day. Each subset will be used to construct the corresponding user-post graph on that date. Second, we further divide the dataset by users. Since most users usually interact with only a few posts according to our observations, it shows a power law relationship. Each user-post graph can be further divided into subgraphs. Then, for the sake of efficiency, we represent the graphs using adjacency lists instead of adjacency matrix. This can save lots of unused storage space, thus facilitating larger-scale calculation when there are huge number of nodes and edges in the graph.
After dividing the huge graph into subgraphs, the remaining issues are multiple scores for each user, and unable to normalize scores in the subgraphs. When calculating the corresponding user and post influence scores, instead of the normalization step in the original TURank [11], we defer the normalization step to the last step after all subgraphs have been calculated. The final normalized structural influence scores for users and posts can be formulated as in Equations (4) and (5):
I n f s t r u c t ( u i ) = 10 ( R a n k ( u i ) m i n ( R a n k ( U ) ) ) max ( R a n k ( U ) ) m i n ( R a n k ( U ) )
I n f s t r u c t ( p j ) = 10 ( R a n k ( p j ) m i n ( R a n k ( P ) ) ) max ( R a n k ( P ) ) m i n ( R a n k ( P ) )
where U is the set of all users ui for i = 1, …, m, and P is the set of all posts pj for j = 1, …, n.

3.4. Influence Score Aggregation for Stance Extraction

Finally, to aggregate influences from all users, we combine the content influence score of posts and the structural influence score of users into a total score. Then, the aggregate stances of the public about the given topics can be extracted. In this paper, we consider two different cases of stance extraction: single-topic, and a set of comparable topics.

3.4.1. Single-Topic Stance Extraction

First, we discuss the case of public stance analysis on a single topic t. We assume that the higher the influence of a post, the more recognized of the post from other people. Thus, from all topic-related posts by a user ui, we calculate the total influence for topic t by accumulating sentiment scores as in Equation (6):
I n f t o p i c ( u i ) = p j P o s t ( u i ) I n f s t r u c t ( p j ) S c o r e c o n t e n t ( p j )
As shown in Equation (6), the topical influence Inftopic(ui) for user ui on topic t is calculated using structural influence as the weight to the content sentiment of the post. A positive value means ui is in favor of topic t, while a negative value means a stance against the topic. Then, to extract the public stance, we calculate the positive opinion score Oppos(t) of topic t by accumulating the positive topical influence for all users weighted by their structural influence as in Equation (7):
O p p o s ( t ) = u i U , I n f t o p i c ( u i ) > 0 I n f s t r u c t ( u i )
Also, Opneg(t), Opneu(t) can be calculated in a similar way. Finally, the topical stance for topic t is represented as the percentage of positive, negative, and neutral opinion scores among their sum, respectively, as in Equation (8).
S t a n c e p o s ( t ) = O p p o s ( t ) O p p o s ( t ) + O p n e g ( t ) + O p n e u ( t ) 100 %

3.4.2. Comparable-Topics Stance Extraction

Next, we discuss the case of public stance analysis on a set of comparable topics T = {T1, …, Tk}. For example, in US presidential election 2016, the two major candidates become a set of comparable topics T = {“Hilary”, “Trump”}. We assume that the post is relevant to a topic if it occurs in the post. To make evaluation easier, we ignore posts that contain more than one topics. We modify the Sent formula from Bermingham and Smeaton [13] by adding weights of structural influences to calculate the topical influence for user ui on topic Tj as in Equation (9):
I n f t o p i c ( u i , T j ) = l o g 1 + p k P u i , T j , S c o r e c o n t e n t ( p k ) > 0 I n f s t r u c t ( p k ) 1 + p k P u i , T j , S c o r e c o n t e n t ( p k ) < 0 I n f s t r u c t ( p k )
where Pui,Tj denotes all posts on topic Tj by user ui. The idea is to calculate the relative influence of positive against negative sentiments. We use Laplace smoothing to avoid zero terms in either positive or negative influence scores. Eq.(9) is further used to define if a user ui favors a topic Tj among a set of comparable topics T. Specifically, the topic with the maximum topical influence is defined as the favorite topic of user ui. That is, T*(ui) = argmaxTjT Inftopic(ui, Tj). Then, we define the set of users whose favorite topic is Tj as UTj. That is, UTj = {ui|T*(ui) = Tj}. Instead of simply counting the number of users who favors a topic, we further multiply the structural influence of user ui as a weight to calculate the opinion score of favorite topic Tj as in Equation (10):
O p f a v o r ( T j ) = u i U T j I n f s t r u c t ( u i )
where Infstruct(ui) of user ui is defined in Equation (4). Finally, the ratio of the opinion scores of topic Ti among all comparable topics is defined as the topical stance of Ti as in Equation (11):
S t a n c e ( T j ) = O p f a v o r ( T j ) T j O p f a v o r ( T j ) 100 %
where topic Ti belongs to the set of comparable topics T.

4. Experiments

In order to evaluate the performance of our proposed approach, we conducted the following experiments. First, we collected English tweets about U.S. Presidential Election. We used Hillary and Trump as the query terms to collect from Twitter API during 1 November 2016–7 November, 2016, respectively. After removing tweets that discuss both topics, we obtained 2,464,013 tweets. The number of posters are 661,015 users, where the number of links among users and posts are 80,474,845 edges, including 2,464,013 posting edges, 5,123,228 sharing edges, and 149,579 retweeting edges.
There are many parameters to be configured in Word2Vec model training, LSTM network, and social influence calculation. First, we use a 600-dimensional vector for Word2Vec model training for a learning rate of 0.02, with the threshold of term frequency as 5. Second, in LSTM, we have a single hidden layer with 250 neurons, using SoftSign activation function. And the output activation function is SoftMax. Finally, for social influence calculation, we set the number of iterations as 15, or the minimum error of 0.0001 for PageRank calculation.
To evaluate the classification performance, we used the standard evaluation metrics of precision, recall, F1-measure for sentiment classification. All classification results are evaluated using 5-fold cross-validation. For evaluating performance on stance detection, mean absolute error (MAE) was used.

4.1. Experiment on Sentiment Classification

To evaluate the effects of sentiment classification, we first used the Sentiment Classification dataset from SemEval 2016 Task 4 [32], which consists of 15,983 tweets. Then, in order to verify the performance of sentiment classification on the same topics about election, we further collected tweets with emoticons for the queries of Hillary and Trump before Oct. 31, 2016, respectively. To balance the classes, we randomly selected 10,000 positive and 10,000 negative posts for each dataset respectively. Finally, we also collected tweets without specifying query terms using Twitter API. The idea is to verify the effect for general topics. These were organized as our Supplementary Dataset S1. The following table shows the statistics of the datasets used to train word embedding models for sentiment classification.

4.1.1. The Effects of Word Embedding Models on Sentiment Classification

In this section, we tested the performance of sentiment classification using LSTM for different word embedding models on various datasets in Table 1. First, the performance for our trained Word2Vec models is shown in Figure 3.
As shown in Figure 3, better performance can be achieved for datasets that have sentiment information or similar topics, such as Vec-All and Vec-SemEval. The larger the data size, the better performance. Also, datasets with sentiment information are consistently better than the general datasets since the topics in general datasets are too diverse to train relevant word contexts. To check the effect of training word embedding models on sentiment classification, we further compared the performance with Twitter-based pre-trained GloVe word embedding model as in Figure 4.
As shown in Figure 4, the performance of Twitter-based pre-trained GloVe embedding models with embedding size from 25 to 200 have been tested. First, we can observe comparable performance for pretrained GloVe embedding of size 200 with Word2Vec models Vec-Com-200. This is reasonable since pre-trained embedding models are trained from general documents, which should be similar to our Word2Vec model trained from general datasets. Also, better performance can be obtained when we increase the embedding size. However, since pre-trained GloVe embedding is general-purpose, their performance are inferior to that of Word2Vec models trained from datasets with sentiment information.
As shown in Figure 3, when training Word2Vec models from general datasets, larger data size does not necessarily increase the performance since the word contextual information was diversified when there’s more irrelevant data. However, since general datasets usually provide contextual information for more terms, they might help to improve the performance of sentiment classification for unknown posts which might contain many new words that are unseen in the training data. Thus, we combine the two Word2Vec models using linear combination as in Equation (12):
V e c ( w ) = α V e c S e m E v a l ( w ) + ( 1 α ) V e c g e n 200 ( w )
where α denotes the weight of VecSemEval model. The effects of α on classification performance is shown in Figure 5, where the best performance of 71.97% can be obtained when α = 1, which means no general corpus included. However, general corpus include unknown words which could be helpful for more diverse topics.
Thus, to strike the balance between classification performance and the ability to cover more diverse range of words, we decided the use the value of α as 0.7 since it has comparable performance (a F-measure of 71.73%) as when α = 0.8 (F-measure of 71.76%) and 0.9 (F-measure of 71.80%), but more diverse word coverage.

4.1.2. The Effects of Classifiers

Next, the performance of sentiment classification using LSTM was compared with three different classifiers: Naïve Bayes, ELM, and CNN, as shown in Table 2.
As shown in Table 2, the performance of all three neural network-based classifiers are better than Naïve Bayes for both Hillary and Trump datasets. The best performance can be achieved for LSTM with a F1-measure of 72.97% and 71.71%, respectively, while CNN obtained a comparable F1-measure of 72.89% and 71.50%, respectively. Since CNN parameters were not optimized, their performance are considered as comparable to those of LSTM.

4.2. Experiment on User Influence Analysis

Next, we conducted the experiments on user influence estimation. To evaluate the effectiveness of influence estimation, we assume that the users officially authenticated by Twitter are better-known which have higher visibility and thus higher influences. Thus, we define the coverage @ N as the percentage of Twitter authenticated users among the top N users discovered by user influence score calculated using different edge weighting. Since edge weighting reflect the relative importance of user actions, from our initial observations, we tested four different sets of edge weighting as in Table 3.
As shown in Table 3, in order to determine the relative importance of different user actions such as “posting”, “sharing”, and “retweeting”, we conducted preliminary experiments and obtained some observations on user participation actions in social media. First, the absolute number of tweets posted by a user can be a misleading factor to determine user influence, since there are many users who have a lot of tweets with almost no likes and shares. They also have very few followers. Therefore, they should not have high influence. From Test1 and Test2, we want to verify that the weight of “posting” behavior should not be higher than that of “sharing”. Second, considering the “retweeting” action which might indicate the additional chances of exposure for the tweet to the public, they might be read and further spread, which make them influential. From Test3 and Test4, we further verify if higher weights of “retweeting” action can lead to better performance. Based on the four sets of edge weighting, we evaluate their performance as in Figure 6.
As shown in Figure 6, the best performance can be achieved with the edge weighting of Test1 since it can cover more Twitter authenticated users. To get better performance, the weighting of sharing should be higher than posting, but the weighting of posting cannot be too low. A small percentage of weighting for retweeted and shared can improve the accuracy. Also, since there might not be many retweets, retweeting weight should not be too high. To further verify the effect of influence score on finding the top users, we compared it with the number of followers, retweets, and favorites as in Figure 7.
As shown in Figure 7, the number of followers is the most accurate since it’s one of the major criteria for being selected as the Twitter authenticated users. The number of favorites is close to the influence score, but it’s decreasing faster. If we further analyze the top 100 users ranked by influence score, 33 were not included as the Twitter authenticated users. We can see their high number of followers. We can observe that they have high influence scores but have yet to be included as authenticated users by Twitter. This can validate the effectiveness of our proposed influence estimation in finding high potential influencers that are not yet authenticated.

4.3. Experiment on Stance Detection

Finally, we checked the performance of our proposed approach to stance detection.
According to the final results for 2016 US Presidential Election, (https://en.wikipedia.org/wiki/ 2016_United_States_presidential_election) Donald Trump got 306 electoral votes (56.88%) while Hillary Clinton got 232 (43.12%), including the two and five faithless electors who defected from Trump and Clinton, respectively. As shown in Table 4, we compared the effects of Equation (9) with the following Equations (13)–(15) which are SoV, SoVp, SoVn from Bermingham and Smeaton [13] for opinion score calculation:
I n f t o p i c ( u i , T j ) = log 1 + p k P u i , T j I n f s t r u c t ( p k ) 1 + p k P u i I n f s t r u c t ( p k )
I n f t o p i c ( u i , T j ) = p k P u i , T j , S c o r e c o n t e n t ( p k ) > 0 I n f s t r u c t ( p k ) p k P u i , S c o r e c o n t e n t ( p k ) > 0 I n f s t r u c t ( p k )
I n f t o p i c ( u i , T j ) = p k P u i , T j , S c o r e c o n t e n t ( p k ) < 0 I n f s t r u c t ( p k ) p k P u i , S c o r e c o n t e n t ( p k ) < 0 I n f s t r u c t ( p k )
As shown in Table 4, we can observe that very imbalanced datasets in some topics, the stance might be easier to be detected since users might only express their opinions on some topics. For example, when using Equation (14) for opinion score calculation, only the positive opinions were taken into account. This leads to more than 60% of users to be neutral, which means we cannot effectively determine their stance. In order to be useful in real scenarios, we utilized Sent-SOV score calculation, in which Equation (13) was applied first to get higher detection ratio in terms of the percentage of users whose stance can be detected. Then, we further applied Equation (9) to detect the ratios of positive and negative opinions. This gives the best performance with an MAE of 5.34%. The experimental results in Table 4 are obtained from Supplementary Dataset S1. Finally, we further compare the effects of user and post influence scores on the stance detection performance as shown in Table 5.
As shown in Table 5, we can see the best performance can be achieved with user influence, which has a MAE of 0.68%. Also, only a 1.37% of users are neutral, which shows the ability to determine the stances of most users. This shows the high effectiveness for the proposed method of stance detection when considering user influence from social media for presidential election. The experimental results in Table 5 are obtained from Supplementary Dataset S1.

5. Discussions

From the experimental results, some observations about the proposed approach are shown as follows:
  • As shown in Table 2, the sentiments of short texts can be effectively classified by deep learning methods such as LSTM and CNN. LSTM slightly outperforms CNN, and they both outperform ELM and NB.
  • As shown in Figure 3, better performance can be achieved by training suitable word embedding models from datasets with similar topics. They provide more related contexts for words in sentiment classification.
  • With suitable edge weighting in user-post graph for user influence analysis, the top-ranked influential users identified by our proposed method can effectively cover authenticated users in Twitter. We can even discover high influential users that are yet to be included as authenticated users in Twitter. In this paper, we focus on the aggregate stance of the general public. It is the initial investigation on the issue of comparing the effects of various relative weights of different user actions on the social influence. By applying different combinations of relative weighting, we expect to gain some insights on their impacts. More studies are needed to further find out the relation between edge weights and real user influence.
  • With the combination of tweet sentiments and user participation, our proposed method can effectively extract public stance for popular topics such as presidential election from social media. The best Mean Absolute Error (MAE) of 0.68% can be achieved when we combine user influence scores when aggregating public stances on a set of comparable topics.
In opinion polls, either by in-person surveys, on the phone, or online, some individuals will pretend (or masquerade) their opinions or hide their true positions or thoughts. There are even “concern trolls” who appear to be on one side of the discussion, while pretending to be on the other side with the intention of undermining or derailing genuine discussion. Thus, the results of opinion polls might be different from the real situation. In a publicly shared platform such as Twitter, the public will notice if there are massive behaviors of spamming or “masquerading”. Therefore, we assume that there’re only a small number of possible masquerading behaviors in the crowd. To calculate the aggregate stance of the public, the impact of such masquerading on the total public stance is limited. The degree of influence can be kept to a minimum when we collect more data from the public.
In summary, this paper focuses on the overall framework for combining post sentiments and user participation for extracting public stance. It can be further improved by combining with existing state-of-the-art techniques for spam detection, spammer detection, and spammer group detection. They are different but complementary methods.

6. Conclusions

In this paper, we have proposed a deep learning approach to public stance detection based on post sentiment classification and user participation from Twitter. When training Word2Vec word embedding models with suitable datasets, deep learning methods such as LSTM help improve performance of sentiment classification in short texts. With user influence estimation using user-post interaction graphs, we can effectively extract public stances on a single topic or a set of comparable topics. In the case of 2016 U.S. Presidential Election, our proposed approach can obtain the best performance of 0.68% in terms of mean absolute error. This shows the potential of integrating user influence with post sentiments from social media for extracting public stances.
This paper has its limitations in that the issues of source credibility were beyond the scope of our discussions. Since stance detection is a challenging topic that is relatively underexplored, this paper focuses on the overall framework for combining post sentiments and user participation for extracting stance of the general public on a target. It can be further improved by combining with existing state-of-the-art techniques for spam detection, spammer detection, and spammer group detection that are complementary to our proposed methods. Further investigation is needed to improve the efficiency of graph calculation for practical use.

Supplementary Materials

The following are available online at https://drive.google.com/drive/folders/12hbvw4CRVftjQ3IDCCLgW6oQWz42XNpr?usp=sharing. Database S1: The experiment code and data.

Author Contributions

Conceptualization, J.-H.W.; Data curation, T.-W.L.; Methodology, T.-W.L.; Project administration, J.-H.W.; Software, T.-W.L.; Writing—original draft, J.-H.W. and T.-W.L. Writing—review & editing, X.L. All authors have read and agreed to the published version of the manuscript.

Funding

This research was partially funded by Ministry of Science and Technology, Taiwan, under the grant number of MOST109-2221-E-027-090, and also partially funded by National Taipei University of Technology–University of Science and Technology Beijing Joint Research Program under the grant number of NTUT-USTB-106-05.

Conflicts of Interest

The authors declare no conflict of interest.

References

  1. Mikolov, T.; Chen, K.; Corrado, G.; Dean, J. Efficient estimation of word representations in vector space. In Proceedings of the International Conference on Learning Representations 2013 Workshop, Scottsdale, AZ, USA, 2–4 May 2013. [Google Scholar]
  2. Pennington, J.; Socher, R.; Manning, C.D. GloVe: Global vectors for word representation. In Proceedings of the 2014 Conference on Empirical Methods in Natural Language Processing (EMNLP 2014), Doha, Qatar, 25–29 October 2014; pp. 1532–1543. [Google Scholar]
  3. Kleinberg, J.M. Authoritative sources in a hyperlinked environment. In Proceedings of the Ninth Annual ACM-SIAM Symposium on Discrete Algorithms (SODA 1998), San Francisco, CA, USA, 25–26 January 1998; pp. 668–677. [Google Scholar]
  4. Page, L.; Brin, S.; Motwani, R.; Winograd, T. The PageRank Citation Ranking: Bringing Order to the Web; Technical Report; Stanford University: Stanford, CA, USA, 1998. [Google Scholar]
  5. Li, D.; Zhang, S.; Sun, X.; Zhou, H.; Li, S.; Li, X. Modeling Information Diffusion over Social Networks for Temporal Dynamic Prediction. IEEE Trans. Knowl. Data Eng. 2017, 29, 1985–1997. [Google Scholar] [CrossRef] [Green Version]
  6. Tingmin, T.; Wen, S.; Xiang, Y.; Zhou, W. Twitter spam detection: Survey of new approaches and comparative study. Comput. Secur. 2018, 76, 265–284. [Google Scholar] [CrossRef]
  7. Ren, H.; Zhang, Z.; Xia, C. Online social spammer detection. In Proceedings of the Twenty-Eighth AAAI Conference on Artificial Intelligence, Québec City, QC, Canada, 27–31 July 2014; pp. 59–65. [Google Scholar]
  8. Wang, Z.; Gu, S.; Zhao, X.; Xu, X. Graph-based review spammer group detection. Knowl. Inf. Syst. 2017, 55, 571–597. [Google Scholar] [CrossRef]
  9. Ghosh, S.; Viswanath, B.; Kooti, F.; Sharma, N.K.; Korlam, G.; Benevenuto, F.; Ganguly, N.; Gummadi, K.P. Understanding and combating link farming in the Twitter social network. In Proceedings of the 21st International Conference on World Wide Web, Lyon, France, 16 April 2012; pp. 61–70. [Google Scholar]
  10. Hochreiter, S.; Schmidhuber, J. Long short-term memory. J. Neural. Comput. 1997, 9, 1735–1780. [Google Scholar] [CrossRef] [PubMed]
  11. Yamaguchi, Y.; Takahashi, T.; Amagasa, T.; Kitagawa, H. Turank: Twitter user ranking based on user-tweet graph analysis. In Proceedings of the International Conference on Web Information Systems Engineering (WISE 2010), Hong Kong, China, 12–14 December 2010; pp. 240–253. [Google Scholar]
  12. Huang, G.-B.; Zhu, Q.-Y.; Siew, C.-K. Extreme learning machine: Theory and applications. Neurocomputing 2006, 70, 489–501. [Google Scholar] [CrossRef]
  13. Bermingham, A.; Smeaton, A.F. On using Twitter to monitor political sentiment and predict election results. In Proceedings of the Workshop on Sentiment Analysis where AI Meets Psychology (SAAIP 2011), IJCNLP, Chiang Mai, Thailand, 13 November 2011; pp. 2–10. [Google Scholar]
  14. Maas, A.L.; Daly, R.E.; Pham, P.T.; Huang, D.; Ng, A.Y.; Potts, C. Learning word vectors for sentiment analysis. In Proceedings of the 49th Annual Meeting of the Association for Computational Linguistics: Human Language Technologies (HLT 2011), Portland, OR, USA, 19–24 June 2011; pp. 142–150. [Google Scholar]
  15. Pang, B.; Lee, L.; Vaithyanathan, S. Thumbs up? Sentiment classification using machine learning techniques. In Proceedings of the 2002 Conference on Empirical Methods in Natural Language Processing (EMNLP 2002), Philadelphia, PA, USA, 6–7 July 2002; pp. 79–86. [Google Scholar]
  16. Paul, D.; Li, F.; Teja, M.K.; Yu, X.; Frost, R. Compass: Spatio temporal sentiment analysis of us election what twitter says! In Proceedings of the 23rd ACM SIGKDD International Conference on Knowledge Discovery and Data Mining, Halifax, NS, Canada, 13–17 August 2017; pp. 1585–1594. [Google Scholar]
  17. Kim, Y. Convolutional neural networks for sentence classification. In Proceedings of the 2014 Conference on Empirical Methods in Natural Language Processing (EMNLP 2014), Doha, Qatar, 25–29 October 2014; pp. 1746–1751. [Google Scholar]
  18. Severyn, A.; Moschitti, A. Twitter sentiment analysis with deep convolutional neural networks. In Proceedings of the 38th International ACM SIGIR Conference on Research and Development in Information Retrieval (SIGIR 2015), Santiago, Chile, 9–13 August 2015; pp. 959–962. [Google Scholar]
  19. Yin, W.; Kann, K.; Yu, M.; Schütze, H. Comparative study of CNN and RNN for natural language processing. arXiv 2017, arXiv:1702.01923. [Google Scholar]
  20. Hochreiter, S.; Bengio, Y.; Frasconi, P.; Schmidhuber, J. Gradient flow in recurrent nets: The difficulty of learning long-term dependencies. In A Field Guide to Dynamical Recurrent Neural Networks; Kremer, S.C., Kolen, J.F., Eds.; IEEE Press: New York, NY, USA, 2001. [Google Scholar]
  21. Zhou, X.; Wan, X.; Xiao, J. Attention-based lstm network for cross-lingual sentiment classification. In Proceedings of the 2016 Conference on Empirical Methods in Natural Language Processing (EMNLP 2016), Austin, TX, USA, 1–5 November 2016; pp. 247–256. [Google Scholar]
  22. Al-Twairesh, N.; Al-Negheimish, H. Surface and Deep Features Ensemble for Sentiment Analysis of Arabic Tweets. IEEE Access 2019, 7, 84122–84131. [Google Scholar] [CrossRef]
  23. Sun, Q.; Wang, Z.; Li, S.; Zhu, Q.; Zhou, G. Stance detection via sentiment information and neural network model. Front. Comput. Sci. 2018, 13, 127–138. [Google Scholar] [CrossRef]
  24. Mohammad, S.; Kiritchenko, S.; Sobhani, P.; Zhu, X.; Cherry, C. SemEval-2016 task 6: Detecting stance in tweets. In Proceedings of the 10th International Workshop on Semantic Evaluation (SemEval-2016), San Diego, CA, USA, 6–17 June 2016; pp. 31–41. [Google Scholar]
  25. Ghanem, B.; Rosso, P.; Rangel, F. Stance Detection in Fake News a Combined Feature Representation. In Proceedings of the First Workshop on Fact Extraction and Verification (FEVER), EMNLP; Association for Computational Linguistics: Brussels, Belgium, 2018; pp. 66–71. [Google Scholar]
  26. Wang, L.; Niu, J.; Yu, S. SentiDiff: Combining Textual Information and Sentiment Diffusion Patterns for Twitter Sentiment Analysis. IEEE Trans. Knowl. Data Eng. 2019, 32, 2026–2039. [Google Scholar] [CrossRef]
  27. Yao, W.; Yang, Y.; Wang, D. UR rank: Micro-blog user influence ranking algorithm based on user relationship. In Proceedings of the International Conference on Collaborative Computing: Networking, Applications and Worksharing (CollaborateCom 2017), Edinburgh, UK, 11–13 December 2017; pp. 394–404. [Google Scholar]
  28. Hong, L.; Dan, O.; Davison, B.D. Predicting popular messages in Twitter. In Proceedings of the 20th International Conference on World Wide Web (WWW 2011), Hyderabad, India, 28 March–1 April 2011; pp. 57–58. [Google Scholar]
  29. Uysal, I.; Croft, W.B. User oriented tweet ranking: A filtering approach to microblogs. In Proceedings of the 20th ACM International Conference on Information and Knowledge Management (CIKM 2011), Glasgow, UK, 19–20 October 2011; pp. 2261–2264. [Google Scholar]
  30. Weng, J.; Lim, E.-P.; Jiang, J.; He, Q. Twitterrank: Finding topic-sensitive influential twitterers. In Proceedings of the Third ACM International Conference on Web Search and Data Mining (WSDM 2010), New York, NY, USA, 3–6 February 2010; pp. 261–270. [Google Scholar]
  31. Balmin, A.; Hristidis, V.; Papakonstantinou, Y. ObjectRank: Authority-Based Keyword Search in Databases. In Proceedings of the Thirtieth International Conference on Very Large Data Bases (VLDB 2004), Los Angeles, CA, USA, 30 August 2004; pp. 564–575. [Google Scholar]
  32. Nakov, P.; Ritter, A.; Rosenthal, S.; Sebastiani, F.; Stoyanov, V. SemEval-2016 task 4: Sentiment analysis in Twitter. In Proceedings of the 10th International Workshop on Semantic Evaluation (SemEval 2016), San Diego, CA, USA, 6–17 June 2016; pp. 1–18. [Google Scholar]
Figure 1. The system architecture of the proposed approach.
Applsci 10 08035 g001
Figure 2. An example user-post graph with different edge weights for posting, sharing, and retweeting actions.
Applsci 10 08035 g002
Figure 3. The performance of sentiment classification using different Word2Vec models.
Applsci 10 08035 g003
Figure 4. The performance of sentiment classification using Twitter-based pretrained GloVe embedding models.
Applsci 10 08035 g004
Figure 5. The effects of alpha on classification performance.
Applsci 10 08035 g005
Figure 6. The coverage rates for different sets of edge weighting.
Applsci 10 08035 g006
Figure 7. The effects of different types of interactions on the coverage rates.
Applsci 10 08035 g007
Table 1. Datasets for training word embedding models for sentiment classification.
ModelDatasetNumber of PostsNumber of Words
Vec-HillaryHillary20,0004933
Vec-AllHillary, Trump40,0008078
Vec-SemEvalHillary, Trump, and SemEval datasets55,98311,351
Vec-Com-150General dataset1,500,00074,248
Vec-Com-200General dataset2,000,00090,412
Vec-Com-250General dataset2,500,00098,926
Table 2. Performance Comparison for Sentiment Classification.
BayesELMCNNLSTM
Hillary datasetPrecision68.74%69.54%73.03%73.11%
Recall68.46%69.43%72.76%72.82%
F-Measure68.59%69.49%72.89%72.97%
Trump datasetPrecision69.43%69.97%71.51%71.74%
Recall69.34%69.96%71.49%71.67%
F-Measure69.39%69.97%71.50%71.71%
Table 3. Four sets of edge weights for different user actions.
Test 1Test 2Test 3Test 4
Posting0.30.70.20.3
Posted0.40.40.20.2
Sharing0.70.30.80.7
Shared0.10.10.10.0
Retweeting0.40.40.60.8
Retweeted0.10.10.10.0
Table 4. Performance comparison for different ways of opinion score calculation.
SentSoVSoVpSoVnSent-SoV
Favors Hillary306,125
(50.09%)
170,740
(26.51%)
35,477
(13.52%)
339,491
(67.24%)
316,450
(48.46%)
Favors Trump303,987
(49.90%)
473,977
(73.48%)
227,546
(86.47%)
165,085
(32.75%)
335,542
(51.53%)
Neutral50,903
(7.7%)
16,298
(2.47%)
397,992
(60.20%)
156,439
(23.67%)
9,023
(1.37%)
MAE6.96%16.60%29.59%24.11%5.34%
Table 5. Performance comparison for different user/post influence scores.
No Post Inf.Post Inf.Normal Post Inf.No User Inf.User Inf.Normal User Inf.
Favors Hillary307,132
(47.57%)
321,655
(49.28%)
316,450
(48.46%)
316,450
(48.53%)
316,450
(43.80%)
316,450
(48.46%)
Favors Trump337,424
(52.42%)
330,337
(50.71%)
335,542
(51.53%)
335,542
(51.46%)
335,542
(56.19%)
335,542
(51.53%)
Neutral16,459
(2.49%)
9023
(1.37%)
9023
(1.37%)
9023
(1.37%)
9023
(1.37%)
9023
(1.37%)
MAE4.45%6.16%5.34%5.41%0.68%5.34%
Publisher’s Note: MDPI stays neutral with regard to jurisdictional claims in published maps and institutional affiliations.

