Origin and Residence Time of Groundwater in the Shallow Coastal Aquifer of Eastern Dahomey Basin, Southwestern Nigeria, Using δ18O and δD Isotopes

 ,
,  , ,
, ,
Abstract
1. Introduction
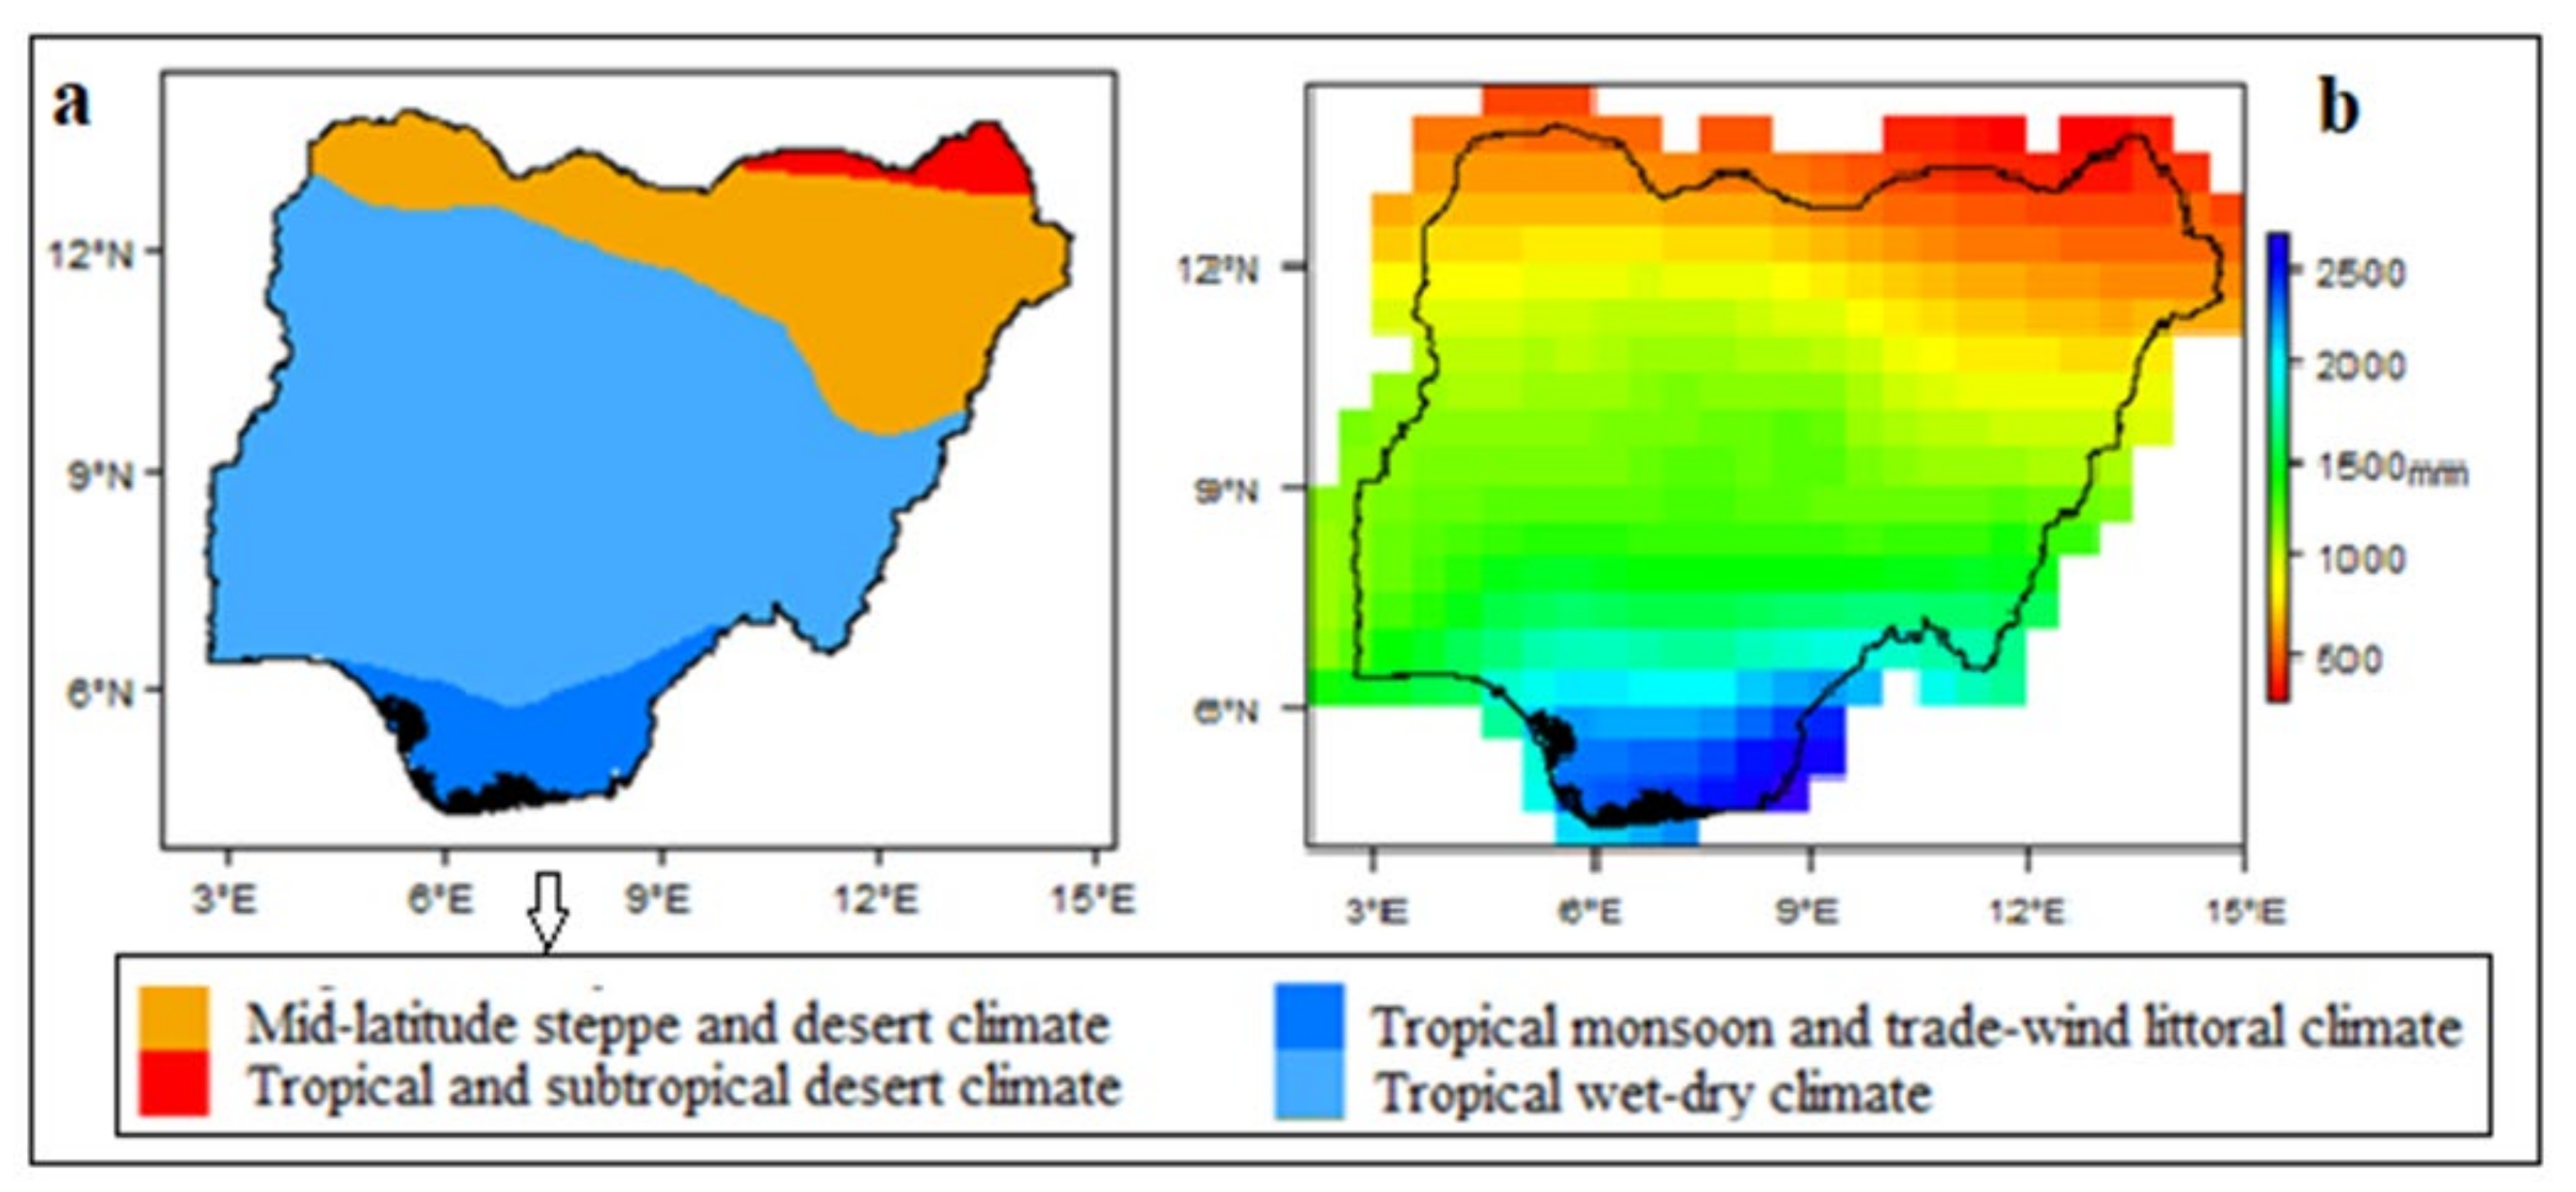
1.1. Study Area
1.2. Geology and Hydrogeology
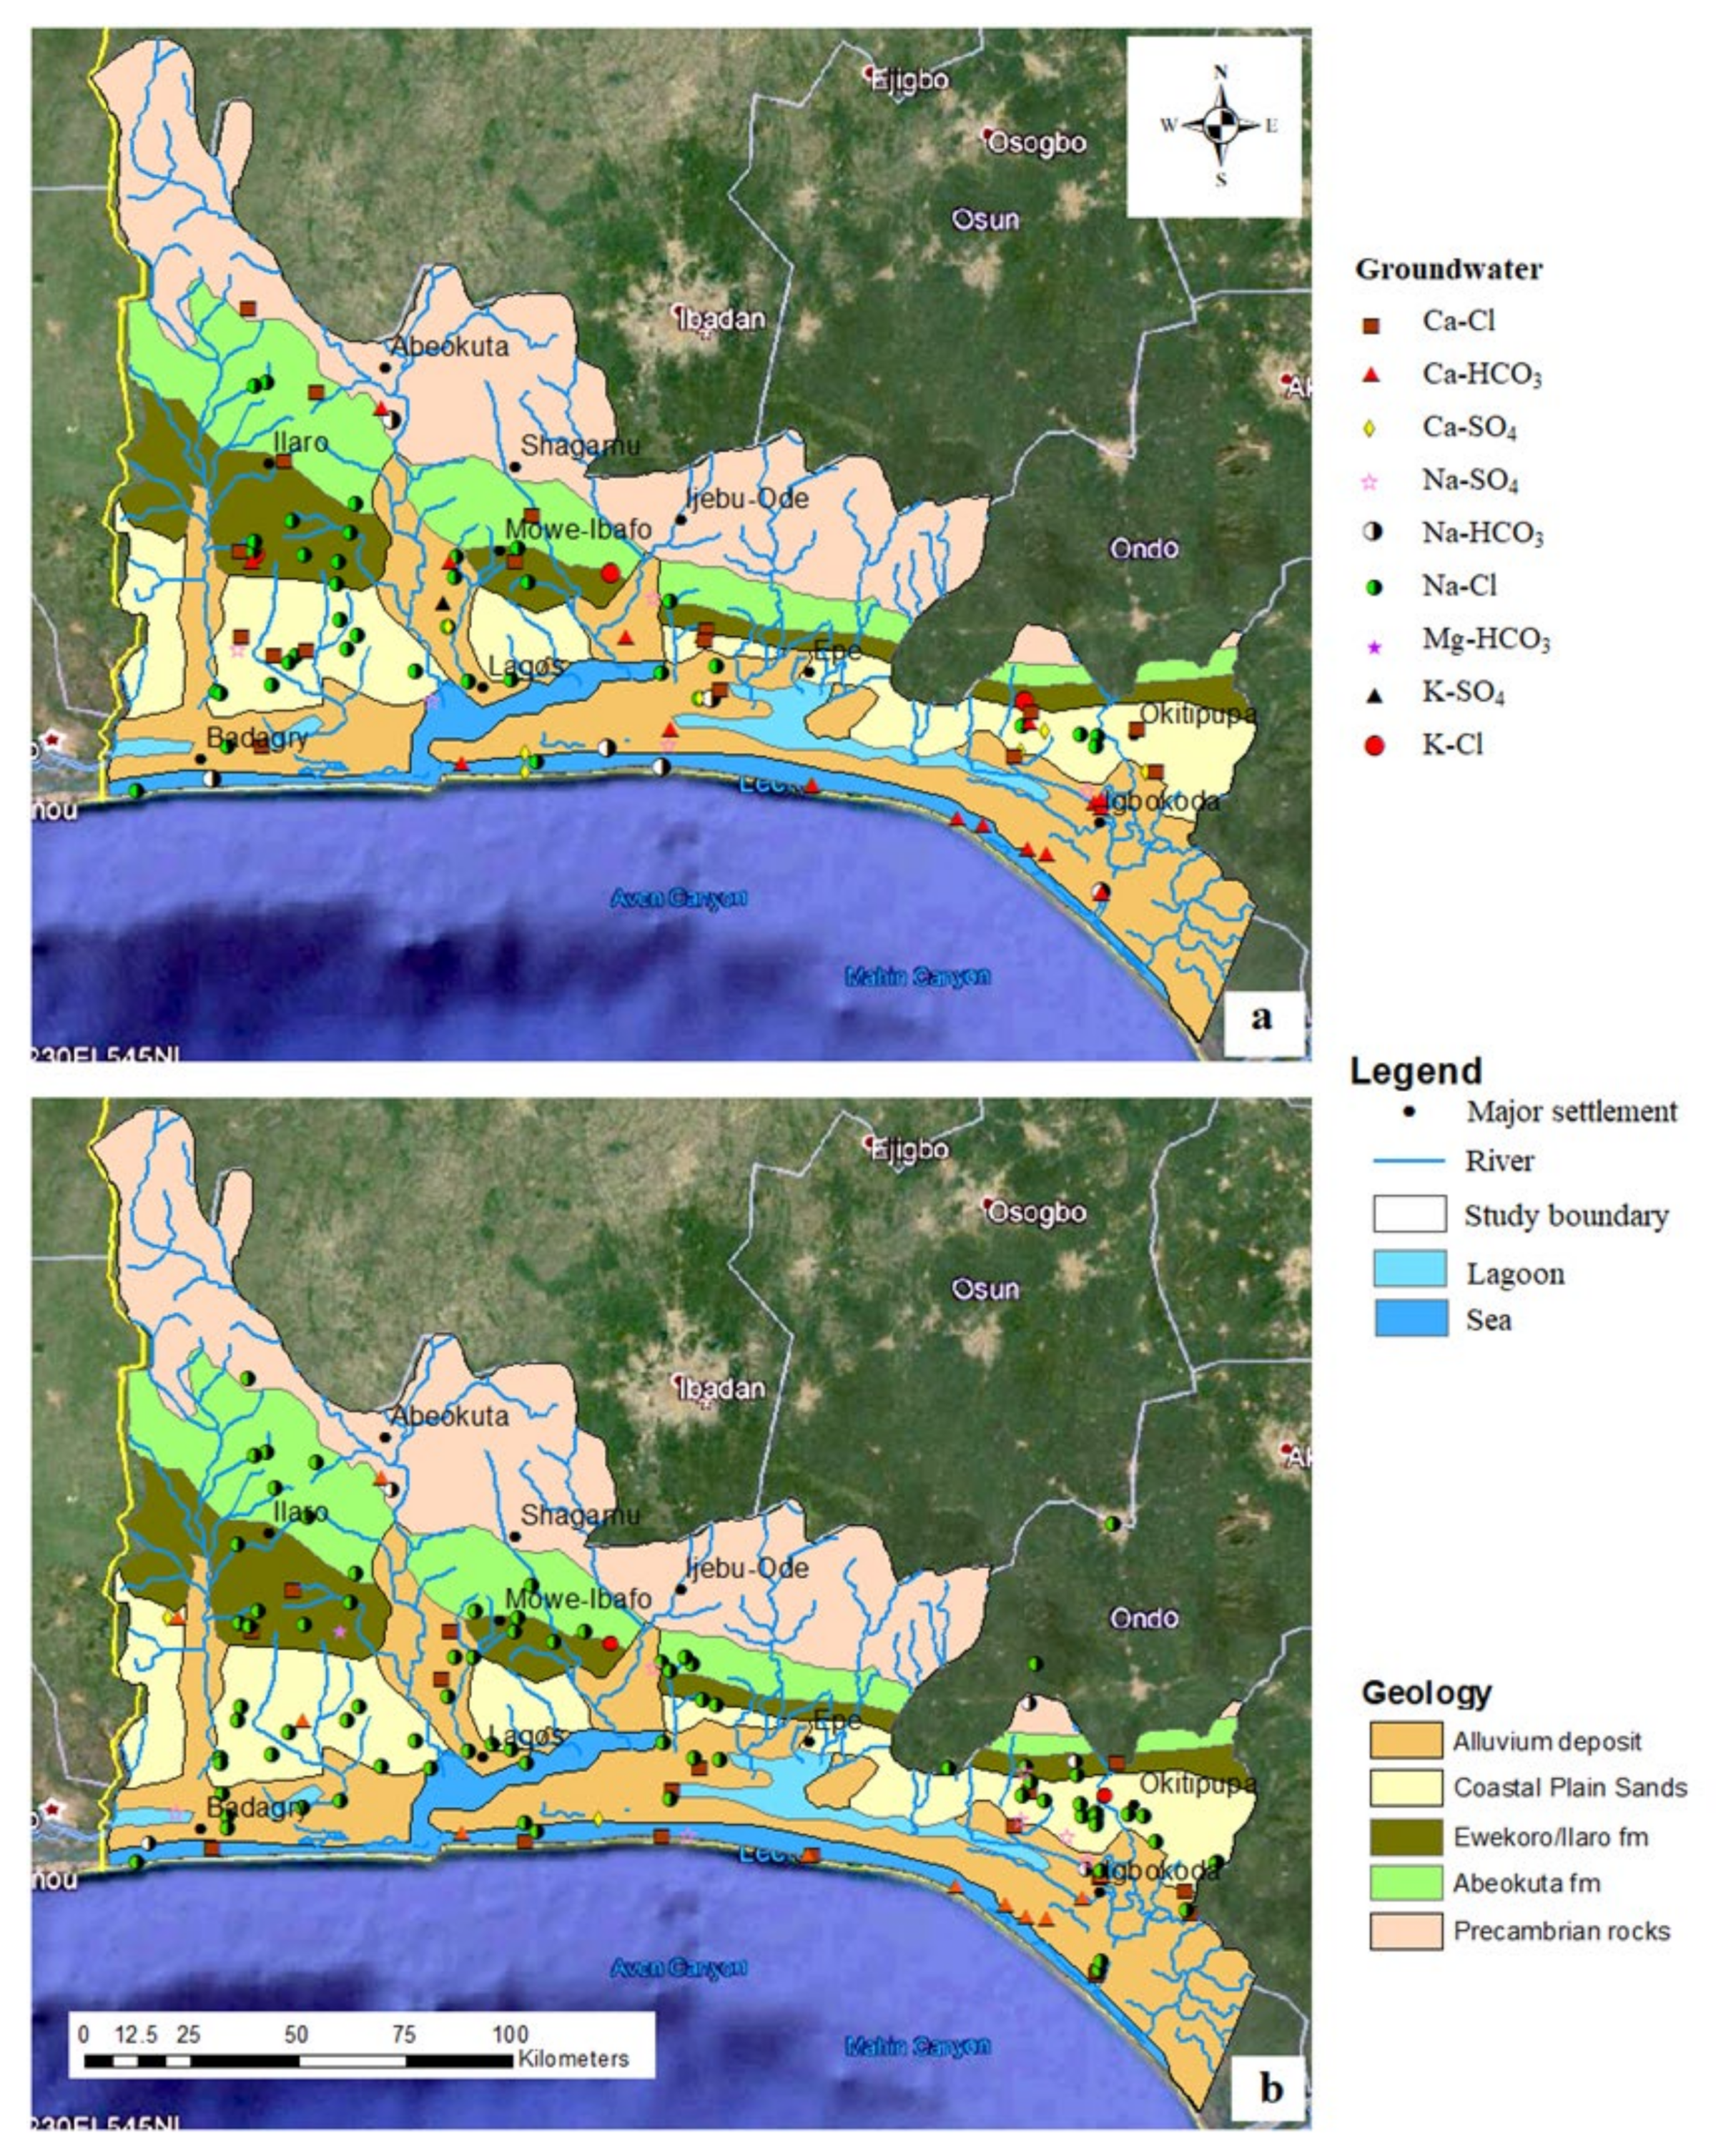
1.2.1. Geology
1.2.2. Hydrogeology
2. Materials and Methods
2.1. Field Physicochemical Measurement
2.2. Laboratory Analysis
- (a)
- Major ions and trace metals analysis: three sets of water samples were analysed. Samples labelled (A) were prepared by collecting 10 ml of each sample in a centrifuge polyethylene tube and arranged serially for Inductively Coupled Plasma (ICP-MS) analysis of cations. The same arrangement was used for the sample set labelled (B) for Ion Chromatography (IC) for the anions analysis in the Environmental Laboratory, Department of Civil and Environmental Engineering, University of Strathclyde. Alkalinity (HCO3−) was determined using a Digital Titrator (Model: 16900, HACH International, Loveland, CO, USA) and 1.6 N H2SO4 cartridge.
- (b)
- Stable isotopes analysis in groundwater: samples labelled (IS) were shipped to the Ministry of Agriculture, Irrigation and Water Development Isotope Laboratory, Blantyre, Malawi under a temperature below 4 °C for the stable isotope of δ2H and δ18O analysis. The analysis of groundwater samples was carried out following the same method of isotope water samples as described in [18] and laboratory analysis was conducted in line with International Standard Procedures with appropriate quantification and validation of results.
2.3. Regional Precipitation Data
2.4. Data Analysis and Evaluation
3. Results and Discussion
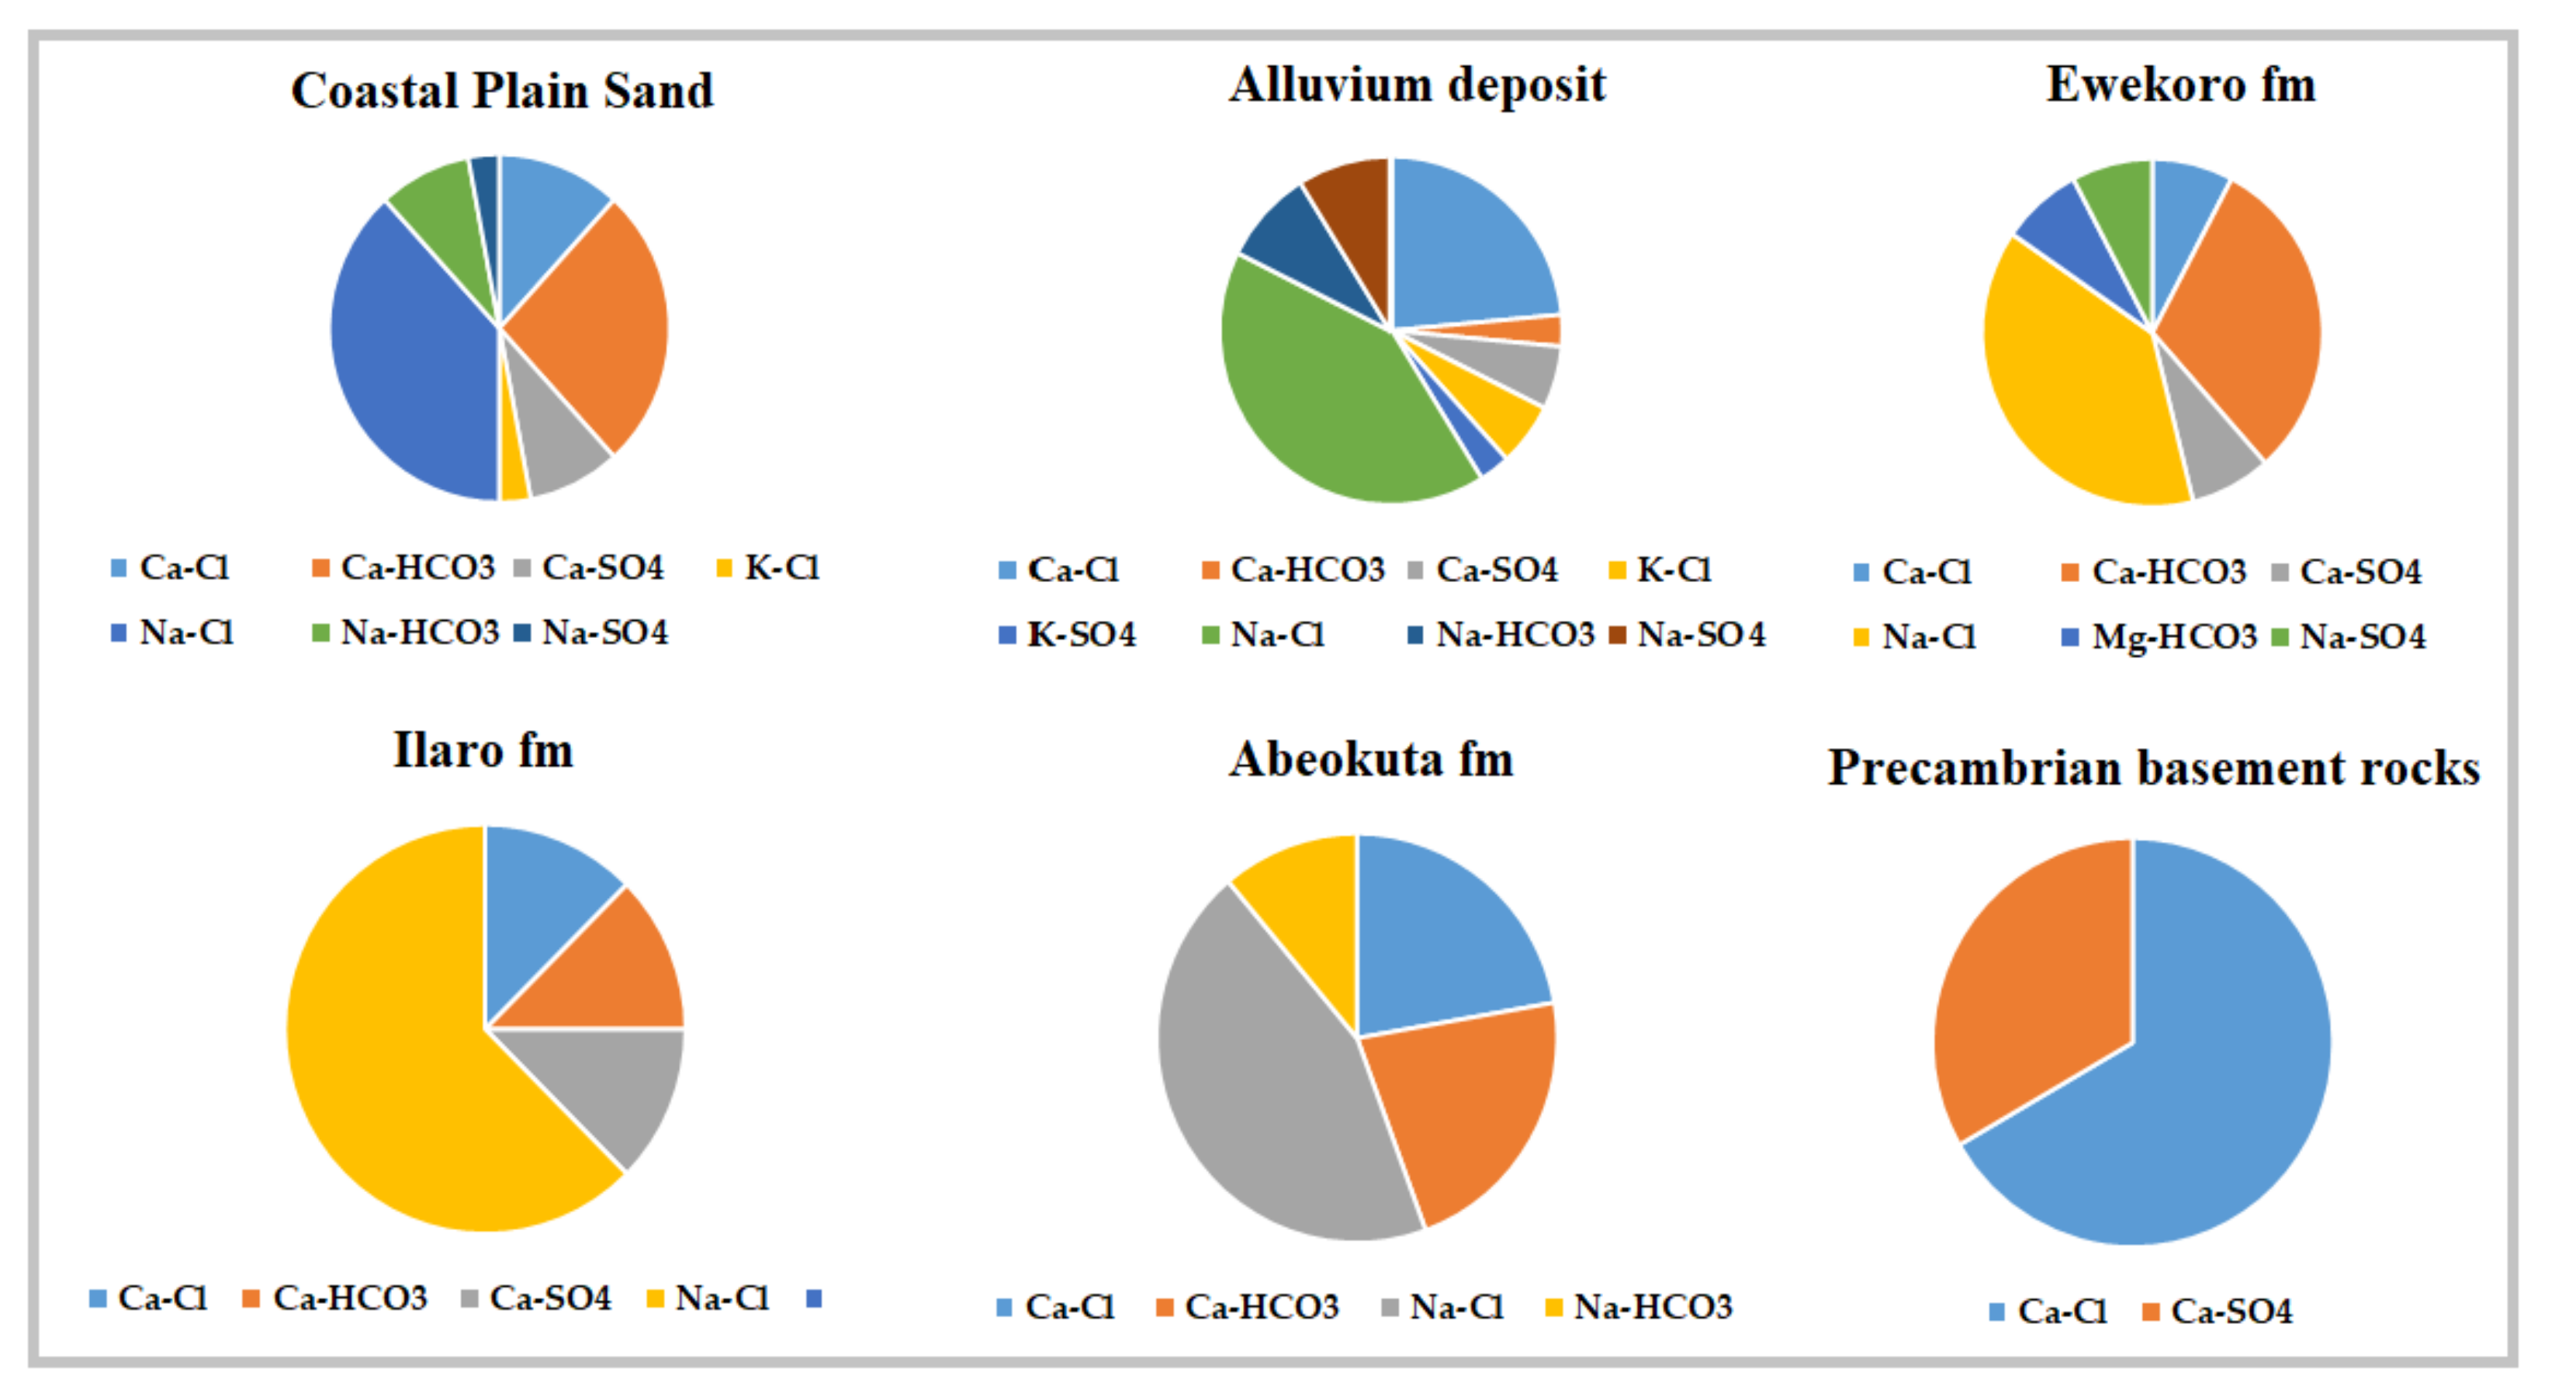
3.1. Hydrochemical Characterisation
- Equation (1).
- Equation (2).
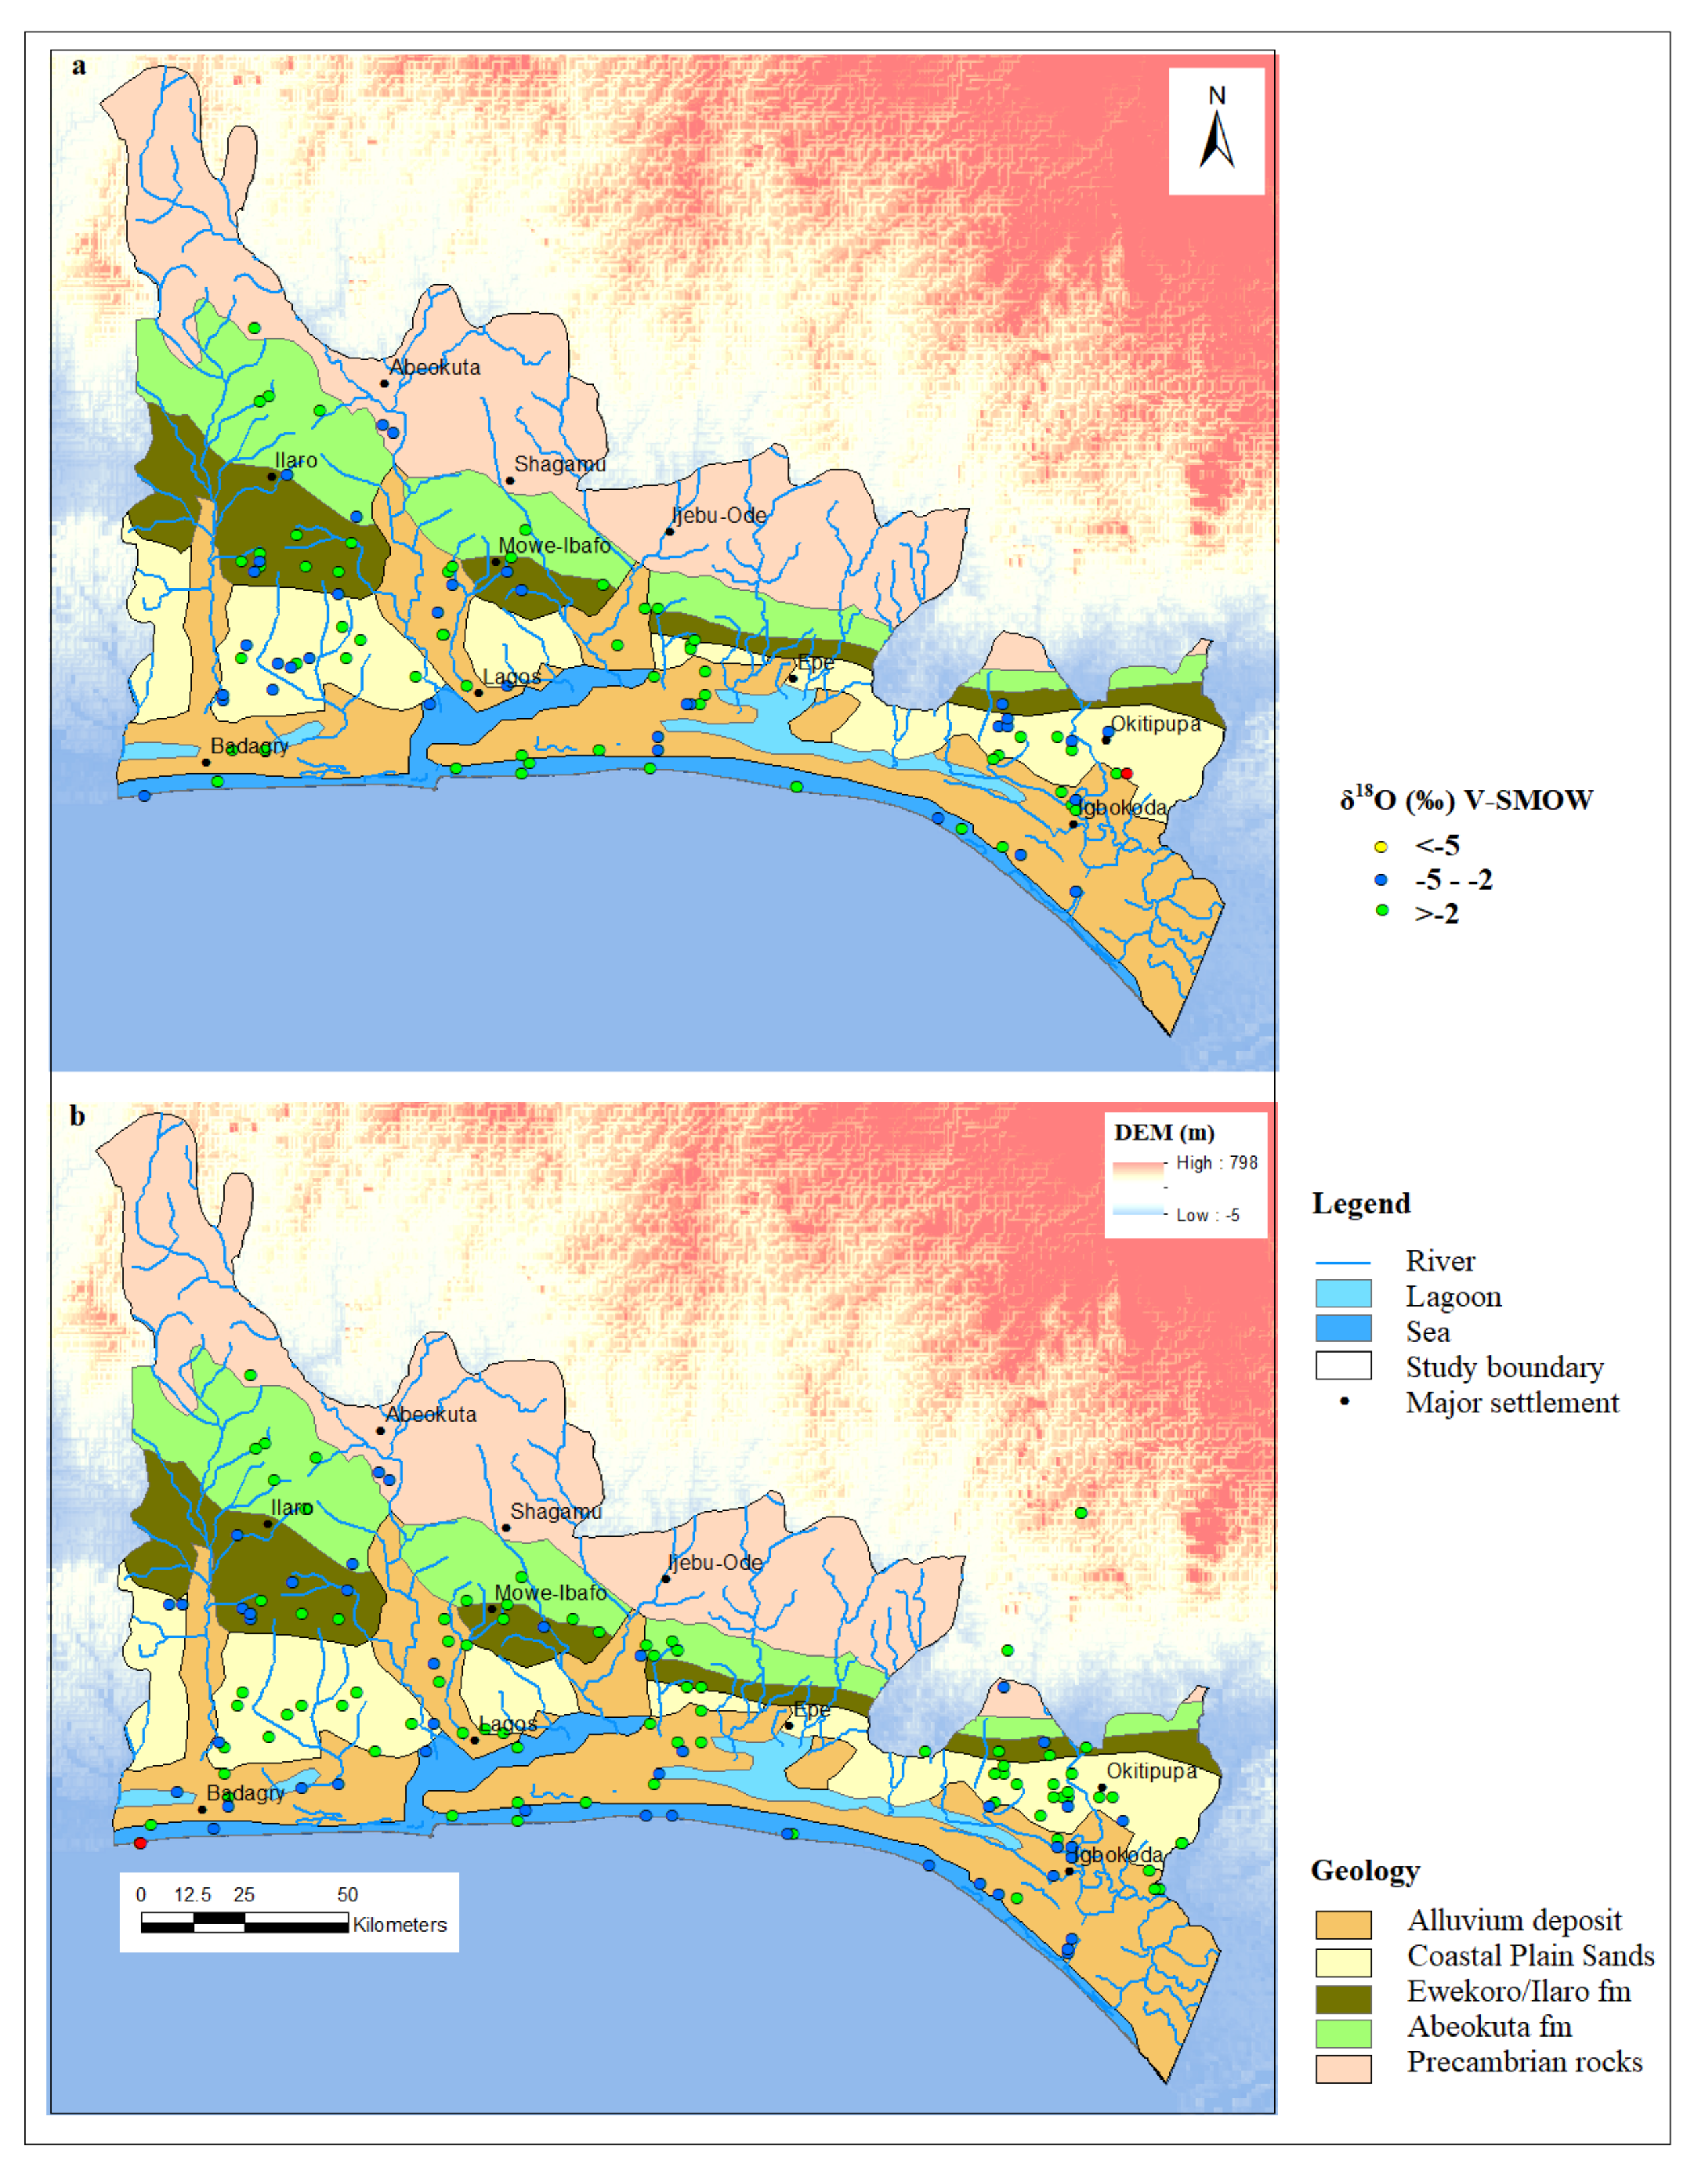
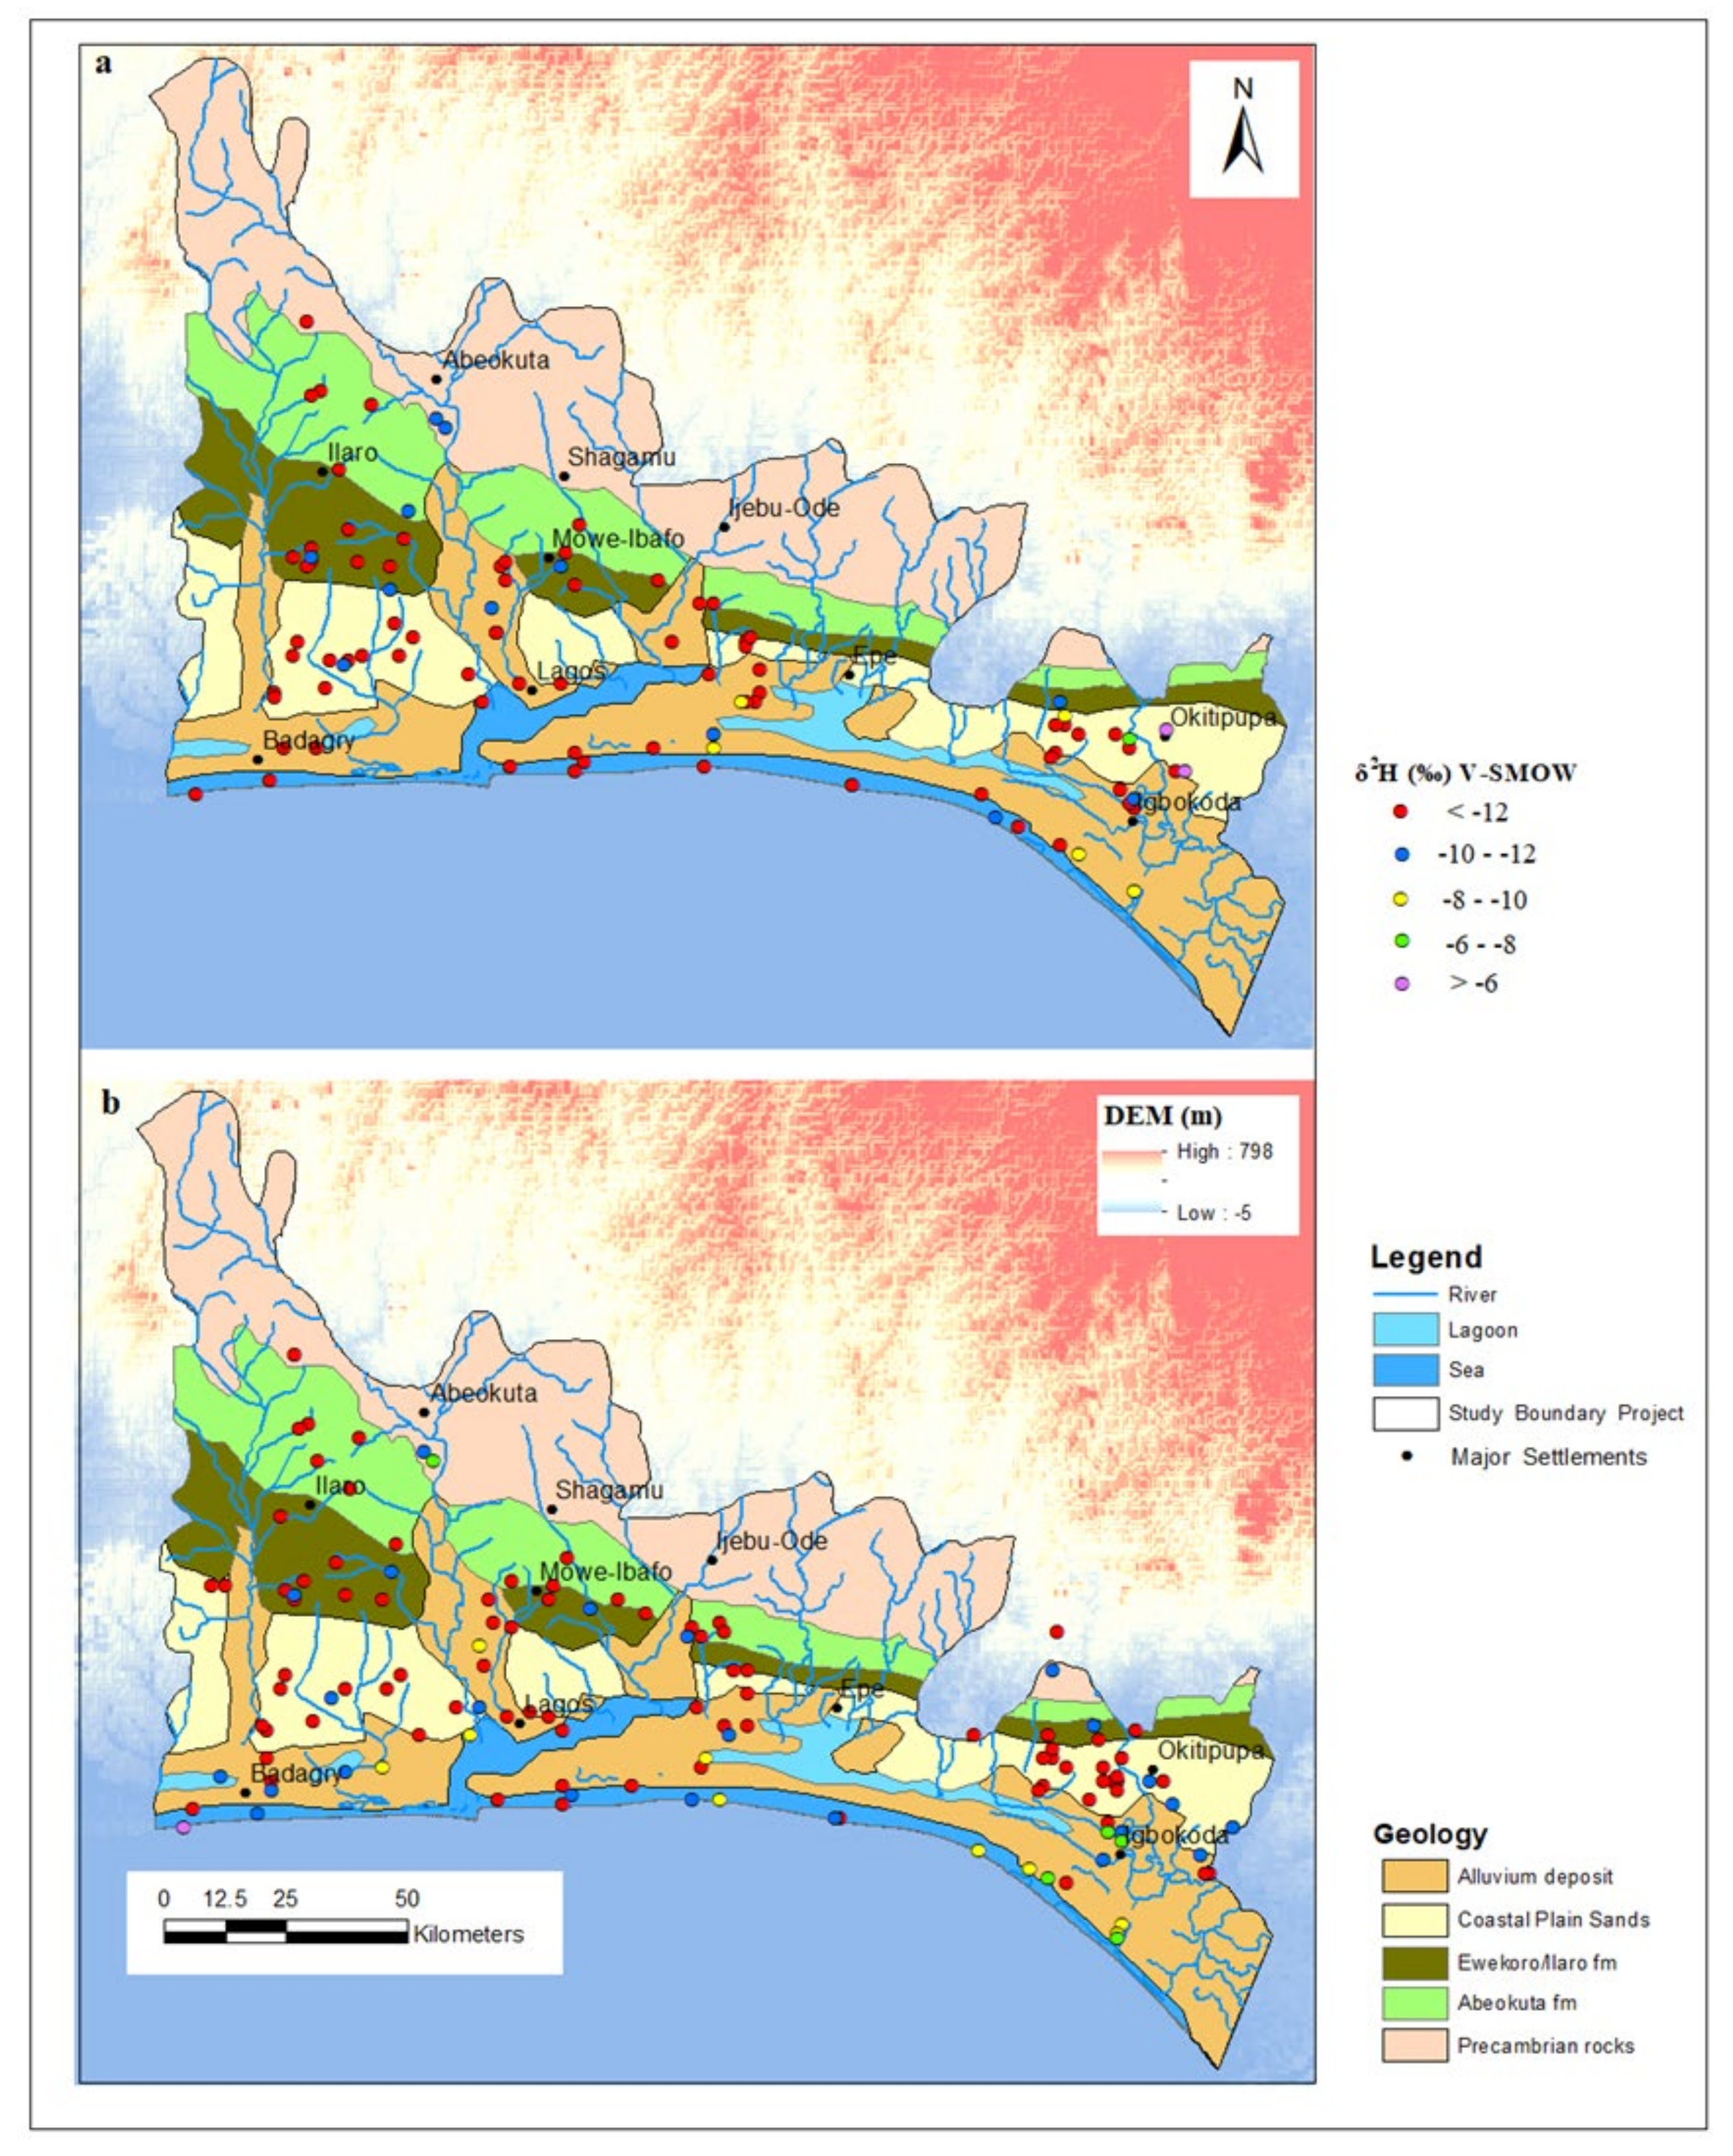
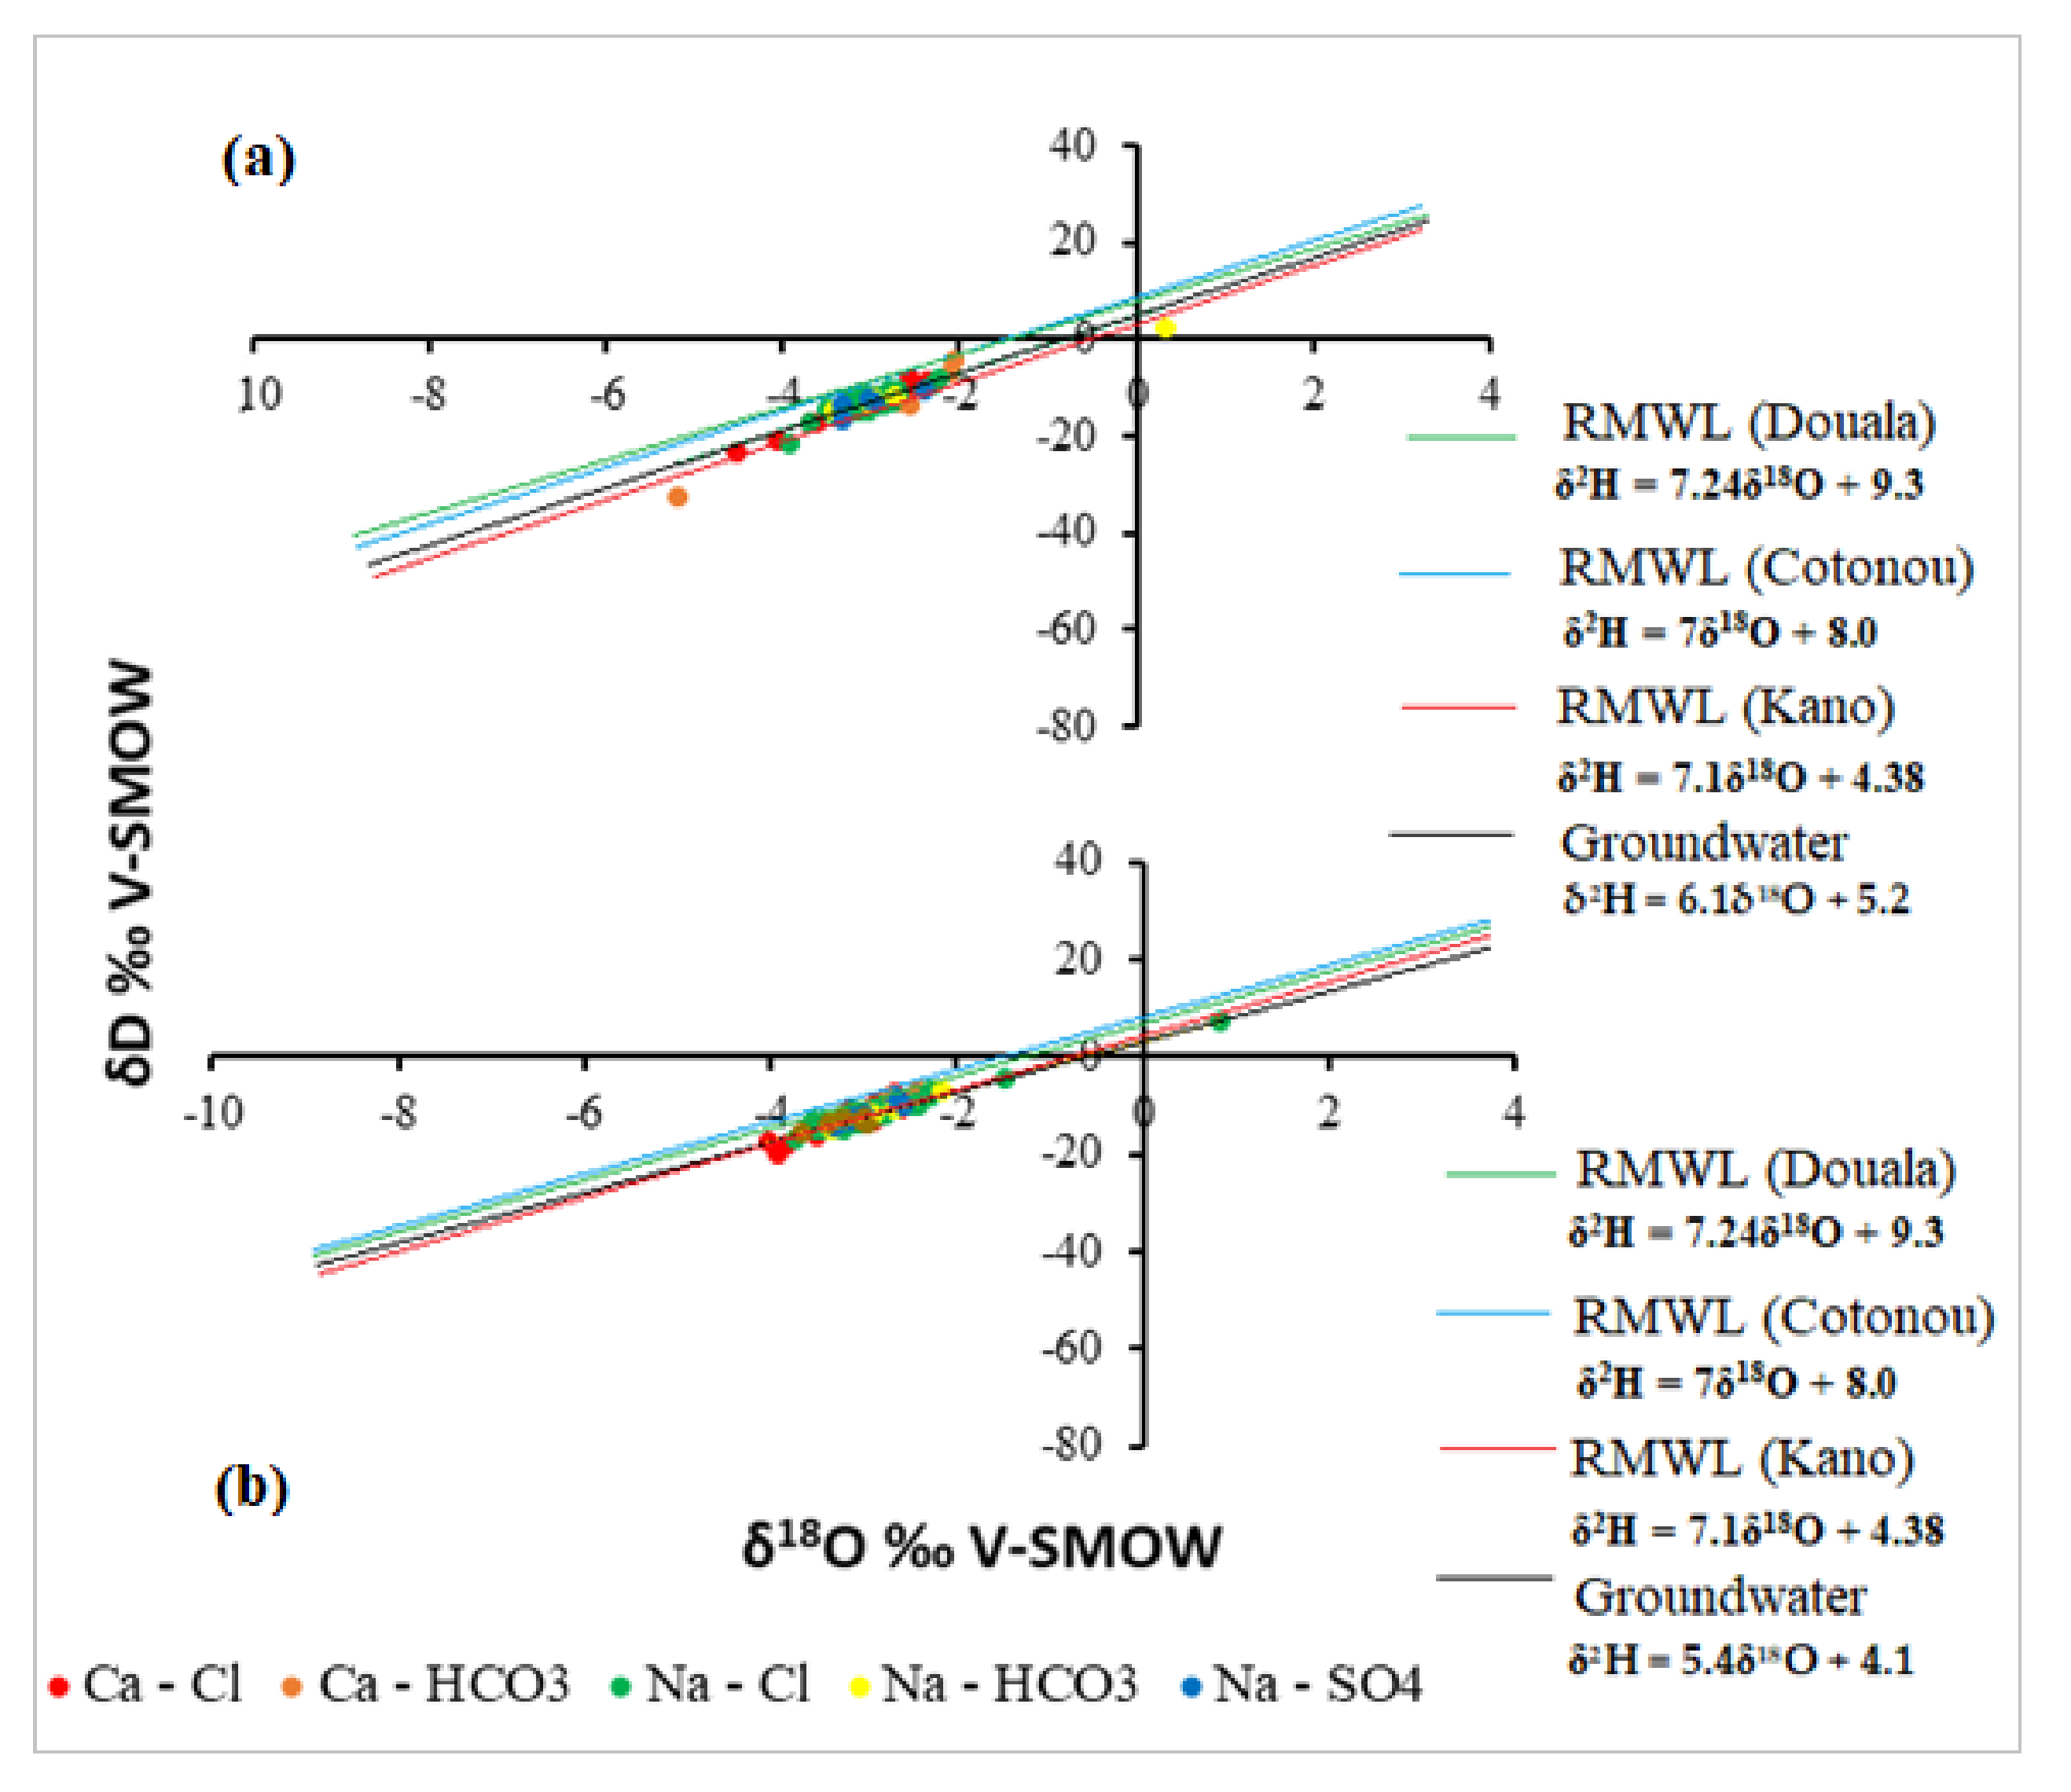
3.2. Oxygen and Deuterium Isotopes of Groundwater of EDB
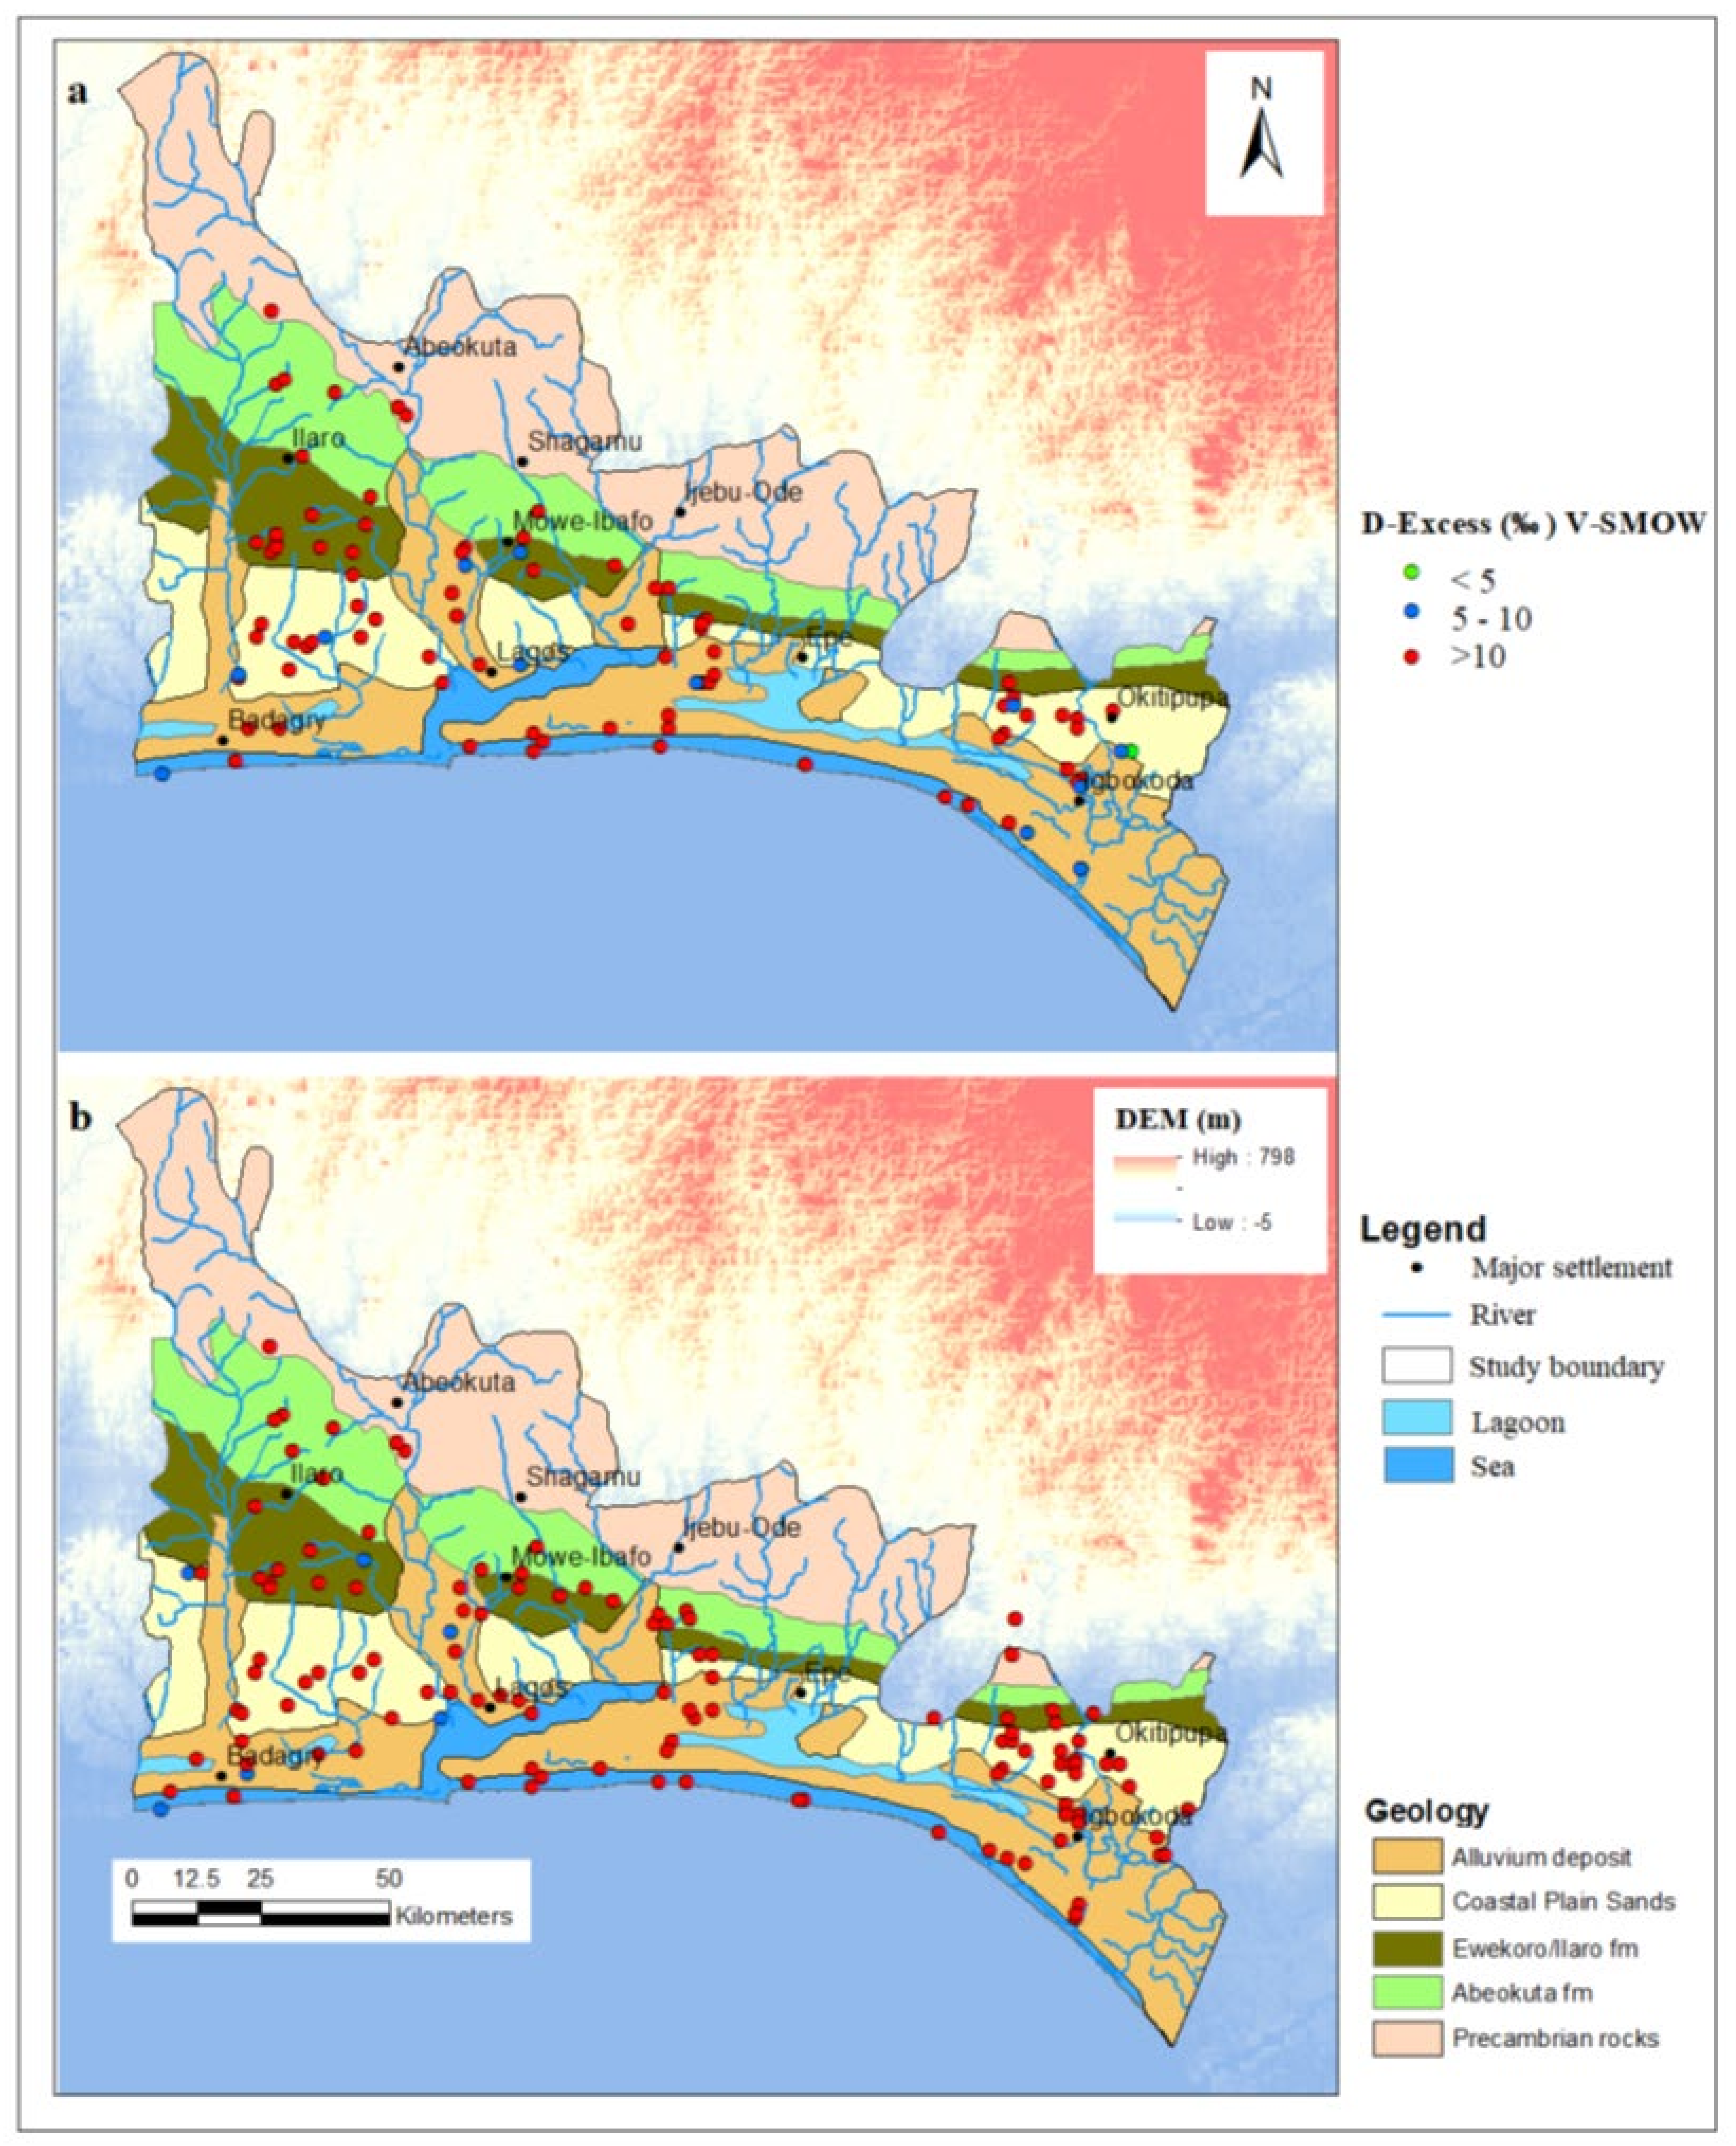
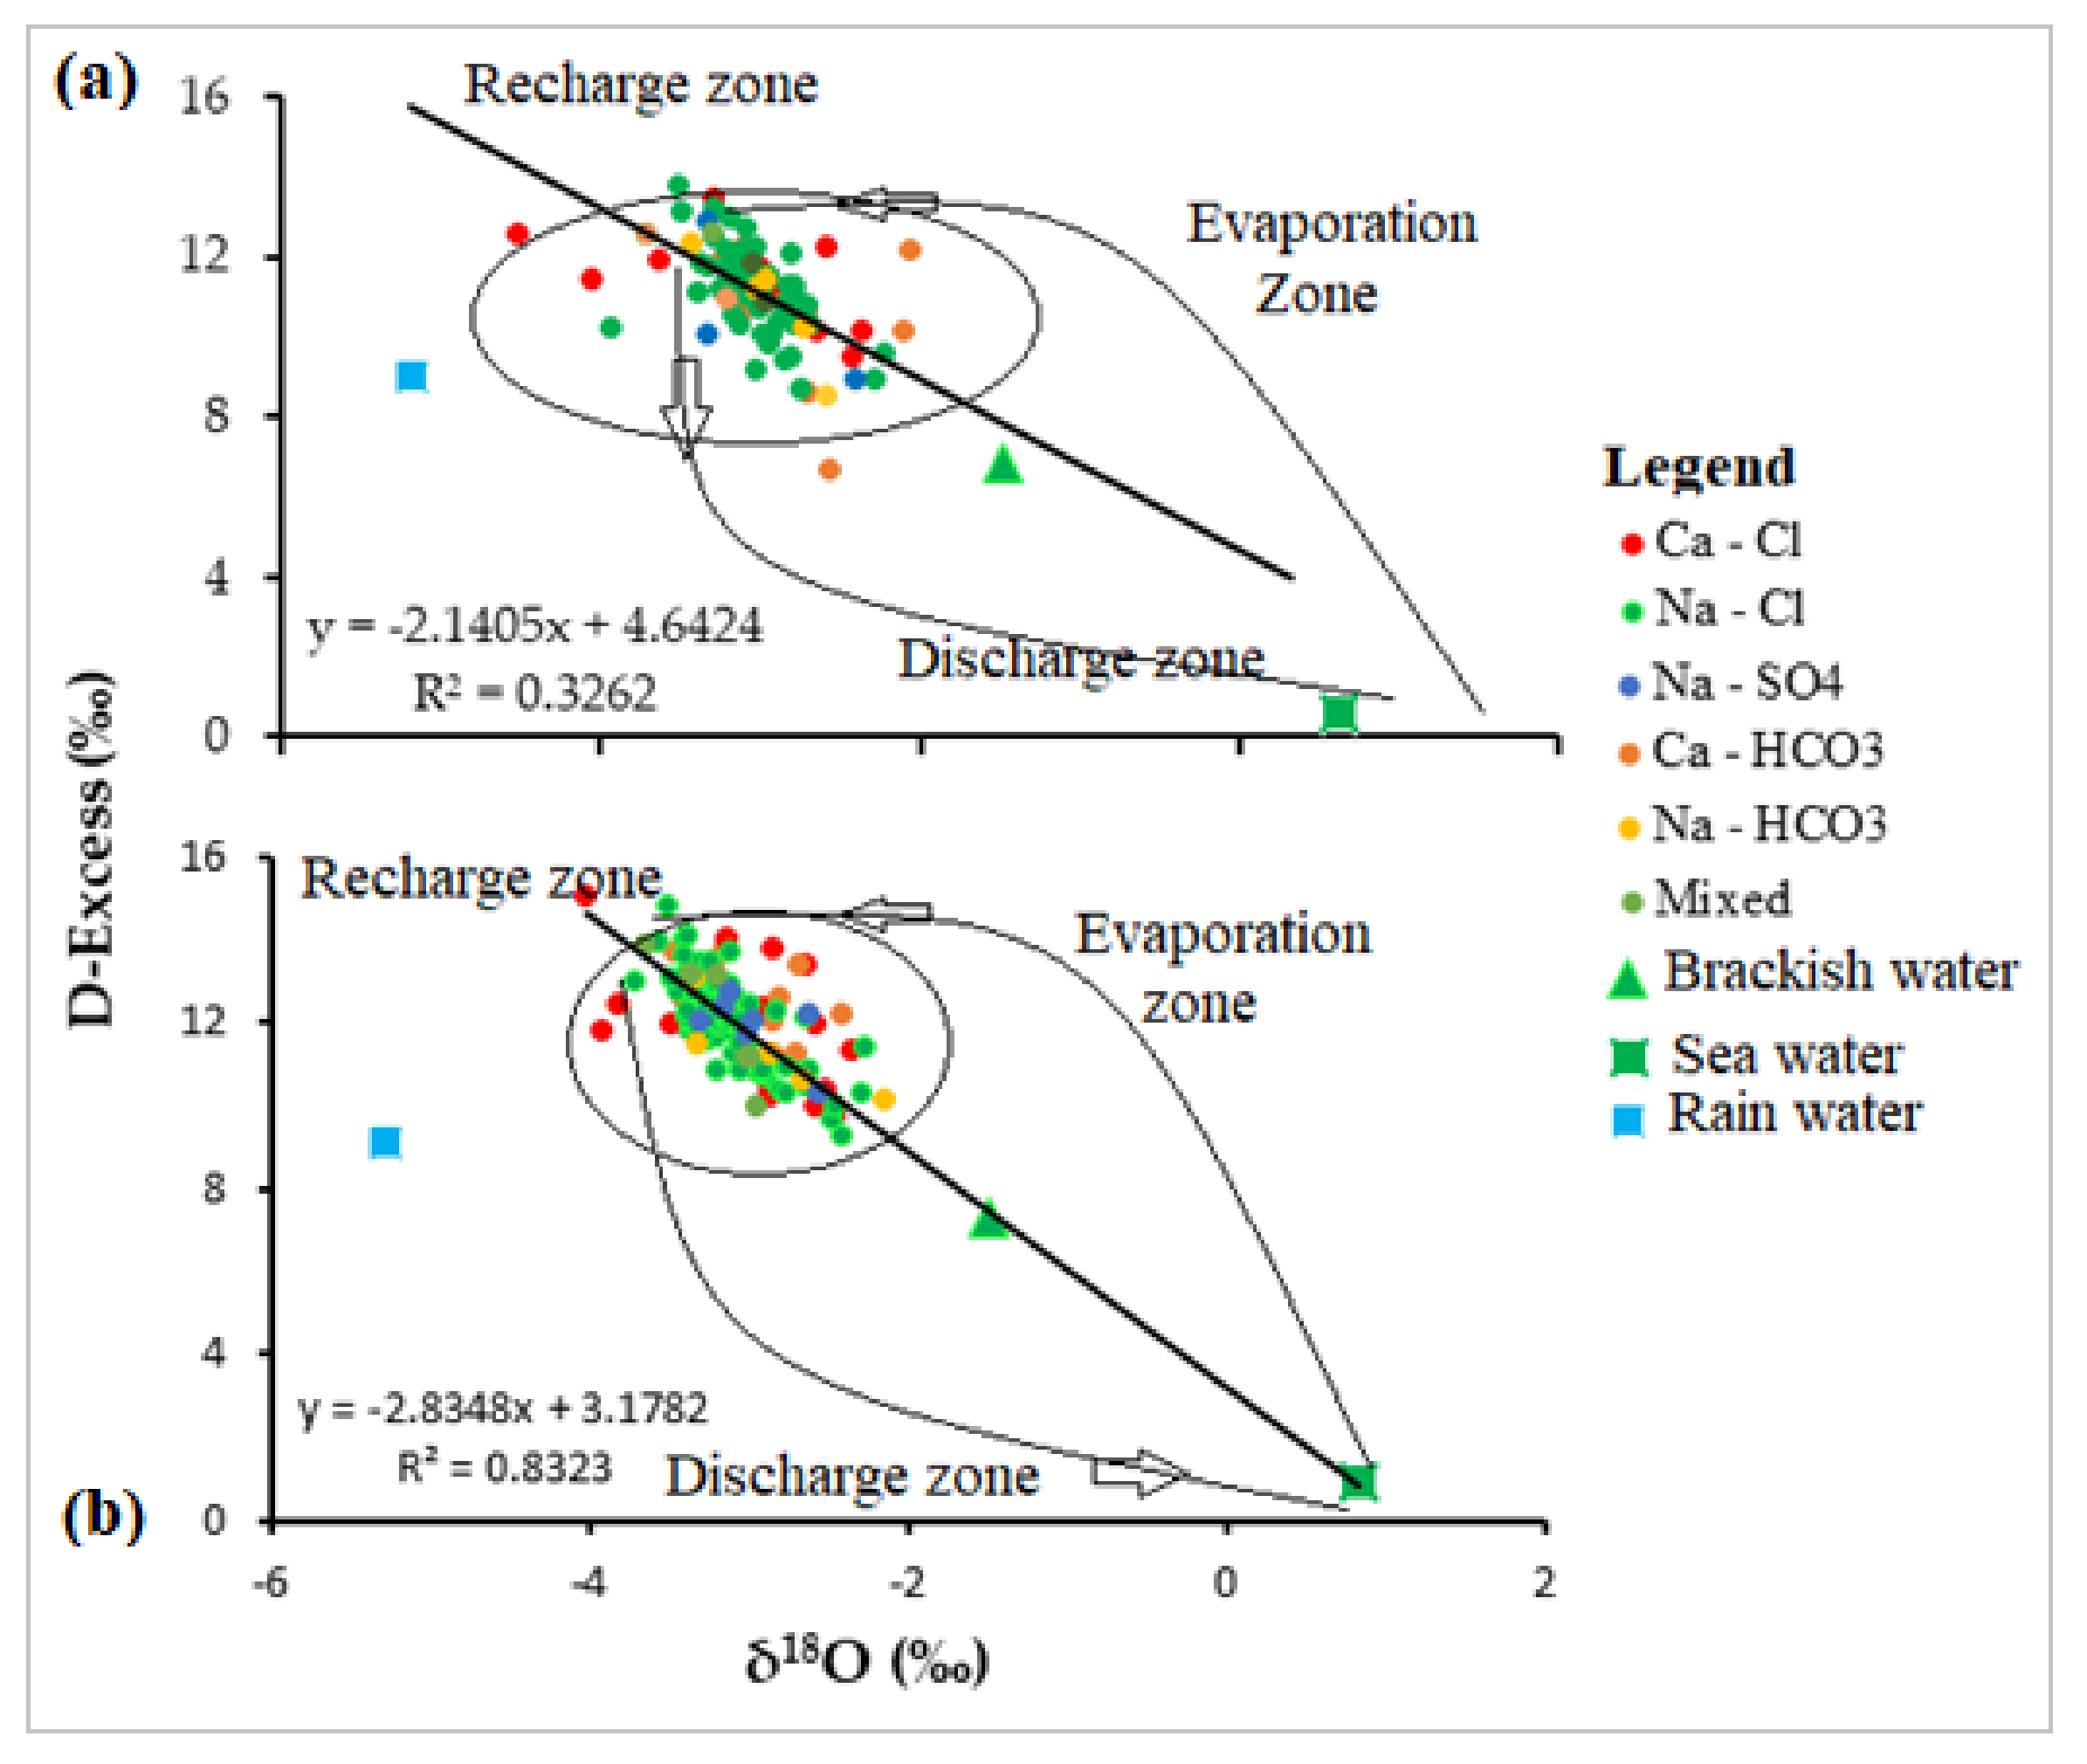
3.3. Tracing the Origin of Groundwater within the EDB Using Deuterium Excess
3.4. Description of Conceptual Design of Hydrogeochemical Characterisation of the Shallow Coastal Aquifer of EDB
3.5. The Implication for EDB Groundwater Resources Management
4. Conclusions
Author Contributions
Funding
Acknowledgments
Conflicts of Interest
References
- Gattacceca, J.C.; Vallet-Coulomb, C.; Mayer, A.; Claude, C.; Radakovitch, O.; Conchetto, E.; Hamelin, B. Isotopic and Geochemical Characterization of Salinization in the Shallow Aquifers of a Reclaimed Subsiding Zone: The Southern Venice Lagoon Coastland. J. Hydrol. 2009, 378, 46–61. [Google Scholar] [CrossRef]
- Guendouz, A.; Moulla, A.S.; Edmunds, W.M.; Zouari, K.; Shand, P.; Mamou, A. Hydrogeochemical and Isotopic Evolution of Water in the Complexe Terminal Aquifer in the Algerian Sahara. Hydrogeol. J. 2003, 11, 483–495. [Google Scholar] [CrossRef]
- Daniele, L.; Vallejos, Á.; Corbella, M.; Molina, L.; Pulido-Bosch, A. Hydrogeochemistry and Geochemical Simulations to Assess Water-Rock Interactions in Complex Carbonate Aquifers: The Case of Aguadulce (SE Spain). Appl. Geochem. 2013, 29, 43–54. [Google Scholar] [CrossRef]
- Kashaigili, J. J. Ground Water Availability and Use in Sub-Saharan Africa; CGIAR: Montpellier, France, 2012. [Google Scholar] [CrossRef]
- Lapworth, D.J.; Nkhuwa, D.C.W.; Okotto-Okotto, J.; Pedley, S.; Stuart, M.E.; Tijani, M.N.; Wright, J. Urban Groundwater Quality in Sub-Saharan Africa: Current Status and Implications for Water Security and Public Health. Hydrogeol. J. 2017, 25, 1093–1116. [Google Scholar] [CrossRef]
- Edet, A. Hydrogeology and Groundwater Evaluation of a Shallow Coastal Aquifer, Southern Akwa Ibom State (Nigeria). Appl. Water Sci. 2016, 7, 2397–2412. [Google Scholar] [CrossRef]
- Oke, S.A.; Vermeulen, D.; Gomo, M. Aquifer Vulnerability Assessment of the Dahomey Basin Using the RTt Method. Environ. Earth Sci. 2016, 75, 1–9. [Google Scholar] [CrossRef]
- Aladejana, J.A.; Kalin, R.M.; Sentenac, P.; Hassan, I. Hydrostratigraphic Characterisation of Shallow Coastal Aquifers of Eastern Dahomey Basin, S/W Nigeria, Using Integrated Hydrogeophysical Approach; Implication for Saltwater Intrusion. Geoscience 2020, 10, 65. [Google Scholar] [CrossRef]
- Hoque, M.A.; Mcarthur, J.M.; Sikdar, P.K.; Ball, J.D.; Molla, T.N. Tracing Recharge to Aquifers beneath an Asian Megacity with Cl/Br and Stable Isotopes: The Example of Dhaka, Bangladesh. J. Hydrol. 2014, 22, 1549–1560. [Google Scholar] [CrossRef]
- Fathy, A. Ionic Ratios as Tracers to Assess Seawater Intrusion and to Identify Salinity Sources in Jazan Coastal Aquifer, Saudi Arabia. Arab. J. Geosci. 2016, 9, 40. [Google Scholar] [CrossRef]
- Nwankwoala, H.O.; Ngah, S.A. Salinity dynamics: Trends and vulnerability of aquifers to contamination in the Niger Delta. Compr. J. Environ. Earth Sci. 2013, 2, 18–25. [Google Scholar]
- Mohanty, A.K.; Rao, V.V.S.G. Catena Hydrogeochemical, Seawater Intrusion and Oxygen Isotope Studies on a Coastal Region in the Puri District of Odisha, India. Catena 2019, 172, 558–571. [Google Scholar] [CrossRef]
- Lapworth, D.J.; Macdonald, A.M.; Tijani, M.N.; Darling, W. G.; Gooddy, D.C.; Bonsor, H.C. Residence Times of Shallow Groundwater in West Africa: Implications for Hydrogeology and Resilience to Future Changes in Climate. Hydrogeol. J. 2013, 21, 673–686. [Google Scholar] [CrossRef]
- Kalin, R.M.; Long, A. Application of hydrogeochemical modelling for validation of hydrologie flow modelling in the Tucson Basin aquifer, Arizona, United States of America. In Mathematical Models and Their Applications to Isotope Studies in Groundwater Hydrology; TECDOC-777; IAEA: Viena, Austria, 1994; pp. 209–254. [Google Scholar]
- Alazard, M.; Boisson, A.; Maréchal, J.; Perrin, J.; Dewandel, B.; Schwarz, T.; Pettenati, M.; Kloppman, W.; Ahmed, S. Investigation of Recharge Dynamics and Flow Paths in a Fractured Crystalline Aquifer in Semi-Arid India Using Borehole Logs: Implications for Managed Aquifer Recharge. Hydrogeol. J. 2015, 35–57. [Google Scholar] [CrossRef]
- Huneau, F.; Dakoure, D.; Celle-Jeanton, H.; Vitvar, T.; Ito, M.; Traore, S.; Compaore, N.F.; Jirakova, H.; Le Coustumer, P. Flow Pattern and Residence Time of Groundwater within the South-Eastern Taoudeni Sedimentary Basin (Burkina Faso, Mali). J. Hydrol. 2011, 409, 423–439. [Google Scholar] [CrossRef]
- He, J.; Ma, J.; Zhao, W.; Sun, S. Groundwater Evolution and Recharge Determination of the Quaternary Aquifer in the Shule River Basin, Northwest China. Hydrogeol. J. 2015, 23, 1745–1759. [Google Scholar] [CrossRef]
- Banda, L.C.; Rivett, M.O.; Kalin, R.M.; Zavison, A.S.K.; Phiri, P.; Kelly, L.; Chavula, G.; Kapachika, C.C.; Nkhata, M.; Kamtukule, S.; et al. Water-Isotope Capacity Building and Demonstration in a Developing World Context: Isotopic Baseline and Conceptualization of a Lake Malawi Catchment. Water 2019, 11, 2600. [Google Scholar] [CrossRef]
- Krishnaraj, S.; Murugesan, V.K.V.; Sabarathinam, C.; Paluchamy, A.; Ramachandran, M. Use of hydrochemistry and stable isotopes as tools for groundwater evolution and contamination investigations. J. Geosci. 2012, 1, 16–25. [Google Scholar] [CrossRef]
- Joshi, S.K.; Rai, S.P.; Sinha, R.; Gupta, S.; Densmore, A.L.; Rawat, Y.S.; Shekhar, S. Tracing Groundwater Recharge Sources in the Northwestern Indian Alluvial Aquifer Using Water Isotopes (Δ18O, Δ2H And3H). J. Hydrol. 2018, 559, 835–847. [Google Scholar] [CrossRef]
- Aladejana, J.A.; Kalin, R.M.; Sentenac, P.; Hassan, I. Assessing the Impact of Climate Change on Groundwater Quality of the Shallow Coastal Aquifer of Eastern Dahomey Basin, Southwestern Nigeria. Water 2020, 12, 224. [Google Scholar] [CrossRef]
- Oke, S.A. Evaluation of the Vulnerability of Selected Aquifer Systems in the Eastern Dahomey Basin, South-Western Nigeria. Ph.D. Thesis, University of the Free State, Bloemfontein, South Africa, 2015. [Google Scholar]
- Omole, D.O. Sustainable Groundwater Exploitation in Nigeria. J. Water Resour. Ocean Sci. 2013, 2, 9. [Google Scholar] [CrossRef]
- Ayoade, J.O. Water Resources and their Development in Nigeria Recent Events of Flood, Drought and Urban Water Shortages as Well as Water Pollution in Nigeria and Various Parts of the World Have Underlined the Need for the Rational Planning of Nigeria’s Water Reso. Hydrol. Sci. Sci. Hydrol. 1975, 4, 581–591. [Google Scholar]
- Ahmed, A.; Clark, I. Groundwater Flow and Geochemical Evolution in the Central Flinders Ranges, South Australia. Sci. Total Environ. 2016, 572, 837–851. [Google Scholar] [CrossRef] [PubMed]
- Shin, W.J.; Park, Y.; Koh, D.C.; Lee, K.S.; Kim, Y.; Kim, Y. Hydrogeochemical and Isotopic Features of the Groundwater Flow Systems in the Central-Northern Part of Jeju Island (Republic of Korea). J. Geochem. Explor. 2017, 175, 99–109. [Google Scholar] [CrossRef]
- Peter Bauer-Gottwein, B.N.; Gondwe, L.C.; Daan, H.; Kgotlhang, L.; Zimmermann, S. Hydrogeophysical exploration of three-dimensional salinity anomalies with the time-domain electromagnetic method (TDEM). J. Hydrol. 2010, 380, 318–329. [Google Scholar] [CrossRef]
- Kalin, R.M. Basic Concepts and Formulations for Isotope-Geochemical Process Investigations, Procedures and Methodologies of Geochemical Modelling of Groundwater Systems. In Manual on Mathematical Models in Isotope Hydrology; Yurtsever, Y., Ed.; TECHDOC 910; IAEA: Vienna, Austria, 1995. [Google Scholar]
- Clark, I.D.; Fritz, P. Environmental Isotopes in Hydrogeology; Lewis Publishers: Boca Raton, FL, USA, 1997. [Google Scholar]
- Gagné, S.; Larocque, M.; Pinti, D.L.; Saby, M.; Meyzonnat, G.; Méjean, P. Benefits and Limitations of Using Isotope-Derived Groundwater Travel Times and Major Ion Chemistry to Validate a Regional Groundwater Flow Model: Example from the Centre-Du-Québec Region, Canada. Can. Water Resour. J. 2017, 1784, 1–19. [Google Scholar] [CrossRef]
- Oloruntola, M.O.; Adeyemi, G.O.; Bayewu, O.; Obasaju, D.O. Hydro-Geophysical Mapping of Occurrences and Lateral Continuity of Aquifers in Coastal and Landward Parts of Ikorodu, Lagos, Southwestern Nigeria. Int. J. Energy Water Resour. 2019, 3, 219–231. [Google Scholar] [CrossRef]
- Adelana, S.M.A.; Olasehinde, P.I.; Bale, R.B.; Vrbka, P.; Edet, A.E.; Goni, I.B. An Overview of the Geology and Hydrogeology of Nigeria. Q. J. Eng. Geol. Hydrogeol. 1996, 29, S1–S12. [Google Scholar] [CrossRef]
- Adegoke, O.S.; Omatsola, M.E. Tectonic evolution and cretaceous stratigraphy of the Dahomey Basin. Niger. J. Min. Geol. 1981, 18, 130–137. [Google Scholar]
- Jones, H.A; Hockey, R. The geology of part of Southwestern Nigeria. GSN Bull. 1964, 225, 229–237. [Google Scholar]
- Solomon, O.; Olabode1, M.Z.M. Depositional Facies and Sequence. Int J. Geosci. 2016, 7, 210–228. [Google Scholar]
- Longe, E.O.; Malomo, S.; Olorunniwo, M.A. Hydrogeology of Lagos Metropolis. J. African Earth Sci. 1987, 6, 163–174. [Google Scholar] [CrossRef]
- Longe, E.O. Groundwater Resources Potential in the Coastal Plain Sands Aquifers, Lagos, Nigeria. Res. J. Environ. Earth Sci. 2011, 3, 1–7. [Google Scholar]
- Offodile, M.E. The Hydrogeology of Coastal Areas of Southeastern States of Nigeria. J. Min. Geol. 1971, 14, 94–101. [Google Scholar]
- Faleye, E.T.; Olorunfemi, M.O. Aquifer Characterization and Groundwater Potential Assessment of the Sedimentary Basin of Ondo State 1 2. Ife J. Sci. 2015, 17, 429–439. [Google Scholar]
- Fatoba, J.O.; Omolayo, S.D.; Adigun, E.O. Using Geoelectric Soundings for Estimation of Hydraulic Characteristics of Aquifers in the Coastal Area of Lagos, Southwestern Nigeria. Int. Lett. Nat. Sci. 2014, 11, 30–39. [Google Scholar] [CrossRef]
- Adeoti, L.; Alile, O.M.; Uchegbulam, O. Geophysical Investigation of Saline Water Intrusion into Freshwater Aquifers: A Case Study of Oniru, Lagos State. Sci. Res. Essays 2010, 5, 248–259. [Google Scholar]
- Oteri, A.U.; Atolagbe, F.P. Saltwater Intrusion into Coastal Aquifers in Nigeria. In Proceedings of the Second International Conference on Saltwater Intrusion and Coastal Aquifers—Monitoring, Modeling, and Management, Yucatán, México, 30 March–2 April 2003; pp. 1–15. [Google Scholar]
- Dehnavi, A.; Sarikhani, R.; Nagaraju, D. Hydro Geochemical and Rock Water Interaction Studies in East of Kurdistan, NW of Iran. Int. J. Env. Sci. Res. 2011, 1, 16–22. [Google Scholar]
- Fu, C.; Li, X.; Ma, J.; Liu, L.; Gao, M.; Bai, Z. A Hydrochemistry and Multi-Isotopic Study of Groundwater Origin and Hydrochemical Evolution in the Middle Reaches of the Kuye River Basin. Appl. Geochem. 2018, 98, 82–93. [Google Scholar] [CrossRef]
- Narany, T.S.; Ramli, M.F.; Aris, A.Z.; Nor, W.; Sulaiman, A.; Juahir, H.; Fakharian, K. Identification of the Hydrogeochemical Processes in Groundwater Using Classic Integrated Geochemical Methods and Geostatistical Techniques, in Amol-Babol Plain, Iran. Sci. World J. 2014, 2014, 1–15. [Google Scholar] [CrossRef]
- Oli, I.C.; Okeke, O.C.; Abiahu, C.M.G.; Anifowose, F.A.; Fagorite, V.I. A review of the geology and mineral resources of Dahomey basin, southwestern Nigeria. Int. J. Environ. Sci. Nat. Res. 2019, 21, 556055. [Google Scholar] [CrossRef]
- Al-Charideh, A.; Kattaa, B. Isotope Hydrology of Deep Groundwater in Syria: Renewable and Non-Renewable Groundwater and Paleoclimate Impact. Hydrogeol. J. 2016, 24, 79–98. [Google Scholar] [CrossRef]
- Carol, E.; Kruse, E.; Mas-Pla, J. Hydrochemical and Isotopical Evidence of Ground Water Salinization Processes on the Coastal Plain of Samborombon Bay, Argentina. J. Hydrol. 2009, 335–345. [Google Scholar] [CrossRef]
- Jamiu, A.A.; Kalin, R.M.; Hassan, I.; Sentenac, P. Hydrogeochemical and isotopic characterization of coastal groundwater of eastern dahomey basin, Southwestern Nigeria. Geosciences 2020, 26, 65–71. [Google Scholar]
- Vengosh, A.; Hening, S.; Ganor, J.; Mayer, B.; Weyhenmeyer, C.E.; Bullen, T.D.; Paytan, A. New Isotopic Evidence for the Origin of Groundwater from the Nubian Sandstone Aquifer in the Negev, Israel. Appl. Geochem. 2007, 22, 1052–1073. [Google Scholar] [CrossRef]
- JICA. The Project for Review and Update of Nigeria National Water Resources; Federal Republic of Nigeria: Abuja, Nigeria, 2014.
- Aladejana, J.A.; Kalin, R.M.; Sentenac, P.; Hassan, I. Groundwater Quality Index as a Hydrochemical Tool for Monitoring Saltwater Intrusion into Coastal Freshwater Aquifer of Eastern Dahomey Basin, Southwestern Nigeria. Groundw. Sustain. Dev. 2020, 25, under review. [Google Scholar] [CrossRef]


| Parameter | Wet Season | Dry Season | ||||||
|---|---|---|---|---|---|---|---|---|
| Min | Max | Aver | Std Dev | Min | Max | Aver | Std Dev | |
| Ca2+ | 0.3 | 374.0 | 16.5 | 41.2 | 0.2 | 448.5 | 21.6 | 55.2 |
| Mg2+ | 0.0 | 1377.0 | 18.4 | 140.4 | 0.1 | 1125.0 | 16.1 | 102.2 |
| Na+ | 0.1 | 8857.0 | 106.8 | 902.8 | 0.6 | 10,310.0 | 112.7 | 907.4 |
| K+ | 0.1 | 447.1 | 10.5 | 46.2 | 0.1 | 590.2 | 10.1 | 51.6 |
| HCO3− | 1.0 | 028.5 | 142.3 | 818.7 | 1.6 | 8390.0 | 139.5 | 767.6 |
| SO42+ | 0.0 | 2,210.7 | 37.0 | 242.2 | 0.3 | 2932.0 | 39.7 | 259.8 |
| Cl- | 0.1 | 18,970.2 | 218.1 | 1,934.3 | 0.9 | 18,833.0 | 206.3 | 1677.6 |
| NO3- | 0.0 | 258.6 | 31.8 | 54.1 | 0.3 | 311.9 | 30.1 | 54.3 |
| pH | 4.0 | 8.1 | 5.6 | 1.0 | 3.9 | 8.0 | 5.6 | 1.9 |
| TDS | 0.0 | 8500.0 | 201.8 | 863.6 | 2.3 | 6750.0 | 235.8 | 672.7 |
| EC | 0.0 | 12,000.0 | 295.4 | 1219.4 | 5.5 | 10,009.0 | 352.4 | 1002.0 |
| Temp | 25.5 | 34.6 | 29.4 | 1.7 | 26.6 | 99.9 | 60.1 | 28.9 |
| δ2H (‰) | −32.5 | 2.3 | −13.1 | 3.6 | −19.7 | 7.5 | −12.4 | 2.8 |
| δ18O(‰) | −5.2 | 0.3 | −3.0 | 0.6 | −4.0 | 0.8 | −3.0 | 0.5 |
| D-excess | −0.3 | 13.8 | 11.0 | 1.7 | 0.9 | 15.0 | 11.9 | 1.6 |
| Isotopes | Minimum | Maximum | Average | Std Dev |
|---|---|---|---|---|
| Douala GNIP Station n = 50 | ||||
| δ18O | −6.14 | 1.77 | −2.54 | 1.57 |
| δ2H | −38.80 | 17.68 | −9.05 | 11.89 |
| D-excess | 2.60 | 18.87 | 11.26 | 3.70 |
| Cotonou GNIP Station n = 50 | ||||
| δ18O | −5.53 | 1.82 | −2.86 | 1.63 |
| δ2H | −36.11 | 15.76 | −11.92 | 11.74 |
| D-excess | 0.30 | 17.44 | 10.99 | 3.30 |
| Kano GNIP Station | ||||
| δ18O | −7.70 | 2.40 | −2.92 | 2.59 |
| δ2H | −58.30 | 22.30 | −16.30 | 19.36 |
| D-excess | −13.38 | 20.98 | 7.08 | 6.69 |
| Groundwater Samples Wet Season n = 97 | ||||
| δ18O | −5.2 | 0.3 | −0.3 | 0.6 |
| δ2H | −32.5 | 2.3 | −13.1 | 3.6 |
| D-excess | −0.3 | 13.8 | 11.0 | 1.7 |
| Groundwater Samples Dry Season n = 133 | ||||
| δ18O | −4.0 | 0.8 | −3.0 | 0.5 |
| δ2H | −19.7 | 7.5 | −12.4 | 2.8 |
| D-excess | 0.9 | 15.0 | 11.9 | 1.6 |
Publisher’s Note: MDPI stays neutral with regard to jurisdictional claims in published maps and institutional affiliations. |
© 2020 by the authors. Licensee MDPI, Basel, Switzerland. This article is an open access article distributed under the terms and conditions of the Creative Commons Attribution (CC BY) license (http://creativecommons.org/licenses/by/4.0/).
Share and Cite
Aladejana, J.A.; Kalin, R.M.; Hassan, I.; Sentenac, P.; Tijani, M.N. Origin and Residence Time of Groundwater in the Shallow Coastal Aquifer of Eastern Dahomey Basin, Southwestern Nigeria, Using δ18O and δD Isotopes. Appl. Sci. 2020, 10, 7980. https://doi.org/10.3390/app10227980
Aladejana JA, Kalin RM, Hassan I, Sentenac P, Tijani MN. Origin and Residence Time of Groundwater in the Shallow Coastal Aquifer of Eastern Dahomey Basin, Southwestern Nigeria, Using δ18O and δD Isotopes. Applied Sciences. 2020; 10(22):7980. https://doi.org/10.3390/app10227980
Chicago/Turabian StyleAladejana, Jamiu A., Robert M. Kalin, Ibrahim Hassan, Philippe Sentenac, and Moshood N. Tijani. 2020. "Origin and Residence Time of Groundwater in the Shallow Coastal Aquifer of Eastern Dahomey Basin, Southwestern Nigeria, Using δ18O and δD Isotopes" Applied Sciences 10, no. 22: 7980. https://doi.org/10.3390/app10227980
APA StyleAladejana, J. A., Kalin, R. M., Hassan, I., Sentenac, P., & Tijani, M. N. (2020). Origin and Residence Time of Groundwater in the Shallow Coastal Aquifer of Eastern Dahomey Basin, Southwestern Nigeria, Using δ18O and δD Isotopes. Applied Sciences, 10(22), 7980. https://doi.org/10.3390/app10227980