Article

Methodology for Dimensioning the Socio-Economic Impact of Power-to-Gas Technologies in a Circular Economy Scenario

by
Eva Llera-Sastresa
1,*,
Luis M. Romeo
1,
Sabina Scarpellini
2 and
Pilar Portillo-Tarragona
2
1
Department of Mechanical Engineering, University of Zaragoza, 50018 Zaragoza, Spain
2
Department of Accounting and Finance, University of Zaragoza, 50005 Zaragoza, Spain
*
Author to whom correspondence should be addressed.
Appl. Sci. 2020, 10(21), 7907; https://doi.org/10.3390/app10217907
Submission received: 8 October 2020 / Revised: 5 November 2020 / Accepted: 6 November 2020 / Published: 8 November 2020

Abstract

:
Innovative and sustainable energy technologies are needed in the transition of energy toward a circular economy. Because of the use of renewable energy and carbon utilization, power-to-gas could be a cutting-edge technology that supports the circular model in future sustainable energy markets. However, this technology faces new technical and socio-economic challenges. The use of power-to-gas is limited because of barriers that limit the mobilization of investment capital. In addition, social and economic impacts on the territories in which these facilities are located are under study. In this context, the aims of this paper are: (i) To explore the determinants and barriers for power-to-gas technology to enhance the understanding of investment in innovative energy technologies; and (ii) to support effective policymaking and energy companies’ decision-making processes. This study defines and measures, from a circular economy perspective, the main impacts of the deployment of this technology on a territory in terms of volume of investment, employment generation, and CO2 capture. The study also provides a simplified methodology to contribute to the analysis of the use of power-to-gas. Finally, it improves the knowledge of the socio-economic impact of this cutting-edge technology for the transition of energy to a zero-emission scenario.

1. Introduction

In contrast to the current model of linear production, the circular economy (CE) implies the implementation of a circular model that limits resource intensity and reduces the environmental impact of consumption and production processes. [1]. Circular-related innovation is mainly linked to industrial ecology [2,3], which seeks to close the material loops on the basis of the cradle-to-cradle concept. All materials involved in industrial processes, whether synthetic or biological, are returned to soil [4].
In the energy sector, the principles of the CE are introduced through closed-loop energy production, giving priority to renewable energy sources (RES) in the treatment and recycling of waste so that they can be repeatedly applied in new production processes. The use of renewables is one of the main principles of a CE [5] because it allows a considerable reduction in the consumption of fossil fuels [6,7]. It is well-accepted that one of the most important factors for moving toward a circular model is the shift from conventional energy sources to renewables [4,8].
From a circular perspective, the demand-side is managed for the adoption of new energy efficiency technologies in shared power consumption systems [9]. Whereas utilities must improve their energy flows to minimize energy losses and optimize distributed generation on the energy production-side [9], on the demand-side the CE sets special requirements for energy management in all production processes to achieve the maximum level of energy saving [9]. Although the implications of the introduction of a CE are clear from a technical perspective, the connections between the CE and the development of innovative energy management, and their related impacts, are areas of research that remain underexplored.
In this scenario, power-to-gas (PtG) technology provides a feasible option in the energy transition context. PtG systems allow temporal and spatial solutions to be balanced by exploiting RES to meet electricity demand. Using PtG technologies, the electricity generated with renewables is stored using transport infrastructure and natural gas networks [10]. In this process, renewable electricity is stored via electrolysis to produce (synthetic) methane [11].
At present, a variety of applications of PtG technology have been developed to produce methane or hydrogen [12], to balance wind and solar power fluctuations and to increase the security of supply [13]. Renewable intermittent power must be managed via the future development of storage technologies [14], and massive energy storage alternatives [15] are needed to store excess electricity generated by RES. In summary, the electricity surplus is chemically converted into energy carriers via the PtG technology to meet demand and replacing fossil fuels [14]. Furthermore, PtG systems offer a wider exploitation of wind energy or photovoltaics (PV), which have been highlighted as two pillars of the energy transition in Europe [16] and increase the generation of local energy and self-sufficiency towards a CE. Finally, PtG is a key technology able to meet energy demand with the lowest CO2 footprint of sectors that cannot be decarbonized by electricity alone. Although hydrogen is seen as a potentially important low-carbon replacement for natural gas in the energy system, all prospective studies consider an initial period during which fossil natural gas is substituted by synthetic methane in the mobility, heating, and industry sectors.
In a circular model, PtG-integrated systems help to achieve different objectives in a sustainable scenario: (i) Facilitate local deployment of renewables; (ii) attract new investment; (iii) improve a differentiated technology mix in the energy market; (iv) contribute to emission reduction through CO2 capture and utilization; and (v) implementation of a CE model in the administration of resource flows. Despite the current barriers of PtG, which relate mainly to its high costs and efficiency rates obtained at the development stage, it has been identified as a cost-efficient option for renewable gas and a long-term storage solution. PtG contributes to the decarbonization of different sectors and allows the substitution of European energy carriers based on fossil fuels [13]. However, at present, these technologies face numerous barriers to their deployment in the European Union, and, in particular, in Southern Europe.
The academic literature has analyzed the impact of PtG on future energy systems in European [10,12,14,17] and non-European [18] countries. In particular, the impact of these technologies in the German energy transition scheme has been examined extensively by different authors [11,13,19]. Technical parameters and technology costs have been analyzed, and a consensus reached that PtG is a sustainable solution for decarbonization. These systems are close to being exploited at a larger scale, depending on the technological development of RES [10,20]. Nevertheless, the socio-economic impacts of the deployment of PtG is an underexplored line of inquiry.
Currently, two main gaps exist in the literature. Previous studies explored technical and economic impacts of PtG, but have not analyzed how socio-economic impacts related to these technologies can be measured. Second, most studies that looked at the incentives and barriers to PtG have not delved into other non-technical barriers that affect these investments in a circular model [21]. Thus, we address these two gaps from a circular perspective.
Based on this overview, the aim of this paper is to explore the determinants and barriers for PtG technologies to enhance the understanding of investment in innovative energy technologies and to estimate the socio-economic impacts related to the use of these systems in different scenarios. Thus, we analyze future scenarios and investment in PtG technologies (in particular, power-to-methane) using data obtained from 15 semi-structural interviews of the Spanish representatives of the main groups of stakeholders: private companies that operate in the energy sector, research and development (R&D) institutes, public administration, and other organizations involved in the energy transition in the area. A heuristic approach to the socio-economic impacts of future transactions related to PtG facilities is also offered using the main categories of economic and social impacts that are estimated from a circular perspective.
In summary, a contribution of this study is the measurement of the impacts of the use of PtG technologies in future sustainable energy markets for the exploitation of renewables in a zero-emission scenario based on the foundations of the CE. We also contribute to the definition and analysis of the determinants and barriers for the use of PtG technologies. In particular, a case study is analyzed to determine which incentives are more effective in mobilizing investments in the area.
The remainder of this article is structured as follows: Following the introduction, we explore the background of this research. In Section 3, a methodology for evaluating the determinants and estimating the socio-economic impacts of PtG deployment in a territory is proposed and applied to a case study. Results are subsequently analyzed. After a discussion about the determinants and incentives to these technologies in Southern Europe, we conclude by summarizing out recommendations for policymakers, academics, and practitioners in Section 4.

2. Background

PtG refers to the production of hydrogen (power-to-hydrogen) through water electrolysis or its subsequent conversion to methane (power-to-methane) with CO2 from different sources. These processes, originally developed in Germany, convert electricity into synthetic natural gas [11,22]. Moreover, an electrolyzer can be operated with surplus or curtailed electricity. Thus, PtG could enter clearly into competition with other storage systems by converting electricity in a gas carrier [23,24].
Bailera et al. (2017) show that most of the 30 PtG plants currently operating in Europe integrate an electrolyzer with a wind or photovoltaic installation [25]. In a recent review of this technology by Thema et al. (2019), it is clear that PtG systems are in a rapid phase of development, but it is foreseeable that the exploitation of these facilities will expand in the medium- or long-term [12]. Thus, at present, socio-economic impact analysis of PtG technologies is an underexplored line of inquiry and a revision of specific previous research is not possible. Thus, we opted to analyze the main barriers and incentives to PtG and its impacts, via the emerging body of literature on the subject and by analyzing other renewable-related topics, because PtG systems are integrated in different energy technologies.

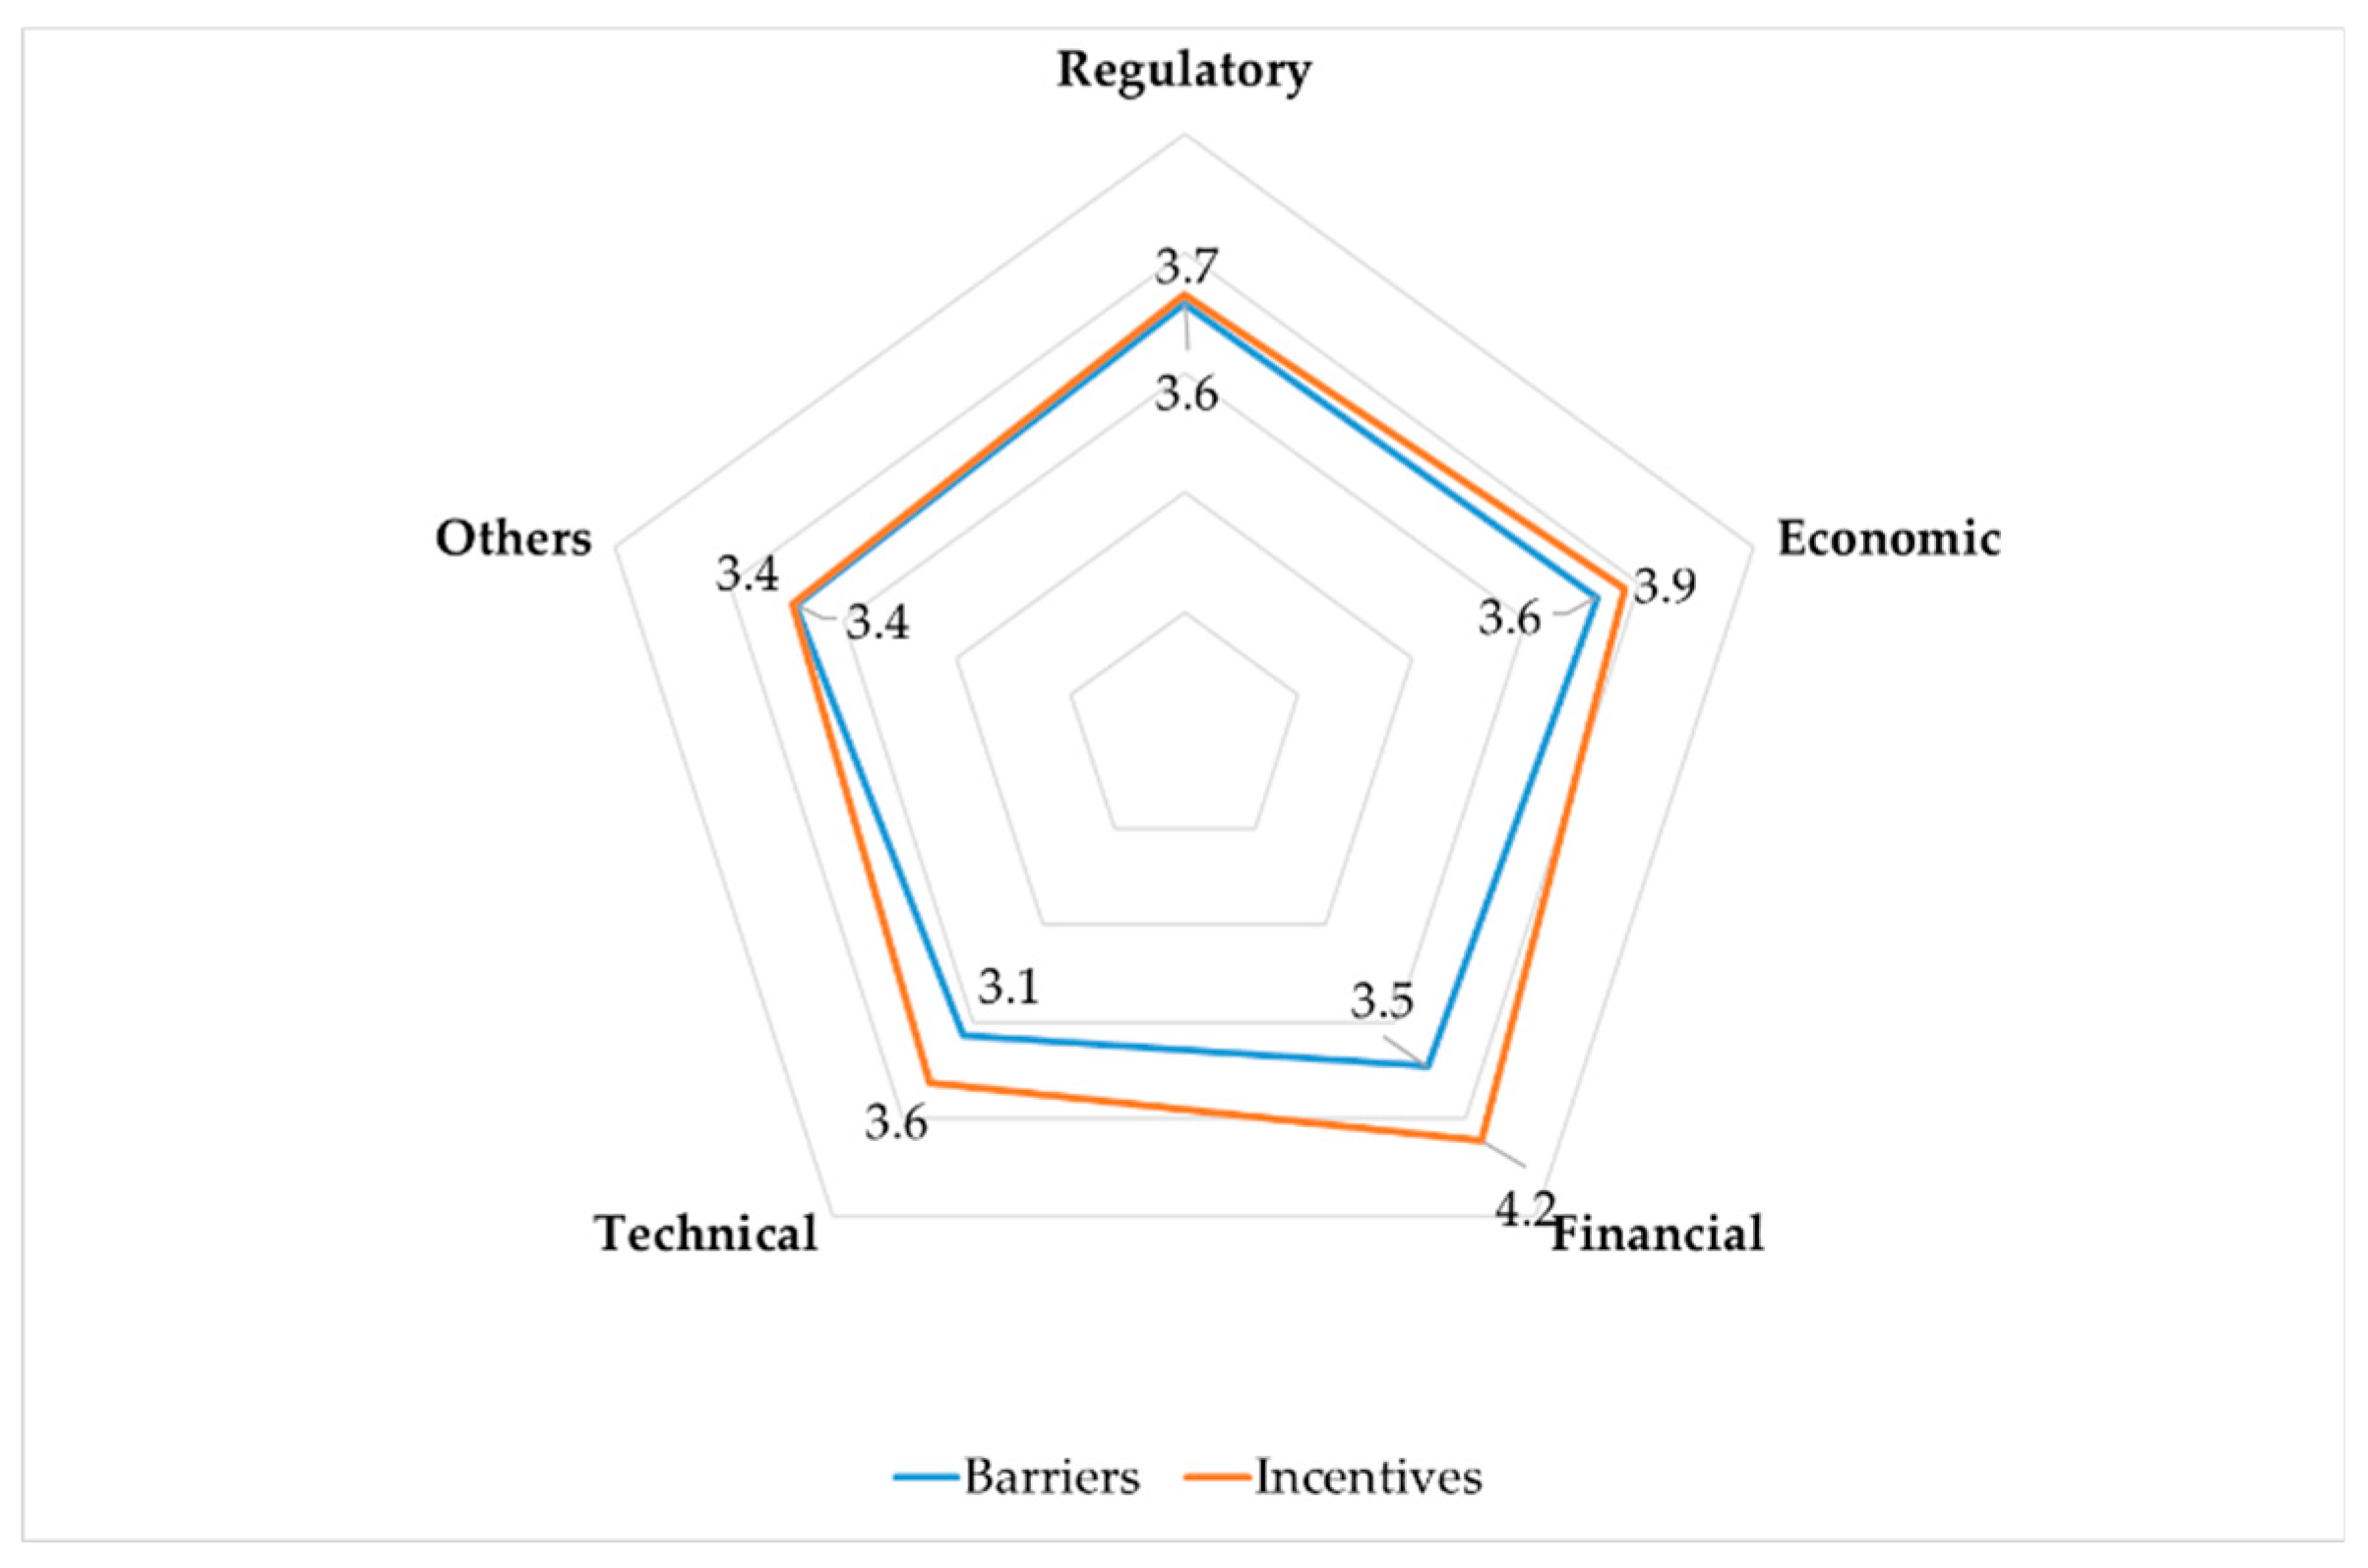
2.1. Main Drivers and Barriers

Previous studies focused on barriers and incentives to PtG are intimately connected with the deployment of RES, and the intermittent nature of power generated by exploiting renewables. Currently, the stability of the grid can be affected by mismatches between demand and electrical supply, and the security of the grid limits the technical and economic exploitation of RES. To some extent, it also limits PtG expansion [26]. Other limits to PtG could be related to the availability of CO2, the scarcity of water, the low efficiency of these systems, other processing steps, or the economic and financial issues related to this technology [11].
Some authors observe that the use of surplus renewables [22] and the volume of H2 production are influencing the PtG capacity that is linked to electricity generated from RES [27]. In addition, the supply of CO2 also determines PtG development [28]. Thus, the integration of PtG systems with biogas and other power plants, energy intensive industries, or waste treatments, is highly recommended because these plants could provide the CO2 that is needed for PtG [29]. However, other transport or storage options may be necessary depending upon the CO2 source, and the relative costs and technical feasibilities have to be taken into account [30].
At present, there is agreement that PtG will increase the flexibility of the energy supply and connections between gas and electricity networks [31]. The distribution and use of synthetic natural gas is a mature technology compared to other options such as electrolytic hydrogen [32]. In addition, PtG technology paves the way for the production of sustainable fuels that can be easily adapted to the existing markets in which natural gas has a considerable participation. These processes have been tested and the necessary technologies for both hydrogen and synthetic methane production have been found to technically and technologically ready. The tested levels are from 7 to 9 for alkaline electrolyzers; from 4 to 8 for polymer electrolyte membrane (PEM) electrolyzers, which are more suitable for distributed production; and from 5 to 7 for catalytic methanation [33]. Therefore, in the short term, technical barriers to the deployment of PtG mainly involve unanswered questions regarding process efficiencies, system integration, and accessibility of the reactants.
From the analysis of the literature, we can affirm that economic barriers are currently limiting the extensive diffusion of PtG technologies [19]. Prospective costs of PtG are sufficiently high that its investment costs will fall with scale and the amount of developed facilities. Therefore, financial barriers are relevant for the deployment of these technologies (e.g., initial investment or low returns from investments). Recent works have highlighted the relevance of financial actors for PtG development because financial concerns influence the investors in innovative technologies [34].
Other common barriers that are noted by researchers are the difficulties of access to capital, the lack of investments in energy efficiency, lack of information, financial limits, or the pay-back of investment [35]. Another relevant actor in PtG deployment is the public sector, which is financing R&D in low-carbon technologies due to their positive environmental impact [34,36,37]. Public incentives are often channeled through oriented projects according to the guidelines of the financing organizations [38]. Other studies in the energy sector show that RES investments could be stimulated by removing barriers and leveraging the drivers of the investment decision process [39]. Özbuğday et al. (2020) explore barriers to resource efficiency investments from the theoretical perspective of market imperfections that may prevent rational decision-making. Certain investors are more prone to provide capital, or to finance high-risk innovations, with clear differences between public and private sectors [34].
Authors have also pointed out that a techno-economic analysis of energy alternatives is not sufficient to explain RES diffusion and the barriers to their adoption [39,40]. Recent broader perspectives incorporated behavioral and social aspects to evaluate potential barriers for the deployment of PtG [19]. Thus, the involvement of stakeholders is a priority in the short term for renewable gas technology [36]. In this topic, the theoretical framework of the policy mix maps the contextual dynamics from the stakeholders’ vision with a double objective: to provide transition contracts and to define barriers in a changing socio-technical environment [41].
From the demand-side, it is expected that the current users of natural gas will readily accept this technology despite their diversity (domestic appliances in buildings, industrial sector, heat and PtG turbines, compressed natural gas, etc.,). Unlike hydrogen, it is not necessary to update the gas network or other appliances for PtG, and there are no cost or technical limits for either the distribution or the current appliances for natural gas use.
Currently, regulation is another barrier to PtG deployment because the regulatory framework defines conventional commercial deployment models, but providers and consumers must act in a circular model in the future. The increasing integration of distributed renewables requires specific regulation to reach economic feasibility. Thus, incentives are seen as key policies to achieve this objective. Previous instruments aimed at promoting RES were based on primary instruments (feed-in tariffs or quotas with tradable green certificates), and secondary instruments (soft loans, fiscal incentives, or investment subsidies) [42]. Feed-in-tariff schemes are very common in the European Union to support PV systems connected to the grid because they are integrated in policy mechanisms to encourage investments in RES by offering long-term contracts to generation from renewables [43]. In recent decades, different governments promoted specific policies based on the feed-in tariff scheme, tax incentives or renewable portfolio standards, capital grants, soft loans, R&D, or demonstration projects to introduce large-scale RES into power markets [44].
Although the feed-in tariff scheme is now less justified, mainly because of the reduction of the costs of PV systems [45], these mechanisms could be updated to support PtG development in the future. Nonetheless, some authors argue that the conviction about the technical suitability of the investment opportunities plays a substantially more important role in driving investment than the perceived effectiveness of existing policies [39]. Generally, consumers provide public support for green electricity via their electricity bills. In particular, in countries in which RES generation has significantly increased, such as Spain [46], there is a concern that this support places a significant cost on consumers [47], which must be taken into account by policymakers.
As a general remark from the analysis of the potential incentives to PtG, we find that the relevance of economic barriers related to investment would be reduced if we considered the PtG process as a new concept of CO2 hybrid storage based on renewables. Some of the synergies of these hybrid systems are already being tested under real conditions (e.g., PtG-Amine scrubbing, PtG-wastewater treatment). In addition, the efficiency of these systems could be optimized by symbiosis of industrial sectors and their waste streams, thus improving the consumption of resources and the investment in new equipment. Others synergies have been studied, e.g., PtG-oxyfuel using simulations of the combustion processes [48,49] and PtG-Electrochemical hybridization [50].
In this context, it is clear that PtG should be part of a strategy toward the CE that would benefit its deployment. The development of collaborative business models and synergies with other energy sectors is also a priority for the deployment of PtG [51]. Thus, policy incentives for the CE must include renewable gas, and public support has to be provided for the plant construction to foster investment in PtG in a CE framework. Other incentives could also address the upgrade of facilities to reduce the cost of investment using public funds or other institutional support to local biogas or biofuel [36,52] because PtG contributes to close material loops.
From a perspective similar to that of RES technologies, PtG should be supported by subsidies to maintain the leadership of some European countries as technology suppliers and to foster the deployment of these systems [53]. Moreover, it can be supposed that the reliability of PtG technologies is a necessary condition for future investment and the policy framework must materialize political support for PtG, taking into account the social acceptance in a region. A challenge for the acceptance of PtG in a given region is therefore the installation of wind farms to generate renewable electricity [53].
Examination of previous technological innovation processes reveals that first attempts of large-scale implementations are perceived more poorly than pilot projects [19]. Confidence in actors, and perceived benefits and risks of the technology, imply that citizens are willing to support transformation processes if they are convinced of their purpose [19] and specific dissemination actions are developed in the territory during the initial stage [40]. Additional barriers are challenges that concern public knowledge and understanding. In particular, the safety and use of hydrogen must be addressed, in addition to the promotion of the environmental benefits of synthetic natural gas as a means to decarbonize the energy system.
Based on this analysis of the research background and the literature, we considered it necessary to present the following research question to the interviewed experts:
RQ 1: 
What are the main incentives and barriers to the deployment of PtG technologies?

2.2. Socio-Economic Impacts of Power-to-Gas

Several studies have analyzed PtG technology from economic, technical, and/or environmental perspectives [53] because it is considered that PtG may provide renewable substitutes for fossil fuels and to solve the problem of grid balancing via long-term storage capacity [19]. Because synthetic methane is a promising option to replace natural gas, PtG would contribute to decarbonized energy systems, particularly those that cannot be decarbonized only by electricity, such as the heating [54] and transport sectors [55]. Thus, the positive effects of PtG are clear. However, the socio-economic impacts related to these facilities is still under study.
From an economic perspective, PtG systems are not currently profitable mainly due to a lack of adequate regulation [13]. Different studies show that PtG is generally feasible from a technical perspective at both large (centralized) and small (decentralized) scales [10,19]. The economic impact of PtG systems is closely linked to the technological solutions of the projects [30,56,57,58]. Previous analysis of the economics of PtG have included overall costs, the storage demand, PtG capacities, and other climate issues according to the expected RES sharing.
Kötter et al. (2015) found that PtG capital expenditures (CAPEX) do not significantly affect the optimal system in terms of the installed capacity of PtG [20]. Parra et al. (2017) demonstrate that if the product is only hydrogen, these systems cannot compete with conventional gas in the market [57]. Bailera et al. (2019) discuss the economic feasibility of an integrated system in which PtG aids cogeneration for non-residential buildings. Therefore, the economic potential of PtG is not yet obvious [59].
The spatial distribution of PtG plants is also relevant to achieve a positive economic performance [10]. The relevance of the spatial dimension is highlighted when a high share of renewable electricity has to be transported to distant load centers [10]. Garcia et al. (2016) define suitable locations in Europe for renewable hydrogen storage systems [60]. Furthermore, policymakers must be taken into account when making decisions about the siting of RES projects because their negative impacts are generally noted by communities adjacent to the plants [61].
For similarities, we can refer to PV development, which has been a disruptive technology during the past decade. The socio-technical analysis of PV development includes actors, institutional structures, technologies, and resources [62]. In general, studies focused on the socio-economic impacts of renewables widely analyzed their impact on employment [63,64]. The socio-economic research on the energy transition toward decarbonized power systems is mainly based on the impacts resulting from RES deployment [65]. With regard more specifically to the impacts of PtG, König et al. (2018) highlight socio-ecological impacts based on the benefits of combining PtG plants and battery storage in existing local infrastructure [53]. Parra et al. (2017) analyze the costs of PtG, its feasibility, and the decrease in the environmental impacts generated by these technologies through a life cycle assessment [57]. The analysis of relevant stakeholders in a territory where PtG technology could be installed is also a research topic [53]. PtG acceptance has been analyzed using factors such as the quality of life, citizen participation, and socio-ecological impacts [53].
From the literature review, we can observe that most of the studies carried out to date have focused mainly on technological, environmental, and economic impacts of this technology. In summary, the main social impacts of PtG technology can be linked to supply security, climate change, or health. Furthermore, these impacts are related to the generation and distribution of RES and the storage of hydrogen. However, to the best of our knowledge, the direct socio-economic impacts of PtG are still underexplored. Under the sustainability paradigm, the impacts of innovative technologies have to consider the environmental, economic, and social dimensions, which comprise the triple bottom line of an organization [66]. Thus, further research is required to enhance the knowledge about the future socio-economic impacts of PtG, particularly at a large scale. Thus, the following research question is proposed:
RQ 2: 
What are the main socio-economics impacts of the investments in PtG in a specific territory?

2.3. Power-to-Gas Deployment in a Circular Scenario

Different scenarios for PtG deployment have been estimated based on the assumption that the electrolysis capacity demand varies depending on the energy market scenarios, the expected environmental targets, and the energy transition pathways [19]. Jentsch et al. (2014) determine the optimum PtG capacity from an economic perspective using flexibility options of hydrogen production for short-term storage systems, and increasing PtG capacity in interaction with the most relevant competitive option [10]. Furthermore, Kötter et al. (2015) define a 2030 scenario for different parameters, efficiencies, and costs of technologies, demonstrating the expected high impact of PtG for future energy systems [20].
Thema et al. (2016) simulates two scenarios of potential PtG capacity until 2050 in which the German power sector achieves 100% of its electricity generation from RES [13]. The results show substantial cost reductions and price declines for methanation and electrolysis [12]. Nastasi and Lo Basso (2017) explore the application of PtG to the storage of excess renewable electricity to meet heating demand, when the RES share is assumed to increase to up to 50% in different scenarios [67].
Parra et al. (2017) consider that PtG is integrated into the electricity market in Switzerland and include other services related to the generation of low fossil-carbon gas [57]. Bertuccioli et al. (2014) propose three scenarios for hydrogen production based on the capacity of the distribution network, the RES generation plant, and the size of the electrolyzer [56]. Oyewo et al. (2020) develop six scenarios under certain policy constraints, such as cross-border electricity trade and greenhouse gas emission costs, within the time horizon of 2015–2050 in 5-year intervals [65]. Finally, Lisbona et al. (2018) define three possible scenarios to quantify the growth of wind and PV generation and the PtG capacity that would be installed in Spain [14].
The PtG scenarios developed by the previous studies often consider an electricity surplus of RES installed capacity [14,31,68]. However, these scenarios are often subject to uncertainty because of sectoral regulation, economics issues, and markets, in addition to the technology evolution of these systems [14]. Thus, our attempt to define the future socio-economic impacts of PtG deployment is pioneering research in the actual phase of the development of this technology.
Among the studies that are similar to our object of analysis, we highlight the research carried out by Koelbl et al. (2016), which focused on carbon capture and storage (CCS) using several socio-economic indicators [69]. These authors calculate the incremental impacts linked to employment, gross value added, and import dependency by integrating techno-economic bottom-up data with a macro-economic multi-regional input-output model. Although these indicators are of interest and can be implemented for PtG, it is necessary to expand the specific analysis about the impacts of these technologies given their future expansion.
In summary, the economic and environmental impacts linked to the evolution of PtG in the coming decades have been analyzed in previous studies. However, social impacts of PtG technology have not been addressed in depth in the long term. Nor have these studies addressed the issue of PtG from the perspective of a CE. For this reason, in this paper we estimate the socio-economic impacts of this technology in different temporal spaces, taking into account the CE principles promoted by institutions and governments, and the institutional pressures on climate change [70].
Based on the previous considerations, the following research question is raised:
RQ 3: 
What are the most widespread PtG-related determinants factors in a CE scenario?
These research questions are answered by analyzing a case study at the territorial level from a CE perspective. The main results are summarized in the following sections.

3. Methodology and Application to a Case Study

3.1. Method

This study is focused on the development of PtG technologies in Spain, in the framework of an R&D project that includes the design of a specific methodology to estimate the socio-economic impact of PtG in the territory. The PtG process can be explained as follows: hydrogen is produced by water electrolysis that is subsequently combined with carbon dioxide to produce methane through the Sabatier reaction. These individual processes require a photovoltaic installation connected to an electrolyzer that feeds a methanation reactor and its auxiliary systems.
We used a double-focus qualitative methodology to investigate the research questions through a case study. We conducted 15 semi-structured interviews during the first semester of 2020 to analyze the perceptions of experts about the deployment of PtG technologies in Spain. Parallel desk research was also carried out to select a set of specific indicators to estimate the socio-economic impacts of PtG in Spain.
The questions in the interviews were designed in accordance with other studies that have concentrated on the adoption of RES technologies or the CE in a territory [71,72,73]. PtG development potential was analyzed based on the opinion of 15 experts selected by the authors as key informants according to their background. Because of the stage of development of these systems, approximatively 50% of the interviewees represent R&D institutes, public administrations, or other organizations related to the development of the CE. The other half of the experts represent companies that operate in the energy sector. A brief description of the experts’ profiles is included in Table 1, but owing to confidentiality agreements with the interviewees, their identities remain anonymous.
The interviews were organized into three sections. Part A was focused on the analysis of the future deployment of PtG technologies through five open questions. Part B determined main barriers and drivers to this technology. Part C included closed and open questions related to the socio-economic impacts of PtG. Finally, basic data of the respondents were collected during the fourth part of the interview. Experts answered some of the questions using a Likert scale (All the interviews were analyzed in an aggregated manner using a qualitative method. In addition, experts were asked to assign a value to each opinion using a Likert scale ranging from 0 to 5 (0 means total disagreement, and 5 total agreement)).
For the desk research on the measurement of the socio-economics impacts of PtG, different metrics were identified and applied to the case study. Three basic indicators were selected to synthesize the estimation of impacts of these technologies in Spain: capital expenditure (CAPEX), employment related to these investments, and the volume of CO2 captured by these systems. The metrics and coefficients used in this study to define the impact of the CE in the deployment of PtG are consistent with previous studies, particularly those proposed by Korhonen et al. (2018), Smol et al. (2017), and Aranda-Usón et al. (2018) [74,75,76].

3.2. Influence of Barriers and Incentives at the Territorial Level

In Part B of the interview, a five-point Likert scale ranging from 0—“not relevant” to 5—“highly relevant” was used so that the experts rated the relevance of a set of barriers and incentives on PtG deployment.
For each item, the average and the frequency of the answers were calculated. Table 2; Table 3 include the percentages of respondents who provided ratings of 4 and 5 and the average value of all the answers collected.
The perception of the interviewees about the barriers is summarized in Table 2.
The barriers raised by the survey questions can be classified into five typologies: economic (B.03, B.06, and B.09), financial (B.05 and B.10), regulatory (B.01 and B.04), technical (B.02 and B.07), and other (B.08).
The results show that most of the experts surveyed (92%) consider that the payback period of the investment is the element that restrains the deployment of PtG. The initial investment, which relates mainly to the price of the electrolyzers, appears to be the most limiting factor for the development of PtG, as noted by nearly 75% of respondents. In addition, 53% report the lack of equipment as a relevant barrier, even though the technical complexity of these kinds of installations is only mentioned by less than half of respondents. Finally, barriers related to the access to financing and regulation are of intermediate importance, which may be due to the initial level of development of PtG technology.
The incentives raised by the survey questions can be classified into 5 typologies: economic (I.03, I.06, and I.09), financial (I.05), regulatory (I.01 and I.04), technical (I.02 and I.07), and other (I.08 and I.10). The perception of interviewees regarding incentives is summarized in Table 3.
Information campaigns and collaboration with R&D centers are considered to be the incentives with the lowest impact, as shown in the lower percentage of higher scores (46% in both cases). Conversely, more than three-quarters of the interviewees note that giving subsides or legislating in favor of these technologies, lowering technology prices, and reducing the technical complexity of the installation process would be the best way to foster PtG.
The average results for barriers and incentives were aggregated in each of the five typologies and are represented in the radar chart of Figure 1. The same scale from 0 to 5 indicates where the score is proportional to the relevance of each group of determinants of PtG deployment.
In accordance with Section 2.1, technical is the smallest barrier from the perspective of interviews and the remaining barrier typologies are at the same level. Some considerations regarding the priority of economic and financial issues, as mentioned in Section 2.1, can be deduced from the average values. Finally, by comparing incentives and barriers it can be expected that the higher the difference between a barrier and its corresponding incentive, the more urgent the need to develop corresponding strategies. This confirms that financial, economic, and technical factors still need to be addressed.

3.3. Main Socio-Economics Impacts

In part C of the interview, experts were openly asked about the expected social and economic impacts of PtG deployment. The most mentioned impacts were increasing investment, employment generation, and mitigation of the environmental impact.
Next, an approach is proposed to estimate the effect of PtG on the determinants of sustainability, namely, the estimation of the CAPEX of a generic installation, employment factors, annual production of synthetic natural gas (SNG), and annual CO2 consumed.
Because of the demonstration stage of PtG technology, the socio-economic impact of PtG in Spain was evaluated in scenarios that consider 2030 and 2050 as reference years for consistency with European decarbonization plans.
Investment required, employment generated, and CO2 captured were estimated considering a starting point of 35 MW installed up to 2025 and growing rates of an addition 250 MW installed per year for the period 2025–2030 and 400 MW per year for the period 2030–2050. This is a conservative assumption. Several studies (for example, of the aim of reducing the UK’s greenhouse gas emissions to zero by 2050), evaluate this growing rate as up to 567 MW of electrolysis per annum for 30 years [77].
Several prospective reports, such as that of the U.S Department of Energy [78], consider that a suitable size for distributed electrolysis production is 1.5 t of hydrogen per day.
The size of the unit plant was selected taking into account the annual operating hours needed to produce 1.5 t/day from the electricity generated in a generic PV plant on a yearly basis. Because H2 production varies throughout the year, in addition to throughout the day, depending on the available radiation, a H2 buffer is required. Considering that 100% of the available H2 is finally used to reduce economic investment on equipment, we selected a small methanation reactor that provides twice the operating hours per year. The necessity of compression and storage systems for SNG was also considered.
Accordingly, the PtG basic unit in this paper consists of a PV installation of 3.5 MW with 2500 h of utilization per year, a 2.8 MW electrolyzer (3125 h of utilization per year) with 70% efficiency, and a 1.4 MW methanizer (6250 h of operation per year) with an optimistic 100% conversion efficiency.
This basic installation produces 510,117 Nm3 of synthetic natural gas (SNG) and captures 1009 tons of CO2 per year.
To estimate the investment cost, the reported installation costs for every installed PtG system were considered, as summarized in Table 4. The data for alkaline and membrane electrolysis, and for chemical CO2-methanation, was projected using exponential approximation over average annual values by Thema et al. (2019) [12] to include the expected decrease for the 2030 and 2050 horizons. We used a benchmark installation cost for a PV system of 1000 €/kW, with a moderate reduction due to the degree of maturity that this technology has reached.
Because no preference regarding the type of electrolyzer is currently shown in the reported installations [12,25], a generic electrolyzer was considered with a unit cost equal to the average values for alkaline and PEM electrolyzers in Table 4.
To estimate the capital expenditure of a PtG unit, 25% of the electrolyzer cost and 40% of the methanizer cost were added to consider batteries and gas storage, and compression, among other auxiliary systems. It should be noted that the estimation of the investment costs excludes the CAPEX of the CO2 capture technology because CO2 is considered as a reactant externally provided.
Based on the unit costs summarized in Table 4, the investment cost for a PtG basic unit would result 7860 € for the year 2025. As it is usual to refer sizes and values of a PtG unit to the installed capacity of the electrolyser (2.8 MW in this case), estimated CAPEX draws was based on 2800 € per kW of electrolyzer installed capacity in 2025 with an annual decrease of 2–2.5%.
Table 5 summarizes the cumulative capacity and investment, and the total CO2 capture and SNG production, at the end of each considered period.
Concerning employment, the only reference to date regarding job creation from PtG assumes a value two times higher than that of a gas turbine [79]. From the authors’ perspective, PtG technology is closer to that of hydrogen production (methanation is the reverse process of reforming) and employment generation is expected to be similar. The most definitive analysis of hydrogen production jobs was conducted in the United States (US), in which an estimation of the employment impacts of a transformation of the US economy to the use of hydrogen between 2020 and 2050 and under two scenarios is included [78].
Employment ratios for hydrogen production were calculated ad hoc from data reported in [78], which is the only report in which employment for a hydrogen economy was studied in deep. In the source document, two intensity levels of hydrogen deployment (high and moderate) are contemplated.
Although the total jobs are classified as blue and white collar, aggregated data are given regardless of the eight technologies considered for hydrogen production. Because the total t/day of hydrogen produced can be estimated, an average number of full time equivalent (FTE) jobs required to install, manufacture, and maintain each t/day of hydrogen produced was calculated.
Table 6 shows the compiled data for the calculation of the employment factor in jobs per t/day of hydrogen production.
It can be seen that employment factors for high and moderate deployment levels (line 4 of Table 6) do not change significantly as a consequence of being indexed to a unit of production. Moreover, employment ratios decrease over time as expected: as industries become more mature, they gain economies of scale, the cost decreases, and the improvement of learning curves implies fewer employees are required for the same level of production.
These estimated employment factors are an average for all technologies and sizes.
However, the proposed installations are expected to be more labor intensive because they are small and spatially distributed.
In the work of the Department of Energy [78], several kinds of installations for hydrogen production are contemplated, ranging from distributed electrolysis (small capacity, 1.5 t/day) to nuclear thermochemical (high capacity, 768 t/day), and estimated jobs are reported.
From this information and by means of a numerical analysis, a multiplication factor of 5 on the average employment ratio in Table 6 was estimated for distributed hydrogen production at a small scale (both reforming and electrolysis) and a multiplication factor of 0.2 for nuclear electrolysis and thermochemical production at a high scale. The resulting employment factors for distributed installations, as shown in Table 6, were used as a reference in this paper.
Finally, employment factors were extrapolated to the years 2025, 2030, and 2050, using values of 2.37, 2.16, and 1.48 FTE per ton per day, respectively. These values were used for both electrolyzer and methanizer systems, where t/d refers to the hydrogen produced in the electrolyzer and converted in the methanization reactor.
Employment factors of 1.8, 1.8, and 1.6 FTE per installed photovoltaic kilowatt in 2025, 2030, and 2050, respectively, were estimated from the model developed by Llera et al. (2013) [63].
After applying the above employment factors to the parameters of a PtG basic unit (3.5 MW and 1.5 t/d of hydrogen production), we estimate that the commissioning of one PtG basic unit involves 13.4 full-time jobs for a one year’s work during the 2020–25 period. We calculate 12.8 full-time jobs in the 2025–30 period and 10.1 full-time jobs in the 2030–50 scenario. This labor considers not only operation and maintenance activities, but also manufacturing, installation, etc., which are distributed over the lifetime of the plant.

3.4. PtG Scenarios and Circular Perspective

Based on the socio-economic impact analysis carried out in this study, the potential impact of the deployment of PtG technologies in the medium and long term in Spain is presented in Table 7.
To forecast the evolution of these indicators in different scenarios (5, 10, and 30 years), the factors that could accelerate or slow down the investments in these technologies in Spain need to be identified. These factors need to be corrected by a coefficient λx according to four different scenarios: pessimistic, technical, business as usual, and optimistic (Table 8).
The business as usual scenario would occur in a context of moderate upgrade of the factors that may improve the energy transition and PtG, such as the maturity of technology (electrolyzer and methanizer) and the incentives for new installations (feed-in-tariff, regulation, etc.,). Technical scenarios are those calculated using data from the literature and/or based on technical evaluations. Similarly, a pessimistic scenario would represent a situation with barriers (high price of electrolyzer, payback period, etc.,) and no incentives. Finally, in the optimistic scenario, the expected variations in each of the temporal scenarios would be higher than that in the previous scenarios because barriers are overcome and the incentives are allocated from both energy transition and CE promotion, which would result in a significant increase in the CE in the territory. This methodology was designed in line with factors selected by Aranda-Usón et al. (2018) [76].
A high volume of investment is expected in the period of scenario 2 (from 2025 to 2030) in response to the energy transition goals and the European Green Deal Strategy [80], although its effects are cumulative in successive periods. Investment made at present will have positive effects in the future, in line with other eco-innovative investments in which the environmental positive effects are appreciated in the long term [81]. During the final 20 years, investment stabilizes and has moderate effects on the social and environmental impacts, although the environmental improvements, in proportion to the investments, continue to capitalize on positive effects in the long term.
Regarding the social impact measured by the number of direct and indirect jobs created at different stages of the value chain, the results affirm that, although PtG is not a highly employment-intensive technology, it would generate jobs with a high level of quality, consistent with [63]. In addition, the employment is generated in the framework of the CE, which therefore justifies the incentives for the deployment of this technology. A portion of these jobs will be displaced from other non-renewable generation plants and entail greater specialization in a circular model [76].

4. Conclusions

In this study, we analyze the determinants and barriers for PtG systems to enhance the understanding of the investment in innovative energy technologies and to support effective policymaking in an energy transition scenario. These results fill two gaps in the literature by providing an extensive analysis of determinants and barriers for PtG technologies, and an innovative methodology for estimating, from a circular perspective, socio-economic impacts of these technologies in different scenarios.
The results show the most relevant barriers for PtG are linked to economic aspects such as the payback period, the high volume of the initial investment, and the price of equipment or the difficulties related to financing it. Another set of barriers is related to legislation issues and/or subsidies to promote the technology. Both aspects were highlighted by most of the interviewed experts as incentives to PtG deployment. It is foreseen that decisions to investment in these technologies produce incremental effects in the long term. Not investing in the 2025 scenario generates cumulative socio-economic impacts that imply a posteriori benefits in employment and the capture of CO2 emissions. However, not making these investments, or making lesser investments, could harm future PtG deployment in terms of installed capacity and related impacts. At present, overcoming the barriers that hamper investment in PtG systems partially depends on public stimuli.
To overcome these challenges and help firms in their transition toward circular economic models, favorable conditions are needed. Policymakers must play a relevant role as a driver for the adoption of the CE to foster the adoption of innovative energy technologies that improve the closing of material loops.
Exploring barriers and incentives is a contribution to the academic literature that can be applied by practitioners to the decision-making process of investment in energy technologies. These results offer information for effective policymaking. In addition, the developed methodology for the estimation of socio-economic impacts can be extrapolated to other countries where the CE will be promoted. Policy and industry stakeholders aiming at promoting innovative and sustainable energy systems can use these findings. Practitioners of the energy sector can calculate the socio-economic impacts of their investments to disclose them in terms of sustainability in non-financial reporting.
The main findings of this study concern the methodology used to define and measure the main socio-economic impacts of future investments in innovative energy technologies such as PtG. The proposed methodologies and the highlighted measures could be used for decision-making support to implement integrated policies of energy decarbonization and the CE, and to influence the establishment of energy planning priorities.
The limitations of this study are mainly associated with the territoriality of the analysis and the number of interviewed experts. Future research could analyze different countries and other specific factors that influence the decision-making process of investors, in addition to the inclusion of more categories of socio-economic impact in the framework of a circular model.

Author Contributions

All authors contributed substantially and equally to the work reported in this paper. Conceptualization: E.L.-S. and S.S.; formal analysis: E.L.-S., S.S., and P.P.-T.; investigation: L.M.R.; methodology: E.L.-S., P.P.-T., and S.S.; writing—review and editing: E.L.-S., L.M.R., S.S., and P.P.-T. All authors have read and agreed to the published version of the manuscript.

Funding

The work described in this paper is supported by the Government of Aragon and co-financed by FEDER 2014–2020 “Construyendo Europa desde Aragón,” research project LMP134_18.

Acknowledgments

This study was developed within the research groups of the Regional Government of Aragón, Ref. S33_20R and T46_20R. We would like to express our special thanks to the experts and representatives of the bodies that collaborated through semi-structured interviews and played a fundamental role as “key informants”.

Conflicts of Interest

The authors declare no conflict of interest.

References

  1. Scarpellini, S.; Marín-Vinuesa, L.M.; Aranda-Usón, A.; Portillo-Tarragona, P. Dynamic capabilities and environmental accounting for the circular economy in businesses. Sustain. Account. Manag. Policy J. 2020, 7, 1129–1158. [Google Scholar] [CrossRef] [Green Version]
  2. Ehrenfeld, J.; Gertler, N. Industrial Ecology in Practice: The Evolution of Interdependence at Kalundborg. J. Ind. Ecol. 1997, 1, 67–79. [Google Scholar] [CrossRef]
  3. Ehrenfeld, J.R. Industrial ecology: A framework for product and process design. J. Clean. Prod. 1997, 5, 87–95. [Google Scholar] [CrossRef]
  4. Yaduvanshi, N.R.; Myana, R.; Krishnamurthy, S. Circular Economy for Sustainable Development in India. Indian J. Sci. Technol. 2016, 9, 3. [Google Scholar] [CrossRef]
  5. Moraga, G.; Huysveld, S.; Mathieux, F.; Blengini, G.A.; Alaerts, L.; Van Acker, K.; De Meester, S.; Dewulf, J. Circular economy indicators: What do they measure? Resour. Conserv. Recycl. 2019, 146, 452–461. [Google Scholar] [CrossRef] [PubMed]
  6. Haas, W.; Krausmann, F.; Wiedenhofer, D.; Heinz, M. How Circular is the Global Economy? An Assessment of Material Flows, Waste Production, and Recycling in the European Union and the World in 2005. J. Ind. Ecol. 2015, 19, 765–777. [Google Scholar] [CrossRef]
  7. Pan, S.-Y.; Du, M.A.; Huang, I.-T.; Liu, I.-H.; Chang, E.-E.; Chiang, P.-C. Strategies on implementation of waste-to-energy (WTE) supply chain for circular economy system: A review. J. Clean. Prod. 2015, 108, 409–421. [Google Scholar] [CrossRef]
  8. Lowe, E.A.; Evans, L.K. Industrial ecology and industrial ecosystems. J. Clean. Prod. 1995, 3, 47–53. [Google Scholar] [CrossRef]
  9. Gitelman, L.; Magaril, E.; Kozhevnikov, M.; Rada, E.C. Rada Rational Behavior of an Enterprise in the Energy Market in a Circular Economy. Resources 2019, 8, 73. [Google Scholar] [CrossRef] [Green Version]
  10. Jentsch, M.; Trost, T.; Sterner, M. Optimal Use of Power-to-Gas Energy Storage Systems in an 85% Renewable Energy Scenario. Energy Procedia 2014, 46, 254–261. [Google Scholar] [CrossRef]
  11. Götz, M.; Lefebvre, J.; Mörs, F.; Koch, A.M.; Graf, F.; Bajohr, S.; Reimert, R.; Kolb, E.T. Renewable Power-to-Gas: A technological and economic review. Renew. Energy 2016, 85, 1371–1390. [Google Scholar] [CrossRef] [Green Version]
  12. Thema, M.; Bauer, F.; Sterner, M. Power-to-Gas: Electrolysis and methanation status review. Renew. Sustain. Energy Rev. 2019, 112, 775–787. [Google Scholar] [CrossRef]
  13. Thema, M.; Sterner, M.; Lenck, T.; Götz, P. Necessity and Impact of Power-to-gas on Energy Transition in Germany. Energy Procedia 2016, 99, 392–400. [Google Scholar] [CrossRef] [Green Version]
  14. Lisbona, P.; Frate, G.F.; Bailera, M.; Desideri, U. Power-to-Gas: Analysis of potential decarbonization of Spanish electrical system in long-term prospective. Energy 2018, 159, 656–668. [Google Scholar] [CrossRef] [Green Version]
  15. Lopez-Sabiron, A.M.; Aranda-Usón, A.; Mainar-Toledo, M.; Ferreira, V.J.; Ferreira, A.G. Environmental profile of latent energy storage materials applied to industrial systems. Sci. Total. Environ. 2014, 473, 565–575. [Google Scholar] [CrossRef] [PubMed]
  16. Tagliapietra, S.; Zachmann, G.; Edenhofer, O.; Glachant, J.-M.; Linares, P.; Loeschel, A. The European union energy transition: Key priorities for the next five years. Energy Policy 2019, 132, 950–954. [Google Scholar] [CrossRef] [Green Version]
  17. Guandalini, G.; Robinius, M.; Grube, T.; Grube, T.; Stolten, D. Long-term power-to-gas potential from wind and solar power: A country analysis for Italy. Int. J. Hydrog. Energy 2017, 42, 13389–13406. [Google Scholar] [CrossRef]
  18. Eveloy, V.; Gebreegziabher, T. A Review of Projected Power-to-Gas Deployment Scenarios. Energies 2018, 11, 1824. [Google Scholar] [CrossRef] [Green Version]
  19. Schnuelle, C.; Thoeming, J.; Wassermann, T.; Thier, P.; Von Gleich, A.; Goessling-Reisemann, S. Socio-technical-economic assessment of power-to-X: Potentials and limitations for an integration into the German energy system. Energy Res. Soc. Sci. 2019, 51, 187–197. [Google Scholar] [CrossRef]
  20. Kötter, E.; Schneider, L.; Sehnke, F.; Ohnmeiss, K.; Schröer, R. Sensitivities of Power-to-gas Within an Optimised Energy System. Energy Procedia 2015, 73, 190–199. [Google Scholar] [CrossRef] [Green Version]
  21. Aranda-Usón, A.; Portillo-Tarragona, P.; Marín-Vinuesa, L.M.; Scarpellini, S. Financial Resources for the Circular Economy: A Perspective from Businesses. Sustainability 2019, 11, 888. [Google Scholar] [CrossRef] [Green Version]
  22. Rönsch, S.; Schneider, J.; Matthischke, S.; Schlüter, M.; Götz, M.; Lefebvre, J.; Prabhakaran, P.; Bajohr, S. Review on methanation—From fundamentals to current projects. Fuel 2016, 166, 276–296. [Google Scholar] [CrossRef]
  23. Estermann, T.; Newborough, M.; Sterner, M. Power-to-gas systems for absorbing excess solar power in electricity distribution networks. Int. J. Hydrogen Energy 2016, 41, 13950–13959. [Google Scholar] [CrossRef]
  24. Blanco, H.; Faaij, A. A review at the role of storage in energy systems with a focus on Power to Gas and long-term storage. Renew. Sustain. Energy Rev. 2018, 81, 1049–1086. [Google Scholar] [CrossRef]
  25. Bailera, M.; Lisbona, P.; Romeo, L.M.; Espatolero, S. Power to Gas projects review: Lab, pilot and demo plants for storing renewable energy and CO2. Renew. Sustain. Energy Rev. 2017, 69, 292–312. [Google Scholar] [CrossRef]
  26. Bailera, M.; Peña, B.; Lisbona, P.; Romeo, L.M. Decision-making methodology for managing photovoltaic surplus electricity through Power to Gas: Combined heat and power in urban buildings. Appl. Energy 2018, 228, 1032–1045. [Google Scholar] [CrossRef] [Green Version]
  27. Vo, T.T.; Xia, A.; Wall, D.M.; Murphy, J.D. Use of surplus wind electricity in Ireland to produce compressed renewable gaseous transport fuel through biological power to gas systems. Renew. Energy 2017, 105, 495–504. [Google Scholar] [CrossRef]
  28. Schneider, L.; Kotter, E. The geographic potential of Power-to-Gas in a German model region-Trier-Amprion 5. J. Energy Storage 2015, 1, 1–6. [Google Scholar] [CrossRef]
  29. Sterner, M. Bioenergy and Renewable Power Methane in Integrated 100% Renewable Energy Systems:Limiting Global Warming by Transforming Energy Systems; Kassel University Press: Kassel, Germany, 2009; ISBN 9783899587982. [Google Scholar]
  30. Schiebahn, S.; Grube, T.; Robinius, M.; Tietze, V.; Kumar, B.; Stolten, D. Power to gas: Technological overview, systems analysis and economic assessment for a case study in Germany. Int. J. Hydrogen Energy 2015, 40, 4285–4294. [Google Scholar] [CrossRef]
  31. Qadrdan, M.; Abeysekera, M.; Chaudry, M.; Wu, J.; Jenkins, N. Role of power-to-gas in an integrated gas and electricity system in Great Britain. Int. J. Hydrogen Energy 2015, 40, 5763–5775. [Google Scholar] [CrossRef]
  32. Emonts, B.; Schiebahn, S.; Görner, K.; Lindenberger, D.; Markewitz, P.; Merten, F.; Stolten, D. Re-energizing energy supply: Electrolytically-produced hydrogen as a flexible energy storage medium and fuel for road transport. J. Power Sources 2017, 342, 320–326. [Google Scholar] [CrossRef]
  33. Rozzi, E.; Minuto, F.D.; Lanzini, A.; Leone, P. Green Synthetic Fuels: Renewable Routes for the Conversion of Non-Fossil Feedstocks into Gaseous Fuels and Their End Uses. Energies 2020, 13, 420. [Google Scholar] [CrossRef] [Green Version]
  34. Mazzucato, M.; Semieniuk, G. Financing renewable energy: Who is financing what and why it matters. Technol. Forecast. Soc. Chang. 2018, 127, 8–22. [Google Scholar] [CrossRef]
  35. Özbuğday, F.C.; Fındık, D.; Özcan, K.M.; Başçı, S. Resource efficiency investments and firm performance: Evidence from European SMEs. J. Clean. Prod. 2020, 252, 119824. [Google Scholar] [CrossRef]
  36. Hoo, P.Y.; Hashim, H.; Ho, W.S. Towards circular economy: Economic feasibility of waste to biomethane injection through proposed feed-in tariff. J. Clean. Prod. 2020, 270, 122160. [Google Scholar] [CrossRef]
  37. Scarpellini, S.; Aranda, A.; Aranda, J.; Llera, E.; Marco-Fondevila, M. R&D and eco-innovation: Opportunities for closer collaboration between universities and companies through technology centers. Clean Technol. Environ. Policy 2012, 14, 1047–1058. [Google Scholar] [CrossRef]
  38. Mazzucato, M. From market fixing to market-creating: A new framework for innovation policy. Ind. Innov. 2016, 23, 140–156. [Google Scholar] [CrossRef]
  39. Masini, A.; Menichetti, E. Investment decisions in the renewable energy sector: An analysis of non-financial drivers. Technol. Forecast. Soc. Change 2013, 80, 510–524. [Google Scholar] [CrossRef]
  40. Scarpellini, S.; Romeo, L. Policies for the setting up of alternative energy systems in European SMEs: A case study. Energy Convers. Manag. 1999, 40, 1661–1668. [Google Scholar] [CrossRef]
  41. Sanz-Hernández, A.; Ferrer, C.; López-Rodríguez, M.E.; Marco-Fondevila, M. Visions, innovations, and justice? Transition contracts in Spain as policy mix instruments. Energy Res. Soc. Sci. 2020, 70, 101762. [Google Scholar] [CrossRef]
  42. Mir-Artigues, P.; Del Río, P. Combining tariffs, investment subsidies and soft loans in a renewable electricity deployment policy. Energy Policy 2014, 69, 430–442. [Google Scholar] [CrossRef] [Green Version]
  43. Murphy, F.; McDonnell, K. A Feasibility Assessment of Photovoltaic Power Systems in Ireland; a Case Study for the Dublin Region. Sustainability 2017, 9, 302. [Google Scholar] [CrossRef] [Green Version]
  44. Li, S.-J.; Chang, T.-H.; Chang, S.-L. The policy effectiveness of economic instruments for the photovoltaic and wind power development in the European Union. Renew. Energy 2017, 101, 660–666. [Google Scholar] [CrossRef]
  45. Gomes, P.V.; Neto, N.K.; Carvalho, L.; Sumaili, J.; Saraiva, J.; Dias, B.; Miranda, V.; Souza, S. Technical-economic analysis for the integration of PV systems in Brazil considering policy and regulatory issues. Energy Policy 2018, 115, 199–206. [Google Scholar] [CrossRef]
  46. Linares, P. The Spanish National Energy and Climate Plan. Econ. Policy Energy Environ. 2019, 1, 161–172. [Google Scholar] [CrossRef]
  47. De Miera, G.S.; González, P.D.R.; Vizcaíno, I. Analysing the impact of renewable electricity support schemes on power prices: The case of wind electricity in Spain. Energy Policy 2008, 36, 3345–3359. [Google Scholar] [CrossRef]
  48. Romeo, L.M.; Bailera, M. Design configurations to achieve an effective CO2 use and mitigation through power to gas. J. CO2 Util. 2020, 39, 101174. [Google Scholar] [CrossRef]
  49. Eveloy, V. Hybridization of solid oxide electrolysis-based power-to-methane with oxyfuel combustion and carbon dioxide utilization for energy storage. Renew. Sustain. Energy Rev. 2019, 108, 550–571. [Google Scholar] [CrossRef]
  50. Bailera, M.; Espatolero, S.; Lisbona, P.; Romeo, L.M. Power to gas-electrochemical industry hybrid systems: A case study. Appl. Energy 2017, 202, 435–446. [Google Scholar] [CrossRef]
  51. Bünger, A.U.; Landinger, H.; Pschorr-Schoberer, E.; Schmidt, P.; Weindorf, W.; Jöhrens, J.; Lambrecht, U.; Naumann, K.; Lischke, A. Power-to-Gas (PtG) in Transport Status quo and Perspectives for Development, Munich, Heidelberg, Leipzig, Berlin. 2014. Available online: http://www.lbst.de/ressources/docs2014/mks-studie-ptg-transport-status-quo-and-perspectives-for-development.pdf (accessed on 7 October 2020).
  52. Doumax-Tagliavini, V.; Sarasa, C. Looking towards policies supporting biofuels and technological change: Evidence from France. Renew. Sustain. Energy Rev. 2018, 94, 430–439. [Google Scholar] [CrossRef]
  53. König, S.; Bchini, Q.; McKenna, R.; Köppel, W.; Bachseitz, M.; Entress, J.; Ryba, M.; Michaelis, J.; Roser, A.; Schakib-Ekbatan, K. Analysing the regional potential and social acceptance of power-to-gas in the context of decentralized co-generation in Baden-Württemberg. J. Energy Storage 2018, 16, 93–107. [Google Scholar] [CrossRef]
  54. Kavvadias, K.; Jimenez Navarro, J.P.; Thomassen, G. Decarbonising the EU Heating Sector: Integration of the Power and Heating Sector; EUR 29772 EN; Publications Office of the European Union: Luxembourg, 2019; ISBN 978-92-76-08386-3. [Google Scholar] [CrossRef]
  55. Llera, E.; Romeo, L.; Bailera, M.; Osorio-Tejada, J.L. Exploring the integration of the power to gas technologies and the sustainable transport. Int. J. Energy Prod. Manag. 2018, 3, 1–9. [Google Scholar] [CrossRef] [Green Version]
  56. Bertuccioli, L.; Chan, A.; Hart, D.; Lehner, F.; Madden, B.; Standen, E. Study on Development of Water Electrolysis in the EU. Fuel Cells and Hydrogen Joint Undertaking; E4tech Sàrl with Element Energy. 2014. Available online: https://www.fch.europa.eu/sites/default/files/FCHJUElectrolysisStudy_FullReport%20(ID%20199214).pdf (accessed on 7 October 2020).
  57. Parra, D.; Zhang, X.; Bauer, C.; Patel, M.K. An integrated techno-economic and life cycle environmental assessment of power-to-gas systems. Appl. Energy 2017, 193, 440–454. [Google Scholar] [CrossRef]
  58. Gutiérrez-Martín, F.; Rodríguez-Antón, L. Power-to-SNG technology for energy storage at large scales. Int. J. Hydrog. Energy 2016, 41, 19290–19303. [Google Scholar] [CrossRef]
  59. Bailera, M.; Lisbona, P.; Llera, E.; Peña, B.; Romeo, L.M. Renewable energy sources and power-to-gas aided cogeneration for non-residential buildings. Energy 2019, 181, 226–238. [Google Scholar] [CrossRef]
  60. Garcia, D.A.; Barbanera, F.; Cumo, F.; Di Matteo, U.; Nastasi, B. Expert Opinion Analysis on Renewable Hydrogen Storage Systems Potential in Europe. Energies 2016, 9, 963. [Google Scholar] [CrossRef] [Green Version]
  61. Botelho, A.; Lourenço-Gomes, L.; Pinto, L.M.C.; Sousa, S.; Valente, M. Accounting for local impacts of photovoltaic farms: The application of two stated preferences approaches to a case-study in Portugal. Energy Policy 2017, 109, 191–198. [Google Scholar] [CrossRef]
  62. Markard, J.; Hoffmann, V.H. Analysis of complementarities: Framework and examples from the energy transition. Technol. Forecast. Soc. Chang. 2016, 111, 63–75. [Google Scholar] [CrossRef]
  63. Llera, E.; Scarpellini, S.; Aranda, A.; Zabalza, I. Forecasting job creation from renewable energy deployment through a value-chain approach. Renew. Sustain. Energy Rev. 2013, 21, 262–271. [Google Scholar] [CrossRef]
  64. Sastresa, E.L.; Usón, A.A.; Bribián, I.Z.; Scarpellini, S. Local impact of renewables on employment: Assessment methodology and case study. Renew. Sustain. Energy Rev. 2010, 14, 679–690. [Google Scholar] [CrossRef]
  65. Oyewo, A.S.; Aghahosseini, A.; Ram, M.; Breyer, C. Transition towards decarbonised power systems and its socio-economic impacts in West Africa. Renew. Energy 2020, 154, 1092–1112. [Google Scholar] [CrossRef]
  66. Zhang, Y.; Kolmakov, A.; Chretien, S.; Metiu, H.; Moskovits, M. Control of Catalytic Reactions at the Surface of a Metal Oxide Nanowire by Manipulating Electron Density Inside It. Nano Lett. 2004, 4, 403–407. [Google Scholar] [CrossRef]
  67. Nastasi, B.; Basso, G.L. Power-to-Gas integration in the Transition towards Future Urban Energy Systems. Int. J. Hydrogen Energy 2017, 42, 23933–23951. [Google Scholar] [CrossRef]
  68. Bailera, M.; Lisbona, P. Energy storage in Spain: Forecasting electricity excess and assessment of power-to-gas potential up to 2050. Energy 2018, 143, 900–910. [Google Scholar] [CrossRef] [Green Version]
  69. Koelbl, B.S.; Broek, M.V.D.; Wilting, H.C.; Sanders, M.W.; Bulavskaya, T.; Wood, R.; Faaij, A.P.; Van Vuuren, D.P. Socio-economic impacts of low-carbon power generation portfolios: Strategies with and without CCS for the Netherlands. Appl. Energy 2016, 183, 257–277. [Google Scholar] [CrossRef] [Green Version]
  70. Daddi, T.; Bleischwitz, R.; Todaro, N.M.; Gusmerotti, N.M.; De Giacomo, M.R. The influence of institutional pressures on climate mitigation and adaptation strategies. J. Clean. Prod. 2020, 244, 118879. [Google Scholar] [CrossRef]
  71. Scarpellini, S.; Portillo-Tarragona, P.; Aranda-Usón, A.; Llena-Macarulla, F. Definition and measurement of the circular economy’s regional impact. J. Environ. Plan. Manag. 2019, 62, 2211–2237. [Google Scholar] [CrossRef]
  72. Matti, C.; Consoli, D.; Uyarra, E. Multi level policy mixes and industry emergence: The case of wind energy in Spain. Environ. Plan. C Politi. Space 2016, 35, 661–683. [Google Scholar] [CrossRef]
  73. Gimeno, J. Ángel; Llera-Sastresa, E.; Scarpellini, S. A Heuristic Approach to the Decision-Making Process of Energy Prosumers in a Circular Economy. Appl. Sci. 2020, 10, 6869. [Google Scholar] [CrossRef]
  74. Korhonen, J.; Honkasalo, A.; Seppälä, J. Circular Economy: The Concept and its Limitations. Ecol. Econ. 2018, 143, 37–46. [Google Scholar] [CrossRef]
  75. Smol, M.; Kulczycka, J.; Avdiushchenko, A. Circular economy indicators in relation to eco-innovation in European regions. Clean Technol. Environ. Policy 2017, 19, 669–678. [Google Scholar] [CrossRef] [Green Version]
  76. Aranda-Usón, A.; Moneva, J.M.; Portillo-Tarragona, P.; Llena-Macarulla, F. Measurement of the circular economy in businesses: Impact and implications for regional policies. Econ. Policy Energy Environ. 2019, 187–205. [Google Scholar] [CrossRef]
  77. Committe on Climate Change. Net Zero: The UK’s Contribution to Stopping Global Warming; Committe on Climate Change: London, UK, 2019; Available online: https://www.theccc.org.uk/wp-content/uploads/2019/05/Net-Zero-The-UKs-contribution-to-stopping-global-warming.pdf (accessed on 7 October 2020).
  78. U.S. Department of Energy Effects of a Transition to a Hydrogen Economy on Employment in the United States Report to Congress. Available online: https://www.hydrogen.energy.gov/pdfs/epact1820_employment_study.pdf (accessed on 5 October 2020).
  79. Ram, M.; Aghahosseini, A.; Breyer, C. Job creation during the global energy transition towards 100% renewable power system by 2050. Technol. Forecast. Soc. Chang. 2020, 151, 119682. [Google Scholar] [CrossRef]
  80. Brodny, J.; Tutak, M. Analyzing Similarities between the European Union Countries in Terms of the Structure and Volume of Energy Production from Renewable Energy Sources. Energies 2020, 13, 913. [Google Scholar] [CrossRef] [Green Version]
  81. Portillo-Tarragona, P.; Scarpellini, S.; Moneva, J.M.; Valero-Gil, J.; Aranda, A. Classification and Measurement of the Firms’ Resources and Capabilities Applied to Eco-Innovation Projects from a Resource-Based View Perspective. Sustainability 2018, 10, 3161. [Google Scholar] [CrossRef] [Green Version]
Figure 1. Aggregated rating in typologies of barriers and incentives.
Applsci 10 07907 g001
Table 1. Profile of the experts selected as key informants.
Type of OrganizationProfile of the Experts
Public administration, R&D institutes, and other organizations5 engineers, 2 scientists, 1 economist
Industries, private companies that operate in the energy sector and professionals5 engineers, 1 lawyer, 1 other
Table 2. Results of the experts’ interviews regarding barriers to power-to-gas (PtG).
CodeQuestionsResults
B.01To what extent is the REGULATION an obstacle to PtG deployment?62% very relevant or highly relevant.
Average 3.7
B.02To what extent is the LACK OF EQUIPMENT an obstacle to PtG deployment?55% very relevant or highly relevant.
Average 3.5
B.03To what extent is the PRICE OF THE ELECTROLYSER an obstacle?73% very relevant or highly relevant.
Average 3.7
B.04To what extent is the LACK OF INVESTMENT IN R&D an obstacle?46% very relevant or highly relevant.
Average 3.5
B.05To what extent is the difficulty of obtaining FINANCING an obstacle?64% very relevant or highly relevant.
Average 3.5
B.06To what extent does THE PAYBACK PERIOD OF THE INVESTMENT hinder PtG?92% very relevant or highly relevant.
Average 4.3
B.07To what extent does the COMPLEXITY of the facilities hinder PtG?42% very relevant or highly relevant.
Average 2.8
B.08To what extent does the lack of INTEREST on the part of customers hinder PtG technologies?42% very relevant or highly relevant.
Average 3.4
B.09To what extent does subsequent MAINTENANCE hinder the installation of PtG?27% very relevant or highly relevant.
Average 2.8
B.10To what extent is the high volume of initial INVESTMENT an obstacle to PtG deployment?73% very relevant or highly relevant.
Average 3.5
Table 3. Results of the experts’ interviews regarding incentives to PtG.
CodeQuestionsResults
I.01To what extent would a substantial change in LEGISLATION encourage PtG?83% very relevant or highly relevant. Average 4.0
I.02To what extent would fostering EQUIPMENT encourage PtG?58% very relevant or highly relevant. Average 3.4
I.03To what extent would lower TECHNOLOGY PRICES increase PtG?77% very relevant or highly relevant. Average 4.2
I.04To what extent would fostering the collaboration with R&D centers drive PtG?46% very relevant or highly relevant. Average 3.3
I.05To what extent would SUBSIDIES promote PtG?85% very relevant or highly relevant. Average 4.2
I.06To what extent would rising the PRICE OF ELECTRICITY mean more PtG installations?55% very relevant or highly relevant. Average 3.5
I.07To what extent would making easier the INSTALLATION PROCESS increase PtG deployment?83% very relevant or highly relevant. Average 3.8
I.08To what extent would INFORMATION CAMPAIGNS encourage PtG installations?46% very relevant or highly relevant. Average 3.3
I.09To what extent would lower MAINTENANCE COSTS increase PtG?62% very relevant or highly relevant. Average 3.8
I.10To what extent subsidies/incentives to new installations would facilitate PtG deployment?50% very relevant or highly relevant. Average 3.6
Table 4. Installation costs of the different systems of a PtG unit (€/kW) (* own elaboration from [10]).
202520302050
PV plant1000950800
Alkaline electrolyzer *676581318
PEM electrolyzer *943780365
Methanizer *779632274
Table 5. Installed capacity, investment, CO2 captured, and synthetic natural gas (SNG) produced.
PeriodCumulated PtG Capacity (Expressed as Installed Photovoltaics MW)Cumulated Investment (Thousands of €)Thousand Tons of CO2 CapturedNm3 of SNG Produced
Up to 20253578,5875026 × 106
2025–203012852,559,0621903962 × 106
2030–2050928512,918,60155,43728,027 × 106
Table 6. Employment factors estimation (own elaboration from [78]).
202020352050
High DeploymentModerate DeploymentHigh DeploymentModerate DeploymentHigh DeploymentModerate Deployment
TOTAL t/d117,26616,694117,26516,694176,54983,811
TOTAL jobs305060043,060558050,83020,610
Average employment factor [jobs/(t/d)]0.510.450.370.330.290.25
Employment factor for distributed installations [jobs/(t/d)]2.55 1.85 1.48
Table 7. Estimated scenarios of the PtG deployment in Spain and evolution of the main socio-economic impacts.
202520302050
Installed Capacity (MW)CAPEX (Thousand Euro)Jobs (Tot. FT Equiv.)Capt. CO2 (Thousand Tons)Installed Capacity (MW)CAPEX (Thousand Euro)Jobs (Tot. FT Equiv.)Capt. CO2 (Thousand Tons)Installed Capacity (MW)CAPEX (Thousand Euro)Jobs (Tot. FT Equiv.)Capt. CO2 (Thousand Tons)
Pessimistic2863,742107408751,758,4473200126148006,268,30813,85127,675
Technical3579,6781345012502,512,06845711802800010,447,17923,08646,126
Business as usual56127,4842148120624,144,9117543297313,60017,760,20539,24678,414
Optimistic70159,35526810126255,275,3429600378417,60022,983,79550,789101,477
Table 8. Matrix of factors for the PtG scenario analysis.
Factors of Analysis–PtG DeploymentPessimistic (with Barriers)TechnicalBusiness as Usual (Energy Incentives)Optimistic (with CE Incentives)
Barrier(a) High price of electrolyzer−0.1000
Barrier(b) Payback period−0.1000
Incentive(c) Feed-in-tariff000.30.3
Incentive(d) Regulation000.30.3
CE Incentive(e) Incentives to CE (RES)0000.2
CE Incentive(f) Limits to CO2 emissions (CE)0000.2
λ2025−0.200.61
λ2030−0.300.651.1
λ2050−0.400.71.2
Publisher’s Note: MDPI stays neutral with regard to jurisdictional claims in published maps and institutional affiliations.

