Abstract
Different location and incidence of lower extremity injuries have been reported in rearfoot strike (RFS) and forefoot strike (FFS) recreational runners. These might be related to functional differences between the two footstrike patterns affecting foot kinematics and thus the incidence of running injuries. The aim of this study was to investigate and compare the kinematic patterns of foot joints between naturally RFS and FFS runners. A validated multi-segment foot model was used to measure 24 foot kinematic variables in long-distance recreational runners while running on a treadmill. These variables included the three-dimensional relative motion between rearfoot, midfoot, and forefoot segments. The footstrike pattern was identified using kinematic data and slow-motion videos. Functional analysis of variance was used to compare the time series of these variables between RFS (n = 49) and FFS (n = 25) runners. In FFS runners, the metatarsal bones were less tilted with respect to the ground, and the metatarsus was less adducted with respect to the calcaneus during stance. In early stance, the calcaneus was more dorsiflexed with respect to the shank and returned to a more plantarflexed position at push-off. FFS runners showed a more adducted calcaneus with respect to the shank and a less inverted midfoot to the calcaneus. The present study has showed that the footstrike angle characterizes foot kinematics in running. These data may help shed more light on the relationship between foot function and running-related injuries.
1. Introduction
The footstrike pattern of runners has received much attention in the past decade, particularly the differences between rearfoot strike (RFS) and midfoot or forefoot strike (FFS). This increasing interest in footstrike patterns can be justified by the possible associations with running-related injuries [1,2,3,4]. In particular, FFS has been found to be associated with the attenuation of the lower limbs loads, which helps to reduce the incidence of running-related injuries [4,5]. However, RFS mitigates part of the Achilles tendon loading rate the foot is accountable for, especially in early stance [3].
The effect of striking patterns on lower limb joint kinetics and kinematics has thus far been reported, while foot joint and segment kinematics have rarely been investigated and in a limited number of foot joints and segments only [6,7,8,9]. Lower limb kinematics showed that FFS presents the foot angle at initial contact in a plantar flexed position and RFS in dorsiflexed position [10]. In addition, FFS runners contact the ground with greater knee flexion compared to RFS runners [10]. Kinematic differences have also been reported in the frontal plane, where greater rearfoot eversion is observed in FFS compared to RFS [10].
Two recent studies used multi-segment foot models to investigate and compare kinematic patterns in RFS or FFS running. Kelly et al. [7] analyzed the influence of the foot strike technique on medial longitudinal arch mechanics and intrinsic foot muscle function during running. As expected, it was observed that midfoot and rearfoot joint angles of FFS runners were more plantarflexed at footstrike, the rearfoot was less dorsiflexed at mid-stance, and there was more ankle plantarflexion at toe-off compared to the RFS runners. In addition, FFS runners presented a larger loading on the midfoot, which was associated with greater intrinsic foot muscles activation, probably to increase elastic energy storage and return while preventing excessive midfoot deformation. In this study, however, only 13 runners were assessed, and no objective measure was used to determine the runners striking patterns. In fact, runners were instructed to run using an FFS pattern, even if this was not their typical striking pattern. The other study, conducted by Bruening et al. [9], showed that during loading response, the ankle is more plantarflexed, inverted, and adducted in FFS compared to RFS. The midtarsal joint is less inverted and less adducted at initial contact in FFS. During the early stance, the midtarsal has a greater dorsiflexion range and reduced abduction excursion. During the loading phase, the midtarsal is more inverted in FFS and more everted in RFS. The midtarsal joint increases the plantarflexion excursion at late stance in FFS. Finally, the metatarsophalangeal joints are less plantarflexed at early stance, and the dorsiflexion range increases during late stance. However, in this study, the participants were not habitually FFS or RFS, and the authors did not control for potential adaptations that may occur due to the conversion of the footstrike pattern during the data collection session.
We propose another way of analyzing the foot kinematic without immediately resorting to reductionism of variables, analyzing the whole time series using a functional data analysis, instead of a collection of discrete variables within a time series. In this study, we focus on improving our understanding on the effects of the striking pattern on foot kinematics by using a validated multi-segment foot model applied on a large population of naturally RFS and FFS runners. The present results may contribute to further expand our comprehension of the relationships between foot function and running-related injuries, as there are differences in type of injuries reported in FFS and RFS. For example, posterior lower leg injuries are reported for FFS and repetitive stress injuries are reported in RFS [3,4,5]. Moreover, differences have also been reported in running economy strategies, with FFS being more efficient, therefore resulting in an increased performance compared to RFS during acute transitioning from one pattern to another [11].
In summary, the main limitations of the previous studies were (i) the populations analyzed, these being not naturally FFS and RFS runners; (ii) the lack of control the motor adaptations which occur as runners forcibly convert their footstrike pattern; and (iii) the small sample, the largest size being 18 runners only [9]. Thus, the aim of the present study was to overcome these limitations, investigating and comparing 3D kinematic patterns of foot joints and segments between large populations of naturally RFS and FFS recreational runners. Our hypotheses were: (i) FFS runners land with the more plantarflexed forefoot compared to RFS runners; (ii) first and second metatarsal bones of FFS runners are less inclined with respect to the ground at foot contact due to the their landing strategy; and (iii) metatarsal bones of RFS runners present an upward orientation with respect to the ground at initial contact.
2. Methods
2.1. Participants
From a larger ongoing randomized controlled trial, 83 healthy distance runners (age 41.0 ± 6.5 years; running 21.3 ± 14.7 km/week) were assessed. Participants provided informed written consent, and all procedures undertaken were approved by the Ethics Committee of the School of Medicine of the University of São Paulo (protocol number: 031/15). The protocol was previously registered with ClinicalTrials.gov (identifier: NCT02306148). Eligibility criteria included recreational runners between 18 and 55 years old who had been running 20–100 km/week for at least 1 year, with no history of running-related injuries in the 2 months prior to the functional assessment, no experience with minimalist shoes, neutral (normal) feet as determined by the Foot Posture Index, and without chronic diseases or impairments that could influence running performance (e.g., osteoarthritis). An a priori sample size calculation was performed using G*Power [10] considering the averages and standard deviations during late stance of the two groups (RFS and FFS) for the midtarsal flexion/plantarflexion range of motion based on a previous study [9], resulting in a sample size of 72 for 80% power. Due to a larger number of RFS runners compared to FFS, a proportion of 2:1 (RFS:FFS) was used for the sample size calculation [2].
2.2. Protocol and Instrumentation
The shank and foot of each participant were outfitted with 16 reflective skin markers (9 mm in diameter) according to the Rizzoli Foot Model (Figure 1) [12,13]. An eight-camera motion analysis system (Vicon Motion System Ltd., Oxford Metrics, Oxford, UK) collected three-dimensional (3D) upright standing and kinematic data during barefoot running at 200 Hz. The participants ran on a force-sensing tandem treadmill at their self-selected speed (AMTI, Watertown, MA, USA) in order to minimize the variability of foot segment motion [14], and were not instructed to use any particular footstrike pattern. A 2–3 min warm-up and familiarization with running barefoot on the treadmill was given to each participant. At least 10 consecutive successful trials with the runners’ natural pattern were used in the data analysis.
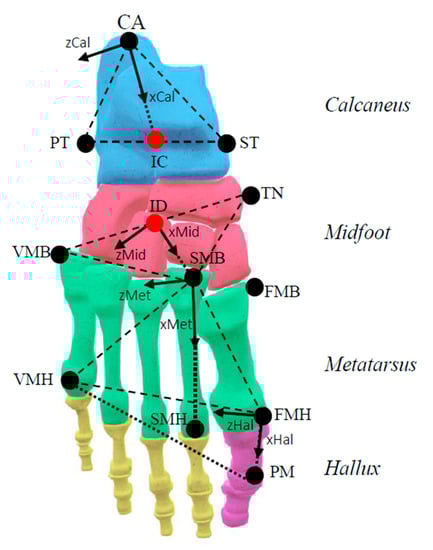
Figure 1.
Diagram of the analyzed foot segments with relevant anatomical landmarks and coordinate reference frames (see Leardini et al., 2007). These were assumed to be rigid segments. CA: upper central ridge of the calcaneus posterior surface, ST: medial apex of the sustentaculum tali, PT: lateral apex of the peroneal tubercle, TN: medial apex of the tuberosity of the navicular, VMB: base of the fifth metatarsal, dorsolateral aspect of the fifth metatarso-cuboid joint, FMB: base of the first metatarsal, dorsomedial aspect of the first metatarso-cuneiform joint, VMH: Head of the fifth metatarsal, dorsolateral aspect of the fifth metatarsophalangeal joint, FMH: head of the first metatarsal, dorsolateral aspect of the first metatarsophalangeal joint, SMH: Head of the second metatarsal, dorsomedial aspect of the second metatarsophalangeal joint, SMB: second metatarsal base, assumed to coincide with the most distal and dorsal aspect of the middle cuneiform, PM: Most distal and dorsal point of the head of the proximal phalanx of the hallux, IC: midpoint of the straight line between PT and ST, ID: midpoint of the straight line between TN and VMB.
Runners were first asked what they believed to be their typical footstrike pattern. This self-reported pattern was verified against kinematic data (e.g., the footstrike angle) and slow-motion sagittal-plane videos from high-speed cameras (120 Hz) (Figure 2). Whenever the footstrike pattern differed from the self-reported one, the runner was asked to maintain its self-reported pattern and was given more time to familiarize with treadmill running. Footstrike angle was defined as the sagittal-plane foot angle relative to the ground at foot contact. The foot angle was defined as shown in Figure 3. Positive foot angles were associated with the RFS pattern and negative foot angles with FFS. Each runner was deemed to be RFS or FFS if the pattern was consistent across more than 30 barefoot strikes out of 50. Those runners who presented a mixed footstrike pattern were excluded from the analysis. Those runners who presented more than 70% of the steps with the same foot strike pattern were included, and 10 consecutive steps presenting the same footstrike pattern were used in the analysis.
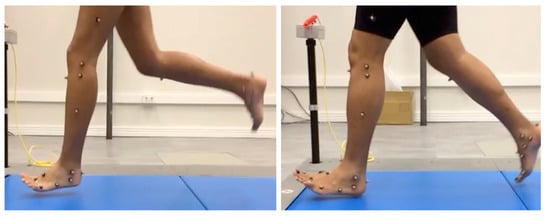
Figure 2.
Illustrations showing the experimental protocol, taken while subjects were running on the force-sensing tandem treadmill at their self-selected speed. Runner’s typical footstrike pattern, either forefoot (FFS, left picture) or rearfoot strike (RFS, right picture) pattern, was verified against kinematic data and slow-motion sagittal-plane videos from high-speed cameras.
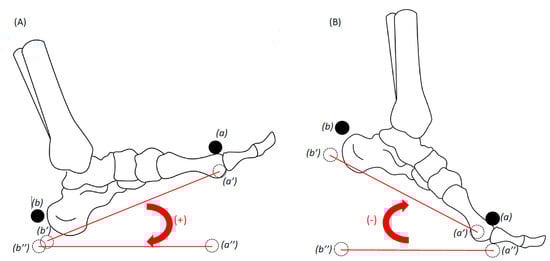
Figure 3.
Foot angle is defined as the angle created by the bisection of a vector from the marker located on the first metatarsal head (a) projected on the foot sole (a’) to the marker located on the calcaneus posterior surface (b) projected on the foot sole (b’), with another vector from the marker located on the first metatarsal head (a) projected on the ground (a’’) to the marker located on the calcaneus posterior surface (b) projected on the ground (b’’) onto the sagittal plane of the foot. Positive foot angles were associated with the (A) rearfoot (RFS) pattern and negative foot angles with (B) forefoot pattern (FFS).
2.3. Data Analysis
The Nexus software (version 2.10.3, Vicon, Oxford, UK) was used to reconstruct the 3D coordinates of the skin markers during running. Markers’ trajectories were filtered using a Woltring low-pass filter (cutoff frequency = 10 Hz), and processed in Visual3D (C-Motion, Germantown, MD, USA) for joint angles calculation using the joint coordinate system [15]. Accordingly, the present convention for joint rotations was established: dorsi/plantarflexion was assumed to be the rotation about the Z-axis (medio-lateral) of the proximal segment, abduction/adduction the rotation about the Y-axis (vertical) of the distal segment, and eversion/inversion the rotation about the axis orthogonal to the previous two. Ground reaction forces were sampled at 1000 Hz and used to determine stance events and phases. All kinematic data were normalized to the running stance phase duration. The average of each variable across 10 consecutive trials was calculated and used for statistical analysis for each subject. All calculations were performed in Matlab R2015a (MathWorks, Natick, MA, USA).
Rotations about the three axes of the joint coordinate system for the following pairs of segments were analyzed: shank and foot (Sha-Foo); shank and calcaneus (Sha-Cal); calcaneus and midfoot (Cal-Mid); midfoot and metatarsus (Mid-Met), and calcaneus and metatarsus (Cal-Met). Sagittal- and transversal-plane motion between hallux and metatarsus (Met-Hal) were also analyzed. Moreover, sagittal-plane inclination of the first (F2G) second (S2G) and fifth metatarsal bones (V2G) to the ground, and the transverse-plane divergence between first and second metatarsal bones (S2F) and between second and fifth metatarsal bones (S2V) were analyzed. The medial longitudinal arch angle (MLA) was defined as the 3D angle between two vectors, with apex at the marker on the talo-navicular joint and bounded by the markers on the calcaneus (projected on the ground) and on the head of the first metatarsal bone [16].
Groups were compared using the t-test and Chi-squared test or Fisher’s exact test for anthropometric, demographic, and training variables (age, Arch Index, and Foot Posture Index) using an alpha level of 0.05. Outcome variables were compared between groups using functional data analysis (FDA), which allow analysis of the full time series of each variable represented by mathematical functions, allowing the analysis of more than a few sets of points. In the functional analysis of variance (fdANOVA), the parameters of the dependent variable are functions, and the design matrix remains a general linear model [17]. This was performed by applying spline bases to the time series before performing fdANOVA using RStudio Software Version 1.2.1335 and the package fdANOVA [18]. For further analysis, we performed fdANOVA to gain a better understanding of the whole movement patterns. Averaged waveforms were time normalized to stance phase, and then means and standard error (SE) bands for each strike pattern were plotted. Mean differences between strike patterns were plotted with 95% confidence interval (CI) bands, which were considered significantly different if p < 0.05 and the CI bands did not cross 0.
3. Results
Nine runners presented a non-identifiable footstrike pattern (mix of RFS and FFS patterns) and were thus were removed from the analysis. Of the remaining 74 runners, 49 presented the RFS pattern and 25 the FFS pattern. No differences were found for body mass, height, age, self-selected running speed, or Foot Posture Index between the two groups (Table 1).

Table 1.
Mean (standard deviation) demographics for naturally FFS and RFS runners.
In the FFS group, a negative foot angle was associated with a forefoot landing strategy, while in the RFS group, positive values were associated with a heel-first landing strategy (p < 0.001) (Figure 4). The FFS and RFS groups had a similar dorsiflexion of Sha-Foo at footstrike. At around 15% of stance, the Sha-Foo of FFS runners was slightly more dorsiflexed compared to that of RFS. At around 45% of stance, FFS runners reduced the dorsiflexion and returned to a position of greater plantarflexion compared to RFS runners for the remainder of the stance phase (p < 0.001). RFS runners increased Sha-Foo dorsiflexion until 60% of stance, reached a larger dorsiflexion angle, and began plantarflexing later than RFS runners (p < 0.001). FFS runners presented a significantly more adducted Sha-Cal (p = 0.02) (Figure 4) and a less adducted Cal-Met (p = 0.01) with respect to RFS runners during the whole stance phase (Figure 5). The Cal-Mid was significantly less inverted in the FFS group during the whole stance phase (p = 0.01) (Figure 5).
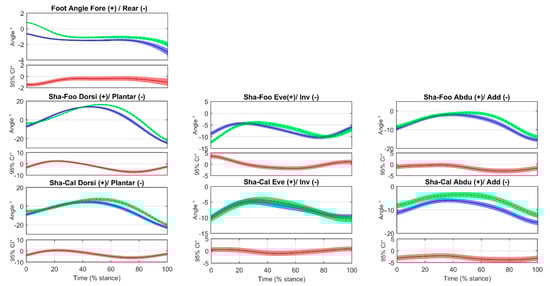
Figure 4.
Foot angle with respect to the shank (Sha-Foo) and calcaneus with respect to the shank (Sha-Cal) joint angles time normalized across stance phase (0–100%) for forefoot strike (FFS) and rearfoot strike (RFS) patterns. Mean ± standard error (SE) bands are reported (shaded regions). Below of each angle plot, there is a between footstrike pattern difference plot (FFS–RFS) containing the mean ± 95% confidence interval (CI) bands (in red). Regions where those bands diverge from 0 can be considered regions of significant differences. (Legend: FFS in blue, RFS in green).
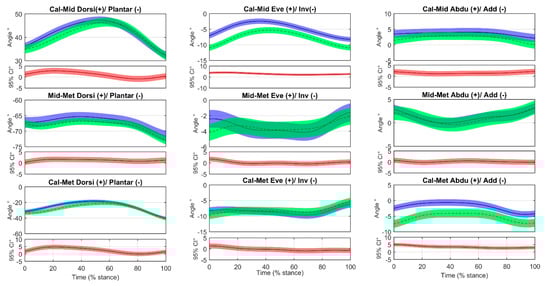
Figure 5.
Midfoot with respect to the calcaneus (Cal-Mid), metatarsus with respect to the midfoot (Mid-Met), and metatarsus with respect to the calcaneus (Cal-Met) joint angles time normalized across stance phase (0–100%) for forefoot strike (FFS) and rearfoot strike (RFS) patterns. Mean ± standard error (SE) bands are reported (shaded regions). Below of each angle plot, there is a between footstrike pattern difference plot (FFS–RFS) containing the mean ± 95% confidence interval (CI) bands (in red). Regions where those bands diverge from 0 can be considered regions of significant differences. (Legend: FFS in blue, RFS in green).
F2G and S2G angles presented similar patterns at 20–60% of the stance phase, with RFS runners presenting smaller angles at initial contact. FFS runners presented a significantly larger downward rotation of F2G and S2G after 60% of stance time (p < 0.001) (Figure 6). V2G angle was significantly different at initial contact between the two groups (p < 0.001). During the first 25% of stance, FFS runners were in a neutral V2G position, while the RFS showed an upward orientation of the V2G. At about 50% of stance, FFS runners returned to a more downward rotation of F2G, S2G, and V2G (p < 0.01) (Figure 6). No differences were found in S2F, S2V, MLA, Mid-Met, or Met-Hal angles for all planes between FFS and RFS groups.
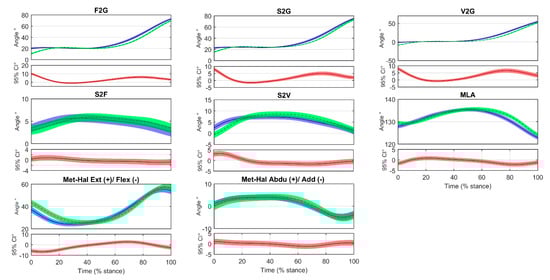
Figure 6.
Sagittal-plane inclination of the first metatarsal bone to the ground (F2G), of the second metatarsal bone to the ground (S2G), and of the fifth metatarsal bone to the ground (V2G); transverse-plane divergence between first and second metatarsal bones (S2F) and between fifth and second metatarsal bones (S2V); and first metatarsus and hallux angle (Met-Hal). Time was normalized across stance phase (0–100%) for forefoot strike (FFS) and rearfoot strike (RFS) patterns. Mean ± standard error (SE) bands are reported (shaded regions). Below of each angle plot, there is a between footstrike pattern difference plot (FFS–RFS) containing the mean ± 95% confidence interval (CI) bands (in red). Regions where those bands diverge from zero can be considered regions of significant differences. (Legend: FFS in blue, RFS in green).
4. Discussion
The purpose of this study was to investigate and compare foot joint and segment kinematics between naturally RFS and FFS runners using an established and validated multi-segment kinematic model. In accordance with the first hypothesis, FFS runners landed with the forefoot first and showed an anticipated change in the Sha-Foo plantar/dorsiflexion in the stance phase compared to RFS runners. However, at mid-stance (15–40%), the Sha-Foo of FFS runners was more dorsiflexed, probably due to the larger external ankle dorsiflexion moment associated with this landing strategy [9]. The second hypothesis was also confirmed, as the first and second metatarsal bones in FFS runners was less inclined in relation to the ground (more dorsiflexed) at initial contact. With respect to the third hypothesis, RFS runners showed the fifth metatarsal bone in a upward orientation with respect to the ground and this orientation was combined with a greater adduction of the metatarsus relative to the calcaneus (Cal-Met) at initial contact. These observations are consistent with the theoretical model of an oblique midtarsal joint where plantarflexion is associated with adduction [19,20,21] when running with an RFS pattern, which was not found in FFS runners.
The larger ankle (i.e., Sha-Foo) plantarflexion at heel strike in FFS runners requires a higher eccentric activity of the calf muscles. This may lead to Achilles tendinopathy and muscle strain if these soft tissues are not adequately trained for these conditions [10,22]. However, RFS runners are generally more susceptible to injuries due to the higher loads transmitted to the lower limb at heel strike [23,24].
In agreement with Bruening et al. [9], the midfoot of FFS runners was less inverted with respect to the calcaneus (i.e., Cal-Mid joint) throughout the stance phase. In RFS runners, the larger inversion may play an important role in the so-called twisted osteoligamentous plate in the foot structure [25], resulting in an increased resistance to overall foot pronation during the loading phase of running, when this plate tends to untwist, thus providing the necessary protection for the tibiotalar joint from high-impact forces during the stance phase [6,26]. This larger inversion in RFS may also contribute to the conversion of the foot into a sort of rigid lever, which is necessary for effective propulsion during running [27,28].
The calcaneus was more adducted with respect to the shank (i.e., Sha-Cal joint) in the FFS group during the whole stance phase. Fisher et al. [29] showed that calcaneus adduction may be beneficial to the ankle joint coupling, acting as a mechanism to control excessive tibial rotation. This was reported to be associated with patellofemoral pain and iliotibial band syndrome [30], as high relative rotation between the tibia and femur may alter the patella tracking on the distal femur [31]. The present results seem to suggest a biomechanical mechanism that might explain how a transition from RFS to FFS patterns in gait retraining could reduce patellofemoral pain in runners [32,33] since FFS runners run with a more adducted calcaneus, thus improving ankle joint coupling and tibial rotation control.
The main strengths of this study are the adoption of a reliable and validated skin marker-based multi-segment foot model, which included the tracking of the midfoot and analysis of a large sample of naturally FFS or RFS runners. In particular, by not imposing any footstrike pattern on the participants, we avoided any potential adaptation that might have occurred in converting their footstrike pattern. However, some limitations should be considered when assessing the results of this study. Foot joint kinematics were collected barefoot, which differ from the shod condition; this is indeed difficult to implement using any skin-marker-based multi-segment foot model. However, both groups were subjected to the same testing conditions; thus, if there was any significant change in foot kinematics due to the barefoot condition, this likely affected both groups. Although runners were assessed on a treadmill, the literature shows that most of the spatiotemporal, kinematic, and kinetic parameters are similar between treadmill and overground running [34]. Sinclair et al. [35] examined differences in multi-segment foot kinematics during treadmill and overground running and found only one difference at the ankle and not in the other foot joints: greater plantarflexion at footstrike in treadmill running. Because of the barefoot condition, it is possible that the typical footstrike technique declared by the participant and checked on the treadmill while running barefoot would not be reproduced when running shod in real-world environments. However, Bade et al. [36] suggested that the ability of runners to accurately self-report the footstrike pattern is poor, even when shod.
Despite these limitations, runners could clearly be classified by their strike patterns regarding their foot joint motion. Future prospective studies should address the correlations between running-related injuries and footstrike patterns to potentially improve injury prevention and rehabilitation. The kinematic findings of the present study may be of interest to clinicians and other health professionals to support strategies to prevent or to rehab specific types of injury associated with FFS or RFS, such as plantar fasciitis, Achilles tendinopathy, and metatarsals stress fractures [1], through biomechanics guidance regarding the footstrike patterns.
5. Conclusions
FFS and RFS runners were found to be characterized by distinct foot joint rotations and bone orientations. In particular, FFS runners landed with the metatarsal bones less tilted with respect to the ground, maintained the metatarsus less adducted during stance and, after landing, maintained the ankle more in dorsiflexion, to return to plantarflexion at push-off. Additionally, FFS runners showed a more adducted calcaneus to the shank and a less inverted midfoot with respect to the calcaneus in the entire stance phase. The present results also brought more evidence on the effect of the footstrike angle on the kinematic pattern of the foot-ankle complex which can be responsible for the differences in running-related injuries, load responses, and running economy strategies between FFS and RFS as largely reported in the literature.
Author Contributions
All authors made substantial contributions to all three of sections. All authors contributed to (1) the conception and design of the study, acquisition of data, and analysis and interpretation of data; (2) the drafting of the article and critical revision for important intellectual content; and (3) the final approval of the version to be submitted. In the study, these authors took primary responsibility for the following roles: I.C.N.S. was responsible for the study design, interpretation of the data, writing the report, submission of the manuscript, and management. A.B.M. and U.T.T. were responsible for the study design, data collection, analysis, interpretation, writing the report, and submission of the manuscript. P.C. and A.L. were responsible for the study design, interpretation of the data, writing the report, and submission of the manuscript. All authors contributed to the initial draft, revised the manuscript, provided feedback, and approved the final manuscript. All authors have read and agreed to the published version of the manuscript.
Funding
State of São Paulo Research Foundation (FAPESP) funded the project (2015/14810-0), the fellowship of Paolo Caravaggi (2017/23975-8) and Alessandra Matias (2016/17077-4 and 2017/26844-1). Isabel C.N. Sacco is a fellow of the National Council for Scientific and Technological Development (CNPq) (Process: 304124/2018-4). Ulisses Taddei was awarded by Agency Coordination of Improvement of Higher Education Personnel (CAPES, Coordenação de Aperfeiçoamento de Pessoal de Nível Superior), financial code 001. The funders do not have any role in the study and do not have any authority over any study activity or in the decision to submit the report for publication.
Conflicts of Interest
The authors affirm that this study did not receive any funding/assistance from a commercial organization that could lead to a conflict of interest.
Data Availability
All data access and storage are in keeping with National Health and Medical Research Council guidelines, as approved. All non-confidential files are available from the database published at figshare.com (https://doi.org/10.6084/m9.figshare.10003406.v2). Supported data are available upon request.
Ethics Approval and Consent to Participate
This study was approved by the Ethics Committee of the School of Medicine of the University of São Paulo (18/03/2015, Protocol # 031/15), according to the Declaration of Helsinki Ethical Principles for Medical Research Involving Human Subjects. It was registered at ClinicalTrials.gov (a service of U.S. National Institutes of Health) Identifier NCT02306148 (28 November 2014) under the name “Effects of Foot Strengthening on the Prevalence of Injuries in Long-Distance Runners”. The main researcher explained to each eligible participant every step of the assessment and follow-up, possible risks, and that no compensation or benefits were to be expected. When agreeing to participate, participants were asked for written informed consent, according to standard forms.
References
- Davis, I.S.; Rice, H.M.; Wearing, S.C. Why forefoot striking in minimal shoes might positively change the course of running injuries. J. Sport Heal. Sci. 2017, 6, 154–161. [Google Scholar] [CrossRef] [PubMed]
- de Almeida, M.O.; Saragiotto, B.T.; Yamato, T.P.; Lopes, A.D. Is the rearfoot pattern the most frequently foot strike pattern among recreational shod distance runners? Phys. Ther. Sport 2015, 16, 29–33. [Google Scholar] [CrossRef] [PubMed]
- Almonroeder, T.; Willson, J.D.; Kernozek, T.W. The effect of foot strike pattern on achilles tendon load during running. Ann. Biomed. Eng. 2013, 41, 1758–1766. [Google Scholar] [CrossRef] [PubMed]
- Futrell, E.E.; Jamison, S.T.; Tenforde, A.S.; Davis, I.S. Relationships between Habitual Cadence, Footstrike, and Vertical Load Rates in Runners. Med. Sci. Sports Exerc. 2018, 50, 1837–1841. [Google Scholar] [CrossRef]
- Bowser, B.J.; Fellin, R.; Milner, C.E.; Pohl, M.B.; Davis, I.S. Reducing impact loading in runners: A one-year follow-up. Med. Sci. Sports Exerc. 2018, 50, 2500–2506. [Google Scholar] [CrossRef] [PubMed]
- Deschamps, K.; Eerdekens, M.; Peters, H.; Matricali, G.A.; Staes, F. Multi-segment foot kinematics during running and its association with striking patterns. Sport. Biomech. 2019, 00, 1–14. [Google Scholar] [CrossRef]
- Kelly, L.A.; Farris, D.J.; Lichtwark, G.A.; Creswell, A.G. The Influence of Foot-Strike Technique on the Neuromechanical Function of the Foot. Med. Sci. Sports Exerc. 2018, 50, 98–108. [Google Scholar] [CrossRef] [PubMed]
- Peters, H.; Deschamps, K.; Matricali, G.A.; Staes, F. Foot segmental mobility during subphases of running: Comparative study between two striking patterns. Gait Posture 2017, 53, 127–130. [Google Scholar] [CrossRef]
- Bruening, D.A.; Pohl, M.B.; Takahashi, K.Z.; Barrios, J.A. Midtarsal locking, the windlass mechanism, and running strike pattern: A kinematic and kinetic assessment. J. Biomech. 2018, 73, 185–191. [Google Scholar] [CrossRef]
- Almeida, M.O.; Davis, I.S.; Lopes, A.D. Biomechanical Differences of Foot-Strike Patterns During Running: A Systematic Review With Meta-analysis. J. Orthop. Sport. Phys. Ther. 2015, 45, 738–755. [Google Scholar] [CrossRef]
- Warne, J.P.; Warrington, G.D. Four-week habituation to simulated barefoot running improves running economy when compared with shod running. Scand. J. Med. Sci. Sport. 2014, 24, 563–568. [Google Scholar] [CrossRef] [PubMed]
- Leardini, A.; Benedetti, M.G.; Berti, L.; Bettinelli, D.; Nativo, R.; Giannini, S. Rear-foot, mid-foot and fore-foot motion during the stance phase of gait. Gait Posture 2007, 25, 453–462. [Google Scholar] [CrossRef] [PubMed]
- Portinaro, N.; Leardini, A.; Panou, A.; Monzani, V.; Caravaggi, P. Modifying the Rizzoli foot model to improve the diagnosis of pes-planus: Application to kinematics of feet in teenagers. J. Foot Ankle Res. 2014, 7, 754. [Google Scholar] [CrossRef] [PubMed]
- Queen, R.M.; Gross, M.T.; Liu, H.Y. Repeatability of lower extremity kinetics and kinematics for standardized and self-selected running speeds. Gait Posture 2006, 23, 282–287. [Google Scholar] [CrossRef]
- Grood, E.S.; Suntay, W.J. A joint coordinate system for the clinical description of three-dimensional motions: Application to the knee. J. Biomech. Eng. 1983, 105, 136–144. [Google Scholar] [CrossRef]
- Caravaggi, P.; Matias, A.B.; Taddei, U.T.; Ortolani, M.; Leardini, A.; Sacco, I.C.N. Reliability of medial-longitudinal-arch measures for skin-markers based kinematic analysis. J. Biomech. 2019, 88, 180–185. [Google Scholar] [CrossRef]
- Andrade, A.G.P.; Polese, J.C.; Paolucci, L.A.; Teixeira-salmela, L.F. Functional Data Analyses for the Assessment of Joint Power Profiles During Gait of Stroke Subjects. J Appl Biomech 2014, 30, 348–352. [Google Scholar] [CrossRef]
- Górecki, T.; Smaga, Ł. fdANOVA: An R software package for analysis of variance for univariate and multivariate functional data. Comput. Stat. 2019, 34, 571–597. [Google Scholar] [CrossRef]
- Manter, J.T. Movements of the subtalar and transverse tarsal joints. Anat. Rec. 1941, 80, 397–410. [Google Scholar] [CrossRef]
- Elftman, H. The transverse tarsal joint and its control. Clin. Orthop. 1960, 16, 41–46. [Google Scholar]
- Pohl, M.B.; Buckley, J.G. Changes in foot and shank coupling due to alterations in foot strike pattern during running. Clin. Biomech. 2008, 23, 334–341. [Google Scholar] [CrossRef] [PubMed]
- Williams, D.S.; McClay, I.S.; Manal, K.T. Lower extremity mechanics in runners with a converted forefoot strike pattern. J. Appl. Biomech. 2000, 16, 210–218. [Google Scholar] [CrossRef]
- Pohl, M.B.; Hamill, J.; Davis, I.S. Biomechanical and anatomic factors associated with a history of plantar fasciitis in female runners. Clin. J. Sport Med. 2009, 19, 372–376. [Google Scholar] [CrossRef]
- Zadpoor, A.A.; Nikooyan, A.A. The relationship between lower-extremity stress fractures and the ground reaction force: A systematic review. Clin. Biomech. 2011, 26, 23–28. [Google Scholar] [CrossRef] [PubMed]
- Leardini, A.; O’Connor, J.J.; Giannini, S. Biomechanics of the natural, arthritic, and replaced human ankle joint. J. Foot Ankle Res. 2014, 7, 8. [Google Scholar] [CrossRef]
- Araújo, V.L.; Souza, T.R.; Magalhães, F.A.; Santos, T.R.T.; Holt, K.G.; Fonseca, S.T. Effects of a foot orthosis inspired by the concept of a twisted osteoligamentous plate on the kinematics of foot-ankle complex during walking: A proof of concept. J. Biomech. 2019, 93, 118–125. [Google Scholar] [CrossRef]
- Blackwood, C.B.; Yuen, T.J.; Sangeorzan, B.J.; Ledoux, W.R. The midtarsal joint locking mechanism. Foot Ankle Int. 2005, 26, 1074–1080. [Google Scholar] [CrossRef]
- Okita, N.; Meyers, S.A.; Challis, J.H.; Sharkey, N.A. Midtarsal joint locking: New perspectives on an old paradigm. J. Orthop. Res. 2014, 32, 110–115. [Google Scholar] [CrossRef]
- Fischer, K.M.; Willwacher, S.; Hamill, J.; Brüggemann, G.P. Tibial rotation in running: Does rearfoot adduction matter? Gait Posture 2017, 51, 188–193. [Google Scholar] [CrossRef]
- McKlay, I.; Manal, K. Coupling Parameters in Runners with Normal and Excessive Pronation. J. Appl. Biomech. 1997, 81, 109–124. [Google Scholar] [CrossRef]
- Nigg, B.M.; Khan, A.; Fisher, V.; Stefanyshyn, D. Effect of shoe insert construction on foot and leg movement. Med. Sci. Sport. Exerc. 2014, 30, 550–555. [Google Scholar] [CrossRef] [PubMed]
- Cheung, R.T.H.; Rainbow, M.J. Landing pattern and vertical loading rates during first attempt of barefoot running in habitual shod runners. Hum. Mov. Sci. 2014, 34, 120–127. [Google Scholar] [CrossRef]
- Roper, J.L.; Harding, E.M.; Doerfler, D.; Dexter, J.G.; Kravitz, L.; Dufek, J.S.; Mermier, C.M. The effects of gait retraining in runners with patellofemoral pain: A randomized trial. Clin. Biomech. 2016, 35, 14–22. [Google Scholar] [CrossRef]
- Van Hooren, B.; Fuller, J.T.; Buckley, J.D.; Miller, J.R.; Sewell, K. Is Motorized Treadmill Running Biomechanically Comparable to Overground Running? A Systematic Review and Meta—Analysis of Cross—Over Studies. Sport. Med. 2020, 50, 785–813. [Google Scholar] [CrossRef]
- Sinclair, J.; Taylor, P.J.; Vincent, H. Multi-segment foot kinematics and plantar fascia strain during treadmill and overground running. Foot Ankle Online J. 2014, 7. [Google Scholar] [CrossRef]
- Bade, M.B.; Aaron, K.; McPoil, T.G. Accuracy of Self-Reported Foot Strike Pattern in Intercollegiate and Recreational Runners During Shod Running. Int. J. Sports Phys. Ther. 2016, 11, 350–355. [Google Scholar]


Publisher’s Note: MDPI stays neutral with regard to jurisdictional claims in published maps and institutional affiliations. |
© 2020 by the authors. Licensee MDPI, Basel, Switzerland. This article is an open access article distributed under the terms and conditions of the Creative Commons Attribution (CC BY) license (http://creativecommons.org/licenses/by/4.0/).