Article

Moisture Buffering in Surface Materials Due to Simultaneous Varying Relative Humidity and Temperatures: Experimental Validation of New Analytical Formulas

1
Department of Architecture and Civil Engineering, University of Bath, Bath BA2 7AY, UK
2
Building Technology, Department of Architecture and Civil Engineering, Chalmers University of Technology, SE-412 96 Göteborg, Sweden
*
Author to whom correspondence should be addressed.
Appl. Sci. 2020, 10(21), 7665; https://doi.org/10.3390/app10217665
Submission received: 6 October 2020 / Revised: 26 October 2020 / Accepted: 27 October 2020 / Published: 29 October 2020
(This article belongs to the Special Issue Building Materials from Fundamentals to Applications)

Abstract

:
Buildings are subjected to the indoor environment, especially in non-controlled climates. Temperature and humidity variations might effect or even damage materials sensitive to moisture. For this reason, it is important to understand the response of hygroscopic materials to variable indoor environmental conditions. Existing methods looked into the dynamic sorption capacity of materials, by analysing the impact of only humidity fluctuations, with temperature usually considered non-influential or non variable. However, temperature fluctuations may impact the moisture capacity of the materials, as materials properties might substantially vary with temperature. Moreover, in existing protocols, the humidity variations are considered to be varying under square wave fluctuations, which may not be applicable in environments, where the indoor is influenced by daily and seasonal climate variations, which presents more complex fluctuation. In this study, a simulation method that can predict the impact of environmental condition on materials under simultaneous temperature and humidity fluctuations was developed. Clay and gypsum plaster were analysed in the numerical model and results were then validated with experimental data. Materials were subjected to either sinusoidal and triangular temperature and RH variations and different cycle time intervals. The investigation of sinusoidal and triangular environmental variations pushed to a better understanding of materials response to different environments and to the improvement of the simplified model. The development of a simplified model can realistically predict the potential future impact of climate changes on buildings without the use of complex and memory demanding computational methods.

1. Introduction

To regulate temperature and humidity in buildings, it is not always possible to alter the building envelope or to install air conditioning systems, especially in historic buildings, such as churches. Consequently, indoor surfaces and hygroscopic building materials are subjected to daily and seasonal temperature and Relative Humidity (RH) fluctuations, which might degrade buildings [1,2]. For these reasons, it is important to understand the impact of temperature and humidity on buildings, as well as the response of materials to climate variations [3,4].
Indoor climate in buildings without any conditioning system is mainly determined by the outdoor climate and hygrothermal performance of the building enclosure [5]. The lack of heating and well insulated walls might generate significant daily or seasonal indoor humidity and temperature fluctuations, depending on the climate and location of the building [6,7]. The simultaneous variations of temperature and RH can produce significant variation in moisture exchange between materials and the environment [8].
Moisture transport and storage capacity of interior surface materials due to varying humidity in the indoor air is of importance both for the humidity levels of the room itself and for the moisture impact on walls surface materials [9]. There is research [10,11,12,13], standards [14] and some ongoing measurements on this topic [15] that pointed out the importance to understand the impact of moisture to materials durability, indoor thermal comfort and health. [16] took a step further, by considering periodic humidity variations and by applying moisture buffering experimental results into simulations. However, the focus of most of the studies was mainly on the sole RH variations, while temperature was always considered non-variable. The observation of daily indoor climate variations in non-conditioned buildings suggested a simultaneous opposite and quasi-sinusoidal temperature and RH fluctuations [6,7,17]. Some recent results on this area [1,18] gave new analytical expressions for the effect of combined variations of RH and temperature. Bylund et al. [18] analysed experimentally the moisture uptake of wood and introduced a calculation model that took into account simultaneous temperature variations together with the surface resistance of the material. However, the model was based on a specific material and required an elevated number of material properties and experimental analysis.
In a newly published study [19], a detailed analytical solution for temperature and RH square shaped variations was proposed. The method was developed by neglecting the surface vapour resistance and by considering a semi-infinite material [20]. The objective of this study was to further develop the analytical model from [19], by introducing triangular and sinusoidal temperature and RH variations. To validate the analytical method, results were compared with laboratory experimental tests on clay and gypsum plasters. The materials mass variations to simultaneous temperature and RH variations was observed and compared with simulations. The aim of this paper is to introduce new experimental approach to evaluate the moisture buffering capacity of materials and use experimental data to realistically simulate the materials behaviour. The effect of the surface resistance was implemented in the model and the validity of the semi-infinite approach on the moisture uptake was analysed. By improving the model and approximating the indoor daily variations to sinusoidal and triangular, it was possible to develop a reliable simulation method that is able to predict the materials response in a non-conditioned environment.

2. Materials

In this study, commercially available undercoat clay and gypsum plasters were analysed, due to their good moisture buffering capacity. Samples were mixed and cured, as described in [21]. Clay and gypsum were cast in 150 mm × 150 mm × 40 mm and 150 mm × 150 mm × 20 mm moulds, respectively, in order to test the sensitivity of the model to the material thickness. Specimens were air dried for 28 days, before testing. The dry density ρ d r y , porosity Φ ( % ) , the dry cup water vapour resistance factor μ ( ) and moisture capacity ξ w (kg/kg) were measured, as described in [21]. Results are summarised in Table 1. Materials were stored in an environmental room at 60%RH and 22 C.

3. Methods

3.1. Experimental Design

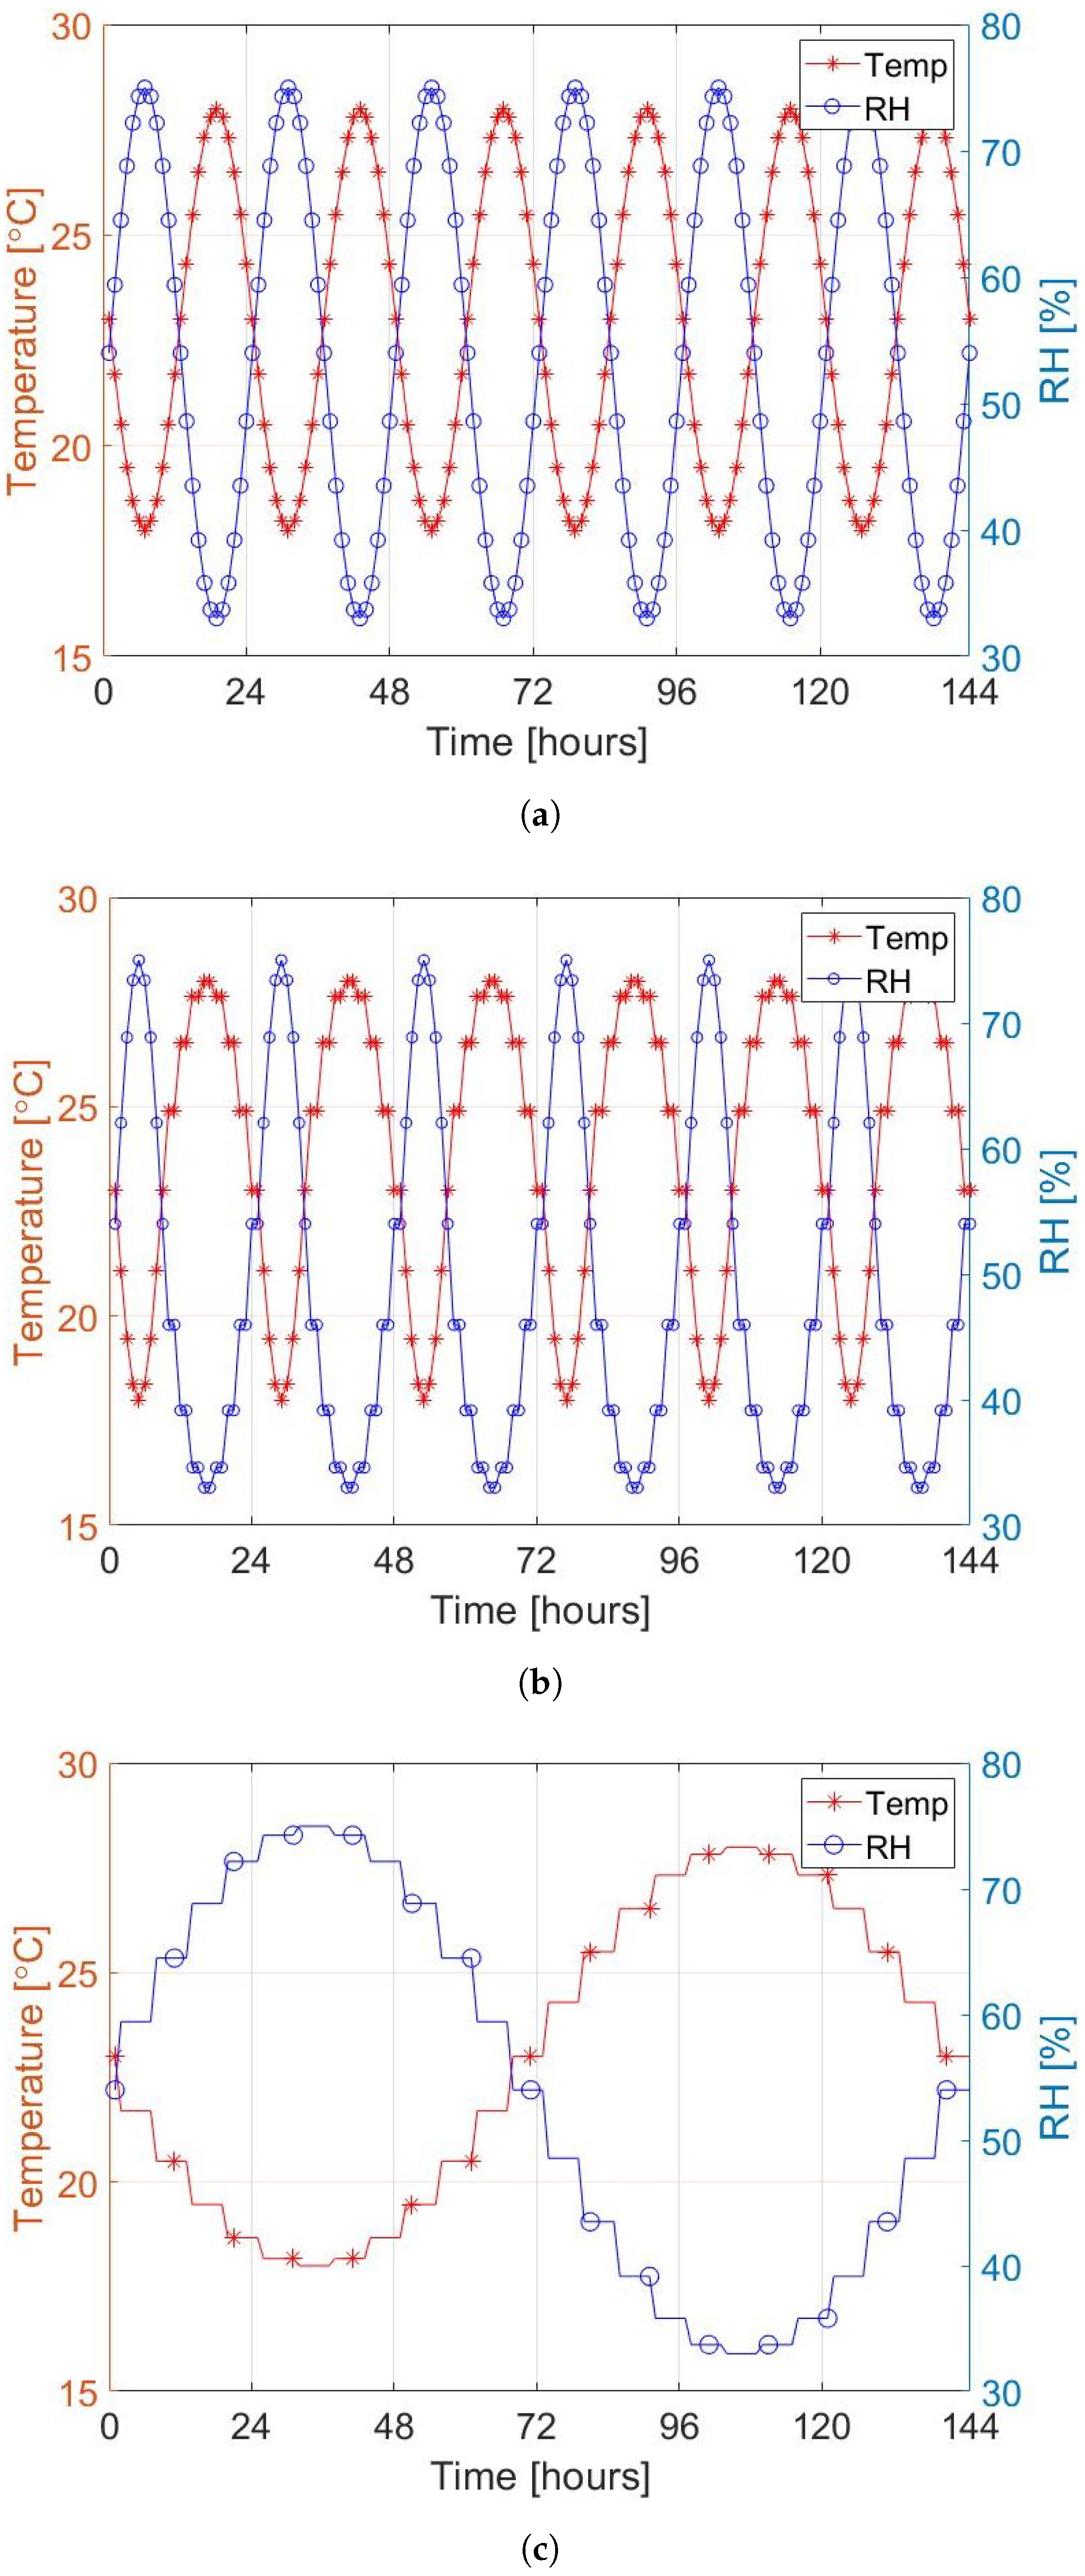
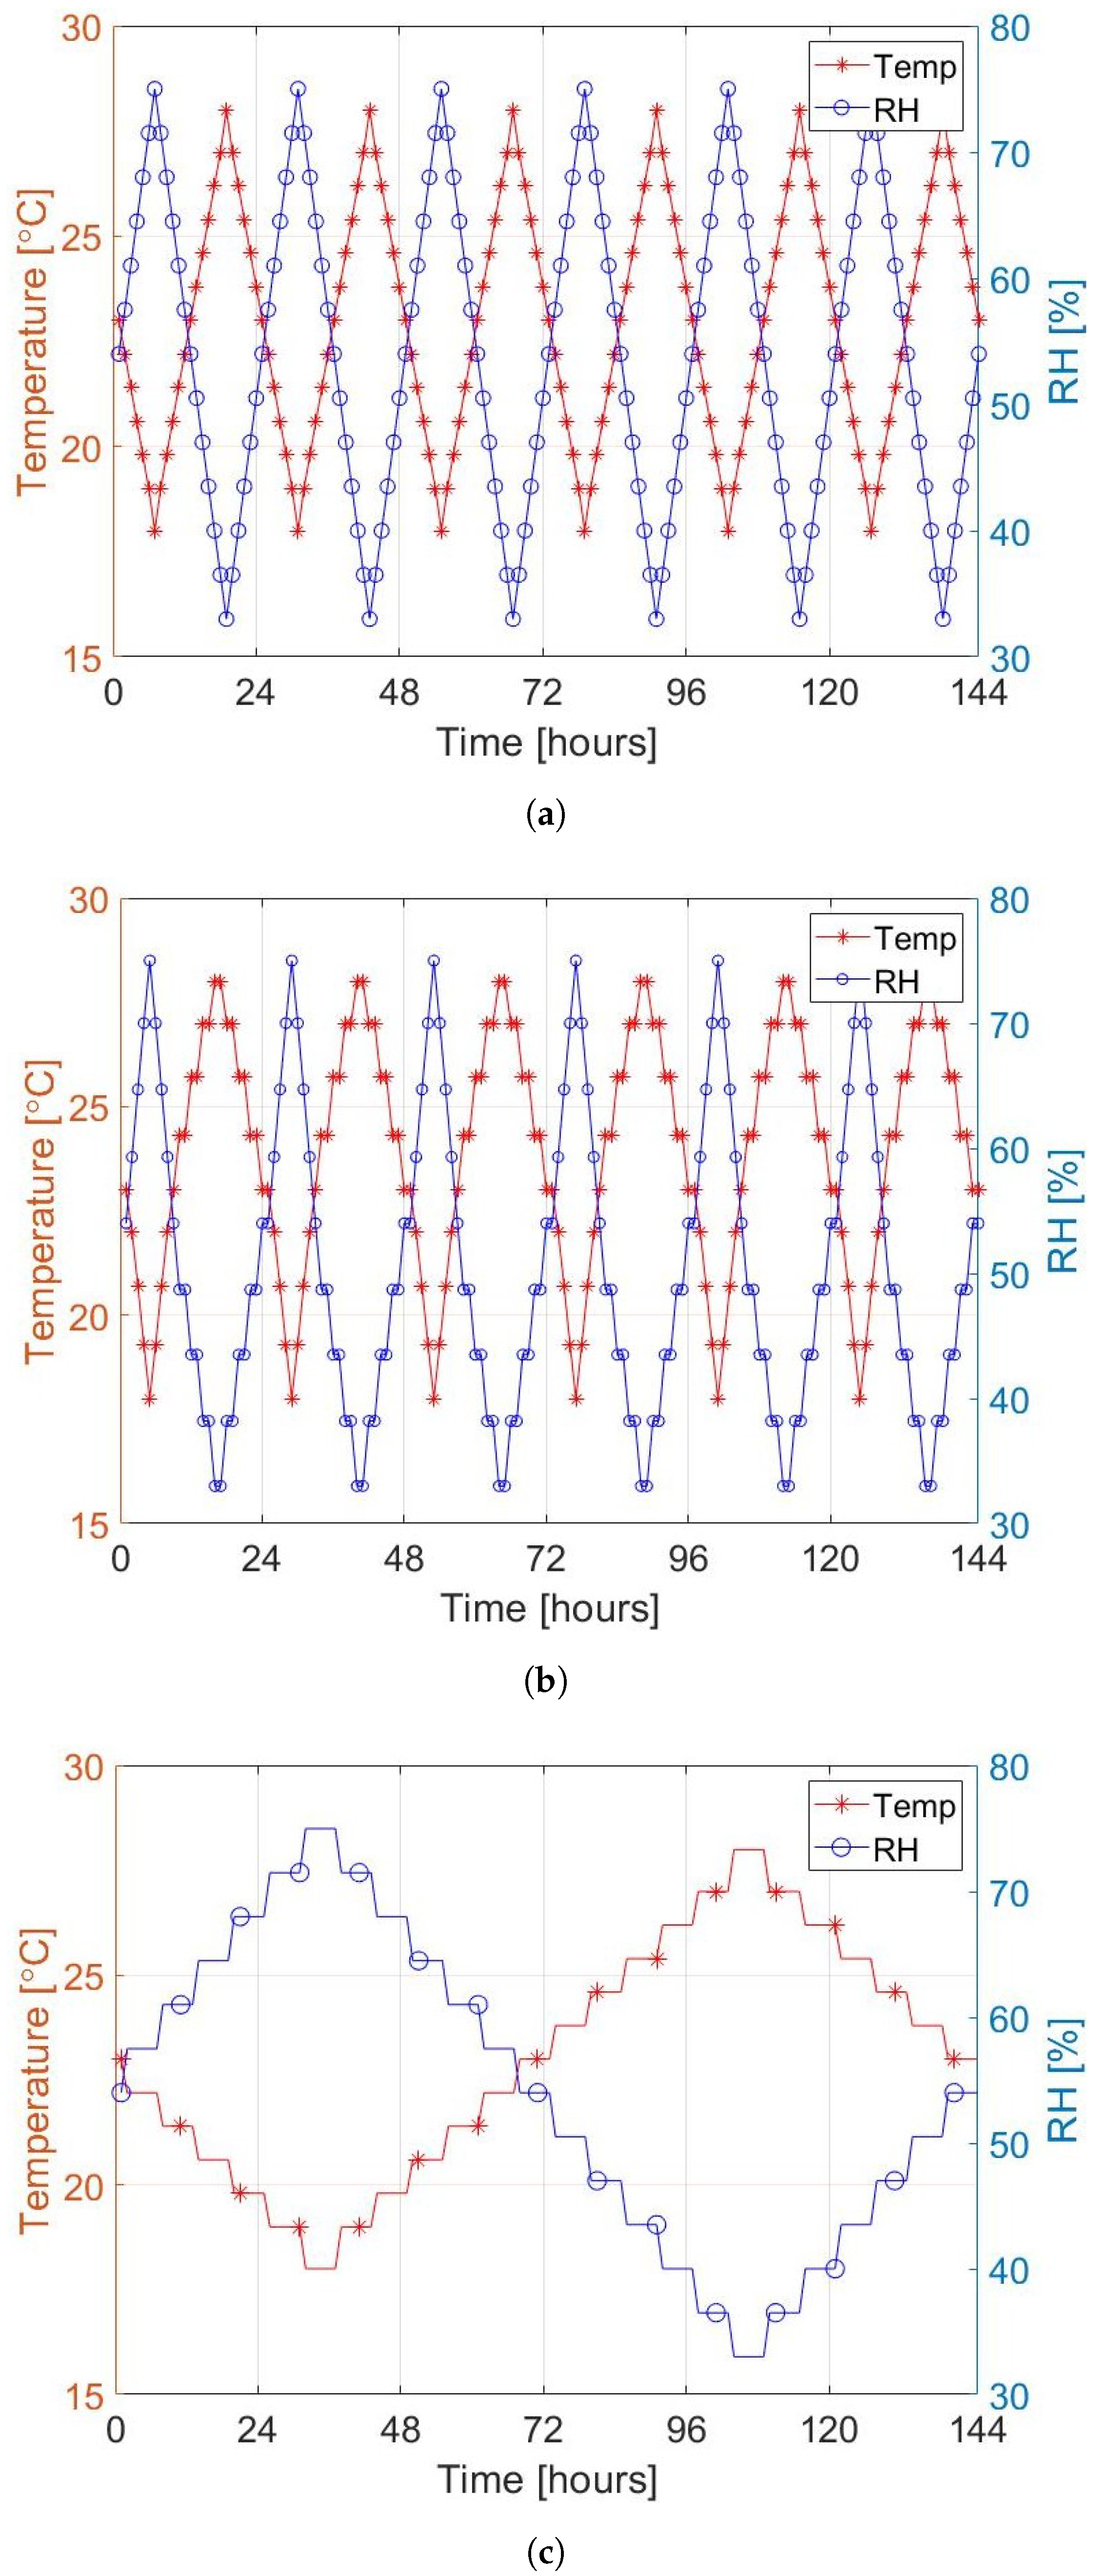
For each specimen the change in weight of the specimens was investigated, when subjected to triangular or sinusoidal simultaneous temperature and RH variations. Specimens were tested in an environmental chamber (ACS Compact Test Chambers DY110), into which a mass balance were placed to continuously measure the change in weight, as shown in Figure 1. More details of the set-up can be seen in [8] The tests followed the general guidelines for humidity variations and test set-up of the NORDTEST protocol [14]. The materials were exposed before each tests to 24 h pre-conditioning at 23 C and 54%RH, and to six cyclic humidity and temperature variations at an air speed of 0.1 m/s. Each cycle consisted of humidity variations from 75%RH (high RH) to 33%RH (low RH), and temperature fluctuations between 18.0 C and 28.0 C, which is the acceptable operating temperatures in buildings in the ASHRAE Standard 55 [22]. Temperature was set to follow inverse variation than RH, as shown in Figure 2 and Figure 3. For both triangular and sinusoidal fluctuation, three different humidification and de-humidification time intervals were defined, as shown in Table 2.
In the Triangular 12/12 and Sinusoidal 12/12 tests, considering 54%RH as starting point, the positive section of the curve represents the humidification phase, while the section below 54% is the de-humidification interval. As with the NORDTEST [14], the RH was gradually increased, until reaching its maximum 75%RH and then back to 54%RH. In the first 6 h of the de-humidification from 54%RH the humidity reached the minimum 33%RH, and then again up to 54%RH, as shown in Figure 2a and Figure 3a. In the 12/12 test, the climatic chamber increased and decreased the RH every hour, transitioning from one step to the other by setting a “slope”, which the climatic chamber automatically generated, to progressively increase/decrease the humidity until the next RH was achieved. In the Triangular 12/12, the triangular curve shape was generated by creating 24 equally distributed RH intervals, while the Sinusoidal 12/12 was achieved, by constructing a sinusoidal symmetrical equation. The temperature curve followed the same logic as the RH variations. In 12/12 test the curve started at 23 C, reaching the minimum temperature of 18.0 C within the first 6 hours of the cycle. Successively, the temperature jumped back to 23 C, to increase the temperature to 28.0 C always withing the 24 h cycle. In the Triangular 8/16 (Figure 2b) and the Sinusoidal 8/16 (Figure 3b) the temperature and RH curves were marked by hourly interval in the humidification/cooling phase and by 2 h intervals in the de-humidification/heating phase. The Triangular 72/72 (Figure 2c) and Sinusoidal 72/72 (Figure 3c) follow the same principle of the 12/12 h fluctuations, but 6 h intervals were applied between one step and the other, in order to understand if slower moisture variations influence the sorption capacity of the materials. A temperature and RH sensor for each specimen (Tiny Tag TV 4505) monitored the climate condition in the climatic chamber to observe the agreement between the target fluctuations and the actual measurements on both sides of the chamber. The accuracy of the sensor was ± 0.5 C for the temperature and ± 3 % RH for humidity.

3.2. Simulations

Steady periodic variations with the time period t p (s) in RH and temperature were investigated. The moisture transfer took place at x = 0 of a semi-infinite domain, x > 0 . There was a vapour surface resistance Z (s/m) at x = 0 . The moisture buffering effect, i.e., the total moisture m A (kg/m 2 ) that flows in and then out during a time period was of interest.

3.2.1. Equations

The moisture balance equation reads:
x δ v v x = w t x > 0
Here, v (kg/m 3 ) is the humidity by volume and w (kg/m 3 ) is the moisture content.
At the surface x = 0 there is:
δ v v x = v b ( t ) v Z x = 0
δ v v x = 0 x = D
Here, v b ( t ) is the time varying boundary humidity by volume. The analysis in this paper assumed that the temperature of the surface material always followed the chamber temperature T b ( t ) without any delay. This was a reasonable assumption since temperature changes are much more rapid than moisture changes and that it is only the thin interior surface layer that is affected by variations in indoor cyclic moisture variations. Equation (3) states that there is a moisture tight back side of the material at the depth D (m) representing the thickness of the material. The main part of the following assumes a semi-infinite material thickness, i.e., D = .

3.2.2. Simplified Equations

Two simplifications were introduced. The first one is that the vapor diffusion coefficient δ v (m 2 /s) is constant:
δ v = δ v 0
The second simplification is that the slope of the sorption curve is constant. Furthermore, hysteresis is neglected, and the the average slope is used, instead. This is justified, as the investigated materials showed a very limited difference of the slope of the isotherm within the studied RH regime. The upper and lower between the adsorption and desperation limit is 0.8% and the lower one is 0.02%. A sensitivity analysis using this span would reveal an estimate of the impact. In Section 4.2.3, Equation (28) suggests a square root dependence of the slope on the total moisture uptake.
w φ = ξ
The moisture balance equation then becomes:
δ v 0 2 v x 2 = δ v 0 v s ( T ) 2 φ x 2 = w t = w φ φ t = ξ φ t
Here, v s is the humidity by volume at saturation. Introducing the vapor moisture diffusivity a v (m 2 /s):
2 φ x 2 = 1 a v φ t a v = δ v 0 v s ( T ) ξ
The boundary condition becomes:
φ x = φ b ( t ) φ d v x = 0
d v = δ v 0 · Z
The parameter d v (m) represents an equivalent thickness of the surface resistance, i.e., a material with this thickness gives the same resistance as Z. The boundary RH is denoted by φ b ( t ) (-).

3.2.3. Varying Temperature

Time varying temperature was considered:
2 φ x 2 = 1 a v ( t ) φ t a v t = δ v 0 v s ( T ( t ) ) ξ
Here, the material temperature is equal to the boundary temperature. It is purely a function of time:
2 φ x 2 = 1 a v t φ t
A variable substitution is introduced:
τ ( t ) = 0 t a v ( t ) d t
The moisture balance equation is transformed to:
2 φ x 2 = φ τ
Here, there is an equation that is similar to the one-dimensional moisture balance Equation (7) with the diffusivity a v equal to 1. The equation is linear when using this transformed time variable and superposition techniques can be used. Therefore, it is necessary with a basic periodic solution to handle complex cyclic changes in the RH.
The problem can be solved in the τ -domain using superposition technique. First, the boundary values were transformed into this domain. The following general, even functions, for the boundary RH and temperature were assumed:
φ b ( t ) T b ( t )
The maximum and minimum value of the boundary RH are:
φ b , max φ b , min
The τ is defined as:
τ ( t ) = δ v 0 ξ 0 t v s ( T b ( t ) ) d t
Since the integrand is always positive an inverse function can be found:
τ 1 ( τ ) = t
The boundary RH becomes:
φ b ( t ) = φ b ( τ 1 ( τ ) ) = φ b , min + φ b , max φ b , min · φ ˜ b ( τ )
Since a periodic and even function was assume, it becomes:
φ ˜ b ( τ ) = a 0 2 + n = 1 a n · cos 2 n π τ τ p
where
a n = 2 τ p 0 τ p φ ˜ b ( τ ) · cos 2 n π τ τ p d τ τ p = τ ( t p )
This description suggested that the moisture problem, in the τ -domain, can be solved by summing an infinite number of solutions, one for each cosinusoidal variation using Fourier series. This solution is found in [10]:
φ ( τ , x ) φ b , min φ b , max φ b , min = a 0 2 + n = 1 a n · A n e x / d p v , n · cos 2 n π τ τ p x d p v , n ϕ n
d p v , n = τ p n π ϕ n = arctan d v d p v , n + d v
A n = 1 ( 1 + d v / d p v , n ) 2 + ( d v / d p v , n ) 2

3.2.4. Moisture Uptake

The moisture flow g (kg/m 2 · s) into the material is:
g ( t ) φ b , max φ b , min = δ v 0 v s ( T ( t ) ) φ b , max φ b , min φ x x = 0 = ξ a v ( t ) n = 1 a n · A n 2 d p v , n cos 2 n π τ τ p + π 4 ϕ n
The integrated m ( t ) (kg/m 2 ) moisture uptake from time zero to time t is:
m ( t ) = 0 t g ( t ) d t
The formula can be reformulated using a variable substitution, s = τ ( t ) , and an integration between 0 and τ p .
m = φ b , max φ b , min / 2 2 π ξ · τ p · f m
f m = 2 · n = 1 a n · A n 2 n sin 2 n π τ τ p + π 4 ϕ n sin π 4 ϕ n
The moisture uptake during the uptake period becomes:
m A = φ b , max φ b , min / 2 2 π ξ · τ p · f A
f A = max ( f m ) min ( f m )
In a dimensional analysis of the formula the different lengths that shows up can be observed. One important is the periodic penetration depth [10]:
d p v = τ p π
The following non-dimensional parameters are of importance:
d v d p v , D d p v
On top of these two parameters, the shape of the curves for the RH and temperature boundary values, determining the Fourier Series coefficient a n in Equation (27), is of importance.

4. Results

4.1. Experimental Results

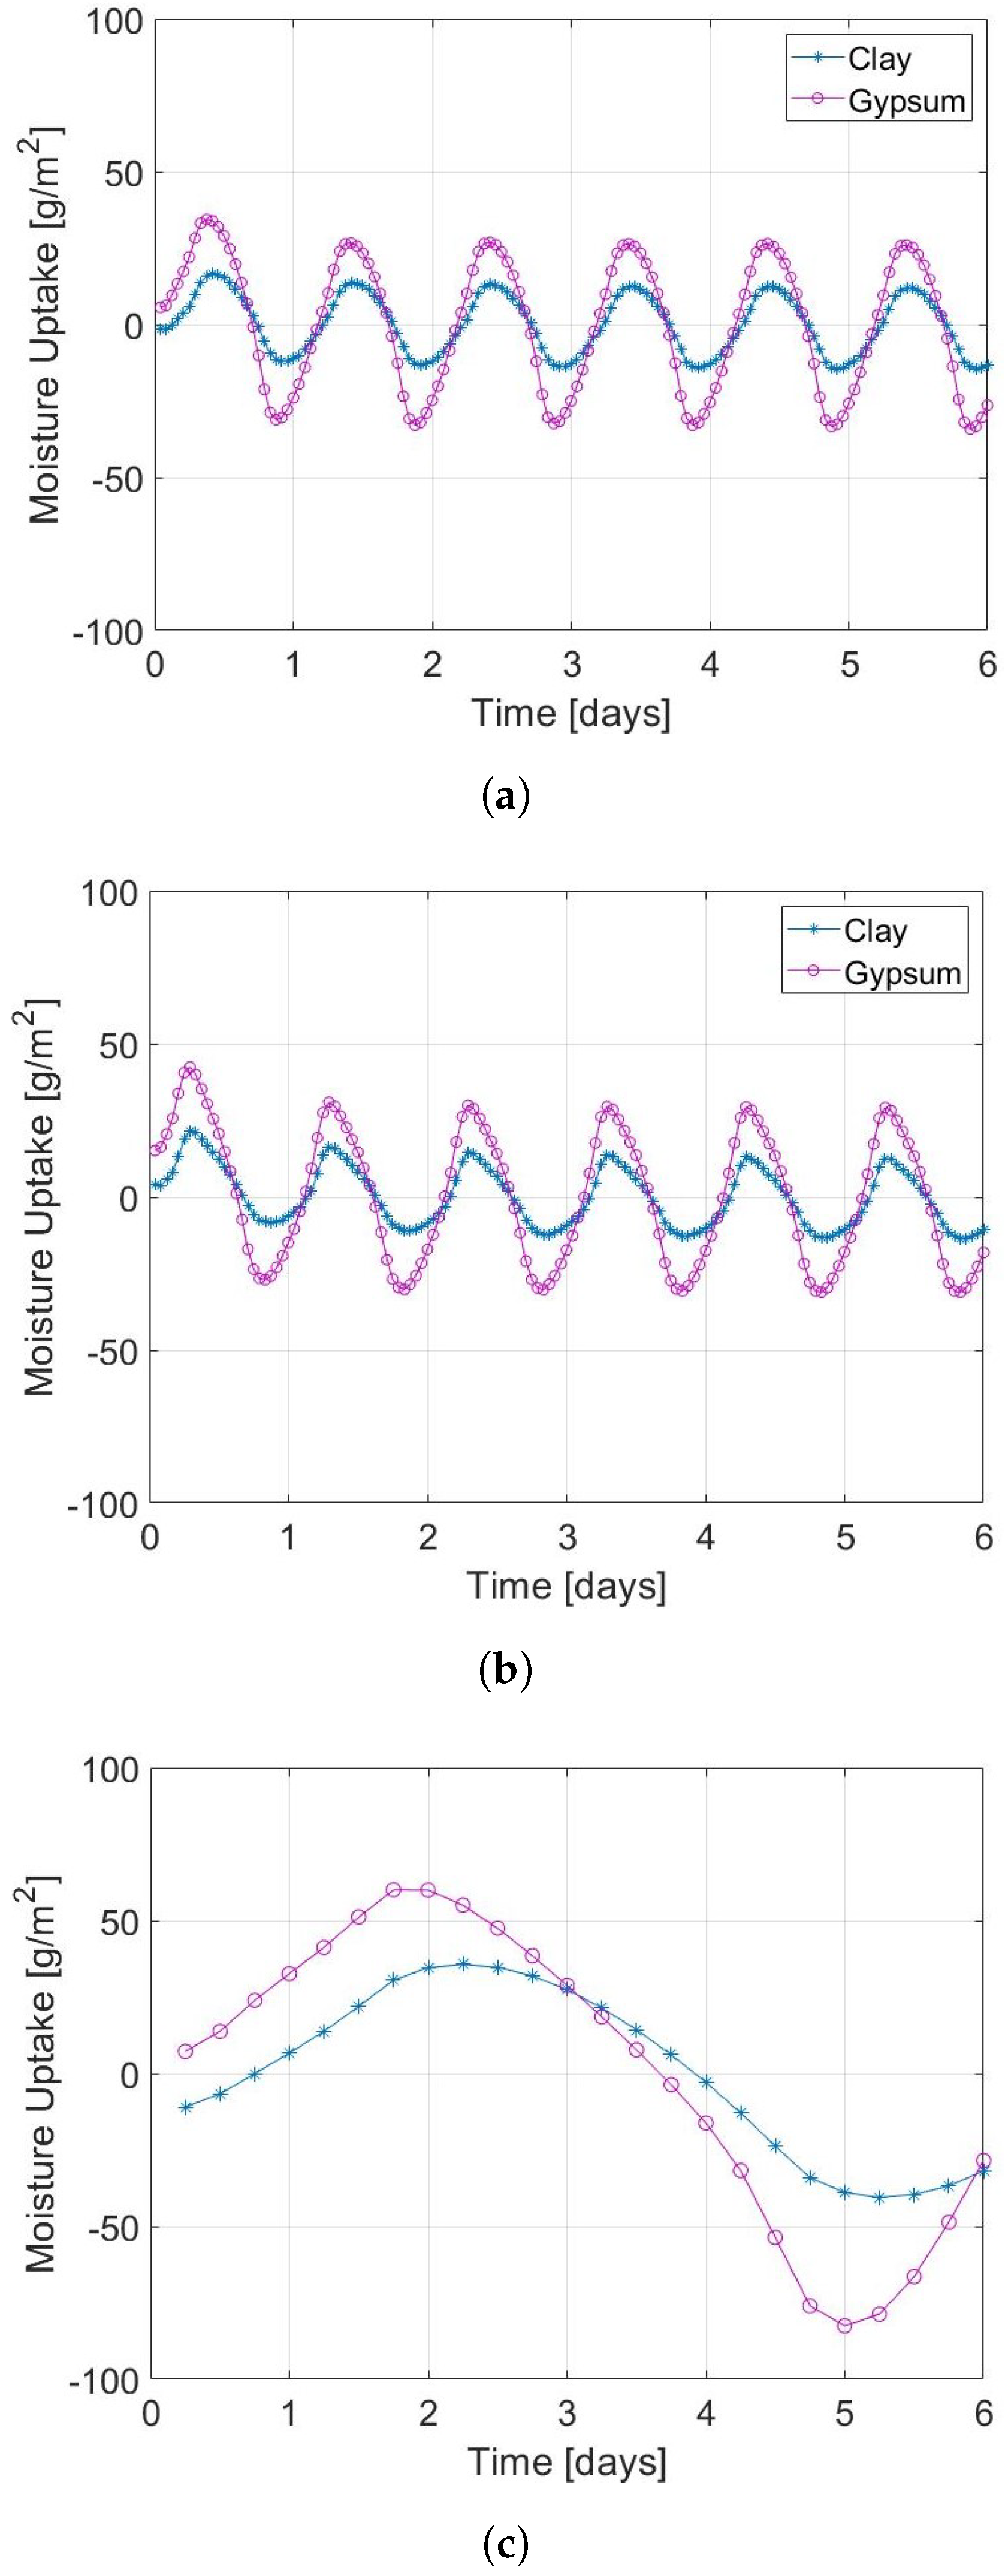
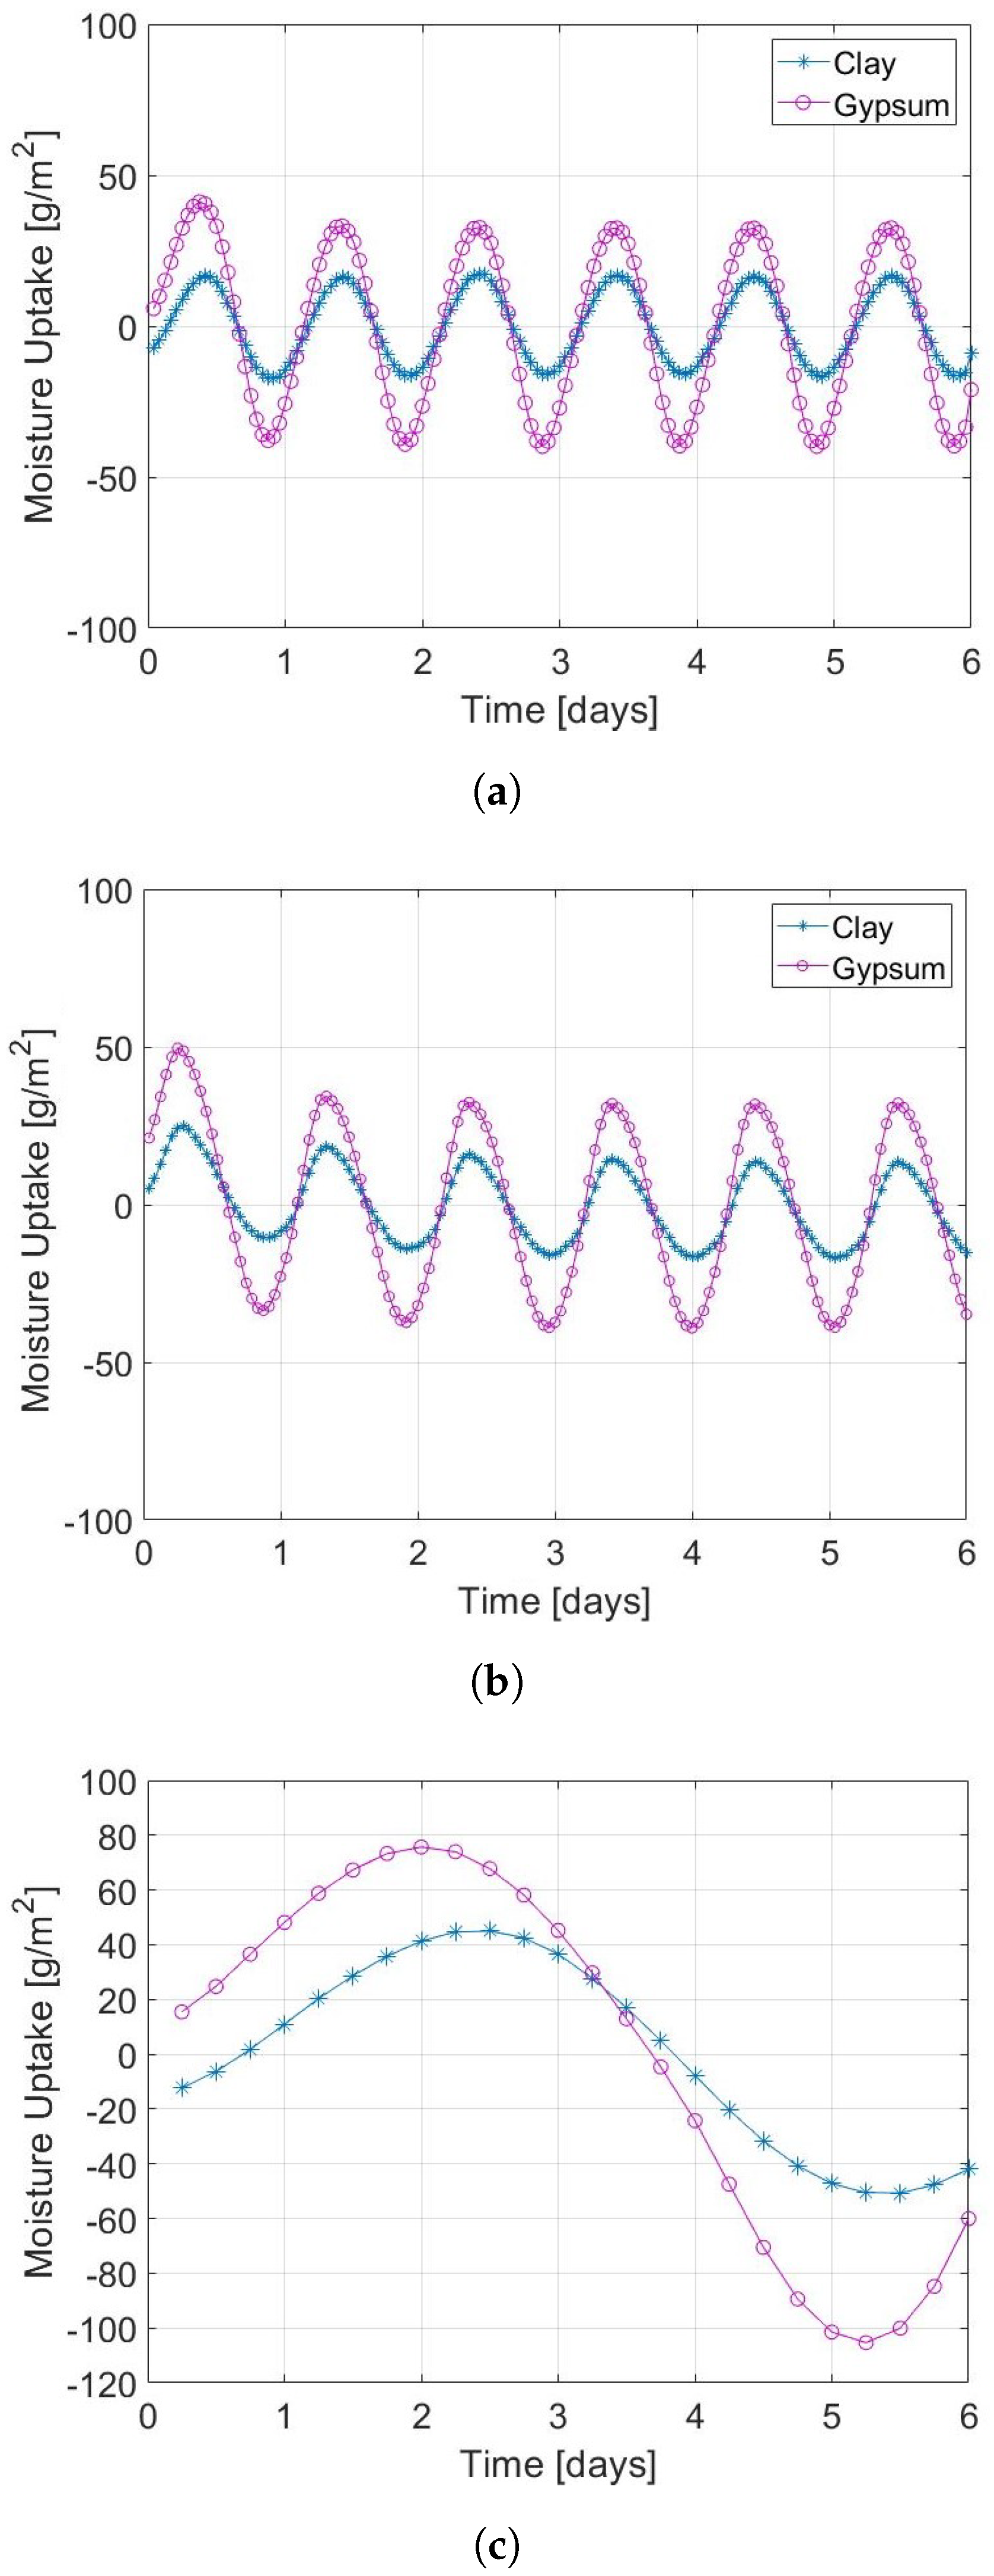
The moisture buffering performance of clay and gypsum under triangular and sinusoidal temperature and RH fluctuations is shown in Table 3. The average peak to peak sorption capacity was calculated by considering the last three cycle of the 12 h and 8 h, as the changed in weight stabilised after the third cycle in all tests. In general, gypsum had a better moisture capacity than clay (Figure 4 and Figure 5), by adsorbing two times more moisture regardless of the shape and time interval of the temperature and RH fluctuations. The performance of gypsum is due to its porosity and pore structure. As explained in [8], gypsum presented higher porosity than clay, but it also showed a significant presence of micro-pores that increased themoisture uptake of the material. Differences between the 12 h and 8 h curves in the triangular case either for clay and gypsum were negligible, as the same moisture uptake was measured. Between the Sinusoidal 12/12 and Sinusoidal 8/16 curves 11% and 5% variations were observed for clay and gypsum, respectively. However, differences were small and not significant, when compared to the differences between triangular and sinusoidal sorption responses. There was 18% and 20% differences between Triangular 12/12 and Sinusoidal 12/12 peak to peak sorption capacity, while between Triangular 8/16 and Sinusoidal 8/16 clay and gypsum presented 10% and 13% variations, respectively. The Triangular 72/72 and Sinusoidal 72/72 tests presented the most significant discrepancy, as clay and gypsum adsorbed 20% and 26% more in the sinusoidal case, respectively. The considerable higher sorption capacity of the 72/72 tests is related to the longer time interval, which allowed materials to adsorb more water.
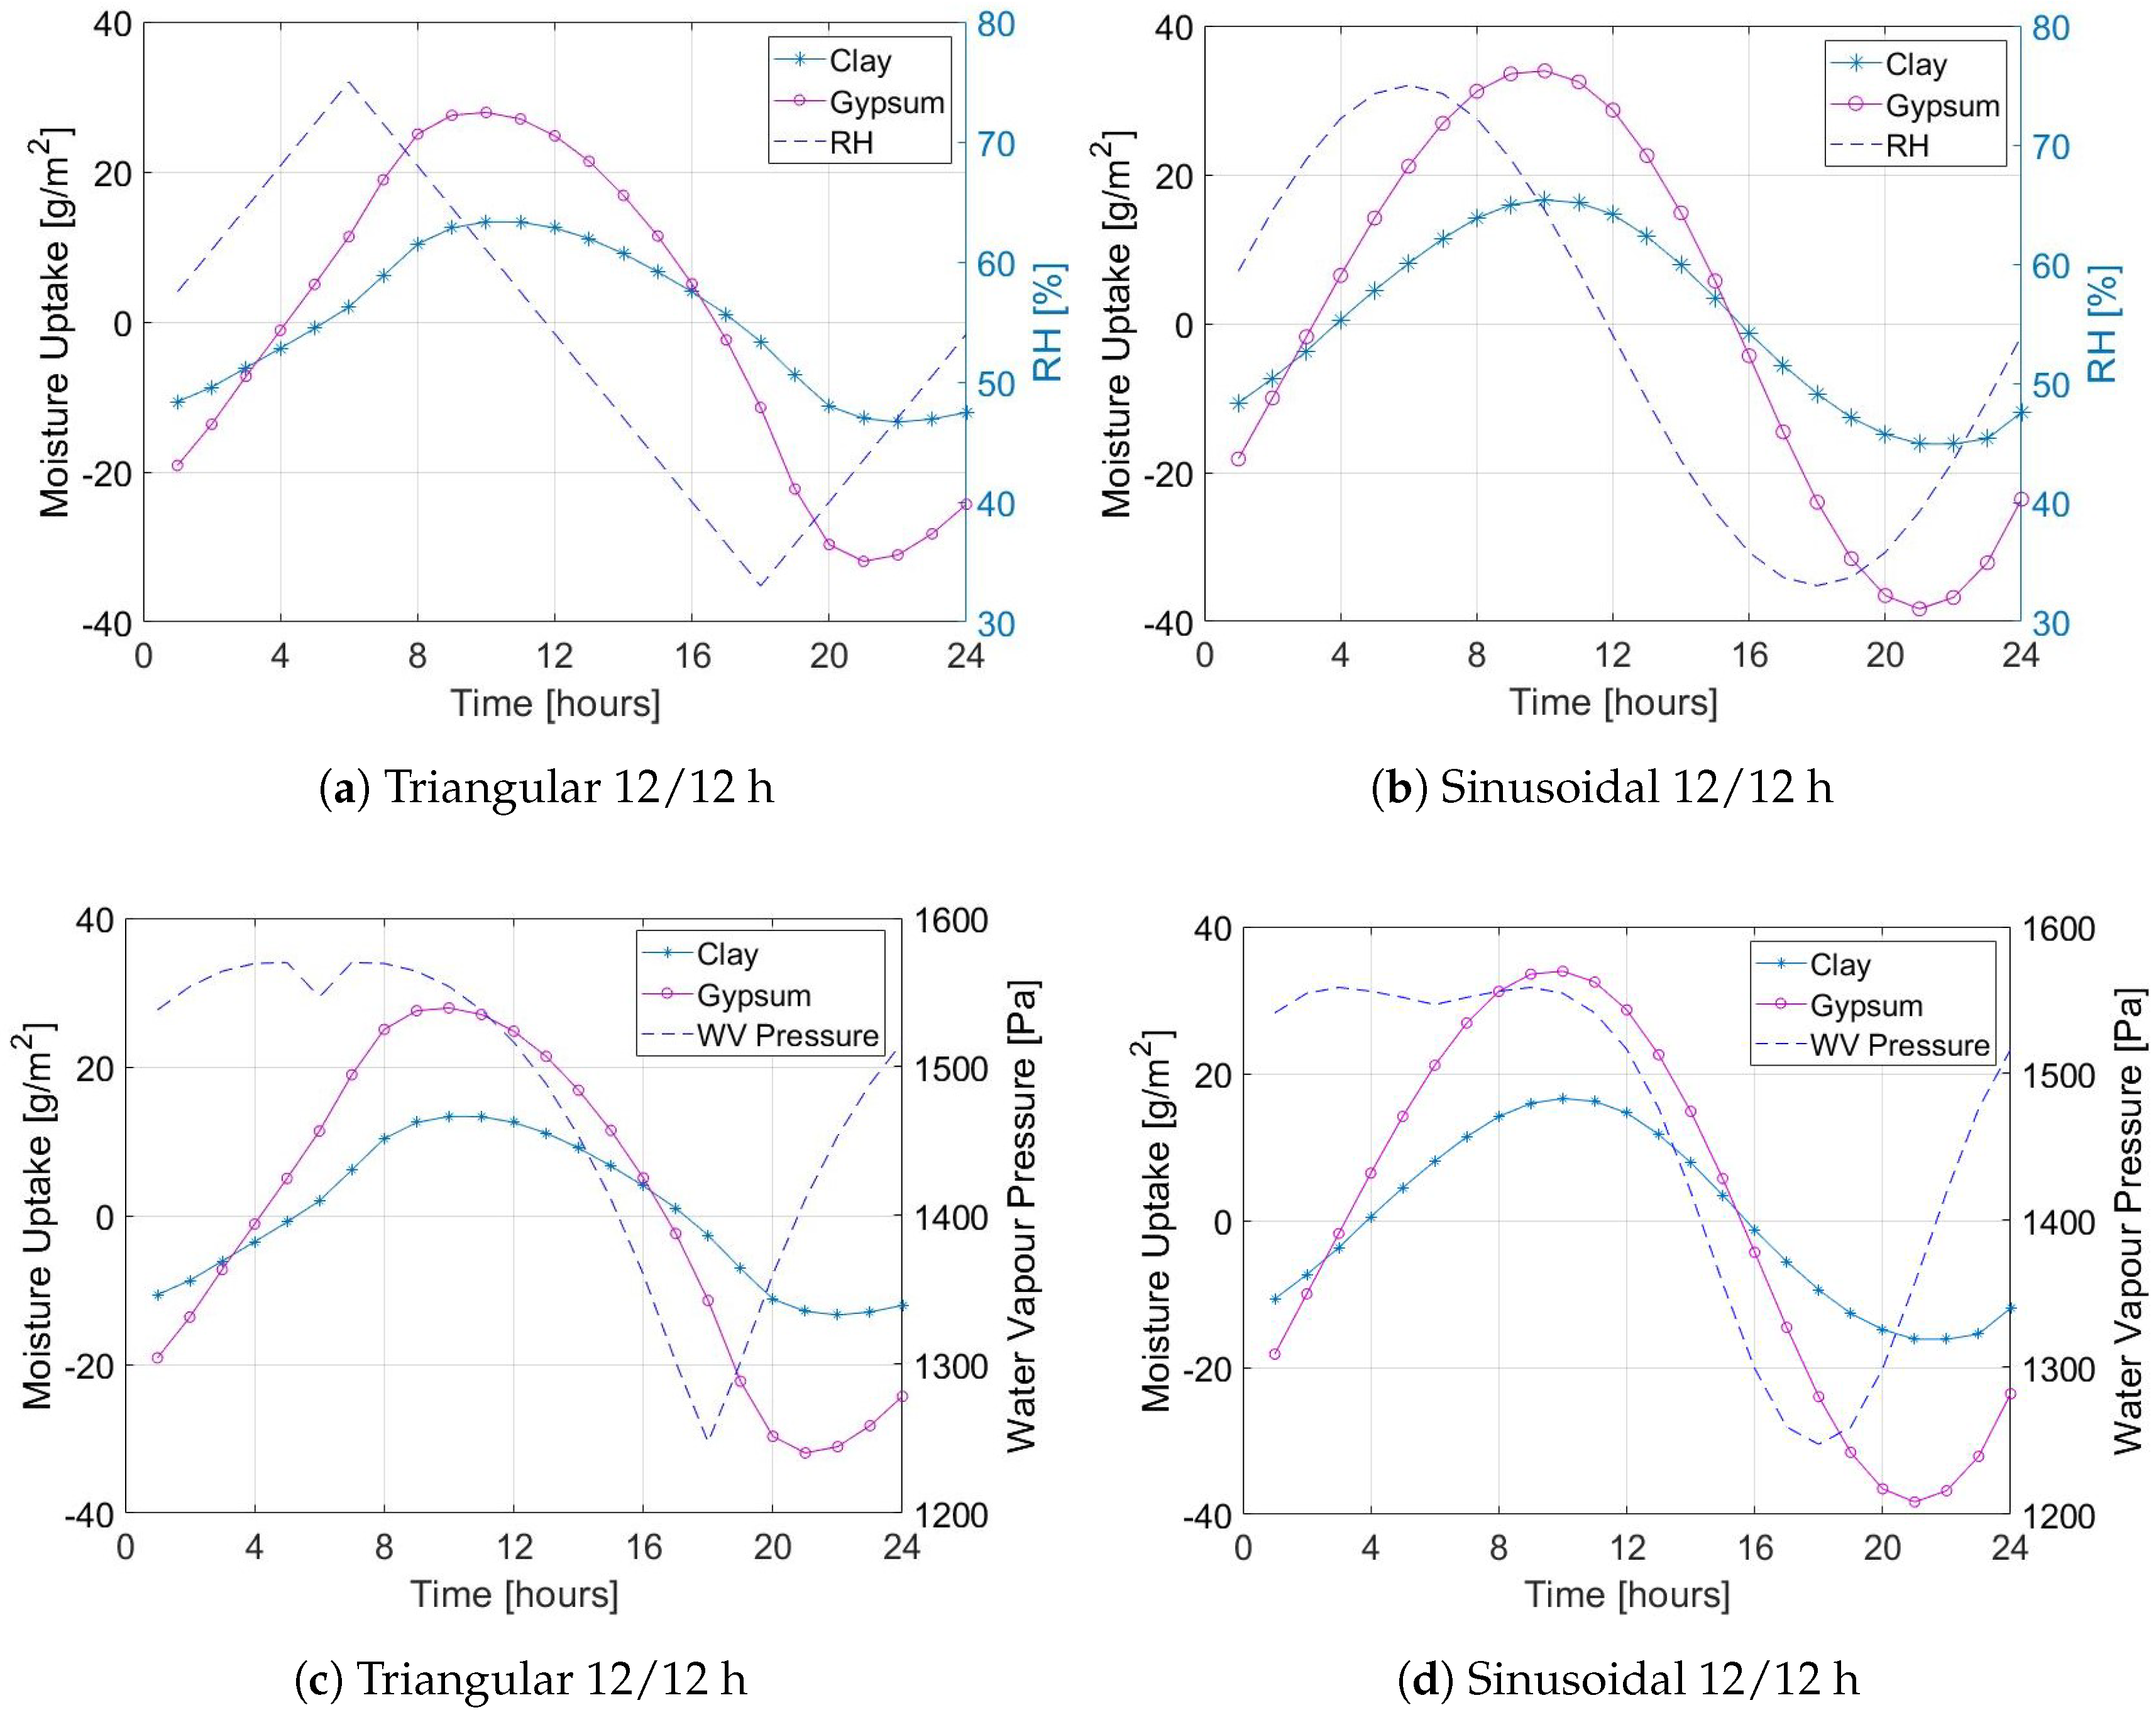
As [8] also mentioned in a study on sinusoidal environmental variations, the triangular and sinusoidal curves presented a delayed response to the temperature and RH fluctuations (Figure 6). The hygric lag varied depending on the humidification and de-humidification intervals, the length of each step, the material’s characteristic, but especially on the simultaneous temperature variations. Table 4 summarises the hygric lags in all the tests, where the first value represents the time between the RH-peak and the moisture uptake peak, while the second represents the time between the lowest RH and the lowest moisture uptake value. In the Triangular and Sinusoidal 12/12 clay and gypsum showed different lags, in which clay always presented a slower response than gypsum either in the adsorption and desorption. Regardless of the materials differences, both plasters showed an asymmetry between the humidification and de-humidification. The desorption lag was 30 min for clay, and 20 and 60 min for gypsum in the Triangular 12/12 and Sinusoidal 12/12, respectively. The asymmetry indicated that in the de-humidification the response of the plasters is quicker than the adsorption, probably due to the effect of the air movement in the chamber that slowed the humidity uptake and increase the moisture release.
An opposite pattern can be seen in the Triangular 8/16 and Sinusoidal 8/16, where materials presented higher hygric lags in the desorption than the adsorption. The reason could be related to the shorter humidification interval (8 h) and longer de-humidification (16 h), as shown in Table 4. Moreover, the the longer exposure to lower humidifies and higher temperature may slow down the moisture release. The Triangular 8/16 the plasters had the same lag in the humidification, but in the desorption clay’s delay increased significantly. In the Sinusoidal 8/16, clay and gypsum uptake curves had similar lags, which is in line with [8] test on the same gypsum sample.
The 72/72 test showed the biggest hygric lag, probably due to the longer steps, which allowed the materials to adsorb more moisture. In Triangular 72/72 and Sinusoidal 72/72 it was possible to see substantial difference between clay and gypsum. Clay was slower to adsorb water than gypsum, and it took more time to respond to the change of humidity in the air, due to its lower sorption capacity and water vapour permeability. Another important factor that might contribute to the slower response of clay was the different thicknesses of the materials. Clay was 20 mm thicker than gypsum, which means had more moisture storage capacity of gypsum with its 20 mm thickness. This is less noticeable for the 12 h and 8 h due to the quicker humidity variations, while in the 72/72 tests the specimens have got more time to adsorb water from the environment. As [23] investigated, the amount of moisture that can be adsorbed by materials is strongly dependent on their thickness and penetration depth. The penetration depth depends on the material characteristics and it determines the moisture buffering potential of materials. When the thickness of a material is smaller than its penetration depths, materials can buffer less moisture that what they potentially could adsorb.
To compare the experimental results to simulation, an uncertainty analysis was performed, to check the variability of the moisture uptake, due to experimental error. The size of the specimens and the variability of the moisture uptake were considered. The uncertainty of the single measurements were first analysed and than combined to calculate the overall variations of the moisture uptake. Table 5 shows the results of the analysis. Four measurements for each dimension were considered for the calculation of the surface area of the specimens, while three repeated moisture buffering tests were used for the climatic chamber and mass balance uncertainty calculation. Delays in the signal transmission between the mass balance and data logger were not detected.
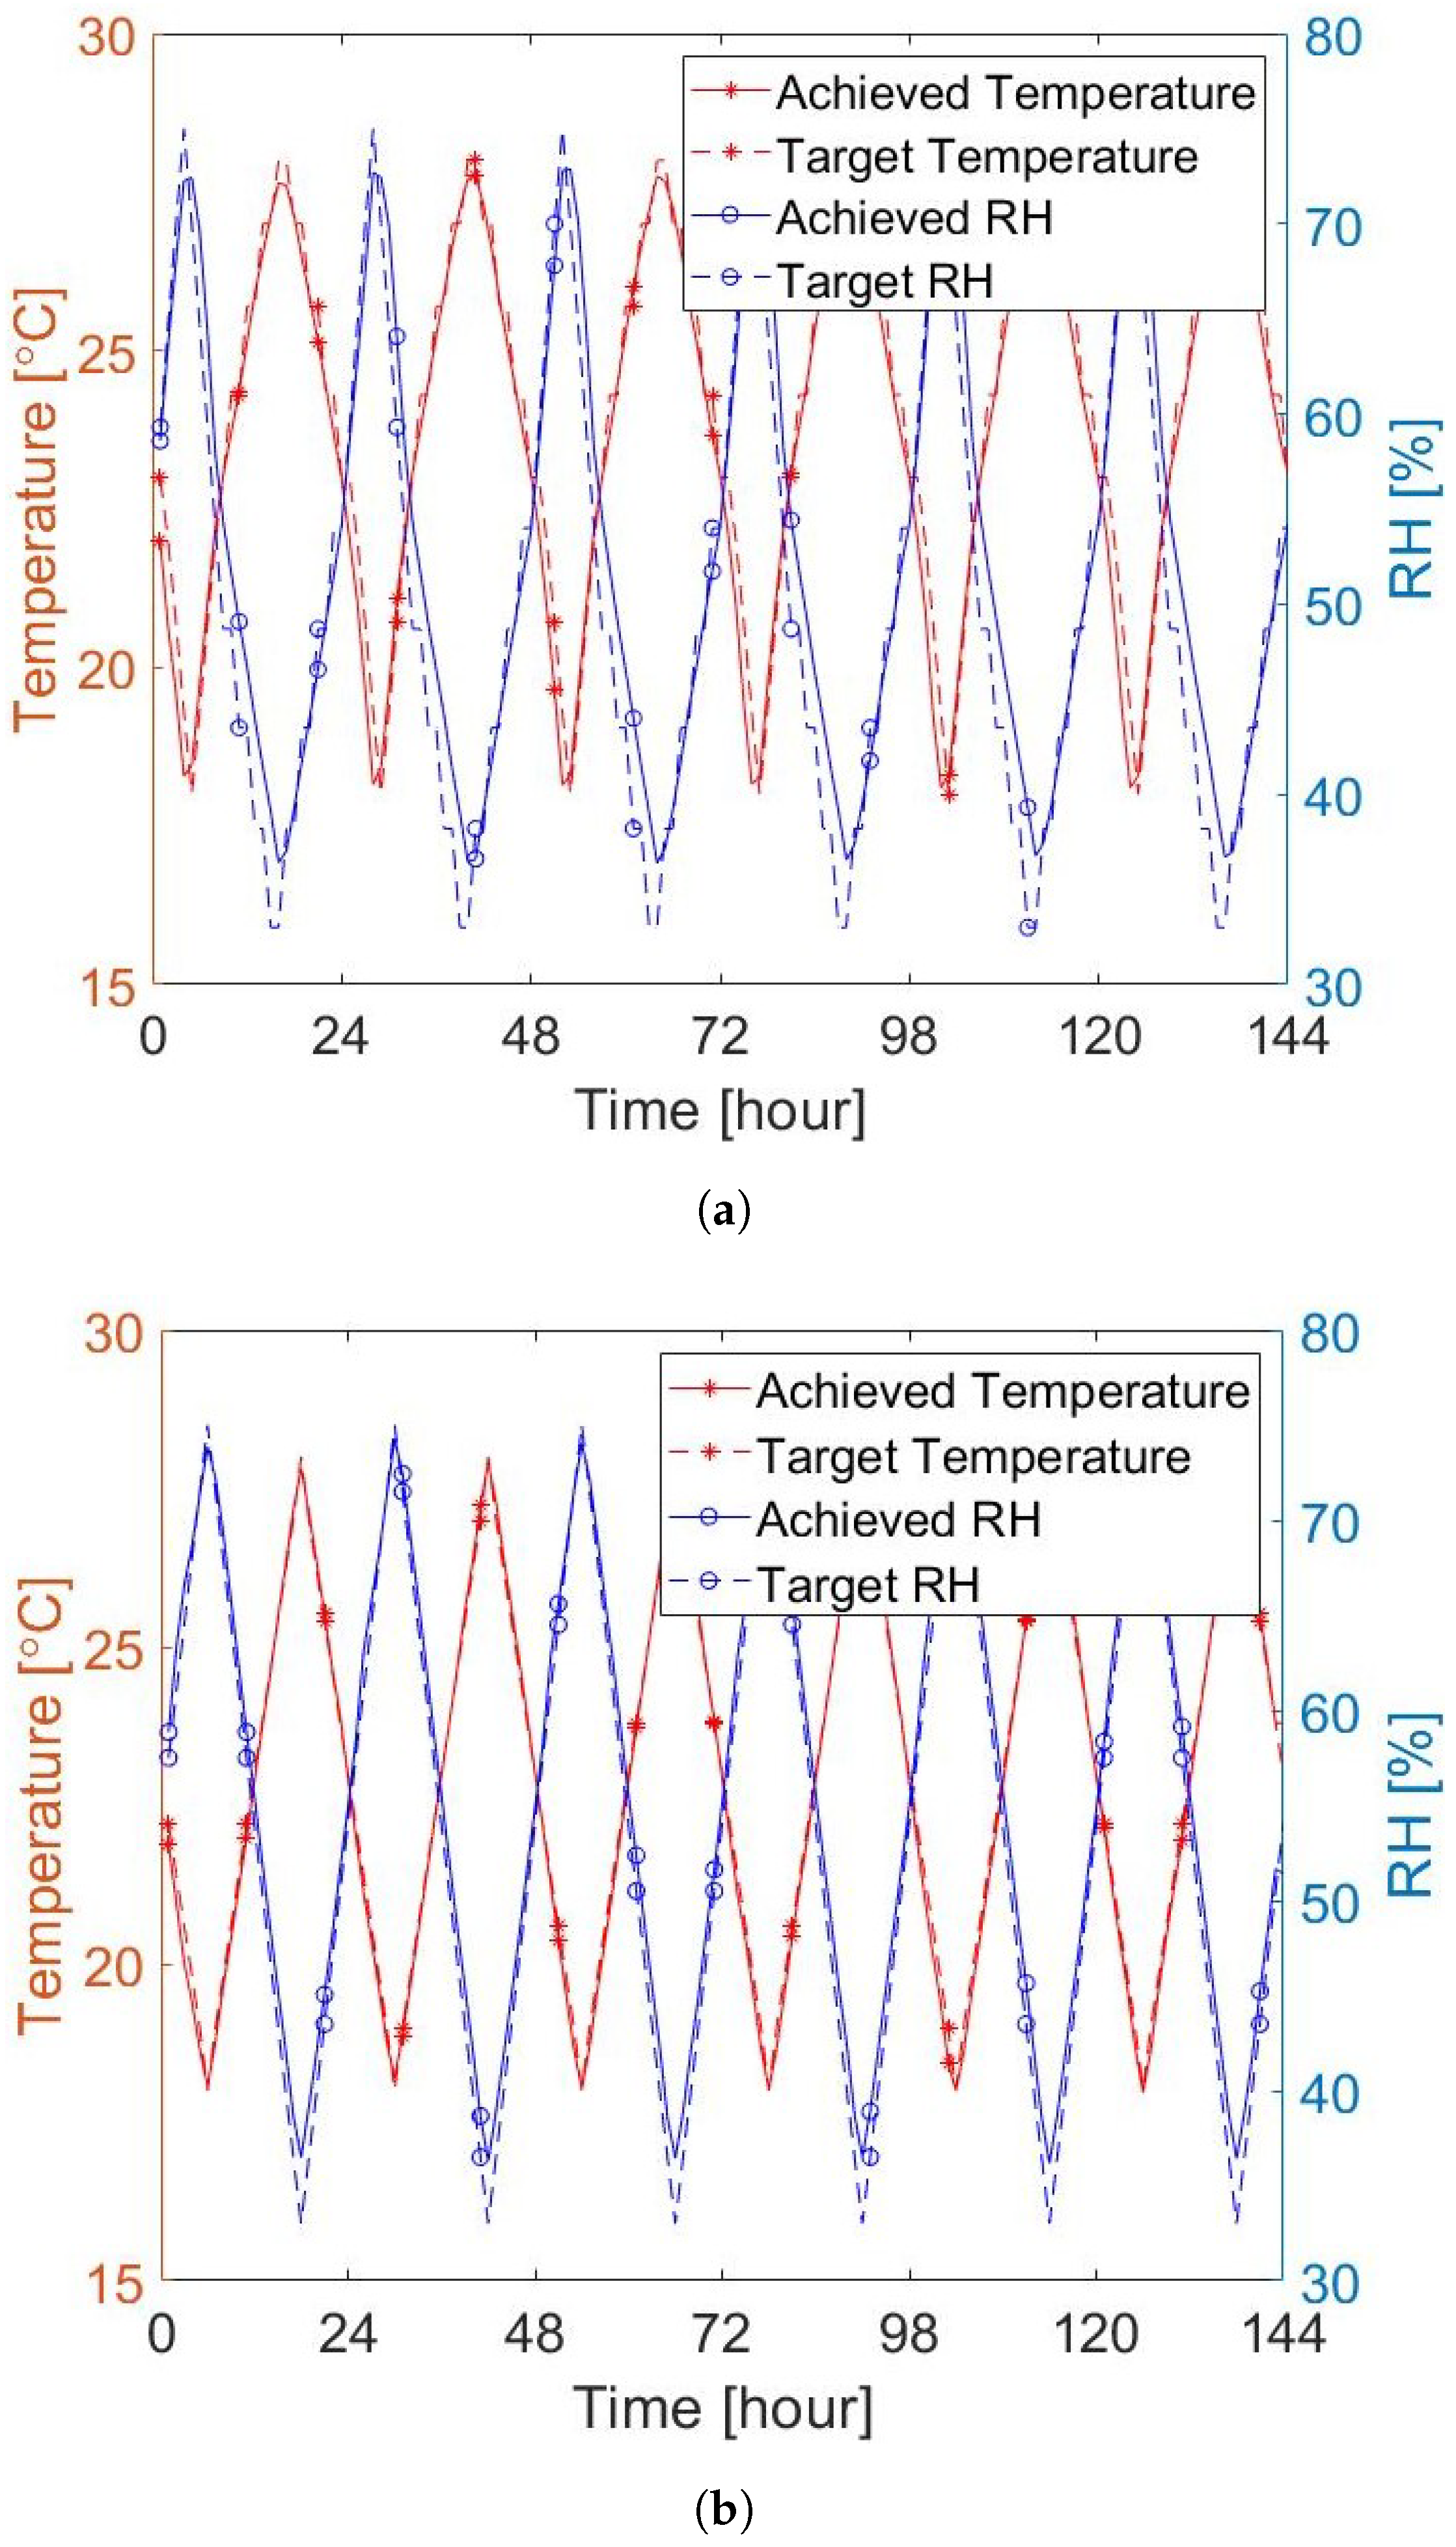
The temperature and RH monitoring in the climatic chamber showed a good agreement between the actual climate conditions with the targeted curves both for the triangular and sinusoidal curves. The Triangular tests are presented in Figure 7. In Figure 7a the RH presented on average 2%RH variations from target, up to 5.6%RH during the de-humidification. while temperature showed 0.43 C variations up to 1.40 C. In the symmetric test (Figure 7a) there was a better match between the actual and target climate. Temperature and RH presented an average variation of 0.17 C and 1.50%RH, respectively, up to 0.79 C and 3.5%RH always during the de-humidification. The temperature and RH fluctuations had smaller amplitudes than the target curves (10 C and 42%RH), as shown in Table 6. In Figure 7b it was also observed a delay of 1 h of RH in the de-humidification phase that was than zeroed in the humidification. The reduced RH fluctuation may produce small variations of the moisture buffering results of the two materials. Similar consideration can be done for the sinusoidal variations, as [8] explained, and as shown in Table 6.
4.2. Simulation Results

4.2.1. Triangular 12 h/12 h Variation for Gypsum

In this section, a demonstration of the application of the method is shown. As exemplification, gypsum material exposed to Triangular 12 h/12 h variation in the boundary temperature and RH-values is presented, but the analysis was performed on all cases. The following data was assumed for the vapour diffusion coefficient and the slope of the sorption isotherm:
δ v 0 = 2.828 × 10 6 m 2 / s ξ = 27.39 kg / m 3
The time period, t p (s) of the process is 24 h. The RH is be highest when the temperature is lowest and vice-verse. The variations are symmetrical around the average value of both the temperature and RH. The following boundary values are assumed:
φ b , max = 0.75 φ b , min = 0.33
T b , max = 28 C T b , min = 18 C
Table 7 shows the amplitude parameter f A (Equations (28) and (29)).
From the table it is clear that for gypsum without any coating, represented by a default Z value of 360 s/m, reduces the moisture buffering capacity with 13%. In the results presented below a value of 195 s/m is used based on a assumed air velocity of 0.1 m/s and a convection surface coefficient based on forced convection [10].
The actual moisture buffering uptake is given by Equation (28). For the case of zero surface resistance we have:
m A = ( 0.75 0.33 ) / 2 2 π 27.39 × 0.0136 × 2.2745 = 50.2 g / m 2

4.2.2. Simulation Results for All Cases, Semi-Infinite Thickness

The periodic penetration depth Equation (30) is of interest. It must be much smaller than the thickness of the material in order to satisfy the general assumption of semi-infinite material. For gypsum and a time period of 24 h:
τ p π = 0.0077 m = 7 . 7 mm
For a six days time period the penetration depth is 18.8 mm. The corresponding values for clay are 7.5 and 18.5 mm for the 12 h and 72 h test, respectively. It means that for diurnal variations, both the thickness 20 mm and 40 mm should be applicable for the semi-infinity analysis. However, it is questionable if the thickness of 20 mm (gypsum case) would work for the six days variation. For the thickness 40 mm (clay case) it would be acceptable.
Table 8 and Table 9 show the simulated vales for the moisture buffering uptake and the time lag. The first value for the time lag represents the time between the RH-peak and the moisture uptake peak. The second one represents the time between the lowest RH and the lowest moisture uptake value. The difference in these values clearly show the asymmetry and non-linearity of the problem. As also shown in the experimental test (Table 4), the longer lag during the de-humidification in the 8/16 h tests, compared to the humidification can be also explained by analysing Equation (39). However, the time lags in Table 9 also justify the models assumption that the surface temperature follows the room temperature. The time delay for the change in temperature in the boards, due to a room temperature change, is around 1200 s for the 20 mm thick gypsum board and 1600 s for the 40 mm thick clay board. This is roughly 1/3 of an hour. For diurnal variations the ratio between this time delay and the time period is of the order 10 2 . For the six days period the ratio is almost one order less and can further justify the approximation.
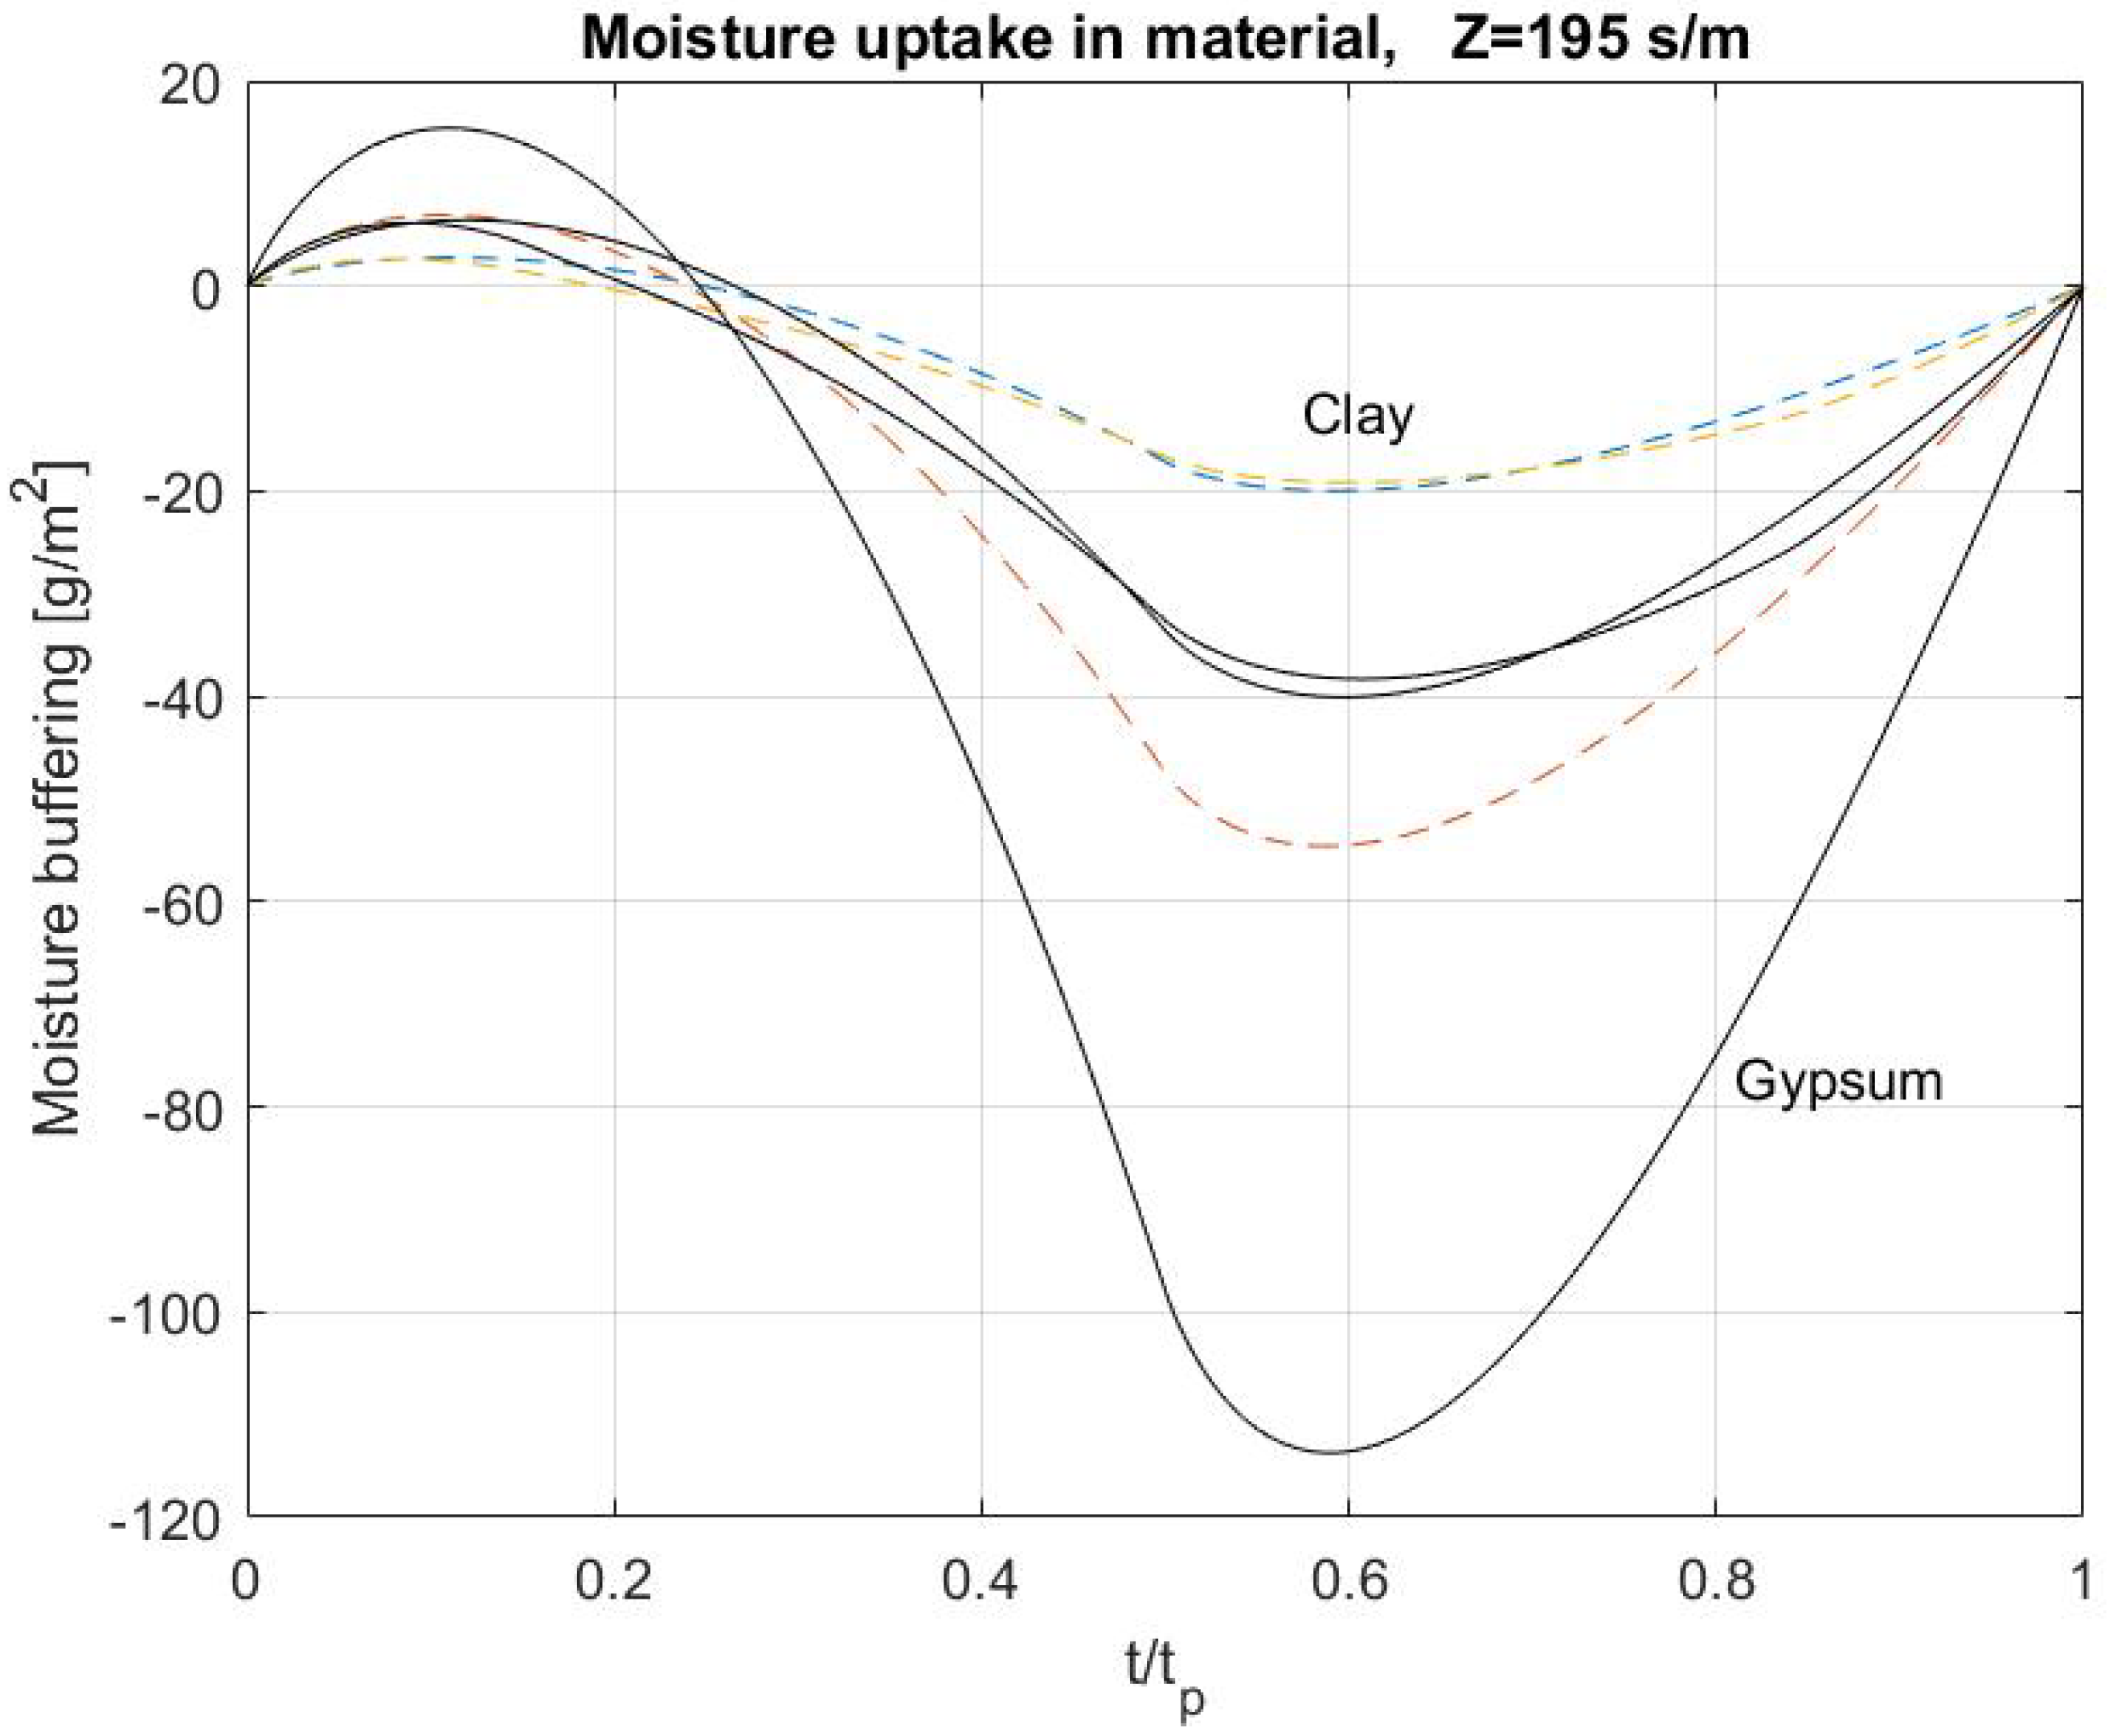
Figure 8 and Figure 9 show the moisture uptake function m as a function of t / t p . Time zero corresponds to the time of the RH peak, and the start time of integration, i.e., we assume the uptake of moisture being zero at time zero, which is an arbitrary choice of level. Consequently, it is possible to follow the accumulation and the drying out of moisture of the specimens during the time period. The two curves with the largest amplitude represent the case with a six days variation. It is clear that the diurnal variations do not significantly differ between 12/12 h and 8/16 h cases. As also shown in the experimental test (Table 4), the longer lag during the de-humidification in the 8 / 16 h tests, compared to the humidification can be explained by analysing Equation (39). If a 8 / 8 h period was analysed, instead of the 8 / 16 , the time t p period would correspond to 16 hours. For the 16 / 16 h test would be i.e., 32 h. The difference in uptake m A would then differ between the 8 / 8 and 16 / 16 h approximately of 32 / 16 = 2 , which correspond to 40% difference. For the time delay, a pure sinusoidal variation suggests that the lag is directly proportional to the time period, which corresponds to a doubled time delay. The time delay ratio in the mixed case ( 8 / 16 ) in Figure 9 is 1.17–1.62. Therefore, the asymmetry is reasonable as the delay ratio is in between 1 and 2, in line with the 8 / 8 and 16 / 16 ratio.
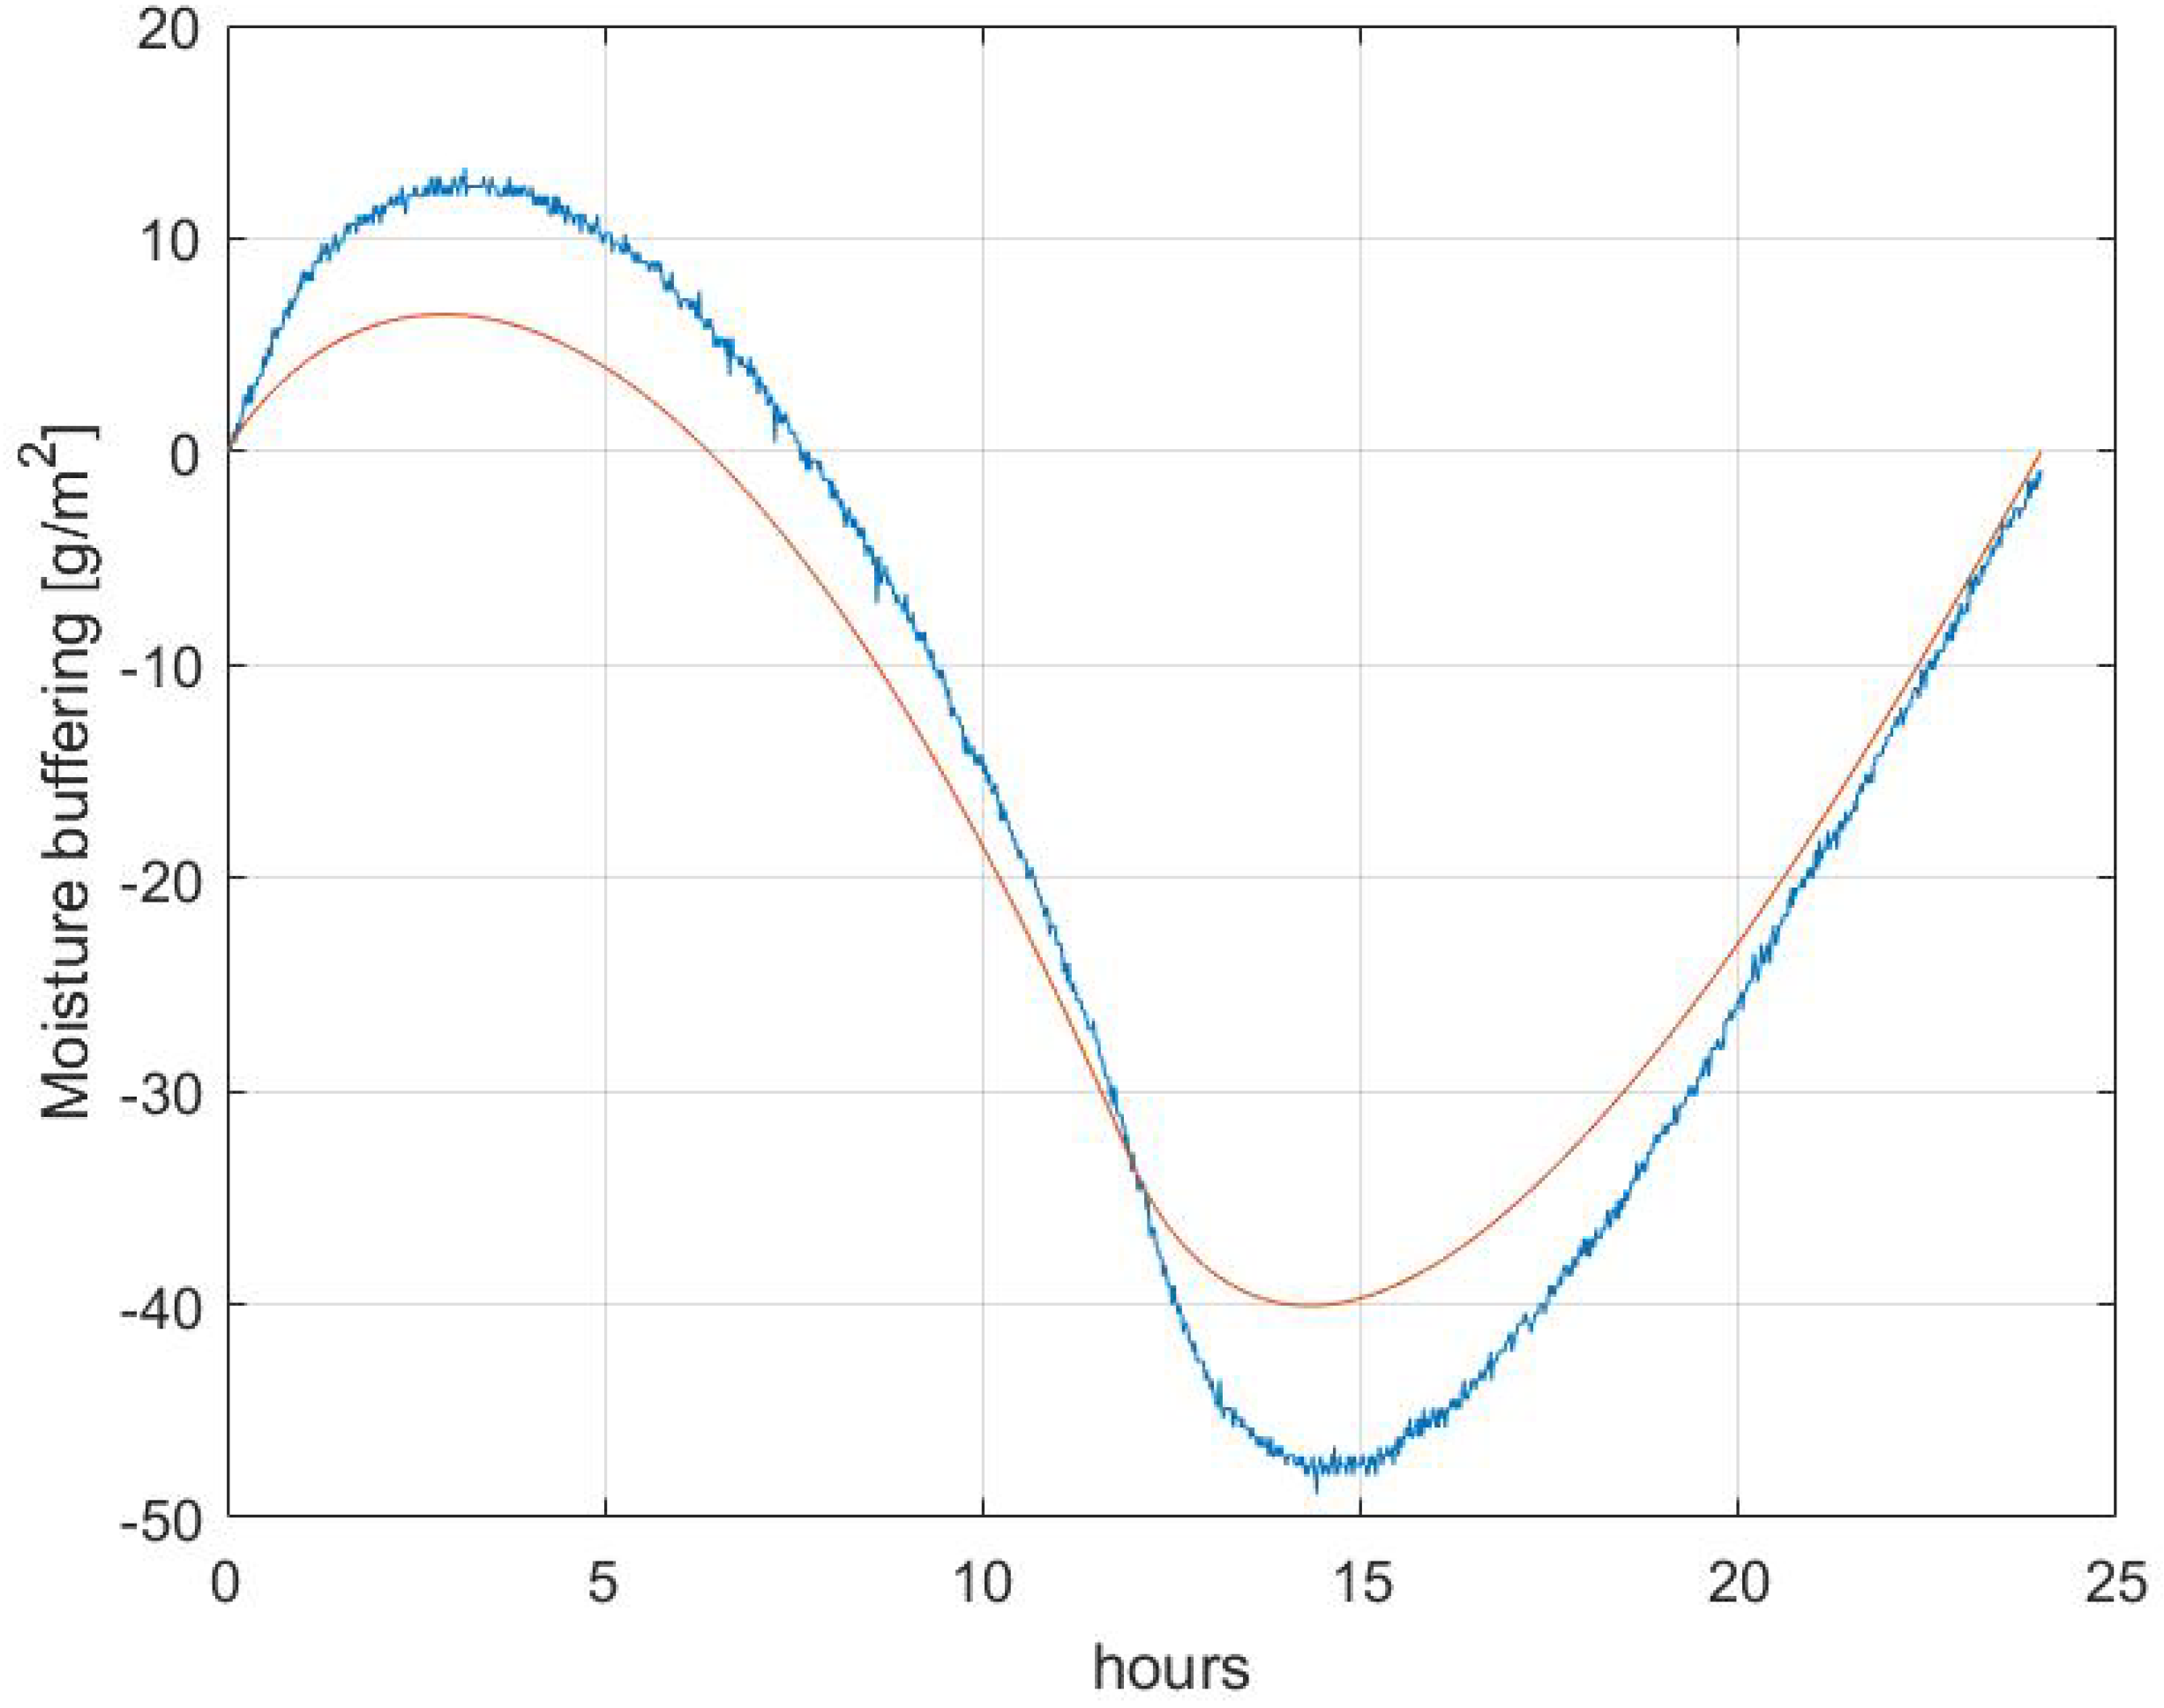
The comparisons with the measured data shows that the simulations systematically underestimates the moisture buffering effect by 11–37%. The largest error for the case of clay is 37% (Sinusoidal 72/72) and lowest 11% (Sinusoidal 8/16). For gypsum the differences are 36% (Triangular 8/16) and 12% (Sinusoidal 8/16). Figure 10 shows a comparison between measured and simulated moisture uptake for gypsum and Triangular 12 h/12 h cycles.

4.2.3. Analysis of the Simulation Results

The difference between the measured and simulated results can depend on material properties, simplifications in the model, insufficient depth of samples and the assumption of the that the temperature in the material is following the boundary temperature.
Looking at the expected material dependence, from Equation (28) it was obtained:
m A = φ b , max φ b , min / 2 2 π ξ · τ p · f A ξ · δ v 0 ξ 0 t p v s ( T ( t ) ) d t · f A
= δ v 0 ξ 0 t p v s ( T ( t ) ) d t · f A
= b v t p v ¯ s · f A b v = δ v 0 ξ
Here, b v = δ v 0 ξ is the moisture vapour effusivity.
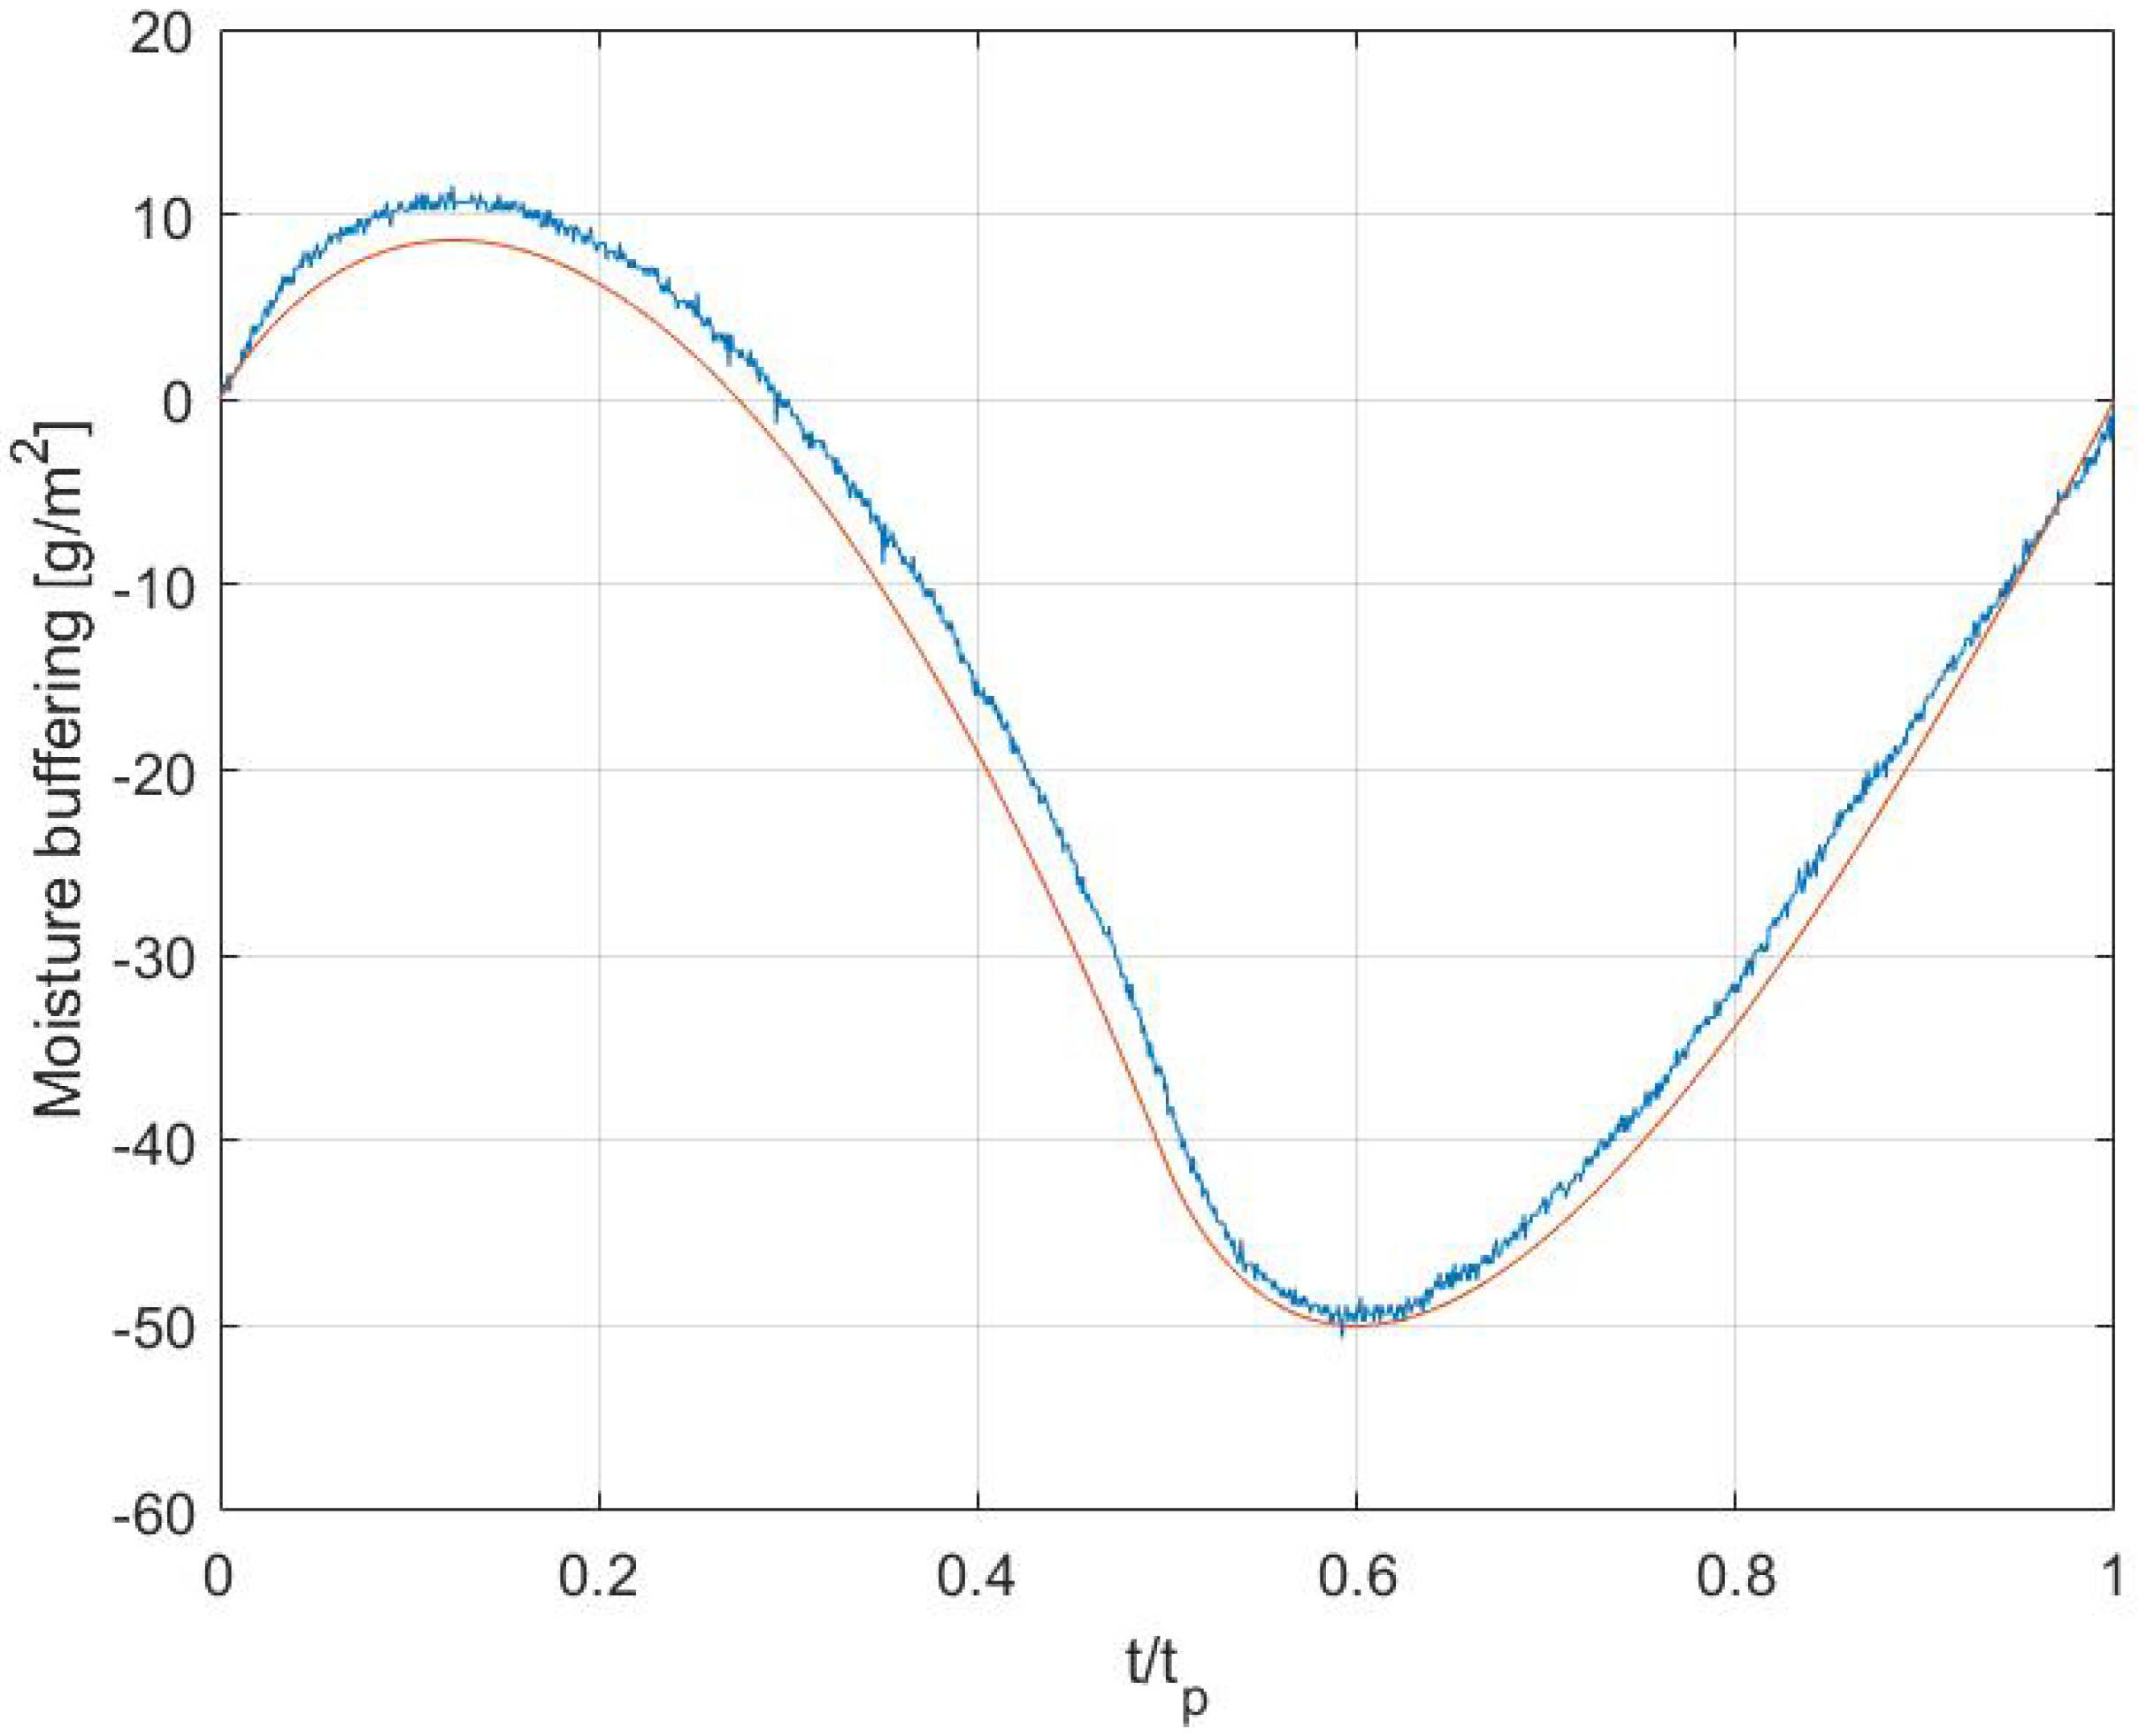
The formula shows that the slope of the sorption curve and the diffusion coefficient play an equal role for the moisture uptake. The factor f A calculated previously for all cases is not significant, as it appears to depend weakly on the RH boundary function. The same consideration applies to the square root of the integrated humidity at saturation over the time period. The previous calculation for gypsum showed that the measured value would fit if either of the parameters are increased by 66%. Considering the expression for the effusivity, it also means that a good fit happens when both material properties are increased by 1.66 = 1.29 i.e., 29% increase. Figure 11 shows the comparison between the experimental Triangular 12/12h case, when this increase of the material properties is applied in the simulation.
The error estimates in relation to effusivity value gives a maximum of 13.5% higher value, not fully support a 29% higher simulation value required for a good fit. By increasing the effusivity by 66% the peak value of the experimental moisture uptake was still higher than the simulated one. The measurement uncertainty is estimated to be less than 3% which would not explain the differences between the measurement and simulations. Another potential uncertainty lies in the surface resistance value. The surface resistance value is especially important for the diurnal variations since the equivalent surface resistance thickness and the periodic penetration depth is closer in magnitude. For gypsum it is round 0.5 mm. The previous calculation shows that for a zero surface resistance, the moisture buffering effect increases by 8%.
The only material specific part of Equation (39) that gives the amplitude of the moisture uptake is the vapour effusivity b v . By applying the same environmental variations to clay and gypsum by doubling b v , the moisture uptake doubled. On fact, it can be observed that the ratio between the case of gypsum and clay is constant for the same load profile, following the ratio of the effusivity. The measurement give the ratio 0.45 to 0.53 while the simulations 0.48–0.49 for all cases. The variations in the simulation values are due to the small variations in f A .
In Equation (39) the term that contains the humidity at saturation depends only on the temperature variation. For a certain load profile (Tri or Sine) and time schedule (12/12 h and 72/72 h) this is constant. The ratio basically only depends on the square roots of the time period. Consequently, it can be expected 6 = 2.4494 times greater moisture buffering effect for the 72/72 h period compared to the 12/12 h variation. The experimental ratio of the moisture uptake between the six days variations and 12/12 h was 2.38–2.92 while simulations gave 2.50–2.56. The variations in the simulation values is due to the small variations in f A .

4.2.4. Comparison of Analytical and Numerical Results

In order to understand the impact of thicknesses that are close to the periodic penetration depth, numerical solutions for the equations (Equations (10), (11) and (14)) are presented. Only the case of gypsum was analysed. The Matlab pdepe-solver were used with a space resolution of around 0.1 mm.
From the results it can be seem that the semi-infinite analytical solution is verified by the numerical simulation and that it also works well for diurnal variations as long as the thickness is 20 mm or more (Table 10). For thinner material thicknesses the moisture buffering effect can be over or under estimated while the time lag becomes overestimated. It can also be observed that there is a maximum buffering effect for material thickness similar to the periodic penetration depth, which is result well known from the heat transfer area investigating effect of thermal mass on energy demand [24].
For 72/72 variations the semi-infinite analytical solution works well as long as the thickness is 40 mm or more (Table 11). For thinner material thicknesses the moisture buffering effect can be over or under estimated while the time lag becomes overestimated. The moisture buffering goes up with 14% for the 72/72 simulation with the thickness 20 mm instead of infinite thickness. This reduces the difference between experimental and simulation result.
The time lags is reduced between with 3.8 and 5.0 hours, when thickness is reduced down to 20 mm for infinity. The match between this simulation and the measurement becomes better for the top peak time delay but there is a larger lag for the bottom peak. Overall, it can be stated that either in the experimental and simulations temperature is a significant factor that delays the response of materials to buffer humidity. This is further justified in [8], in which the response of materials to constant and variable temperature were compared, showing that variable temperatures generate a significant lag compared to the case at constant temperature.

5. Conclusions

Clay and gypsum coatings were experimentally tested to investigate the moisture buffering capacity of the materials under simultaneous temperature and RH fluctuations. The dynamic sorption capacity of plasters were observed when environmental variations follow either sinusoidal and triangular variations and different interval for the humidification/de-humidification were applied (12/12 h, 8/16 h, 72/72 h). In this way, it was possible to better understand the influence of temperature and humidity on the moisture uptake of construction materials. The experimental results were compared with a novel simulation method that considers the impact of the surface resistance in the calculation of the material moisture uptake under variable environmental conditions. The model approach to consider materials as semi-infinite bodies was also verified with the analytical results.
The simulation model supported by the experimental results demonstrated clay and gypsum responded differently to the simultaneous temperature and RH fluctuations, due to the different material properties and pore structure. However, the environmental signal has a significant role in the moisture buffering capacity of materials. Both the RH and temperature signal (triangular and sinusoidal) and time intervals impact the way plasters adsorb moisture from the indoor. Differences were found when different time frames were applied. When materials were subjected to daily cycles (12/12 h and 8/16 h), there were no significant differences between the sinusoidal and triangular test and also between the 12/12 h and 8/16 h in terms of peak to peak sorption capacity. However, when temperature and RH were slowly varied over six days, clay and gypsum stored and released more moisture, showing also differences between the sinusoidal and triangular test. The slower increase and decrease of the environmental conditions allowed the plasters to store more moisture.
The difference between the 72 h tests is linked to the different materials thickness and penetration depth. The penetration depth not only depends on the material property, but it also varies depending on the environmental conditions. For gypsum, which thickness was 20 mm, its moisture buffering performance increased in the 72 h test, due to the deeper penetration of moisture into the plaster, and due to the longer exposure to high and low environmental conditions. Another observation was the lag of both plasters when exposed to simultaneous temperature and RH variations. Simulations showed a delay of few hours in the daily variations and up to 20 h in the 72 h test. The lag is attributed to temperature variations that delays the response of materials. Moreover, the continuous variations of the environmental conditions did not allow the material to stabilise and to response quickly to the humidity variations.
In conclusion, explicit analytical formulas applied in the model were derived to calculate the moisture distribution inside a material that is exposed to cyclic variations in RH and temperature. The semi-infinite analytical solution was verified, confirming the formula can be used to estimate the uptake and release of moisture to an exposed material surface as long as the periodic penetration depth is less than half the thickness of the material.
The analytical method showed a great resemblance to the measured values, and together to the novel experimental approach of testing the sorption capacity of material will quantify more accurately the capacity of hygroscopic materials to moderate the indoor humidity and improve the hygrothermal comfort and health of people in buildings.

Author Contributions

Conceptualisation, V.C., C.-E.H.; methodology, V.C., C.-E.H.; formal analysis, V.C., C-.E.H.; investigation, V.C., C.-E.H.; resources, V.C., C.-E.H.; data curation, V.C., C.-E.H.; writing—original draft preparation, V.C., C.-E.H.; writing—review and editing, V.C., D.M., A.S., P.W.; visualisation, V.C., C.-E.H.; supervision, C.-E.H., D.M., A.S., P.W. All authors have read and agreed to the published version of the manuscript.

Funding

This research received no external funding.

Acknowledgments

This study was supported by the EPSRC Centre for Decarbonisation of the Built Environment (dCarb) [grant number EP/L016869/1] and a University of Bath Research Scholarship.

Conflicts of Interest

The authors declare no conflict of interest.

References

  1. Bylund Melin, C.; Hagentoft, C.E.; Holl, K.; Nik, V.M.; Kilian, R. Simulations of moisture gradients in wood subjected to changes in relative humidity and temperature due to climate change. Geosciences 2018, 8, 378. [Google Scholar] [CrossRef] [Green Version]
  2. Cavalagli, N.; Kita, A.; Castaldo, V.; Pisello, A.; Ubertini, F. Hierarchical environmental risk mapping of material degradation in historic masonry buildings: An integrated approach considering climate change and structural damage. Constr. Build. Mater. 2019, 215, 998–1014. [Google Scholar] [CrossRef]
  3. Huijbregts, Z.; Kramer, R.; Martens, M.; Van Schijndel, A.; Schellen, H. A proposed method to assess the damage risk of future climate change to museum objects in historic buildings. Build. Environ. 2012, 55, 43–56. [Google Scholar] [CrossRef]
  4. Huijbregts, Z.; Schellen, H.; van Schijndel, J.; Ankersmit, B. Modelling of heat and moisture induced strain to assess the impact of present and historical indoor climate conditions on mechanical degradation of a wooden cabinet. J. Cult. Herit. 2015, 16, 419–427. [Google Scholar] [CrossRef]
  5. Napp, M.; Kalamees, T. Energy use and indoor climate of conservation heating, dehumidification and adaptive ventilation for the climate control of a mediaeval church in a cold climate. Energy Build. 2015, 108, 61–71. [Google Scholar] [CrossRef]
  6. Samek, L.; De Maeyer-Worobiec, A.; Spolnik, Z.; Bencs, L.; Kontozova, V.; Bratasz, Ł.; Kozłowski, R.; Van Grieken, R. The impact of electric overhead radiant heating on the indoor environment of historic churches. J. Cult. Herit. 2007, 8, 361–369. [Google Scholar] [CrossRef]
  7. Bratasz, Ł.; Kozłowski, R.; Camuffo, D.; Pagan, E. Impact of indoor heating on painted wood-Monitoring the altarpiece in the Church of Santa Maria Maddalena in Rocca Pietore, Italy. Stud. Conserv. 2007, 52, 199–210. [Google Scholar] [CrossRef]
  8. Cascione, V.; Maskell, D.; Shea, A.; Walker, P.; Mani, M. The moisture buffering performance of plasters when exposed to simultaneous sinusoidal temperature and RH variations. J. Build. Eng. 2020, in press. [Google Scholar] [CrossRef]
  9. Cascione, V.; Maskell, D.; Shea, A.; Walker, P. A review of moisture buffering capacity: From laboratory testing to full-scale measurement. Constr. Build. Mater. 2019, 200, 333–343. [Google Scholar] [CrossRef]
  10. Hagentoft, C.E. Introduction to Building Physics; Studentlitteratur AB: Lund, Sweden, 2001. [Google Scholar]
  11. Svennberg, K. Moisture Buffering in the Indoor Environment; Lund University: Lund, Sweden, 2006; Volume 1016. [Google Scholar]
  12. Peuhkuri, R.; Rode, C. Moisture buffer value: Analytical determination and use of dynamic measurements. In Proceedings of the Working Paper IEA Annex 41 Meeting, Trondheim, Norway, 26–28 October 2005. [Google Scholar]
  13. Kaczorek, D. Moisture buffering of multilayer internal wall assemblies at the micro scale: Experimental study and numerical modelling. Appl. Sci. 2019, 9, 3438. [Google Scholar] [CrossRef] [Green Version]
  14. Rode, C.; Peuhkuri, R.H.; Hansen, K.K.; Time, B.; Svennberg, K.; Arfvidsson, J.; Ojanen, T. Nordtest project on moisture buffer value of materials. In Proceedings of the AIVC Conference ‘Energy performance regulation’: Ventilation in Relation to the Energy Performance of Buildings, Brussels, Belgium, 21–23 September 2005; INIVE EEIG: Brussels, Belgium; pp. 47–52. [Google Scholar]
  15. Cascione, V.; Cavone, E.; Maskell, D.; Shea, A.; Walker, P. The effect of air velocity on moisture buffering. In MATEC Web of Conferences; EDP Sciences: Les Ulis, France, 2019; Volume 282, p. 02007. [Google Scholar]
  16. Zu, K.; Qin, M.; Rode, C.; Libralato, M. Development of a moisture buffer value model (MBM) for indoor moisture prediction. Appl. Therm. Eng. 2020, 171, 115096. [Google Scholar] [CrossRef]
  17. Xie, H.; Gong, G.; Wu, Y.; Liu, Y.; Wang, Y. Research on the hygroscopicity of a composite hygroscopic material and its influence on indoor thermal and humidity environment. Appl. Sci. 2018, 8, 430. [Google Scholar] [CrossRef] [Green Version]
  18. Bylund Melin, C. Wooden Objects in Historic Buildings: Effects of Dynamic Relative Humidity and Temperature. Ph.D. Thesis, Göteborgs Universitet, Gothenburg, Sweden, 2018. [Google Scholar]
  19. Hagentoft, C.E. Water Vapour Transport to a Semi-Infinite Material with Simultaneous Varying Surface Relative Humidity and Temperature; Nordic Building Physics Symposium: Tallin, Estonia, 2020. [Google Scholar]
  20. Hagentoft, C.E. Water vapor transport to material surfaces-Simplified analytical expressions for non-linear material properties. In MATEC Web of Conferences; EDP Sciences: Les Ulis, France, 2019; Volume 282, p. 02002. [Google Scholar]
  21. Cascione, V.; Maskell, D.; Shea, A.; Walker, P.; Mani, M. Comparison of moisture buffering properties of plasters in full scale simulations and laboratory testing. Build. Constr. Mater. 2020, 252. [Google Scholar] [CrossRef]
  22. Standard, A. Standard 55—2017 Thermal Environmental Conditions for Human Occupancy; Ashrae: Atlanta, GA, USA, 2017. [Google Scholar]
  23. Maskell, D.; Thomson, A.; Walker, P.; Lemke, M. Determination of optimal plaster thickness for moisture buffering of indoor air. Build. Environ. 2018, 130, 143–150. [Google Scholar] [CrossRef]
  24. Ståhl, F. Influence of Thermal Mass on the Heating and Cooling Demands of a Building Unit; Chalmers University of Technology: Gothenburg, Sweden, 2009. [Google Scholar]
Figure 1. Moisture buffering set up in the climatic chamber.
Applsci 10 07665 g001
Figure 2. Triangular temperature and RH variations, (a) Triangular 12/12 h; (b) Triangular 8/16 h; (c) Triangular 72/72.
Applsci 10 07665 g002
Figure 3. Sinusoidal temperature and RH fluctuations, (a) Sinusoidal 12/12 h; (b) Sinusoidal 8/16 h; (c) Sinusoidal 72/72.
Applsci 10 07665 g003
Figure 4. Moisture uptake curves for clay and gypsum under triangular temperature and RH variations, (a) Triangular 12/12 h; (b) Triangular 8/16 h; (c) Triangular 72/72.
Applsci 10 07665 g004
Figure 5. Moisture uptake curves for clay and gypsum under sinusoidal temperature and RH fluctuations, (a) Sinusoidal 12/12 h; (b) Sinusoidal 8/16 h; (c) Sinusoidal 72/72.
Applsci 10 07665 g005
Figure 6. Hygric lag of the uptake curves for clay and gypsum under triangular (a) and sinusoidal (b) temperature and RH fluctuations, with RH as reference, and the corresponding with the vapour pressure as reference (c,d).
Applsci 10 07665 g006
Figure 7. Monitored temperature and RH into the chamber the triangular tests, (a) Triangular 8/16 h; (b) Triangular 12/12 h.
Applsci 10 07665 g007
Figure 8. The moisture uptake function m (g/m 2 ) for the Sinusoidal variations as a function of t / t p . The full drawn black curves represent Gypsum while the dashed ones represent Clay. The two curves with the largest amplitude represent the case with a six days variation ( 72 / 72 h). The smoother and more sinusoidal-like curve represents 12 / 12 h and the other 8 / 12 h, respectively.
Applsci 10 07665 g008
Figure 9. The moisture uptake function m (g/m 2 ) for the Triangular variations as a function of t / t p . The full drawn black curves represents Gypsum while the dashed ones represent Clay. The two curves with the largest amplitude represent the case with a six days variation ( 72 / 72 h). The smoother and more sinusoidal-like curve represents 12 / 12 h and the other 8 / 12 h, respectively.
Applsci 10 07665 g009
Figure 10. Comparison between measured (blue) and simulated (red) moisture uptake for Gypsum and triangular 12 h/12 h cycles.
Applsci 10 07665 g010
Figure 11. Comparison between measured and modified simulated moisture uptake for Gypsum and triangular 12 h/12 h cycles.
Applsci 10 07665 g011
Table 1. Materials’ properties and their confidence interval.
Material ρ dry (kg/m 3 ) Φ ( % ) μ ( ) ξ w (kg/kg)
Clay 1870 ± 19 24.80 ± 4.1 19.21 ± 5.2 0.007 ± 0.003
Gypsum856 ± 10 61.91 ± 1.5 8.84 ± 2.1 0.032 ± 0.001
Table 2. Summary of the performed tests and time intervals for high and low temperature and RH.
TestsTemperatureRH
LowHighHighLow
Triangular 12/1212 h12 h12 h12 h
Triangular 8/168 h16 h8 h16 h
Triangular 72/7272 h72 h72 h72 h
Sinusoidal 12/1212 h12 h12 h12 h
Sinusoidal 8/168 h16 h8 h16 h
Sinusoidal 72/7272 h72 h72 h72 h
Table 3. Sorption capacity of clay and gypsum (peak to peak) for the triangular and sinusoidal temperature and RH variations.
MaterialCurveSorption [g/m 2 ]
12 h8 h72/72
ClayTri26.6926.3376.34
Sine32.7729.3695.69
GypsumTri59.8360.38142.69
Sine72.2568.47181.07
Table 4. Sorption hygric lag [hours].
TriangularSinusoidal
12 h8 h72 h12 h8 h72 h
Clay4.00/3.502.83/4.1718.33/21.333.50/3.002.80/4.5321.17/21.17
Gypsum3.00/2.672.83/3.3310.67/14.173.33/2.672.80/4.8014.17/19.83
Table 5. Uncertainty measurements.
UncertaintyClayGypsum
AverageUncertaintyAverageUncertainty
Widthmm149.71±0.407150.42± 0.016
DimensionLengthmm150.62±0.795150.41± 0.003
Thicknessmm40.36±0.00820.94±0.027
Aream 2 0.023±0.000180.023±0.00018
WeightLows ±0.01 ±0.03
Peaksg576.88±0.03448.87±0.07
Moisture Uptakeg/m 2 42.05± 0.7567.82±1.82
Table 6. Temperature and RH amplitude.
TemperatureRH
Tri 8/169.6536.9
Tri 12/129.9338.1
Tri 72/729.9239.7
Sine 8/169.8637.9
Sine 12/129.9039.1
Sine 72/729.7739.7
Table 7. The amplitude parameter f A for the determination of the total moisture uptake during a half cycle, case triangular 12/12h. The third column shows the reduction in moisture buffering capacity due to the surface resistance.
Z [s/m] f A f A f A ( Z = 0 )
02.27451
602.22030.98
3601.97370.87
10 3 1.57080.69
10 4 0.36840.16
10 5 0.04160.02
Table 8. Simulated results for sorption capacity of clay and gypsum (peak to peak) for the triangular and sinusoidal temperature and RH variations.
MaterialCurveSorption [g/m 2 ]
12 h8 h72 h
ClayTri22.7221.7756.88
Sine27.9726.4069.90
GypsumTri46.5044.45119.25
Sine57.4054.05146.73
Table 9. Simulation results for sorption hygric lag [hours].
Hygric LagTriangularSinusoidal
12 h8 h72 h12 h8 h72 h
Clay2.7/2.22.0/2.415.4/12.63.4/2.92.4/3.419.8/16.9
Gypsum2.9/2.32.2/2.615.9/12.93.5/3.02.5/3.520.0/17.2
Table 10. Numerical simulation results for gypsum and varying thickness D, diurnal variations. The surface resistance Z = 195 s/m. Results from the analytical model is also inserted for the case of infinite thickness.
D [mm] m A [g/m 2 ] t delay , max [hour] t delay , min [hour]
552.01.671.08
1064.73.372.69
2056.73.573.05
4057.83.533.03
10058.13.483.05
57.43.53.0
Table 11. Numerical simulation results for gypsum and varying thickness D, 72/72 variations. The surface resistance Z = 195 s/m. Results from the analytical model is also inserted for the case of infinite thickness.
D [mm] m A [g/m 2 ] t delay , max [hours] t delay , min [hours]
557.01.71.2
10110.56.33.9
20167.016.212.2
40147.720.617.7
100146.420.117.2
146.720.017.2
Publisher’s Note: MDPI stays neutral with regard to jurisdictional claims in published maps and institutional affiliations.