Abstract
Crest cracking is one of the most common damage types for high earth-rockfill dams. Cracking risk of dam crest is closely related to the duration of abnormal deformation state. In this paper, a methodology for dynamic risk evaluation and early warning of crest cracking for high earth-rockfill dams is proposed and mainly consists of: (a) The discrimination of abnormal deformation state related to crest cracking, which is implemented by comparing the crest settlement inclination with the threshold value. (b) Computation of crest cracking probability and estimation of cracking time. The exponential distribution is adopted to represent the probability distribution of the duration TAS of abnormal state before crest cracking. Then the crest cracking probability in a given time can be computed by integration with respect to TAS. Inversely, the cracking time corresponding to a given probability can be estimated. (c) Determination of the values of probability adopted to early warn crest cracking, which are suggested to be selected by statistical analysis of the calculated probabilities at the observed cracking times. (d) Bayesian estimation and updating of probability distribution of the parameter λ in the PDF of TAS, according to observed durations of abnormal state before crest cracking. The methodology is illustrated and verified by the case study for an actual earth-rockfill dam, of which crest cracking and recracking events were observed during the periods of high reservoir level. According to the observed values of TAS, the probability distribution for λ is progressively updated and the dispersion of the distributions of λ gradually decreases. The crest cracking probability increases with the duration of abnormal state and the width of confidence interval of the estimated cracking probability progressively contracts with the updating of the distribution for λ. Finally, the early warning of crest cracking for the dam is investigated by estimating the lower limit of cracking time. It is shown that early warning of crest cracking can be issued from at least 20 days ahead of the occurrence of crest cracking event. The idea of using duration of abnormal state of crest settlement to evaluate crest cracking risk of the earth-rockfill dam in this paper may be applicable to other dams.
1. Introduction
For favorable adaptability of dam foundations, full utilization of local materials and building-excavated materials, low construction cost, and low cement consumption, earth-rockfill dams are one of the most promising dam types in dam construction [1,2]. In order to obtain hydropower, many high earth-rockfill dams have been built in China, such as the Nuo Za Du (261.5 m high), Chang He Ba (240 m high), Pu Bu Gou (186 m high), Xiao Lang Di (154 m high) and Shi Zi Ping (136 m high). Catastrophic consequences can result from dam breaks, thus the safety of these high earth-rockfill dams has been a matter of increasing concern. According to the previous statistical works reported in the literature [3,4,5] crest cracking is one of the most common damage types for earth dams and embankments. Crest cracking had also been observed in some of the high earth-rockfill dams mentioned above (i.e., the Nuo Za Du, Pu Bu Gou, Xiao Lang Di and Shi Zi Ping dams) during construction or operation period.
It is well known that crest cracking is closely related to the deformation behavior of earth dams and embankments, specifically the differential settlements [3,6,7,8,9,10,11,12,13,14]. The deformation of high earth-rockfill dams can be accurately predicted using the Finite Element Method (FEM) with calibrated model parameters based on the in-situ deformation monitoring data [15,16,17,18]. The crest cracking hazard of high earth-rockfill dams can be evaluated with the settlement inclination computed from FEM [3,10]. If the computed settlement inclination is greater than a certain threshold, the dam crest is prone to crack, but it does not mean that the dam crest will crack immediately. However, if the abnormal state (i.e., the settlement inclination of the dam crest exceeds the threshold value) lasts for a long time, the potential of crest cracking becomes large and increases with the duration of abnormal state. Due to complex physical mechanisms and stochastic factors, the duration of abnormal state before crest cracking is uncertain and can be regarded as a random variable. Consequently, the probability of crest cracking during the period of abnormal state can be calculated.
Since the relevant historical data is scarce, especially for a specific earth-rockfill dam, the Probability Distribution Parameters (PDPs) for the duration of abnormal state before crest cracking cannot be obtained by classical (frequentist) statistical analysis. Fortunately, Bayesian theory can be applied to estimate the probability distribution of the PDPs given the observed time intervals between the starting of abnormal state and the occurrence of crest cracking [19]. Moreover, the probability distribution of the PDPs can be dynamically updated along with the accumulation process of the observed evidence. Therefore, in the Bayesian framework, crest cracking risk of earth-rockfill dams can be dynamically evaluated according to the progressively updated probability distribution of the PDPs. In addition, early warning of the crest cracking can be issued in terms of the probabilistically estimated cracking time range.
The objectives of our works are mainly to address (1) how to evaluate crest cracking risk of earth-rockfill dams with duration of abnormal state of crest settlement, (2) how to estimate the cracking times corresponding to a given probability interval for early warning of crest cracking and (3) how to update the probability distribution for parameter λ in the formulation of crest cracking risk. The intellectual merit of our works lies in the idea of using duration of abnormal state of crest settlement to evaluate crest cracking risk of earth-rockfill dams. The remainder of this paper is organized as follows. In Section 2, brief descriptions of an actual earth-rockfill dam and its crest cracking are presented. In Section 3, the methodology is detailed. In Section 4, the results and discussion for the case study are given. In Section 5, some conclusions are drawn.
2. Brief Descriptions of an Actual Earth-Rockfill Dam and Its Crest Cracking
2.1. The Earth-Rockfill Dam
The earth-rockfill dam is located in southwest China. The main purposes of the dam are flood protection and power generation. The dam crest elevation is 856.00 m, the maximum dam height is 186 m, and the crest width is 14 m. The upstream and downstream slope ratios are 1:2.0 and 1:1.8 respectively. The seepage prevention component of the dam is the central vertical gravelly soil core. The top elevation and width of the core are 854.00 m and 4 m respectively. The upstream and downstream slope ratios of the core are both 1:0.25. The dam shell is mainly composed of rockfills. There are filter layers and transition zones between the dam shell and the core. The dam is built on alluvial deposits and the seepage in the dam foundation is cut off by two closed concrete diaphragm walls. The highest cross section of the dam and foundation is shown in Figure 1.

Figure 1.
The highest cross section of the dam and foundation, where the red spots represent the monitoring points for calibration of the constitutive model parameters.
The dam was constructed between March 2004 and September 2009. The first water impoundment of the reservoir began in November 2009, and the reservoir level rose to the normal water level (850.00 m) in November 2010. After then, the reservoir level fluctuates periodically between the dead water level (790.00 m) and the normal water level. The dam filling process and the water level of the reservoir are shown in Figure 2.

Figure 2.
The dam filling process and the water level of the reservoir.
2.2. The Dam Crest Cracking
After the reservoir level first reached the normal water level, on 14 November 2010, longitudinal cracks were observed in the dam crest. After that, the cracks were sealed with asphalt materials. However, in the following years, the sealed cracks were split again and again during the periods of high reservoir level. The dates of crest cracking and recracking are listed in Table 1. The cracks extend along the dam axis and are mainly distributed between cross sections 0 + 187.84 m~0 + 234.14 m, 0 + 250.14 m~0 + 300.14 m and 0 + 308.5 m~0 + 419.0 m. The maximum crack width is 6 mm. The distribution ranges and the photograph of the cracks are shown in Figure 3. In order to investigate the depths of the cracks, the dam owner carried out three field surveys in 2010, 2012 and 2019, respectively. The depths of all the cracks were detected using electrical resistivity tomography and ground penetrating radar. Moreover, the downward propagations of cracks in several locations were revealed by excavation. The revealed cracks in exploratory pits are shown in Figure 4. The maximum depth of the cracks is inferred to be about 1.5 m according to the field survey results. The vertical distance between the dam crest and the top of the gravelly soil core is 2 m, thus the cracks may not penetrate into the gravelly soil core. In addition, the monitoring data from piezometers did not show any anomaly of the seepage in the gravelly soil core.

Table 1.
The dates of crest cracking and recracking as well as the corresponding durations of abnormal state.

Figure 3.
The distribution ranges and the photograph of the cracks.

Figure 4.
The revealed cracks in exploratory pits.
Although the cracks did not directly harm the safety of the gravelly soil core, the cracks should be duly sealed, since rains will flow into the cracks and erode the materials inside the dam. Therefore, it is worth estimating the time range of the dam crest cracking and remediation measures can be prepared in advance. In the following sections, we propose a methodology for dynamic risk evaluation and early warning of crest cracking for high earth-rockfill dams in the Bayesian framework and apply it to the dam mentioned above.
3. Methodology for Dynamic Risk Evaluation and Early Warning of Crest Cracking
3.1. Outline of the Methodology
The first step of the methodology is to define the abnormal state associated with crest cracking of high earth-rockfill dams. As discussed in the introduction, crest cracking is closely related to the settlement inclination of the dam crest. If the settlement inclination exceeds a certain threshold, the dam crest is susceptible to cracking. The settlement inclination is defined as [3]:
where γS is the settlement inclination, ΔS is the settlement difference of two points at the same elevation, and ΔL is the horizontal distance between the two points.
The settlements can be computed using FEM. In order to improve the accuracy of the calculated settlements, the material parameters of the finite element model are calibrated based on the in-situ deformation monitoring data. The determination of threshold γC of settlement inclination (when γS > γC, crest cracking possibly occurs, and vice versa) is an intractable problem and there is no consensus on the specific value of γC for high earth-rockfill dams. The suggested values of γC for high earth-rockfill dams in the literature [3,10] roughly range from 0.2% to 1%. In this study, the value of γC is taken as 0.5%. Accordingly, the abnormal state, which is indicative of the possibility of crest cracking, is defined as γS > γC.
Recall that the duration TAS of abnormal state before crest cracking is indeterminate, hence TAS is treated as a random variable and is assumed to comply with exponential distribution in this study. Consequently, the probability of crest cracking can be formulated as a function of the duration of abnormal state, TAS. Once the abnormal state emerges (i.e., γS > γC), the probability of crest cracking can be estimated in terms of TAS. Moreover, the cracking time corresponding to a given cracking probability can be derived. Because there is no prior knowledge about the probability corresponding to the occurrence of crest cracking, the probabilities for estimating cracking time are selected and updated through the statistical analysis of the computed probabilities at the observed cracking times.
The parameter in the formulation of crest cracking probability is epistemic uncertain. How to estimate the probability distribution of the parameter is a dominant problem in the application of the methodology. Bayesian theory is applied to estimate and update the probability distribution of the parameter based on the observed time intervals from the emergence of abnormal state until the occurrence of crest cracking.
The procedure of the methodology is shown in Figure 5.

Figure 5.
Flowchart of the methodology for dynamic risk evaluation and early warning of crest cracking.
3.2. Computation of Crest Cracking Probability and Estimation of Cracking Time
As mentioned previously, the duration TAS of abnormal state before crest cracking is uncertain and the uncertainty in TAS can be quantitatively depicted with Probability Density Function (PDF). The exponential distribution can be used to describe the probability distribution of the time intervals of independent random events which follow Poisson distribution [20]. Thus, the exponential distribution is adopted to represent the probability distribution of the duration TAS of abnormal state before crest cracking and its PDF is as follows:
where λ is the parameter in the PDF of TAS, λ = E(TAS), i.e., λ is the expected value of the duration of abnormal state before crest cracking.
When the abnormal state of dam crest deformation (i.e., γS > γC) occurs and continues, the probability of crest cracking in a given time can be computed as:
And the cracking time corresponding to a given probability can be estimated as:
It can be seen from Equation (3) that reasonable risk assessment of dam crest cracking depends on the value of parameter λ. Owing to the lack of historical data on the duration of abnormal state before crest cracking of high earth-rockfill dams, the determination of the value of parameter λ is quite difficult, consequently there is great epistemic uncertainty in the value of λ, especially for a specific dam. The influence of this epistemic uncertainty should be considered in the risk assessment of dam crest cracking. Epistemic uncertainty can be quantified with subjective probability in the Bayesian framework. In this study, Bayesian theory is applied to estimate and update the subjective probability distribution of λ, according to observed durations of abnormal state before crest cracking.
3.3. Bayesian Estimation and Updating of Probability Distribution of λ
The epistemic uncertainty in the parameter λ originates from the lack of analyst’s knowledge and information on λ. This epistemic uncertainty could be represented quantitatively by subjective probability in the Bayesian framework. Subjective probability is a measure of the degree of belief of analysts about a proposition (such as an event, a certain value of a parameter, etc.). For the same proposition, different analysts would give different subjective probabilities, which depends on the analyst’s knowledge of the proposition. When the analysts obtain new information about the proposition, their subjective probabilities will be updated accordingly. Subjective probability is still required to obey the axioms of classical probability theory, and the algorithm of classical probability theory is applicable to subjective probability. Therefore, it is possible to formally account for the influence of epistemic uncertainty in quantitatively probabilistic risk analysis.
As mentioned earlier, since historical information regarding the parameter λ is insufficient, the epistemic uncertainty in λ cannot be ignored and is characterized quantitatively by subjective probability in this study. When information related to the parameter λ is gained, the probability distribution of λ can be estimated and updated according to Bayesian theorem as:
where is the updated probability distribution of λ given that the ith information is obtained (i.e., the posterior probability distribution of λ), is the probability distribution of λ before obtaining new information (i.e., the prior probability distribution of λ), is likelihood function (i.e., given a value of λ, the conditional probability of observing the ith information or a number proportional to the conditional probability), and Θ is the possible range of λ.
How to establish the likelihood function is the critical step in updating of the probability distribution of λ using Equation (5). In the service life of an earth-rockfill dam, one may observe two types of information directly related to λ estimation. In terms of the two types of information, likelihood functions can be constructed as follows:
(a) The first type of information: the observed time interval from the emergence of abnormal state until the ith crest cracking, and the corresponding likelihood function is expressed as:
(b) The second type of information: the observed ith duration of abnormal state without crest cracking, and the corresponding likelihood function is formulated as:
According to the type of newly observed information, substituting the corresponding likelihood function and the prior probability distribution of λ into Equation (5), the probability distribution of λ can be updated. When the probability distribution of λ is estimated for the first time, the prior probability density function of λ without any observed information, , is required. In this study, uniform distribution is utilized to formulate :
where λmin and λmax are the possible minimum and maximum of λ, respectively.
Sampling from the posterior probability distribution of λ and substituting the samples of λ into Equations (3) and (4), crest cracking probabilities and cracking times can be computed, and the desired results (such as the mean and confidence interval of the crest cracking probabilities) can be statistically derived subsequently.
4. Results and Discussion
4.1. Computation of the Crest Settlement Inclination
For illustrative purpose, the highest cross section (as shown in Figure 1) of the dam, where crest cracking had been observed for many times, is analyzed. According to the methodology proposed in Section 3, the crest settlement inclination of the dam section is computed using FEM firstly. Figure 6 shows the 2D finite element model of the dam section which consists of 2783 elements and 2686 nodes. The instantaneous deformation is calculated with Duncan and Chang’s E-B model [21], the creep deformation is simulated with the improved Merchant model [22], and the wetting deformation, during the first water impoundment of the reservoir, is estimated by a three-parameter empirical model [7]. Figure 2 shows the actual dam filling process and impoundment process of the reservoir as well as the simulated processes in FEM analysis. The dam filling process is simulated with 46 load steps. At each load step, one layer of elements is activated for subsequent computation. 218 load steps are applied to simulate the water level fluctuation in the reservoir after the end of dam filling.

Figure 6.
2D finite element model of the dam and foundation.
The in-situ monitoring data of the seepage pressure measuring point in the upstream rockfill shows that the pore pressure in the rockfill is completely consistent with the current reservoir water level due to the strong water permeability of rockfill, and there is no hysteresis. Therefore, the seepage in the rockfill can be ignored. The seepage coefficient of core wall of Pubugou Dam is 1 × 10⁻⁵ cm/s, which is far smaller than that of rockfill body (1 × 10⁻¹ cm/s). Thus, the core wall can be regarded as an impermeable structure. In this paper, the seepage process within the dam body is not considered, and the water load is applied to the upstream surface of the core wall directly. Zhou adopts the same calculation method [3]. Thus, during the water level simulation, the buoyancy in the upstream saturated rockfill shell and the hydraulic pressure acting on the upstream face of gravelly soil core are considered. In addition, the wetting deformation of the upstream rockfill shell is computed in the first reservoir impoundment.
In order to improve the accuracy of the calculated settlements, the constitutive model parameters for the finite element simulation are calibrated using the recorded deformation data at four monitoring points. These monitoring points are selected for their reliable performances and representativeness. Of the selected monitoring points, TP14, SG18 and SG25 are for measuring the external and internal settlements of the dam respectively, while CH19 is for measuring the internal horizontal displacement of the dam. The individual locations of the monitoring points are indicated in Figure 1. Response surface method (RSM) was utilized to replace the time-consuming finite element calculations of the displacements at the monitoring points [23], and particle swarm optimization (PSO) method was used to minimize the objective function and calibrate the parameters [7]. Figure 2 shows that there was a period from 20 December 2009 to 20 May 2010, during which the water level was relatively stable, and the monitoring data of this period was selected for back analysis of creep parameters by RSM-PSO method. Then, these creep model parameters can be used for the complete computation and the Duncan–Chang parameters and wetting model parameters can be calibrated in the same way. The deformation back analysis procedure is shown in Figure 7. The calibrated values of the constitutive model parameters are listed in Table 2, Table 3 and Table 4.

Figure 7.
Procedure of the back analysis for the Pubugou Dam.
Table 2.
Calibrated parameters of Duncan and Chang’s E-B model for the materials in dam and foundation.
Table 3.
Calibrated parameters of the creep deformation model for the materials in dam and foundation.
Table 4.
Calibrated parameters of the wetting deformation model for the upstream rockfills.
The deformations of the dam and foundation are calculated using FEM with the calibrated values of the constitutive model parameters. The measured and computed time series of displacements of the monitoring points TP14, SG18, SG25 and CH19 are compared in Figure 8. It can be seen that the computed displacements are in good agreement with the measured displacements, and the overall relative error between the measured and computed displacements is less than 6%. Thus, the finite element simulation is able to well predict the deformation behavior of the dam during operation. The contours of settlement and horizontal displacement of the dam, when the reservoir level first reaches the normal water level, are shown in Figure 9 and Figure 10 respectively. It is observed that the deformation of the dam is consistent with the general deformation pattern of high earth-rockfill dams. The maximum settlement of the dam is 2.20 m and the maximum upstream and downstream horizontal displacements are 0.96 m and 0.29 m respectively.
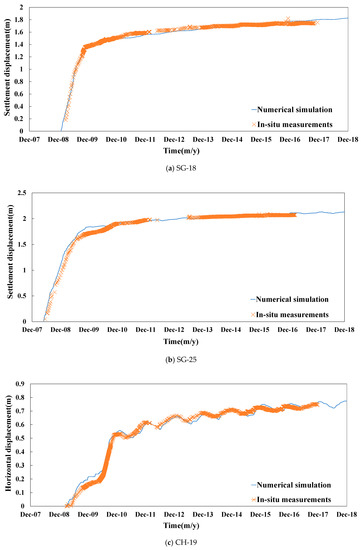

Figure 8.
The measured and computed time series of displacements of the monitoring points.

Figure 9.
The contour of settlement displacement of the dam when the reservoir level first reaches the normal water level.

Figure 10.
The contour of horizontal displacement of the dam when the reservoir level first reaches the normal water level.
The time series of crest settlement inclination around dam axis is derived from the computed crest settlements and is presented in Figure 11. It is shown that the crest settlement inclination is closely related to the reservoir level, i.e., when the reservoir level rises, the crest settlement inclination increases correspondingly, and vice versa. The maximum settlement inclination is 0.98% and occurs in the first period when the reservoir level keeps around normal water level. It is also shown in Figure 10 that crest cracking happens with higher values of settlement inclination. However, crest cracking is not associated with a specific value of settlement inclination. In addition, the time intervals from the emergence of abnormal state (i.e., γS > γC) until the occurrence of crest cracking is of obvious random nature.

Figure 11.
The time series of crest settlement inclination around dam axis.
4.2. Bayesian Estimation of Probability Distribution for λ
The duration TAS of abnormal state before crest cracking is uncertain as observed for the studied dam and is assumed to be an exponentially distributed random variable in this study. Since the parameter λ (which is the expected value of TAS) in the PDF of TAS is epistemic uncertain, the Bayesian approach described in Section 3.3 is applied to estimate the probability distribution for λ given the observed values of TAS. The values of TAS corresponding to the observed crest cracking events are provided in Table 1. Given the prior distribution of λ without any observed information and the successively observed values of TAS, the probability distribution for λ is progressively updated by recursively applying Equations (5) and (6). The prior distribution of λ without any observed information is presumed to be uniform distribution and is formulated with Equation (8) where λmin and λmax are equal to 0 d and 300 d respectively. The updated distributions of λ are shown in Figure 12 and the corresponding statistical characteristics of λ are listed in Table 5.

Figure 12.
The progressively updated distributions of λ given the observed values of TAS.
Table 5.
Statistical characteristics of parameter λ.
It is observed in Figure 12 that the posterior distributions of λ after the first, second, third and fourth crest cracking are of apparent heavy-tail features for limited observed information. Along with the accumulation of information related to the duration of abnormal state before crest cracking, the dispersion of the updated distributions of λ gradually decreases, which reflects that the cognition of λ is increasingly clear. After seven updating, the dispersion of distribution of λ has been greatly reduced, and the values of λ mainly cluster in the range between 70 d and 250 d. It can be seen in Table 5 that the standard deviation of λ declines from 72 d to 41.4 d with increasing number of observations on TAS. Therefore, the observed information and evidence can significantly diminish the uncertainty in λ, which is consistent with the principle of statistics. In addition, the mean value of λ decreases with accumulation of the observed data on TAS, as shown in Table 5.
4.3. Risk Estimation and Early Warning of the Dam Crest Cracking
In order to implement dynamic risk assessment of the dam crest cracking, after each crest cracking, the distribution of λ is updated according to the observed value of TAS first, and then the cracking probabilities, for an arbitrary duration of abnormal state, are calculated by Equation (3) using Monte-Carlo simulation with the updated distribution of λ [24]. Furthermore, the mean value, 5% and 95% quantiles of the simulated cracking probabilities can be derived. Figure 13 shows the estimated mean value and confidence interval of cracking probability based on the distribution of λ updated with the information on last crest cracking event, as well as the observed next cracking time and the corresponding computed mean value of cracking probability, where the origin of the time axis (abscissa) corresponds to the beginning of abnormal state for next cracking event. It can be seen that the cracking probability of dam crest increases with the duration of abnormal state and is gradually approaching 100%. In addition, the increment of cracking probability is larger in the initial stage than that in the later stage. It is also noticed in Figure 13 that as the uncertainty in λ diminishes with the accumulation of the observed data on the duration of abnormal state before crest cracking, the width of confidence interval of the estimated cracking probability progressively contracts. Thus, it is indicated that the increase of observed relevant information is helpful to improve the accuracy of the risk evaluation model and reduce the uncertainty in cracking risk assessment. It is worth noting that the computed mean value of cracking probability corresponding to the observed cracking time is not a fixed value and ranges from 39.96% to 58.07%.

Figure 13.
The estimated mean value and confidence interval of cracking probability based on the distribution of λ updated with the information on last crest cracking event, as well as the observed next cracking time and the corresponding computed mean value of cracking probability.
There is a requirement for early warning of crest cracking (i.e., prediction of the cracking time) in safety management of the dam. The cracking time can be estimated using Equation (4) with a given cracking probability. Therefore, the prediction accuracy of cracking time depends on the specific value of probability adopted for early warning. As mentioned above, the computed probability related to the actual cracking time is random, hence reasonable values of probability for early warning could be selected by statistical analysis of the calculated probabilities at the observed cracking times with the updated distributions of λ. Figure 14 shows the mean values and confidence intervals of the calculated probabilities at the cracking times for all the past cracking events. It should be noted that the mean value and confidence interval are statistically derived from the calculated probabilities at all the previously observed cracking times. It can be seen that the mean values and confidence intervals of the calculated probabilities essentially remain constant for the studied dam. The mean values of the probabilities at the observed cracking times are around 50% and the 5% and 95% quantiles of the probabilities are approximately 25% and 80%, respectively.

Figure 14.
The mean values and confidence intervals of the calculated probabilities at the cracking times for all the past cracking events.
For verifying the ability of the proposed methodology in early warning of crest cracking, the cracking times for the observed crest cracking events (the first crest cracking event is excluded) are estimated by Equation (4) using the mean values and the 5% and 95% quantiles of cracking probabilities in Figure 14 with the progressively updated mean value of λ (see Table 5). The estimated mean values (corresponding to the average cracking probabilities) and upper and lower limits (corresponding to the 95% and 5% quantiles of cracking probabilities) of cracking times are shown in Figure 15, where the origin of the time axis (ordinate) corresponds to the beginning of abnormal state, and are compared with the actual cracking times. It is observed that the actual cracking times are between the upper and lower limits of estimated cracking times and are mainly in proximity to the mean values of estimated cracking times. The widths of ranges of estimated cracking times are reduced as the mean value of λ decreases with accumulation of the observed data. However, due to limited observed information and the significantly random nature of the studied problem, the ranges of estimated cracking times are fairly broad. Nevertheless, for the specific dam and the observed crest cracking events, the actual cracking times are essentially located between the mean values and lower limits of estimated cracking times, with which the possible occurrence times for future crest cracking events would be predicted. In dam safety management, it is required to early warn crest cracking event, so that preparation for remediation measures can be made in advance. The early warning of crest cracking could be realized by estimating the lower limit of cracking time using the proposed methodology. Figure 16 shows the early warning times (i.e., the period between the actual cracking time and the estimated lower limit of cracking time) for the crest cracking events. It can be seen that for the specific dam, early warning of crest cracking can be issued from 20 days to 70 days ahead of the occurrence of crest cracking event.

Figure 15.
The estimated mean values and upper and lower limits of cracking times for the actual cracking events.

Figure 16.
The early warning times (i.e., the period between the actual cracking time and the estimated lower limit of cracking time) for the crest cracking events.
5. Summary and Conclusions
Crest cracking is one of the most common damage types for high earth-rockfill dams and is closely related to the deformation behavior of high earth-rockfill dams, specifically the crest settlement inclination. Dam crest is susceptible to cracking as the crest settlement inclination exceeds a certain threshold, however the dam crest does not necessarily crack immediately. Whereas, if the abnormal state (i.e., the crest settlement inclination exceeds the threshold value) is sustained for a long time, the potential of crest cracking becomes large and increases with the duration of abnormal state. Due to complex physical mechanisms and stochastic factors, the duration of abnormal state before crest cracking is uncertain and could be regarded as a random variable. Consequently, crest cracking risk can be evaluated with probabilistic approaches.
In this paper, a methodology for dynamic risk evaluation and early warning of crest cracking for high earth-rockfill dams is proposed. The key components of the methodology include: (a) The discrimination of abnormal state related to crest cracking, which is implemented by comparing the crest settlement inclination (which is computed using FEM with the calibrated constitutive model parameters based on the in-situ deformation monitoring data) with the threshold value. (b) Computation of crest cracking probability and estimation of cracking time. The exponential distribution is adopted to represent the probability distribution of the duration TAS of abnormal state before crest cracking. Then as the abnormal state of dam crest deformation occurs and continues, the crest cracking probability in a given time can be computed by integration with respect to TAS. Inversely, the cracking time (i.e., the time interval from the beginning of abnormal state until the occurrence of crest cracking) corresponding to a given probability can be estimated. (c) Determination of the values of probability adopted to early warn crest cracking, which are suggested to be selected by statistical analysis of the calculated probabilities at the observed cracking times. In this paper, the mean values and confidence intervals of the calculated probabilities are used. (d) Bayesian estimation and updating of probability distribution of the parameter λ in the PDF of TAS, which is the expected value of the duration of abnormal state before crest cracking. Since historical information regarding the parameter λ is insufficient, the epistemic uncertainty in λ is characterized quantitatively by subjective probability and Bayesian theory is applied to dynamically estimate and update the probability distribution of λ, according to observed durations of abnormal state before crest cracking.
The methodology is illustrated and verified by the risk evaluation and early warning of crest cracking for an actual earth-rockfill dam. The dam crest cracking and recracking (i.e., the sealed cracks were split again and again) events were observed during the periods of high reservoir level. The probability distribution for λ is progressively updated according to the observed values of TAS. It is observed that the dispersion of the updated distributions of λ gradually decreases with the accumulation of relevant information. The cracking probability of dam crest increases with the duration of abnormal state and the width of confidence interval of the estimated cracking probability progressively contracts with the updating of the distribution for λ. Finally, the early warning of crest cracking for the dam is investigated by estimating the lower limit of cracking time. It is shown that early warning of crest cracking can be issued from at least 20 days ahead of the occurrence of crest cracking event, which is beneficial for safety management of the dam, since preparation for remediation measures can be made in advance.
The performance of the proposed methodology is primarily dependent on the degree of randomness in the duration TAS of abnormal state before crest cracking and the amount of observed values of TAS. If the randomness in TAS is quite large and the amount of observed values of TAS is small, the performance of the methodology is expected to decline. The randomness in TAS is closely related to the structural characteristics and operation conditions (such as fluctuation in reservoir level) of rock-fill dams, thus there is not a guarantee that the proposed approach will be of good performance for other dams, especially for newly-built dams for which the amount of observed values of TAS is inadequate. Nevertheless, the presented methodology may be one of alternative tools for risk evaluation and early warning of crest cracking for earth-rockfill dams.
The future research recommendations are investigations on performances of other indications of abnormal state of crest deformation in risk evaluation of crest cracking for earth-rockfill dams and applications of other theories (such as possibility theory and the Dempster–Shafer theory of evidence) to quantify epistemic uncertainty in parameter λ.
Author Contributions
Writing—original draft: Y.W.; Software: Z.W. and J.L.; Conceptualization: Z.W.; Formal analysis: Y.W. and J.L.; Data curation: J.L. and C.Y. Resources: Y.W.; Supervision: J.C. Writing—review & editing: K.B. and C.Y. Project administration: J.C. All authors have read and agreed to the published version of the manuscript.
Funding
This research was funded by National Key R & D Program of China (No. 2018YFC0407103).
Acknowledgments
Financial support provided by the National Key R & D Program of China (No. 2018YFC0407103) is gratefully acknowledged. The authors also would like to thank the anonymous reviewers for their valuable comments and suggestions to improve the quality of the paper.
Conflicts of Interest
The authors declare no conflict of interest.
References
- Ma, H.; Chi, F. Major Technologies for Safe Construction of High Earth-Rockfill Dams. Engineering 2016, 2, 498–509. [Google Scholar] [CrossRef]
- Wu, Z.; Li, Y.; Chen, J.; Zhang, H.; Pei, L. A reliability-based approach to evaluating the stability of high rockfill dams using a nonlinear shear strength criterion. Comput. Geotech. 2013, 51, 42–49. [Google Scholar] [CrossRef]
- Zhou, X.; Chi, S.-C.; Wang, M.; Jia, Y. Study on wetting deformation characteristics of coarse granular materials and its simulation in core-wall rockfill dams. Int. J. Numer. Anal. Methods Géoméch. 2020, 44, 851–873. [Google Scholar] [CrossRef]
- Zhang, L.M.; Peng, M.; Chang, D.S.; Xu, Y. Dam Failure Contingency Risk Management; John Wiley & Sons: Singapore, 2016. [Google Scholar]
- Foster, M.; Fell, R.; Spannagle, M. The statistics of embankment dam failures and accidents. Can. Geotech. J. 2000, 37, 1000–1024. [Google Scholar] [CrossRef]
- He, K.; Fell, R.; Song, C. Transverse cracking in embankment dams resulting from cross-valley differential settlements. Eur. J. Environ. Civ. Eng. 2019, 1–27. [Google Scholar] [CrossRef]
- Jia, Y.; Xu, B.; Chi, S.; Xiang, B.; Xiao, D.; Zhou, Y. Joint back analysis of the creep deformation and wetting deformation parameters of soil used in the Guanyinyan composite dam. Comput. Geotech. 2018, 96, 167–177. [Google Scholar] [CrossRef]
- Emadali, L.; Motagh, M.; Haghighi, M.H. Characterizing post-construction settlement of the Masjed-Soleyman embankment dam, Southwest Iran, using TerraSAR-X SpotLight radar imagery. Eng. Struct. 2017, 143, 261–273. [Google Scholar] [CrossRef]
- Handy, R.L.; Lustig, M. Tension Cracks in a Compacted Clay Embankment. J. Geotech. Geoenvironmental Eng. 2017, 143, 06017006. [Google Scholar] [CrossRef]
- Zhou, W.; Li, S.-L.; Ma, G.; Chang, X.-L.; Cheng, Y.-G.; Ma, X. Assessment of the crest cracks of the Pubugou rockfill dam based on parameters back analysis. Géoméch. Eng. 2016, 11, 571–585. [Google Scholar] [CrossRef]
- Behnia, D.; Ahangari, K.; Goshtasbi, K.; Moeinossadat, S.R.; Behnia, M. Settlement modeling in central core rockfill dams by new approaches. Int. J. Min. Sci. Technol. 2016, 26, 703–710. [Google Scholar] [CrossRef]
- Lees, A.; Macdonald, G.; Sheerman-Chase, A.; Schmidt, F. Seasonal slope movements in an old clay fill embankment dam. Can. Geotech. J. 2013, 50, 503–520. [Google Scholar] [CrossRef]
- Osuji, S.; Anyata, B. Susceptibility of Clay Core to Cracks in Rockfill Dams by Finite Element Modeling. Adv. Mater. Res. 2007, 18, 35–41. [Google Scholar] [CrossRef]
- Song, C.R.; Yeoh, Y.H. Assessment of Dam Body Safety from Field Monitoring Results. Geo Jordan 2004 2004, 1, 86–93. [Google Scholar] [CrossRef]
- Eslami, A.; Ghorbani, A.; Shahraini, S.V. Health monitoring and dynamic analysis of an earth-fill dam at the stage of first impounding: Case study—Siahoo dam of Iran. J. Civ. Struct. Heal. Monit. 2020, 10, 425–442. [Google Scholar] [CrossRef]
- Rashidi, M.; Haeri, S.M. Evaluation of behaviors of earth and rockfill dams during construction and initial impounding using instrumentation data and numerical modeling. J. Rock Mech. Geotech. Eng. 2017, 9, 709–725. [Google Scholar] [CrossRef]
- Gikas, V.; Sakellariou, M. Settlement analysis of the Mornos earth dam (Greece): Evidence from numerical modeling and geodetic monitoring. Eng. Struct. 2008, 30, 3074–3081. [Google Scholar] [CrossRef]
- Yu, Y.; Zhang, B.; Yuan, H.-N. An intelligent displacement back-analysis method for earth-rockfill dams. Comput. Geotech. 2007, 34, 423–434. [Google Scholar] [CrossRef]
- Siu, N.O.; Kelly, D.L. Bayesian parameter estimation in probabilistic risk assessment. Reliab. Eng. Syst. Saf. 1998, 62, 89–116. [Google Scholar] [CrossRef]
- Morris, H.D.; Mark, J.S. Probability and Statistics, 4th ed.; Pearson Press: New York, NY, USA, 2011. [Google Scholar]
- Dong, W.; Hu, L.-M.; Yu, Y.Z.; Lv, H. Comparison between Duncan and Chang’s EB Model and the Generalized Plasticity Model in the Analysis of a High Earth-Rockfill Dam. J. Appl. Math. 2013, 2013, 1–12. [Google Scholar] [CrossRef]
- Li, G.Y.; Mi, Z.K.; Fu, H.; Fang, W.F. Experimental studies on rheological behavior for rockfill in concrete faced rock fill dam. Rock Soil Mech. 2004, 25, 1712–1716. (In Chinese) [Google Scholar]
- Xuefeng, F.; Wu, Z.; Lijun, L.; Wen, Y.; Yu, S.; Zepeng, Z.; Li, Z. Analysis of Sluice Foundation Seepage Using Monitoring Data and Numerical Simulation. Adv. Civ. Eng. 2019, 2019, 2850916. [Google Scholar] [CrossRef]
- Wu, Z.; Chen, C.; Lu, X.; Pei, L.; Zhang, L. Discussion on the allowable safety factor of slope stability for high rockfill dams in China. Eng. Geol. 2020, 272, 105666. [Google Scholar] [CrossRef]


Publisher’s Note: MDPI stays neutral with regard to jurisdictional claims in published maps and institutional affiliations. |
© 2020 by the authors. Licensee MDPI, Basel, Switzerland. This article is an open access article distributed under the terms and conditions of the Creative Commons Attribution (CC BY) license (http://creativecommons.org/licenses/by/4.0/).