Article

Effect of Solid Particles on Droplet Size Applying the Time-Shift Method for Spray Investigation

1
Institute for Technical Chemistry, 76344 Eggenstein-Leopoldshafen, Germany
2
Engler-Bunte-Institute, 76131 Karlsruhe, Germany
*
Author to whom correspondence should be addressed.
Appl. Sci. 2020, 10(21), 7615; https://doi.org/10.3390/app10217615
Submission received: 6 October 2020 / Revised: 21 October 2020 / Accepted: 22 October 2020 / Published: 28 October 2020
(This article belongs to the Section Mechanical Engineering)

Abstract

:
This study investigated the influence of solid particles on primary breakup and resulting droplet size for different process parameters. Two sets of Newtonian fluids (each consisting of one pure liquid and one suspension at the same respective viscosity) were used, for isolated investigation of solid particles on spray formation independent of liquid viscosity. The spray was recorded by a high-speed camera and a SpraySpy® system based on the time-shift effect, while a commonly used Spraytec® laser diffraction analyzer was employed for validation. An external-mixing twin-fluid atomizer was operated at different gas velocities and corresponding GLR at constant liquid mass flow. For the investigated suspensions an increased Sauter mean diameter was detected, compared to the pure liquids with identical dynamic viscosity. This effect was explained by the tensile strength stabilizing the suspension droplets.

Graphical Abstract

1. Introduction

Although spray processes are often applied in industrial production, the influence of process conditions and liquid properties on atomization is not yet fully understood. In particular, knowledge remains limited on the twin-fluid atomization of suspensions with different viscosities and solid mass fractions, as commonly used in the food industry (e.g., in spray drying), gas cleaning or in entrained flow gasifiers (EFG). In an EFG, oxygen serves as the gasification and atomization agent, leading to Gas-to-Liquid Ratios G L R < 1 . This limitation necessitates precise understanding of the mechanisms behind the primary breakup of the suspension jet and the resulting droplet size. Investigations of droplet size distributions in suspension sprays have typically used the laser diffraction technique due to the opacity of the emerging droplets [1,2,3]. Applying this measuring technique results in an integral droplet diameter that represents the spray quality in the measuring plane. Additionally, suspensions mostly exhibit non-Newtonian behavior, wide particle size distributions and varying solid mass fractions [4,5]. As a result, a targeted analysis of the influence of solid particles on spray formation that excludes liquid viscosity has not been possible thus far, which this study aims to redress.
This article aims to make an isolated investigation of solid particles on spray formation independent of fluid viscosity. The work is based on the local measurement of droplet size distributions in opaque suspension sprays. Therefore, Newtonian suspensions with varying particle mass fractions and pure liquids with identical viscosities are used. Spatially resolved droplet size distribution measurements are performed by means of the time-shift technique and compared to state-of-the-art laser diffraction measurements.

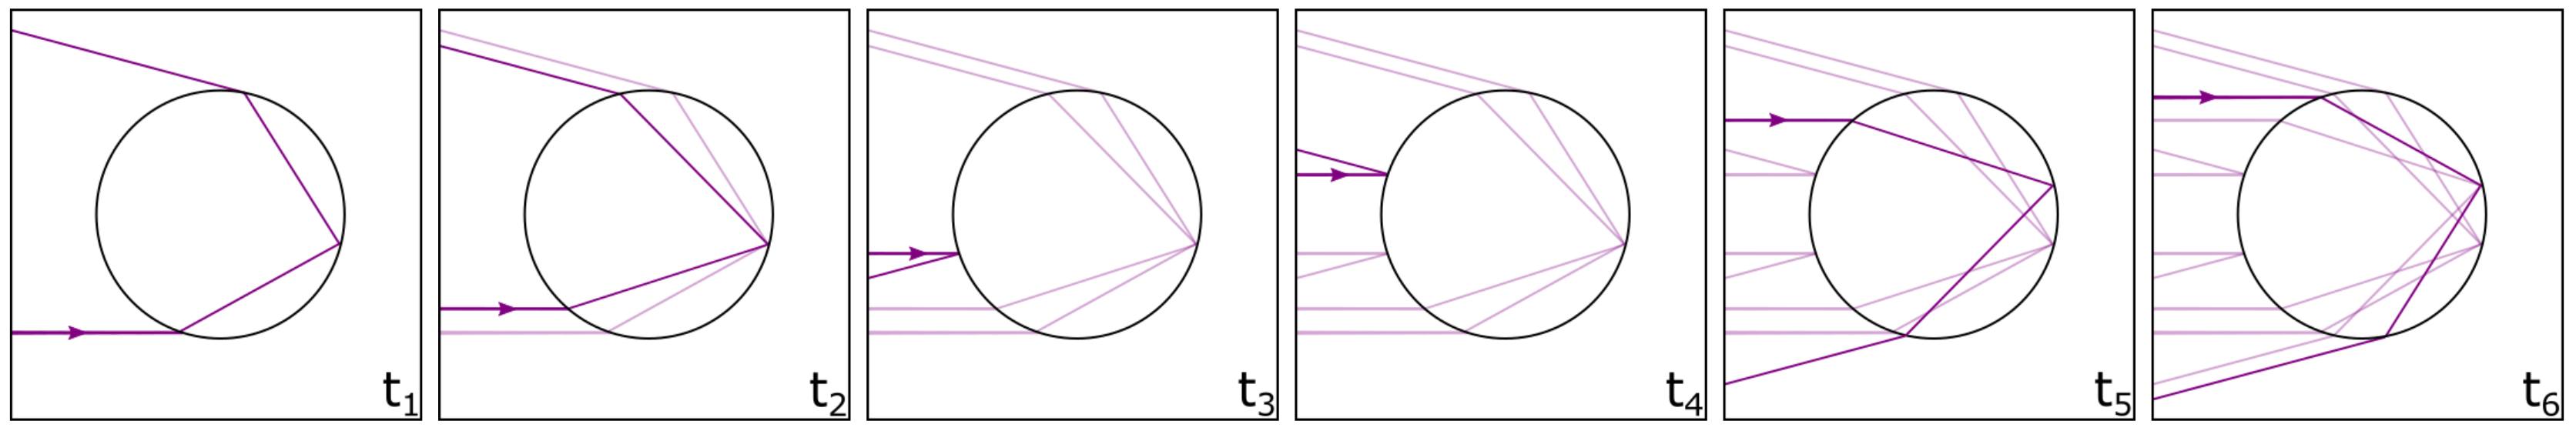
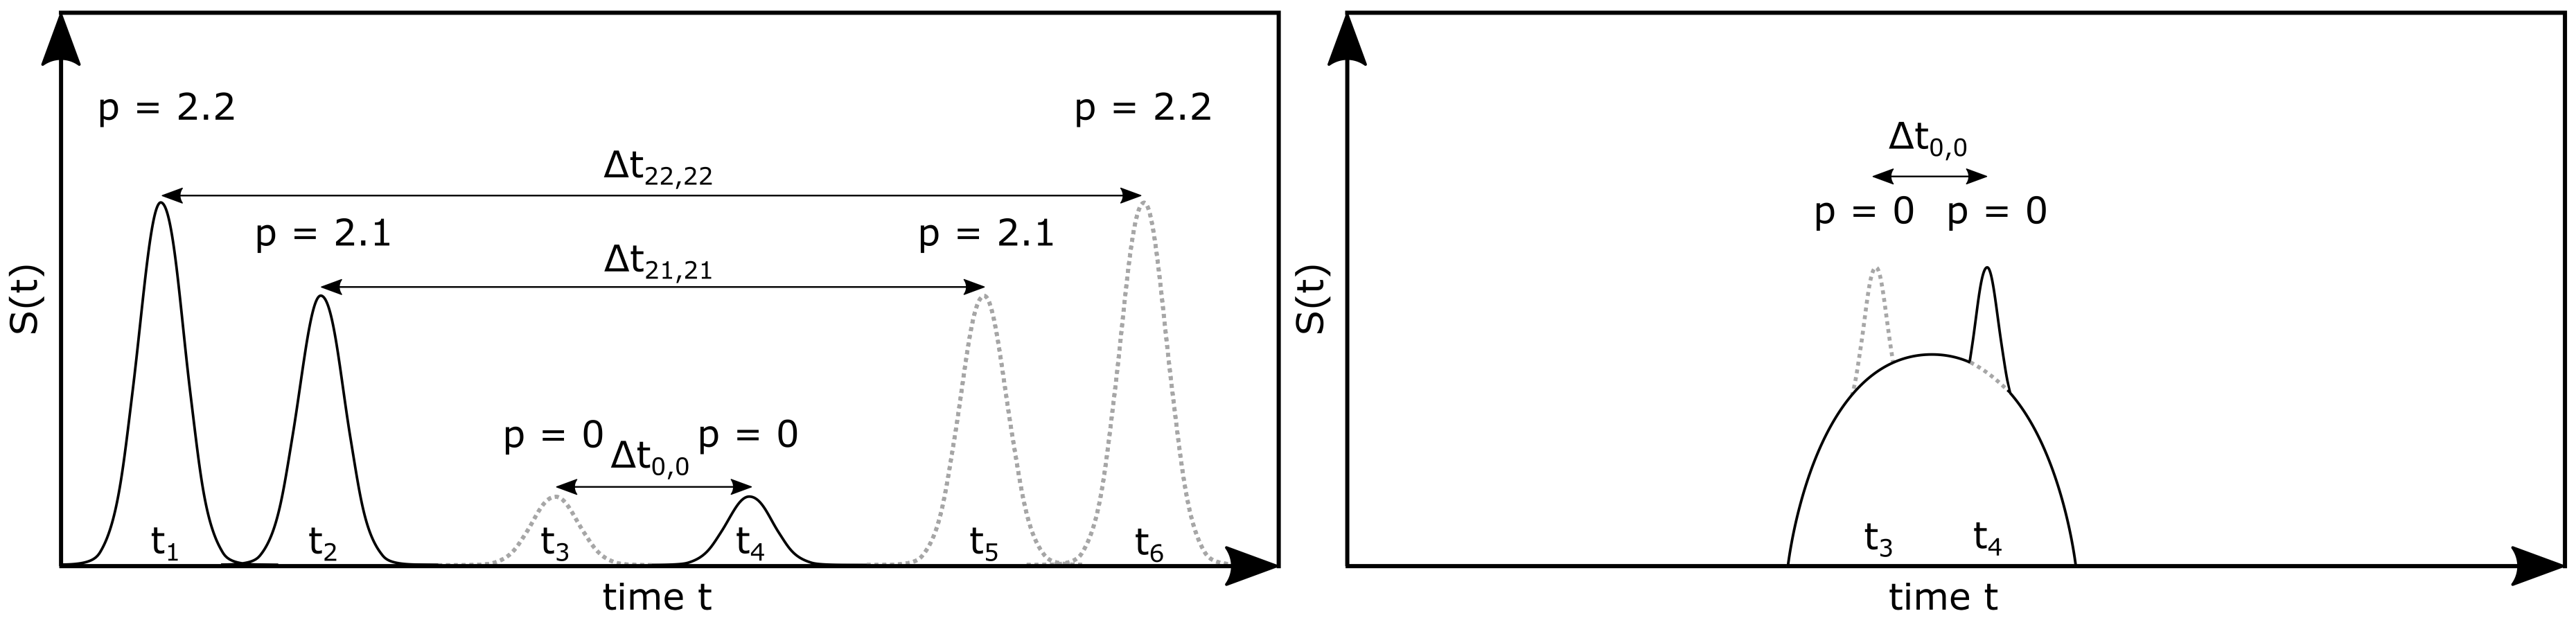
2. Theoretical Background

Various theoretical and experimental investigations have addressed the atomization of low viscosity liquids by using external-mixing twin-fluid atomizers under atmospheric system pressure [6,7,8]. Hede et al. [9] provide an overview that compares different twin-fluid nozzle concepts. Faragò and Chigier [10] used a high-speed camera and twin-fluid nozzles to investigate the primary breakup of a water jet. R e l i q and W e a e r o , in Equations (1) and (2), describe the process conditions with a regime classification for liquid breakup morphology through different nozzle geometries:
R e l i q = D l i q · v l i q · ρ l i q η l i q
W e a e r o = v g a s v l i q 2 · ρ l i q · D l i q σ
with the liquid jet diameter ( D l i q ), velocity (v), density ( ρ ), dynamic viscosity ( η l i q ) and surface tension ( σ ) as relevant process parameters. The g a s and l i q subscripts denote the gas and liquid phases, respectively. A classification was introduced that includes a Rayleigh type, membrane type, and fiber type breakup with two sub-modes, namely pulsating and superpulsating [10]. When W e a e r o < 25 , the primary atomization is characterized by the so-called Rayleigh-type regime in which the liquid jet disintegrates into large droplets close to the centerline of the spray. When W e a e r o increases up to 70, the membrane-type breakup is reached, and gas-filled membranes near the nozzle orifice can be detected. These membranes finally rupture into tiny droplets at the thinnest sheet structure, whereas the liquid accumulated in the rims disintegrates due to Rayleigh-Plateau instabilities. For W e a e r o > 100 , the fiber-type regime leads to a complete disintegration of the liquid jet into fibers close to the nozzle orifice. These ligaments then typically disintegrate into small droplets in accordance to the Rayleigh-Plateau instability [10]. The fiber-type regime is divided into the pulsating and superpulsating sub-modes, the latter of which is characterized by a fluctuation in the number density of droplets in the spray. Lasheras and Hopfinger [11] included the effect of the dynamic pressure ratio (momentum flux ratio) of the gas and liquid phases j, as given in Equation (3), for the characterization of the fiber-type breakup:
j = j g a s j l i q = v g a s 2 · ρ g a s v l i q 2 · ρ l i q
Lasheras and Hopfinger [11] held the nozzle geometry and gas density constant in their study, with the result that the primary breakup length and spray angle were solely assigned to the momentum flux ratio and were only affected by the gas phase velocity.
To consider the effect of liquid viscosity on the resulting primary breakup, the Ohnesorge number O h , Equation (4), is typically applied:
O h = η l i q σ · ρ l i q · D l i q
The Ohnesorge number describes the relation between viscous forces and the square root of the inertia and surface tension forces.
Numerous studies have investigated the effect of increased viscosity on spray characteristics. Wachter et al. [12] provide an overview of the most relevant papers that investigated liquid viscosities of η l i q > 50 mPa·s. Typically, an increase in the droplet size is detected in conjunction with increasing dynamic viscosity. Li et al. [13] investigated a wide viscosity range of η l i q = 1 805 mPa·s. Furthermore, as the viscosity increases, an increase in the primary breakup length is detected, as well as a pronounced membrane-type breakup over a wide range of W e a e r o [14]. It should be noted that these dependencies only refer to Newtonian liquids, whereas suspensions in industrial contexts often reveal non-Newtonian flow behavior. Most of the suspensions investigated show the effect of shear-thinning ( η l i q = f γ ˙ ) due to the presence of aspherical particles and chain-like polymers that align in the shear direction [15]. This effect causes the viscosity to decrease as the shear rate increases. Due to the fact that the shear rate varies significantly within the spray cone as well as during the atomization process itself, a description of the disintegration process of non-Newtonian media is highly complex. Typically, these liquids are characterized, respectively, by zero viscosity η l i q , 0 = η l i q , γ ˙ = 0 s 1 or viscosity at an infinite shear rate η l i q , = η l i q , γ ˙ , whereas neither condition is a precise description of the shear rate that is relevant during the atomization process. Mansour and Chigier [16] therefore investigated the atomization of xanthan gum and polyacrylamide using a Phase Doppler anemometer, noting a droplet size correlation, including an O h number, with shear dependent dynamic viscosity. Mansour and Chigier [16] calculated the shear stress limit as being γ ˙ m a x = 20 , 000 s 1 , by applying different liquids and nozzle configurations. Other authors have determined the maximum shear rate that occurs during atomization as follows: Aliseda et al. [17] ( γ ˙ m a x = 225 s 1 ), Gillberg et al. [18] ( γ ˙ m a x = 450 s 1 ), Ghezelchi et al. [19] ( γ ˙ m a x = 500 s 1 ) and Zhao et al. [20] ( γ ˙ m a x = 4.3 7.8 s 1 ). In addition to the description with fixed shear rates, Sänger et al. [14] propounded an approach relating to the measurement of the Kelvin-Helmholtz instability frequency of f K H = f γ ˙ in order to gain information on the effective viscosity relevant for the primary breakup. As previously noted, many different approaches for the description of non-Newtonian behavior in atomization processes have been proposed. However, the inconsistency of the chosen shear rate means that the results are typically not applicable to various media and operating conditions.
The following section provides an overview of relevant literature on the measurement of suspension sprays. Smith et al. [3] presented a detailed comparison of investigations of the atomization of suspensions using external-mixing twin-fluid atomizers. Typically gas velocity and G L R were varied, applying coal water slurries (CWS) featuring various shear-dependent viscosities due to particle loading, particle size distribution and stabilizing additives. Earlier investigations with pure liquids indicate that increasing the G L R and v g a s always leads to a decrease in the droplet size, whereas an increase in M ˙ l i q results in an increase in droplet size. A detailed interpretation of the influence of particles on spray formation is not given. Smith et al. [3] employed a plain-jet airblast nozzle at G L R = 0.5 5 and v g a s = 60 100 m·s 1 . Four slurries with significantly different η l i q , 0 were atomized and characterized by means of laser diffraction measurements. The authors postulate that for the complete atomization of the bulk phase of CWS, G L R 5 is a necessary condition. Cronin et al. [21] conducted spray experiments using two CWSs with different particle loadings ( ϕ P = 60 and 70 wt-%) and three fuel film thicknesses applying plain-jet atomizers at G L R = 1 5 and v g a s = 60 80 m·s 1 . Again, laser diffraction was used to investigate the resulting drop sizes. These investigations revealed that the slurry with higher particle loading - despite showing higher viscosity values - disintegrated into smaller droplets under the same atomization conditions, which was explained by the shear rate dependency of the dynamic viscosity. Additionally, as the fuel film thickness increased, the droplet size also increased significantly. Continuing this series of experiments in a later study, Smith et al. [22] present a correlation for the integral Sauter mean diameter ( I d 32 ) calculation, depending beside the previously used operating conditions also on the parameters of the power law expression for the inclusion of non-Newtonian flow behavior of CWS. In addition to laser diffraction, a patternator for radial mass flux measurement was used and detected a reduction in the spray cone angle in conjunction with a decrease in the G L R . In 2001, Mulhem et al. [23] started a systematic investigation of model suspensions using a laser diffraction system for droplet size measurement and a high-speed camera for the detection of primary breakup. The researchers employed a gas-assisted nozzle with a central liquid jet surrounded by an angled concentric annular gap for the gas phase. The non-Newtonian suspensions consisted of water and buoyant polymer particles with undefined shapes, D P = 10 , 30 , 50 , 100 μ m and ϕ P = 10 50 w t - % . For decreasing γ ˙ and D P , as well as increasing ϕ P , an increase in the η l i q was detected. A droplet size measurement at z = 500 mm downstream of the nozzle orifice yielded a bimodal droplet size distribution for D P > 50 μ m and a monomodal droplet size distribution for D P < 50 μ m . For the bimodal distribution (also called the solid-liquid separation), a liquid peak was observed, which is shifted towards smaller droplet diameters with increased gas velocity, whereas the solid peak remained constant and represented the original particle size.
In contrast to pure liquids, suspensions have phase boundaries in which solid particles and the liquid phase interact with each other. A capillary force description is used [23], postulating that the disintegration of suspension droplets must overcome the force of surface tension, as well as the capillary force of liquid bridges holding the solid particle agglomerates together. This effect is more pronounced for constant mass fractions and decreasing particle sizes due to the higher number density (and therefore particle surfaces) in the suspension. In a subsequent study, Mulhem et al. [24] performed additional experiments with spherical glass particles at D P < 50 μ m and water, glycerol/water and carboxymethyl cellulose/water. The increase in droplet size for the suspension versus the pure continuous phase was explained by the agglomerate strength, assuming W e c r i t = 1.18 for the secondary atomization of pure liquids, according to Hinze et al. [25], which resulted in a disintegration diagram. To estimate the critical breakup conditions of suspension droplets, the tensile strength for the pendular state is balanced by the aerodynamic pressure of the gas phase (see Equation (5), below, and Mulhem et al. [26,27]). This estimation can be applied to high solid mass fractions in suspension droplets.
9 4 · ρ s u s ρ P 1 ρ s u s ρ P · σ D P = ρ g a s · v g a s 2 2
Here, the index s u s represents the suspension. In a further publication, Mulhem et al. [26] presented the atomization of a non-Newtonian kaolin/water suspension. To summarize this work, the critical particle size for the occurrence of a solid-liquid separation was set to d 32 D P and a correlation for the determination of the droplet size was presented with the following dependencies:
I d 32 = f D l i q , O h , 1 W e a e r o , 1 G L R
In 2012, Zhao et al. [20] presented a morphological classification of the primary atomization of a CWS jet, expanding the earlier investigations of Mulhem et al. [26] in this area. Eight slurries with varying particle size distributions and three different added stabilizers were applied. Two external-mixing twin-fluid atomizers with central liquid jet and a concentric annular gap for the fast gas stream were used. The regimes were classified as either Rayleigh-type, fiber-type or atomization (which corresponds to the fiber-type supersulsating sub-mode) in the parametric space of W e a e r o and O h . Due to the particle loading, membrane formation was significantly reduced, although the viscosity of the suspension was increased, which typically leads to an increase in membrane formation for pure liquids. Additionally, Zhao et al. [28] determined a dimensionless correlation for the breakup length in accordance with the Kelvin-Helmholtz—Rayleigh-Taylor hybrid model. Periodic structures as shear waves for low η l i q and high v l i q , as well as jet oscillation for low v l i q and high η l i q were identified, leading to a significant change in the spray angle. In 2016, Jampolski et al. [29] presented the stabilizing effect of capillary suspensions by adding small amounts of octanol to a beechwood coke slurry, leading to a significant increase in η l i q , 0 and enhanced storage stability. Applying these capillary suspensions for atomization to an external-mixing twin-fluid nozzle, the increased octanol fraction led to a decrease in the spray angle, droplet size and a change in the primary instability. This effect was attributed to a decrease in the surface tension, with increasing octanol content.
To conclude the literature review, previous studies provide a wide overview of suspension atomization processes. In particular, the early investigations of model suspensions by Mulhem et al. [24] lead to a major insight into the disintegration process. Furthermore, the studies presented here emphasize the importance of isolating the influence of spray parameters, as well as fluid properties. This knowledge can be deepened through the application of new image evaluation methods [30] and measurement techniques [31], such as the measurement of local droplet sizes instead of integral measurement, as commonly performed by means of laser diffraction.
Thus, this work investigates the influence of solid particles on spray formation and the resulting local droplet size distributions for constant dynamic viscosity. Primary breakup was detected by a high-speed camera, whereas the local drop size was analyzed with a SpraySpy® system, which allows for the measurement of local drop size distributions in opaque suspension sprays and is based on the time-shift method. Finally, a conventional laser diffraction-based measurement system was used to confirm and validate the measured tendencies. Ethylene glycol ( η l i q = 21 mPa·s) and a glycerol/water-mixture ( η l i q = 70 mPa·s) were used as pure liquids. The suspensions were composed of mixtures of ethylene glycol and spherical glass particles with size fractions of D p = 40 70 μ m . Solid mass fractions of ϕ P = 30 w t - % and ϕ P = 50 w t - % were used for the suspensions, resulting in η l i q = 25 mPa·s and η l i q = 70 mPa·s, respectively. This setup allows for separation of the influence of particles on spray formation independent of the fluid viscosity.

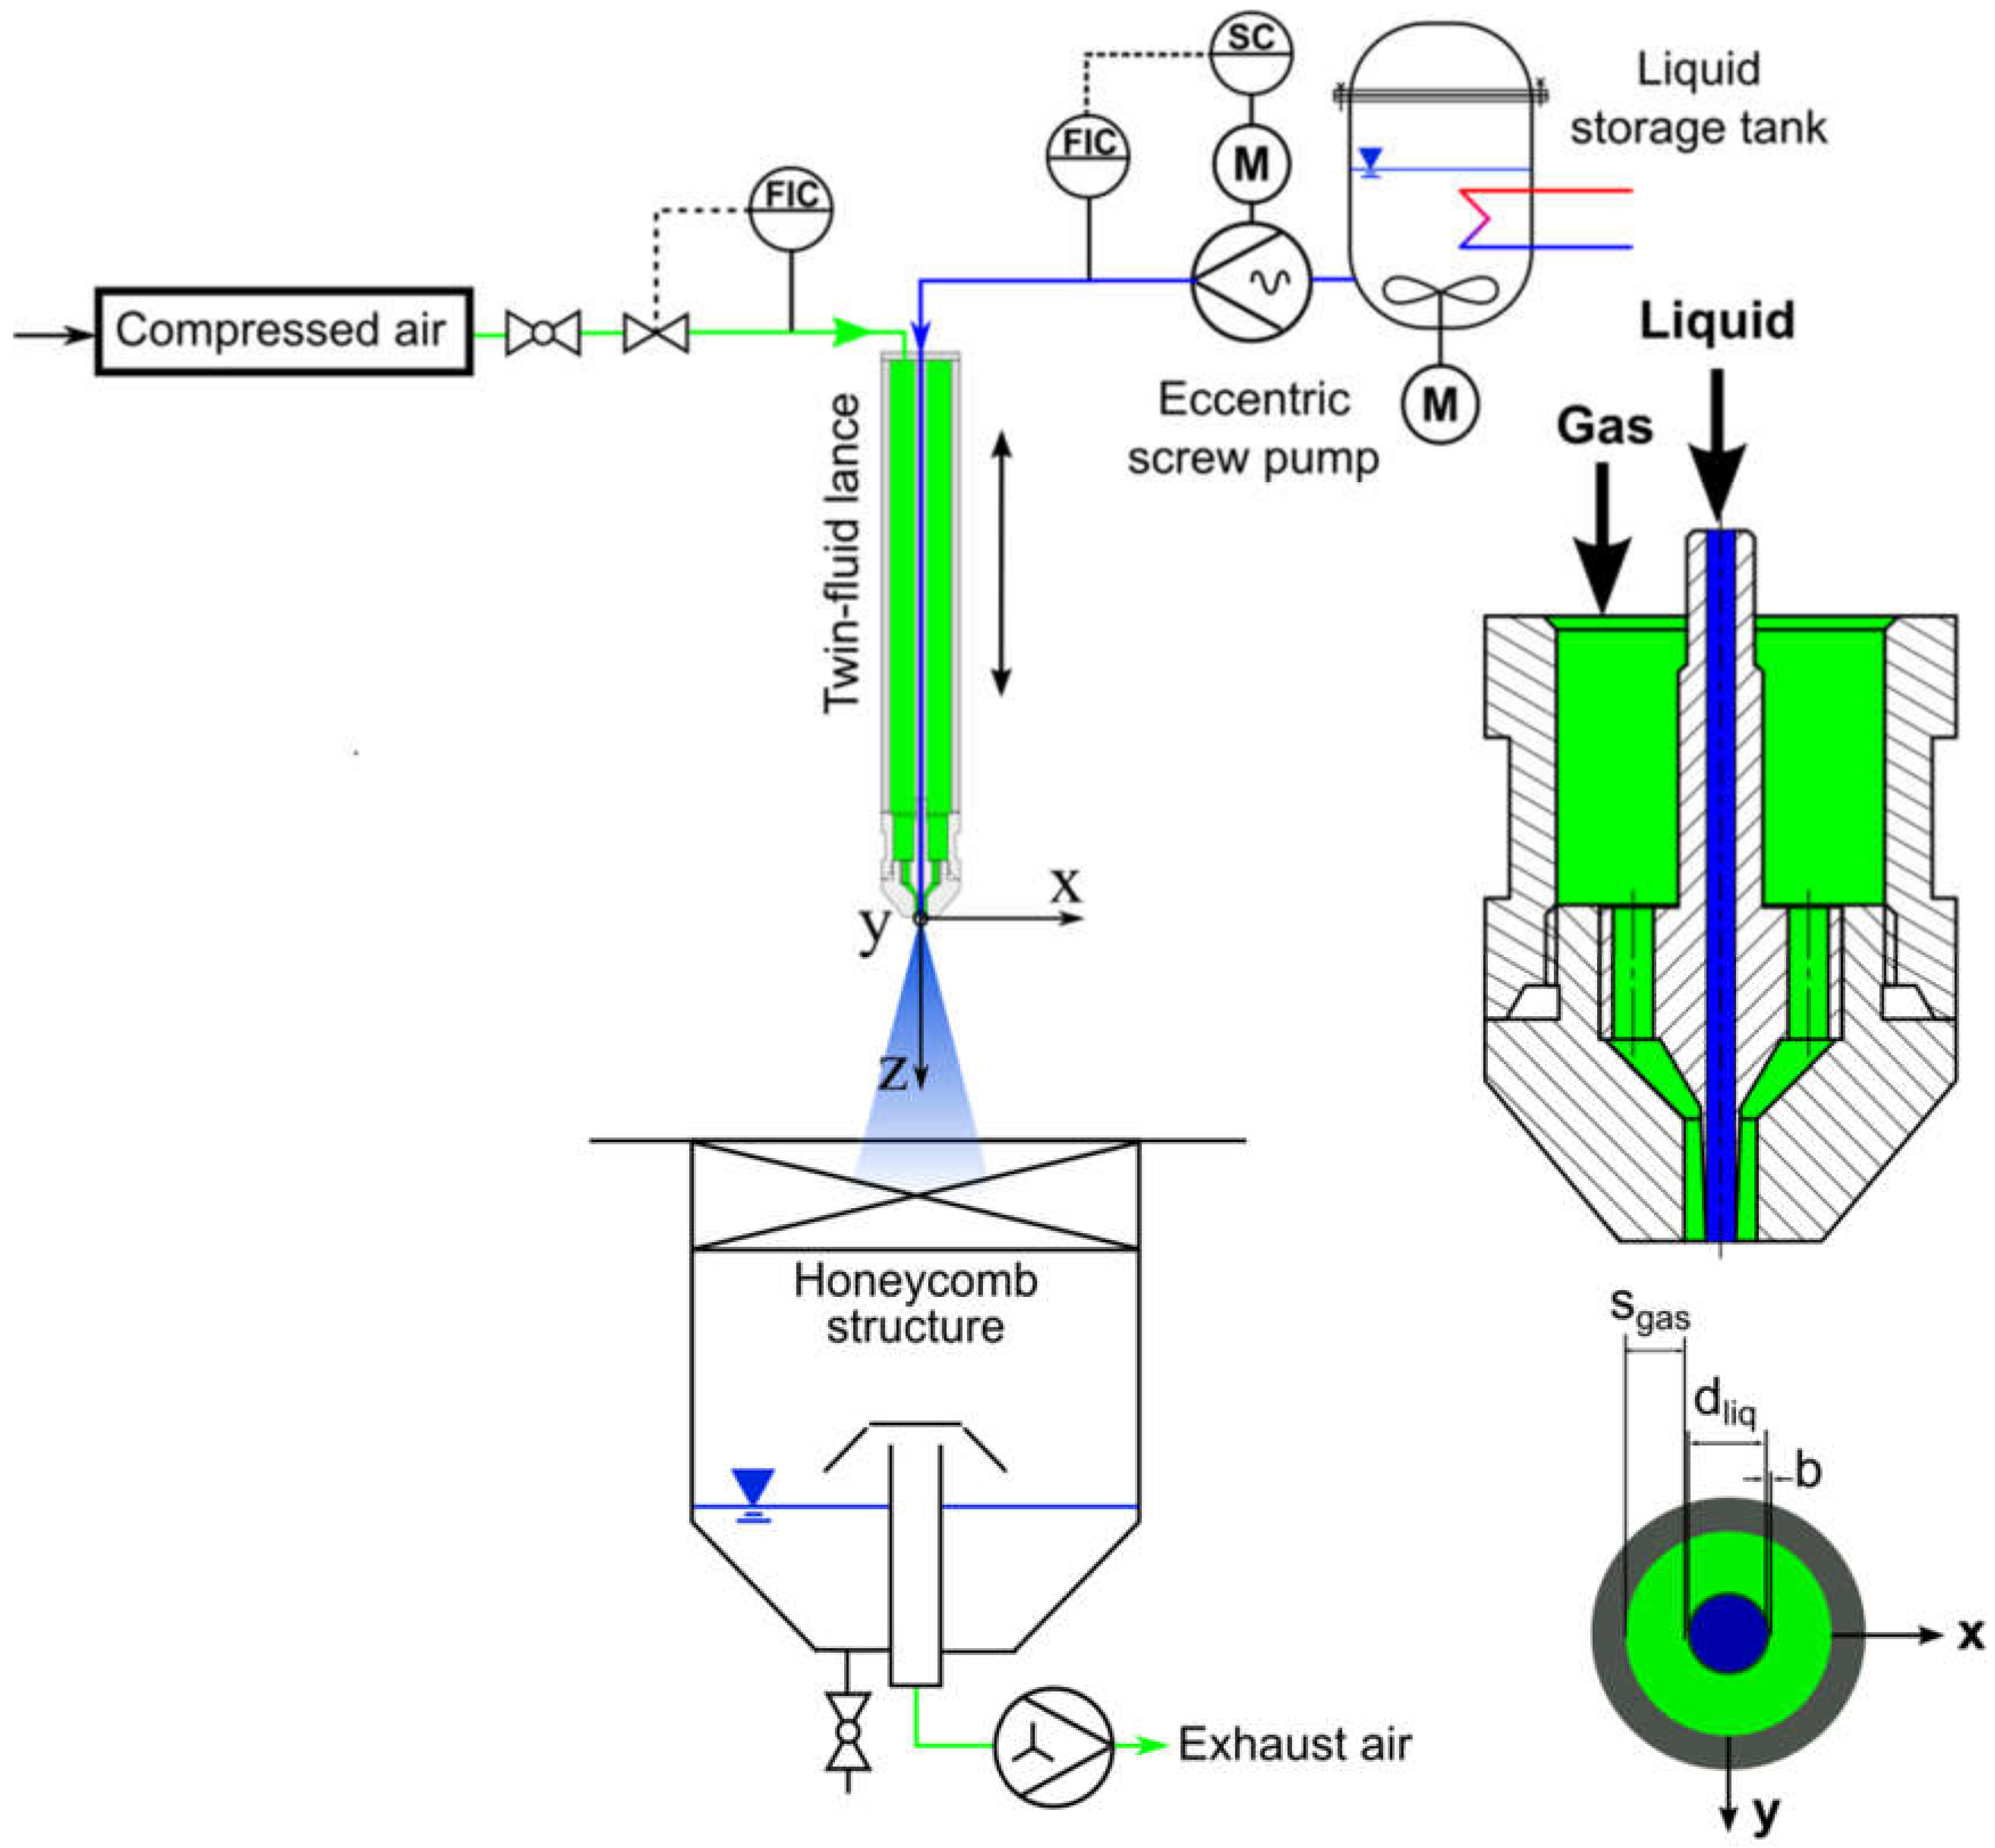
3. Experimental Setup and Measurement Techniques

The investigations were conducted using the ATMOspheric spray test rig (ATMO), described in detail in Sänger et al. [14] and shown in Figure 1. For spray characterization, a time-shift and a laser diffraction system, as well as a high-speed camera, were used. A twin-fluid lance was supplied by liquid or suspension fluids through an eccentric screw pump (mass flow range: M ˙ s u s = 5 40 kg·h 1 ) controlled with a Coriolis mass flow and density meter. A stirred liquid storage tank was used to avoid sedimentation. A hot wire anemometer with a valve controlled the atomizing air mass flow in the range of: M ˙ g a s = 1 20 kg·h 1 . To prevent the recirculation of small droplets through the suction of the exhaust air, a honeycomb structure was placed at the inlet of the collection tank to serve as flow straightener. The twin-fluid atomizer has a central tube with d l i q = 2 mm and a surrounding gas slit of s g a s = 2.88 mm. The influence of the tube separating the gas and liquid at the nozzle orifice was minimized by reducing the wall thickness to b = 0.1 mm. According to Tian et al. [32], this configuration results in an undisturbed gas flow at the exit of the nozzle. The nozzle has parallel flow channels to enable the comparability of the experimental results with other investigations, for example those of Faragò and Chigier [10] and Zhao et al. [20].
For the characterization of the applied liquid and suspension fluids in terms of flow behavior and media properties, the following systems were used: The liquid viscosity was quantified by a Physica MCR 101 rheometer [33] equipped with a Searle-type measuring system [34]. The surface tension of the liquids was measured with an EasyDyne tensiometer [35] that employed the Du Noüy ring method [36]. The liquid surface tension was determined in accordance with the approach of Son and Kihm [37]. The density was measured using the weighing method. The complex refractive index n = n r e a l + i A was measured with an Abbe-refractometer for n r e a l and with visible spectroscopy for the attenuation A.
A high-speed camera was applied for the investigation of the primary breakup close to the nozzle orifice. This device was able to produce images at a frame rate of f = 3600 Hz at a resolution of 1 megapixel and up to f = 500 kHz at reduced resolution of 128 × 16 pixels. The images were captured by applying backlight illumination of the region of interest with a special lighting setup. An array of 9 high-power light-emitting diodes (LED) with a total luminous flux of 9 × 4500 lm was used. The position of each individual LED within the array was optimized for best light spread. Due to the high intensity and homogeneous distribution of the light, very short exposure times ( t e x p 7 μ s ) could be used. This light setup enabled a sharp representation of the droplets, even in case of fast flow conditions [38].
For the local measurement of droplet size and velocity, a so-called SpraySpy® from AOM-Systems was mounted on a 2-D traverse system at z = 150 mm downstream from the nozzle orifice. This measuring position was chosen for two reasons: (i) the secondary breakup is completed at even higher viscosities than those of the investigated liquids, as seen in previous experiments at η l i q = 200 mPa·s [14]; (ii) the droplets are spherical, as revealed by high-speed camera images and which is also necessary for applicability of the SpraySpy® system. Damaschke et al. [39] described the effect of non-spherical droplets on size measurement using the time-shift technique. The measurement system uses the time of flight method for calculation of droplet velocity and the time-shift method for detection of local droplet diameter [40]. The system was operated in backscatter mode with a working distance of Δ x = 250 mm. Two laser beams from laser diodes with wavelengths of λ L 1 = 405 nm and λ L 2 = 450 nm each with a constant laser power of about 5 mW, a beam distance of Δ s , as well as four detectors in fixed angle of ϑ S = 165 to the measuring plane are mounted, see Figure 2.
As a result of the passage of a transparent droplet through the measurement volumes of laser L1 and laser L2, each of the two detector pairs (D1 & D2 as well as D3 & D4) received the typical measurement signal consisting of different scattering orders at several time steps. According to Figure 3, at t 1 and t 6 , second order refraction in the second mode occurs, whereas for t 2 and t 5 , the first mode is detected. When the laser beam is located close to the horizontal axis of the droplet ( t 3 & t 4 ), the reflection at the droplet surface is recorded [40]. When performing the same measurement with an opaque droplet, the scattered light can solely be described by the time steps t 3 and t 4 . For the reason the droplet’s opacity, the refraction cannot be observed due to the scattering of light at the particles within the droplet. As two laser beams were used, the measurement signals shown in Figure 4 were acquired twice.
Figure 4 (left) illustrates the signal scattered from a transparent droplet at ϑ S = 165 as peaks over time for one laser beam and two detectors. The different time-shift periods can be detected between the signals p = 2.2 (second order, second mode refractions) as Δ t 22 , 22 , p = 2.1 (second order, first mode refractions) as Δ t 21 , 21 and p = 0 (reflections) as Δ t 0 , 0 . When applying an opaque suspension droplet, the detected signal in ϑ S = 165 can be illustrated as shown in Figure 4 (right). Here, the region of scattered light around the signal peak of the reflection for the respective detector can be attributed to the scattering of the particles within the droplet. The time-shift periods are then reduced to Δ t 0 , 0 for p = 0. Through a comparison of different redundant time-shift period ratios, a validation can be performed, as described in further detail by Schäfer et al. [40]. Further experiments and simulations concerning the time-shift signal of colloidal suspensions can be found in Li et al. [41].
With the SpraySpy® system, a transparent and an opaque measuring mode can be chosen for a maximum droplet diameter of d m a x = 1000 μ m . Furthermore, the time-shift constant is needed for transparent mode, which is a function of the refractive index. Three different sensitivity levels can be set; increased sensitivity leads to higher data rate but lower signal validation and vice versa. In the following experiments, the sensitivity was always set to the optimal level between signal validation and data rate. Depending on the applied fluid, the associated opacity mode was used.
For the integral droplet size measurement, the Spraytec® STP5342 [42] was used; a state-of-the-art laser diffraction system (LDS) with a Fourier lens with focal length of f L D S = 750 mm, a He-Ne laser with a diameter of d L D S = 10 mm and a wavelength of λ L D S = 632.8 nm. The setup allows for the detection of droplets in a size range between 1 μ m and 2000 μ m . For all measurements multiple light scattering correction algorithm was not applied, due to the high transmission values detected across all of the operating conditions [43]. The system was operated with a Lorenz-Mie analyzer and installed at the same axial distance to the nozzle as the SpraySpy®. Laser diffraction is typically applied in the literature [1,2,3] for liquid and suspension sprays and thus used for validation of the tendencies measured with the SpraySpy® system.

4. Results and Discussion

The following chapter starts with the rheological characterization and the presentation of all relevant liquid and suspension properties. Then, the results of the spray characterization are presented and discussed with reference to the radial profiles of the Sauter mean diameter, as well as the high-speed camera images. Finally, the comparison of the local d 32 values revealed by the time shift-based system and the integral d 32 values revealed by state-of-the-art laser diffraction measurement technique is presented.

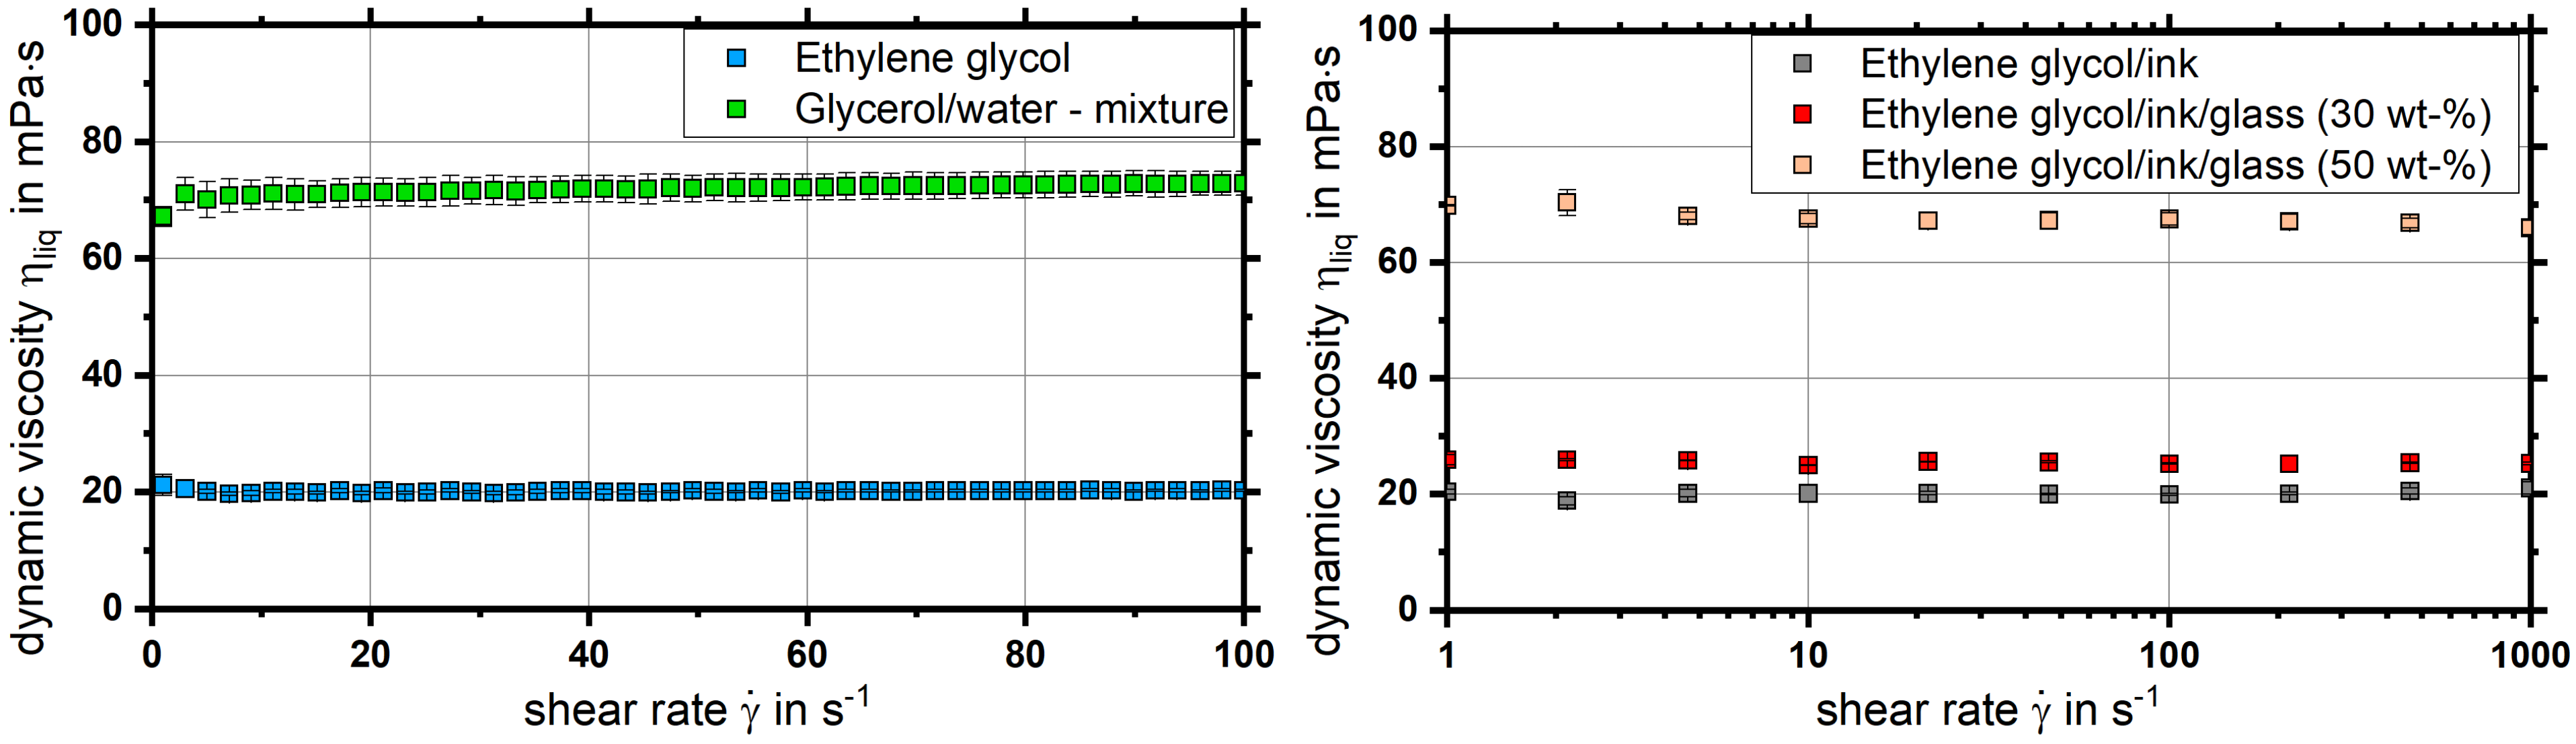
4.1. Rheological Characterization

Initially, the flow behavior concerning liquid viscosity and its dependence on the shear rate was investigated. All of the measurements were performed at least twice. As expected, for both liquids (ethylene glycol & the glycerol/water-mixture) a Newtonian flow behavior was detected; see Figure 5 (left). Due to the fact that no segregation effects or particle sedimentation could occur, the increment of the shear rate was set as linear. The dynamic viscosity of ethylene glycol was η l i q = 21 mPa·s, whereas the glycerol/water-mixture with ϕ W = 19.5 w t - % featured η l i q = 70 mPa·s.
At the beginning of the rheological characterization of the suspensions, investigations of suspension viscosity over time at a constant shear rate were performed for Δ t = 30 min. These investigations revealed first effects of sedimentation on the suspension viscosity after t = 2 min. To capture the entire range of the shear rate, the increment was set to logarithmic, which allows for the investigation of a large shear rate range with negligible sedimentation influence.
To guarantee for an adequate data rate with the SpraySpy® system in opaque operation mode, a constant amount of black ink (Pelikan A17 black ink) ϕ i n k = 0.13 w t - % was added to the suspensions. The addition of ink had three effects: (i) The data rate increased significantly, even with a small amount of ink. As a result, the ink mass fraction increased until no further data rate increase was achieved, leading to ϕ i n k = 0.13 w t - % . (ii) The ink enabled the detection of pure liquid droplets even smaller than the glass particles that resulted from the solid-liquid separation, in the opaque mode of the SpraySpy®. (iii) Ink did not affect the resulting dynamic viscosity, as shown in Figure 5. Here, the dynamic viscosity of pure ethylene glycol (Figure 5 (left)) and the ethylene glycol/ink–mixture (Figure 5 (right)) was similar.
As can be seen from the measurements shown, both suspensions exhibited Newtonian flow behavior (see Figure 5 (right)). This effect can be explained by several reasons: (i) the particles used are spherical and not deformable, which avoids an alignment in shear direction or deformation, typically leading to non-Newtonian flow behavior; (ii) the particle size distribution shows a narrow span without formed agglomerates as often found in non-Newtonian suspensions. The Sauter mean diameter of the glass beads with w t d 32 , P = 40 70 μ m (density: ρ P = 2500 kg·m 3 ) (according to the manufacturer [44]) was checked in an extra set of experiments by means of laser diffraction, which revealed a particle diameter of d 32 , P = 69 ± 0.91 μ m . An increase in the glass mass fraction from ϕ P = 0 w t - % to ϕ P = 30 w t - % led to an increase in the viscosity from η l i q = 21 mPa·s to η s u s = 25 mPa·s, as shown in Figure 5(right). The difference between the viscosities mentioned is therefore negligible. A further increase in the glass mass fraction from ϕ P = 30 w t - % to ϕ P = 50 w t - % resulted in a significant increase in the viscosity to η s u s = 68 mPa·s, which is nearly identical to the η l i q = 70 mPa·s of the glycerol/water-mixture. The refractive index of the glass particles was n = 1.52 as given by the manufacturer [44].
All of the measured fluid properties are summarized in Table 1.

4.2. Spray Characterization

The following section discusses measurements of droplet size obtained using the time-shift technique as well as laser diffraction. Every radial profile and integral measurement was performed three times to guarantee the reliability of the results. Reproducibility is given as standard deviation in the diagrams. The maximum deviation of local d 32 is < 10 μ m . According to this small deviations, error bars are hardly visible for some measurement positions. After a full radial profile was measured and the rotational symmetry proven, two half-profiles of x 0 mm were carried out; the profiles were mirrored at radial position x = 0 mm. Therefore, the mirrored data points are shown as open symbols in the following diagrams. To obtain a reliable dataset at every radial position, the measuring options were set to either 20,000 droplets or a measuring time of at least 180 s. As mentioned above, the measuring plane was set to z = 150 mm for all measurements. For laser diffraction the measurement time was set to t = 30 s. The values of Sauter mean diameter detected by laser diffraction are given as d 32 , L D S with a maximum deviation of ± 9 μ m .

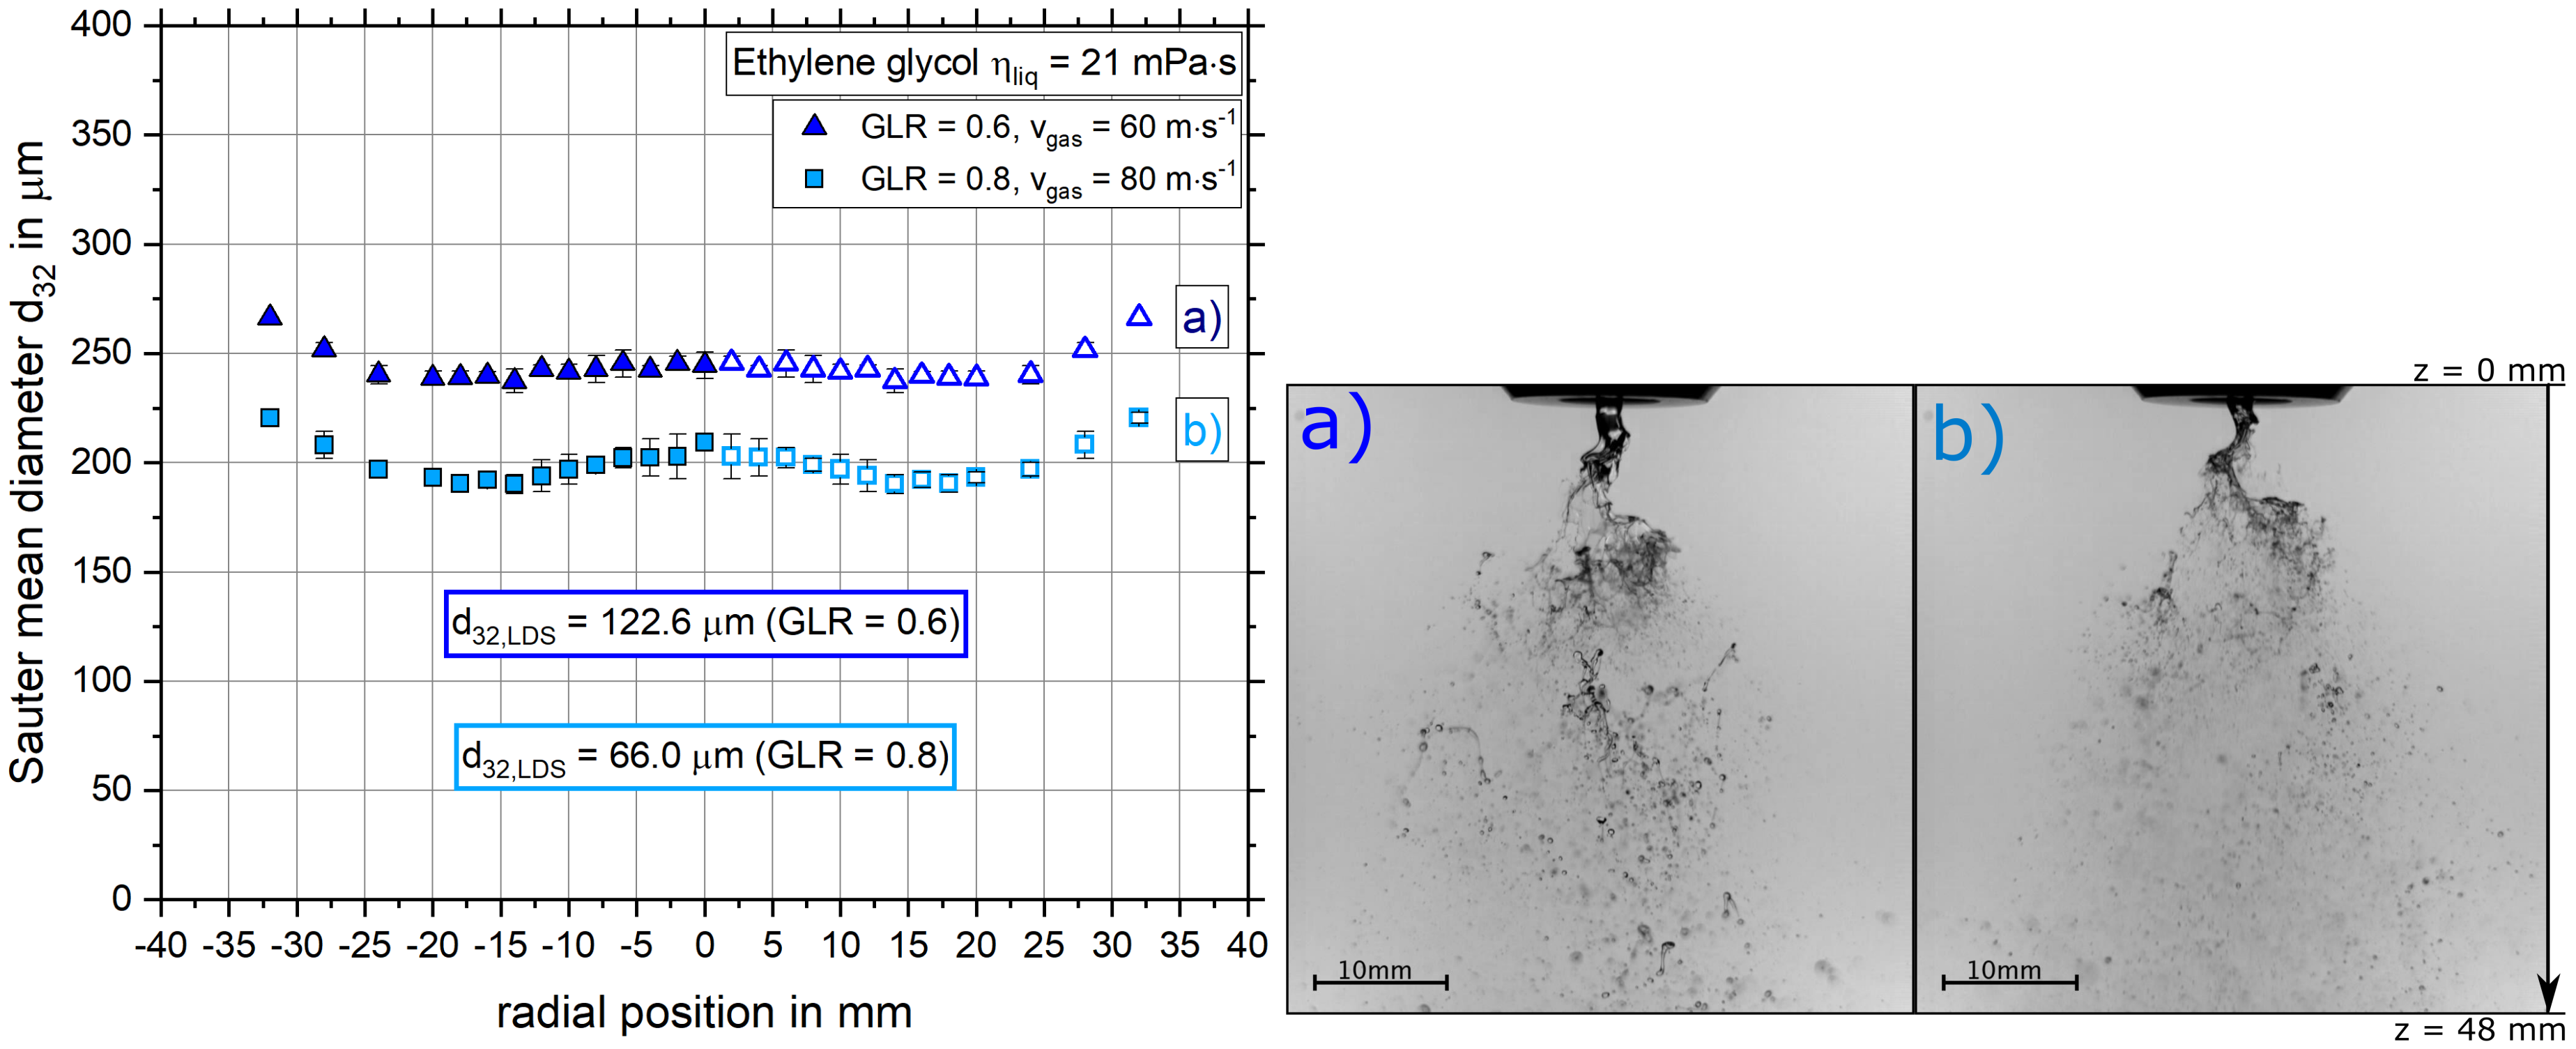
4.2.1. The Influence of Gas Velocity on the Radial Sauter Mean Diameter Distribution and Primary Breakup

Figure 6 (left) shows the radial distribution of the Sauter mean diameter profiles for the ethylene glycol with η l i q = 21 mPa·s at v g a s = 60 m·s 1 and v g a s = 80 m·s 1 . For both gas velocities, a W-shaped radial profile was detected where the profile was more pronounced for the v g a s = 80 m·s 1 . With increasing gas velocity (i.e., G L R ), the droplet size decreased over the entire spray cone. The decrement of droplet size was around Δ d 32 = 50 μ m . The high-speed camera images in Figure 6(right) also show an effect that had a clear influence on the droplet size. For v g a s = 60 m·s 1 , smaller membranes and fibers leaving the detection area can be observed, whereas for v g a s = 80 m·s 1 , the spray was highly homogenous in droplet size and without ligaments in the near field of the nozzle. The decrement in droplet size for the increased gas velocity has been confirmed by other researchers [9,45,46]. For both of the illustrated primary breakup images, the flapping instability (which is characterized by the non-axisymmetric oscillation of the liquid jet) was the predominant disintegration mode detected in the fiber-type regime according to [14]. In order to validate the tendencies revealed by the SpraySpy®, additional measurements were performed with a commonly used laser diffraction system. The results for both gas velocities are shown in Figure 6 (left) as values. Due to the fact that the measurement systems differ, the results are only qualitatively compared in terms of their tendencies, as in [47]. As expected, the Sauter mean diameters detected by laser diffraction were smaller than those measured by the SpraySpy®. This is in accordance to the comparison measurements of other local measurement techniques and laser diffraction [47,48]. The present research is primarily focused on the influence of different process parameters on spray development. In this context both measurement techniques showed that with increasing gas velocity the droplet size decreased. For the LDS a decrease in droplet size of Δ d 32 , L D S = 56.6 μ m was detected, which implies good agreement and a validation of the tendencies attained with the time-shift technique leading to a decrease of around Δ d 32 = 50 μ m .

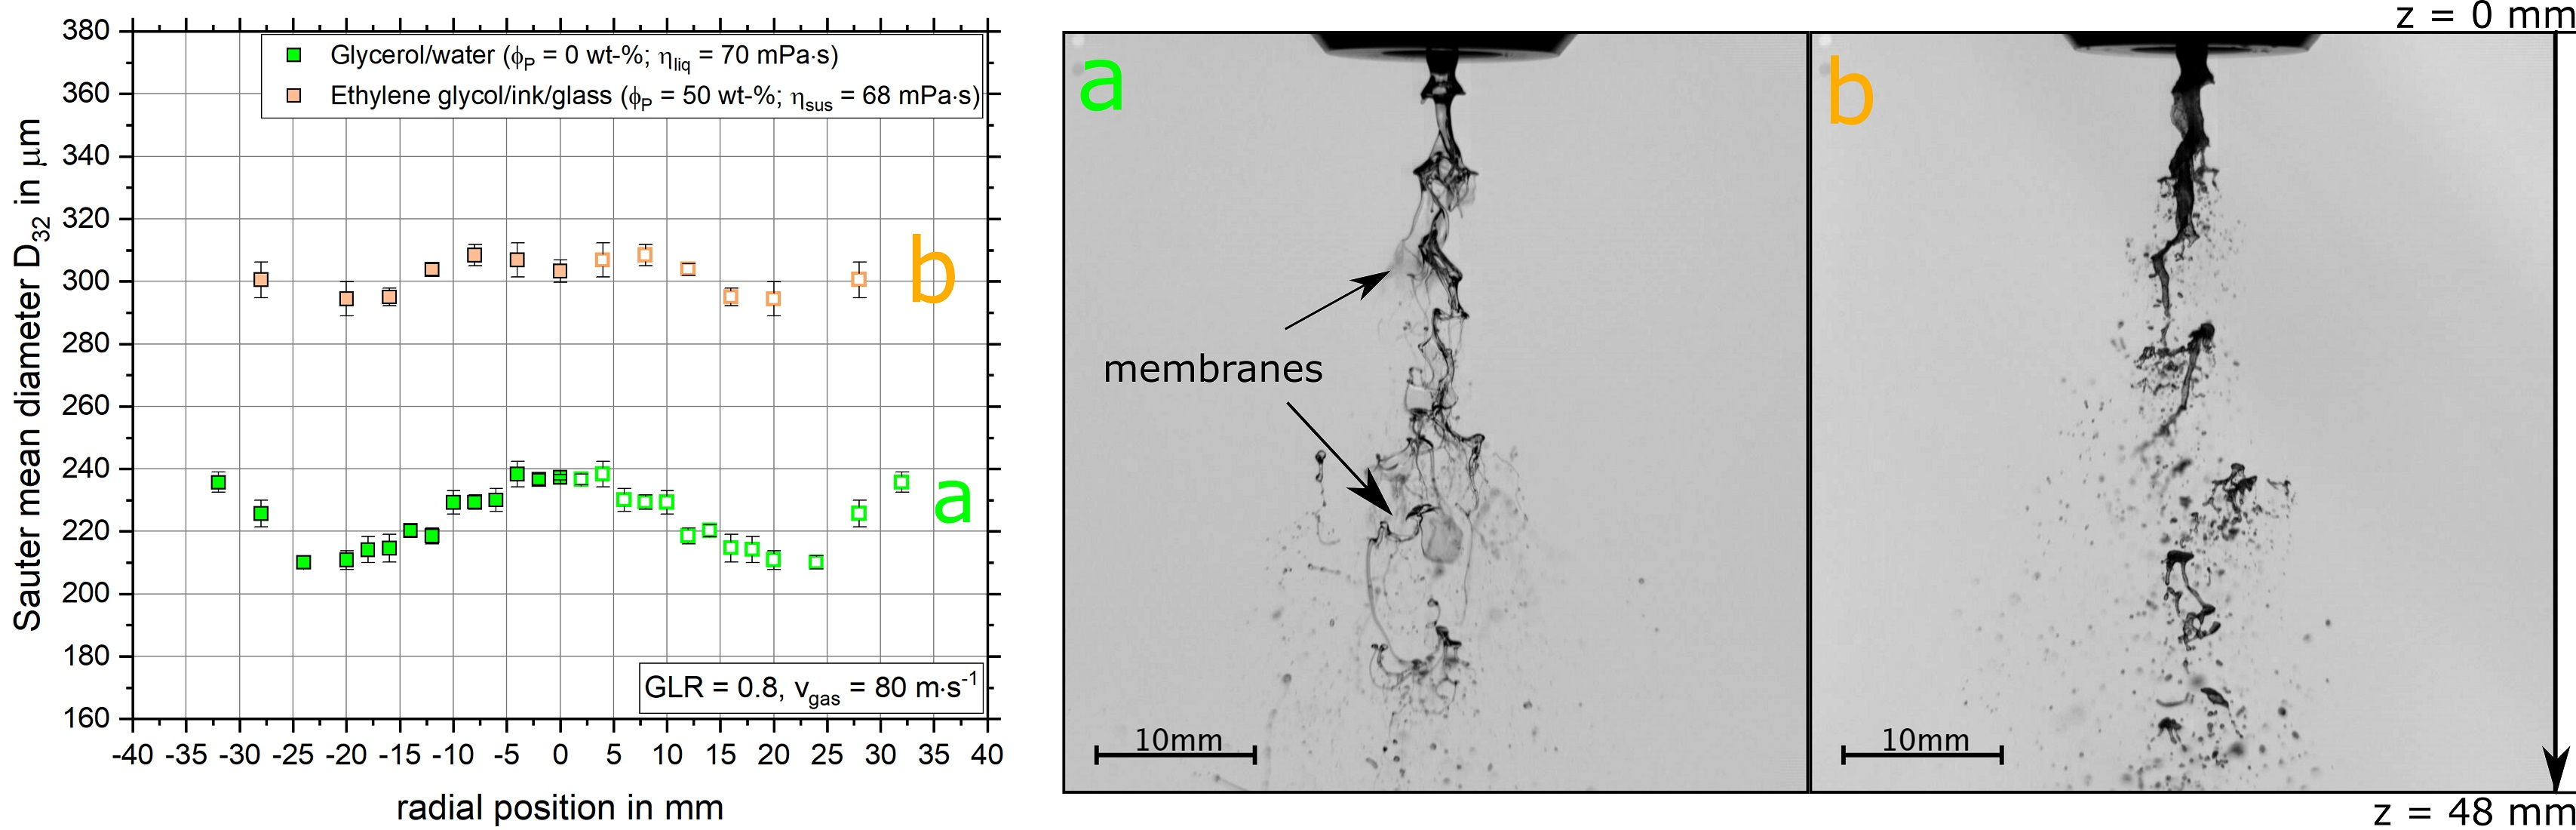
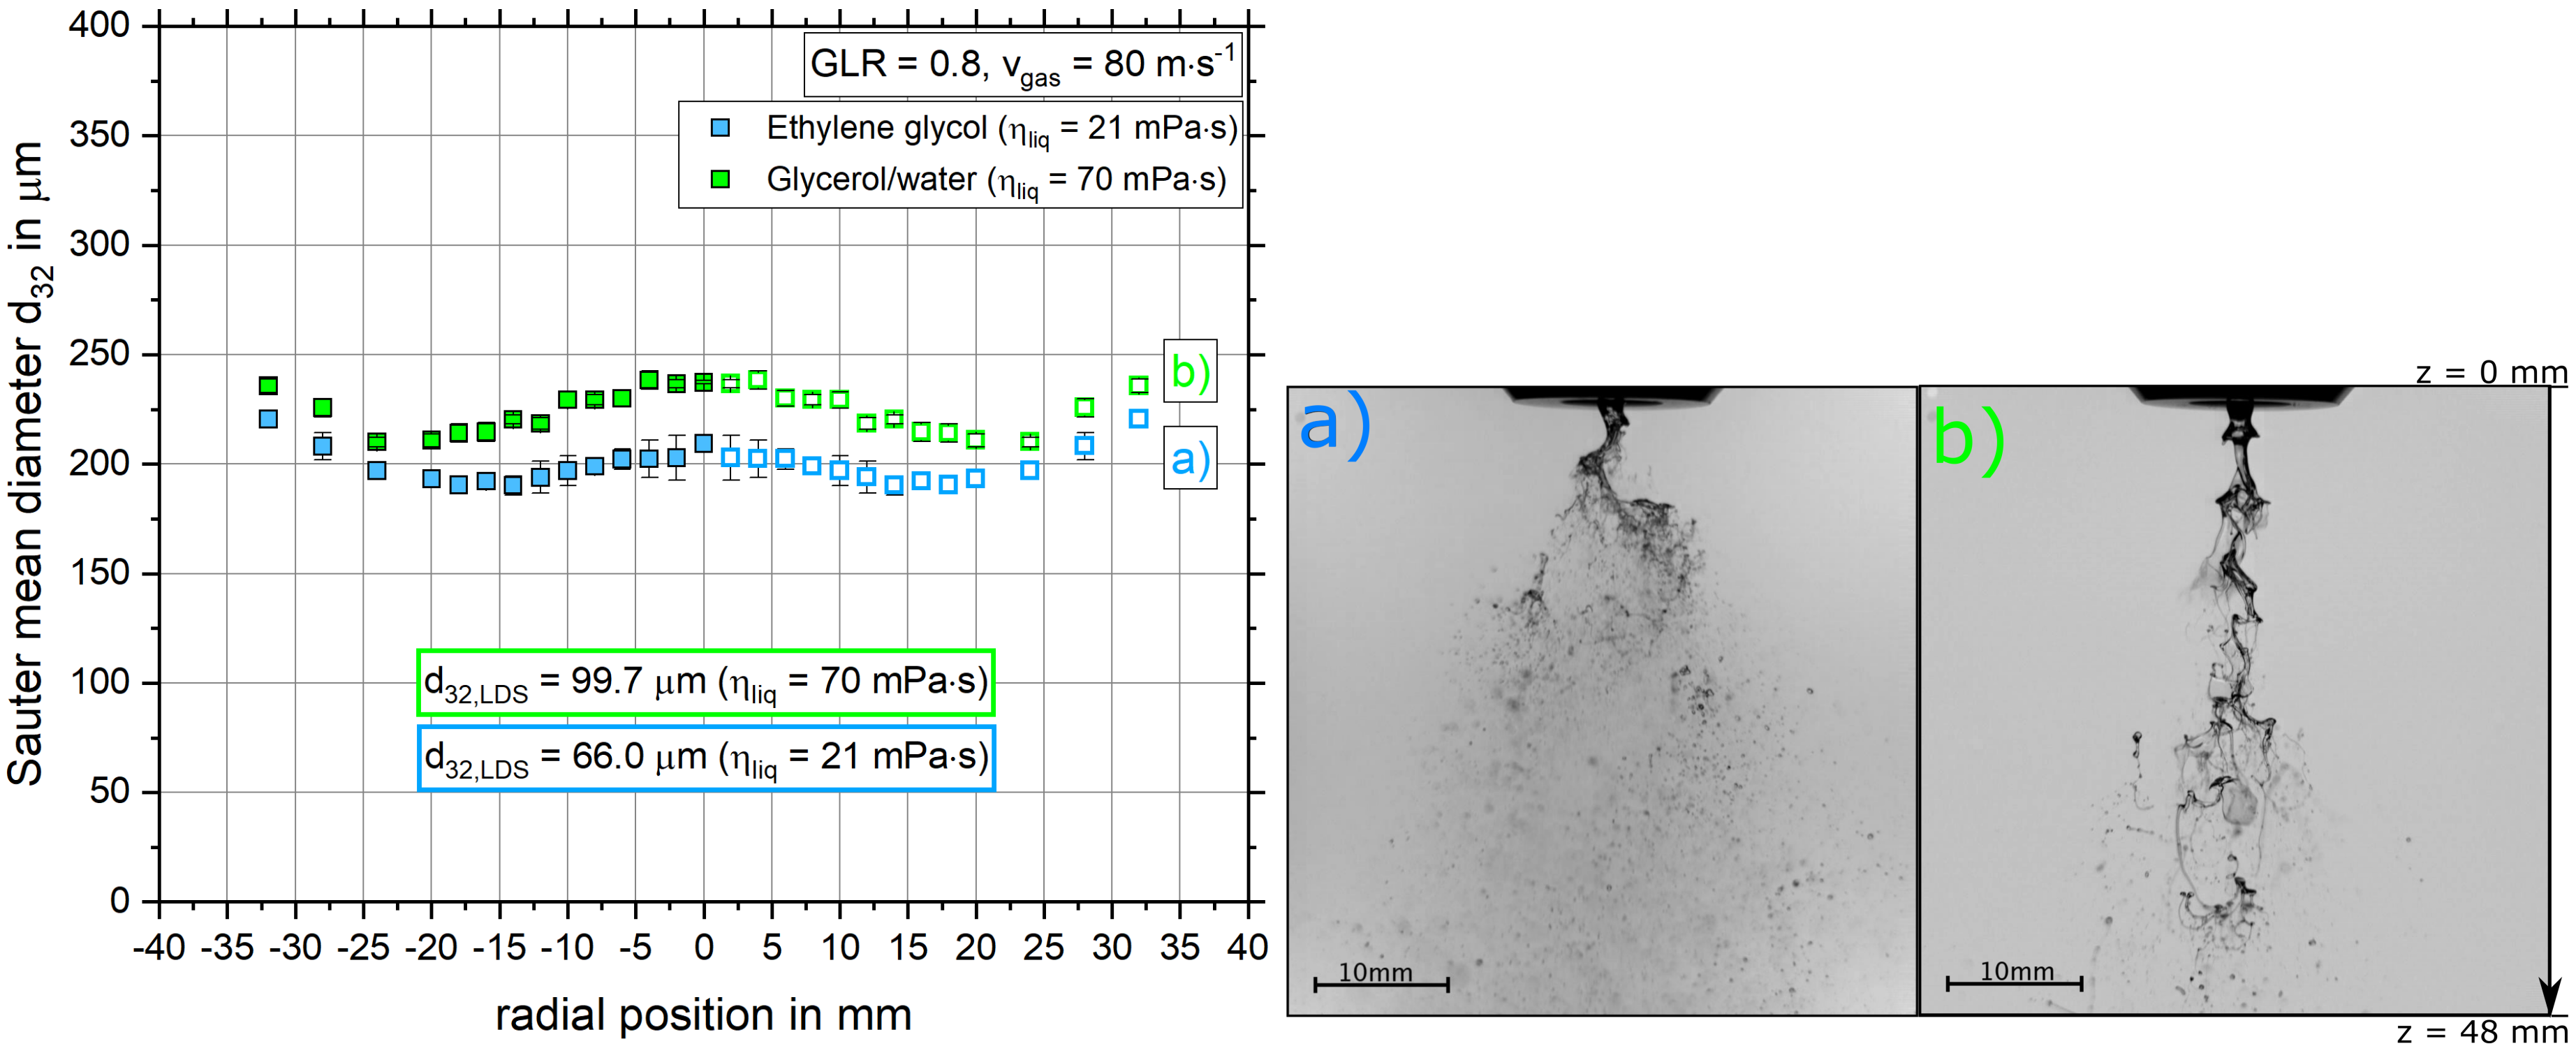
4.2.2. The Influence of Dynamic Viscosity on the Sauter Mean Diameter Distribution and Primary Breakup

In Figure 7 (left), the radial distribution of the Sauter mean diameter is shown at v g a s = 80 m·s 1 for ethylene glycol with η l i q = 21 mPa·s and the glycerol/water-mixture with η l i q = 70 mPa·s. Here, both investigated liquids show a distinct W-shape radial profile. With increasing dynamic viscosity, the droplet size increases, which corresponds to [13,14]. In the region of the spray axis, the increment in droplet size is more pronounced, whereas the size difference is reduced with increasing radial distance to the spray center. These results are confirmed by the high-speed camera images in Figure 7 (right). For increasing the dynamic viscosity, the disintegration process leads to the formation of large ligaments, leaving the field of view marked, finally leading to increased droplet sizes. Identical tendencies can also be found in the literature [13] and are typical for an increase in η l i q . In the present case, this effect is even more pronounced due to the higher surface tension of the glycerol/water-mixture compared to ethylene glycol (see Table 1). As the surface tension increases, the secondary breakup of droplets is reduced for the same aerodynamic operating conditions. The fiber-type regime underpinned the primary breakup of both investigated liquids. Contrary to the flapping instability of low viscosity liquids, the predominant disintegration mode for the glycerol/water-mixture is a pulsating Kelvin-Helmholtz wave according to [14].
Laser diffraction measurements were performed to compare the tendencies observed with the SpraySpy®. The results for both dynamic viscosities are illustrated in Figure 7 (left). In the case of both measurement techniques, the droplet size increases with increasing dynamic viscosity. Here, the LDS detected an increase in droplet size of Δ d 32 , L D S = 33.7 μ m for increasing viscosity. The difference measured by the SpraySpy® system was between Δ d 32 = 15 30 μ m dependent on the radial position, which implies good agreement and a validation of the results attained with the time-shift technique.

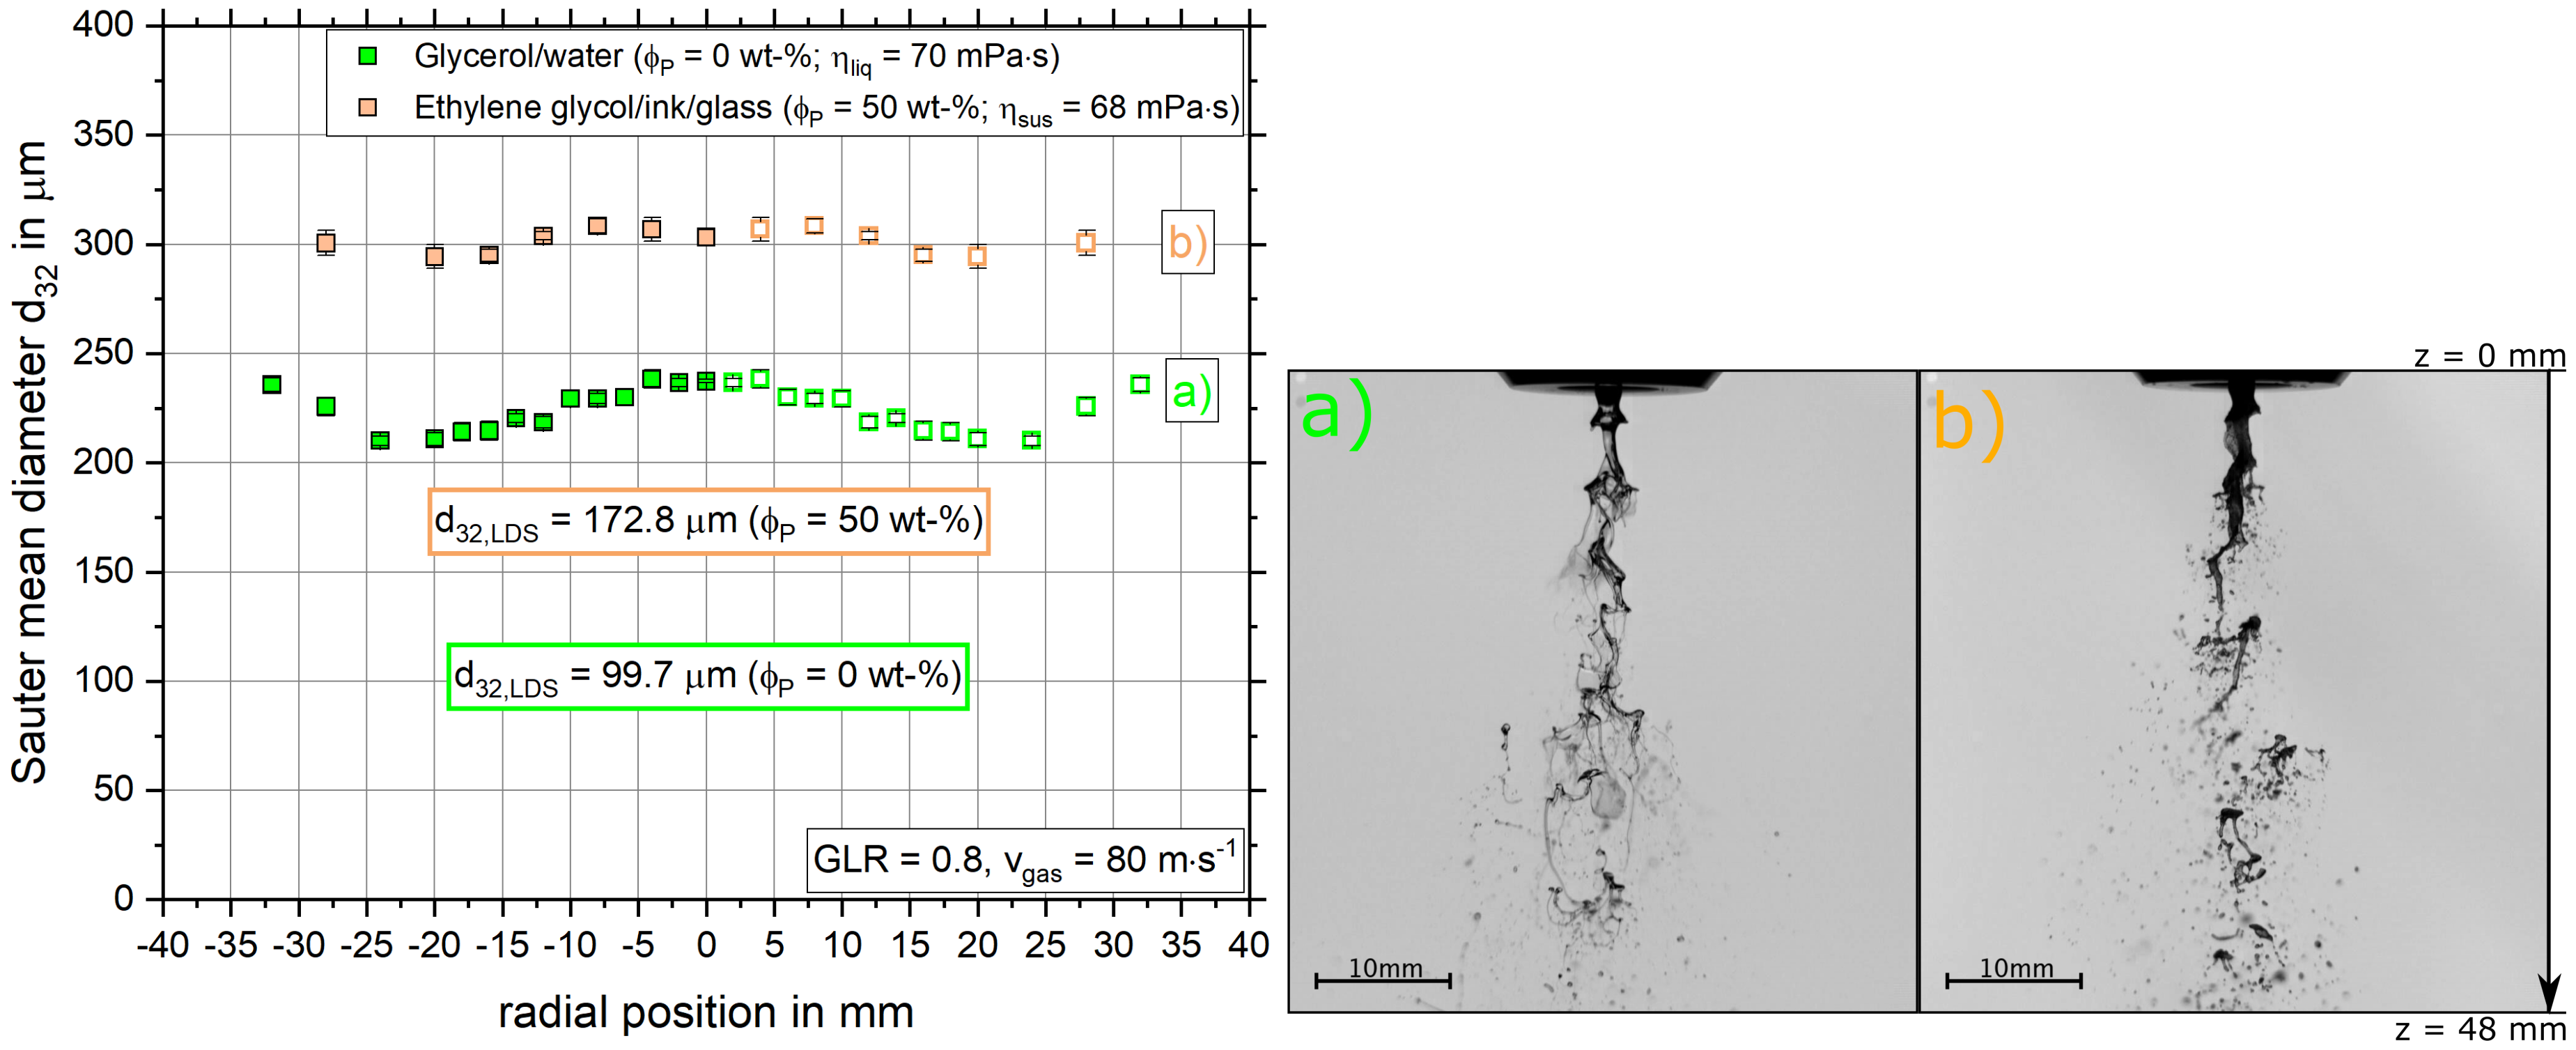
4.2.3. The Influence of Varying Particle Fractions on the Sauter Mean Diameter Distribution and Primary Breakup

Figure 8 (left) shows the radial distribution of the Sauter mean diameter at v g a s = 80 m·s 1 for ethylene glycol with η l i q = 21 mPa·s and the ethylene glycol/ink/glass-mixture with η s u s = 25 mPa·s, ϕ P = 30 w t - % . As shown in the liquid and suspension properties (see Table 1), the particle mass fraction can be investigated isolated from other parameters influencing the atomization process such as dynamic viscosity or surface tension. Compared to the previous results, the suspension with ϕ P = 30 w t - % also shows a distinct W-shape profile. A comparison of the two fluids with similar viscosities but varying particle fractions reveals a significant increase in droplet size over the entire spray cone. To confirm that the result cannot be attributed to a change in the measuring mode from transparent to opaque, the same results for the low-viscosity liquid were identified using a mixture with ethylene glycol and ink in the opaque mode of the SpraySpy® (see Section 3). As already discussed in the previous chapter, a maximum increment in the droplet size was achieved in the center of the spray. With regard to the high-speed camera images, the primary breakup of the pure liquid and suspension only shows small deviations. The detected droplets for ϕ P = 30 w t - % were larger compared to the pure liquid, with some remaining fragments of the primary breakup in the far field of the nozzle. For both investigated fluids, the fiber-type regime with flapping instability was the predominant disintegration mode according to [14].
For a comparison of the tendencies observed with the SpraySpy®, laser diffraction measurements were performed. The results are illustrated in Figure 8 (left) for both solid mass fractions at low viscosity ( η l i q / s u s = 21 25 mPa·s). For both of these measurement techniques, the droplet size increased in conjunction with increasing solid mass fraction and constant viscosity. The LDS showed an increment of Δ d 32 , L D S = 26.3 μ m , whereas the SpraySpy® system detected an increment of Δ d 32 = 50 60 μ m depending on radial position.
Considering the secondary breakup of suspension fragments and droplets, as presented by Mulhem et al. [24], the difference in droplet size at z = 150 mm can be explained using the tensile strength approach. For disintegration of a liquid droplet, the surface tension force must be overcome, whereas the tensile force of a suspension droplet is significantly higher [27]. Therefore, the dynamic pressure of the gas phase required for the disintegration of a suspension droplet is increased significantly compared to that for a pure liquid droplet. This effect is explained in the following example:
With a force balance between the surface tension force and dynamic pressure of the gas phase, an ethylene glycol droplet with d 32 = 300 μ m requires a relative gas velocity of v g a s > 12.5 m·s 1 for further breakup [25]. Against this, applying Equation (5) and assuming a pendular state of the suspension droplet, according to Capes [27], a relative gas velocity of v g a s > 21.9 m·s 1 is needed to induce further breakup. Due to the fact that the gas velocity decreases with increasing distance from the nozzle orifice, the disintegration process of the suspension droplets is halted at larger droplet sizes compared to the case of pure liquids for identical operating conditions at the nozzle.
Comparing the results of low viscosity ( η l i q / s u s = 21 25 mPa·s) with those revealed for the increased viscosity of η l i q = 70 mPa·s, similar conclusions can be drawn. In Figure 9 (left), the radial distribution of the Sauter mean diameter profiles is shown at v g a s > 80 m·s 1 for the glycerol/water-mixture with η l i q = 70 mPa·s, ϕ P = 0 w t - % and the ethylene glycol/ink/glass-mixture with η s u s = 68 mPa·s, ϕ P = 50 w t - % . For an increase in the glass mass fraction from ϕ P = 0 w t - % to ϕ P = 50 w t - % , a significant increase in the droplet size was detected. The W-shaped profile is revealed with both media. The high-speed camera images in Figure 9 (right) show the fiber-type breakup for both fluids. For the suspension, no ligaments were identified in contrast to the pure liquid. Nevertheless, in both cases large fragments exit the field of view. For both media, a pulsating Kelvin-Helmholtz wave can be identified as the predominant instability according to [14].
The significant difference in droplet size can be attributed to a difference in secondary atomization. As described by the tensile force approach mentioned above. Here, for the previously described force balance, applying Equation (5), a glycerol/water ( η l i q = 70 mPa·s) droplet with a diameter of d 32 = 300 μ m requires a gas velocity of v g a s > 14.6 m·s 1 for secondary breakup due to the surface tension force. Contrastingly and according to Capes [27], a relative gas velocity of v g a s > 21.9 m·s 1 is needed for the further breakup of the suspension droplet.
Finally, the tendencies observed with the SpraySpy® system are compared with the laser diffraction measurements. The results for both solid mass fractions at increased viscosity ( η l i q = 68 70 mPa·s) are illustrated as values in Figure 9 (left). For both measurement techniques, with increasing solid mass fractions and constant viscosity, the droplet size increases. The LDS showed an increment of Δ d 32 , L D S = 73.1 μ m , whereas the SpraySpy® system detected an increment of Δ d 32 = 60 80 μ m depending on radial position. Thus, the tendency detected by the SpraySpy® were validated by the commonly used laser diffraction system, which confirms the reliability of the local measurements. Concluding the comparison, the maximum deviation between the measurement systems in the measured tendencies of droplet size was Δ d 32 = 30 μ m , revealed for the variation of solid mass fraction from ϕ P = 0 w t - % to ϕ P = 30 w t - % at low viscosity.

4.3. Conclusions

This study investigated the influence of solid particles on spray formation for different process parameters. The dynamic viscosity was constant. To achieve this, two sets of Newtonian fluids (each consisting of one pure liquid and one suspension at the same respective viscosities) were used. The spray was recorded by a high-speed camera and a SpraySpy® system based on the time-shift effect, while a commonly used Spraytec® laser diffraction analyzer was employed for validation. In contrast to laser diffraction measurements, the SpraySpy® system allows for the detection of local spray characteristics. An external-mixing twin-fluid atomizer was operated at different gas velocity and corresponding GLR at constant liquid mass flow. The results of the experiments can be summarized as follows:
  • Newtonian flow behavior of the suspensions was achieved by suspending round glass beads of a specific size but different mass fraction in Newtonian liquids. For each suspension, a pure liquid with same viscosity was additionally used as reference fluid, which allows for the separation of the effect of the glass mass fraction and dynamic viscosity on atomization.
  • A new measurement technique that applies the time-shift method for local measurement of droplet size and velocity in opaque suspension sprays was successfully used. The following effects were observed:
    -
    With increasing gas velocity, the radial Sauter mean diameter distribution decreased.
    -
    With increasing dynamic viscosity, the radial Sauter mean diameter distribution increased.
    -
    With increasing solid mass fraction, an increasing droplet diameter was detected. This effect can be explained by the theory of tensile strength and a force balance.
  • The primary breakup analysis of the viscous liquids and suspensions was performed with a high-speed camera. The primary breakup instability varied as a function of the dynamic viscosity, whereas a change in the solid mass fraction led to the same instability mode.
  • The dependencies of droplet size on gas velocity, dynamic viscosity and solid mass fraction revealed by the SpraySpy® system were confirmed by a commonly applied laser diffraction system.

Author Contributions

Conceptualization, S.W. and T.J.; investigation, S.W.; data curation, S.W.; writing–original draft preparation, S.W.; writing–review and editing, T.J. and T.K.; visualization, S.W.; supervision, T.K. All authors have read and agreed to the published version of the manuscript.

Funding

The authors gratefully acknowledge the financial support of the Helmholtz Association of German Research Centers (HGF) in the context of the research program, Energy Efficiency, Materials and Resources (EMR). The present work contributes to the Helmholtz Virtual Institute for Gasification Technology–HVIGasTech (VH-VI-429) http://www.hvigastech.org/.

Conflicts of Interest

The funders had no role in the design of the study; in the collection, analyses, or interpretation of data; in the writing of the manuscript, or in the decision to publish the results.

Abbreviations

The following abbreviations are used in this manuscript:
ATMOAtmospheric Spray Test Rig
CWSCoal-water Slurry
EFGEntrained Flow Gasification
GLRGas-to-Liquid Ratio
LDSLaser Diffraction System
LEDLight-emitting Diode

References

  1. Andreussi, P.; Tognotti, L.; Graziadio, M.; de Michele, G. Atomization of Coal-Water Fuels by a Pneumatic Nozzle: Characteristics of the Spray. Aerosol Sci. Technol. 1990, 13, 35–46. [Google Scholar] [CrossRef] [Green Version]
  2. Hai-long, Y.; Chao, Z.; Jian-zhong, L.; Ke-fa, C. Experimental study of the atomizing performance of a new type of nozzle for coal water slurry. Energy Fuels 2008, 22, 1170–1173. [Google Scholar] [CrossRef]
  3. Smith, C.F.; Sojka, P.E.; Lefebvre, A.H. Plain-Jet Airblast Atomization of Coal-Water Slurry Fuels; SAE International: Warrendale, PA, USA, 1985. [Google Scholar]
  4. Tsai, S.C.; Vu, T. Atomization of coal-water slurry using twin-fluid jet atomizer. Fuel 1987, 66, 1596–1602. [Google Scholar] [CrossRef]
  5. Ohene, F.; Bratton, T.; Rhone, Y. Viscoelastic Behavior of Beneficated Coal-Water Slurries and Their Atomization Characteristics; Grambling State University: Grambling, LA, USA, 1996. [Google Scholar]
  6. Mayer, W. Coaxial atomization of a round liquid jet in a high speed gas stream: A phenomenological study. Exp. Fluids 1994, 16, 401–410. [Google Scholar] [CrossRef]
  7. Leroux, B.; Delabroy, O.; Lacas, F. Experimental study of coaxial atomizers scaling. Part 2: Diluted zone. Atom. Sprays 2007, 17, 409–430. [Google Scholar] [CrossRef]
  8. Dumouchel, C. On the experimental investigation on primary atomization of liquid streams. Exp. Fluids 2008, 45, 371–422. [Google Scholar] [CrossRef]
  9. Hede, P.D.; Bach, P.; Jensen, A.D. Two-fluid spray atomisation and pneumatic nozzles for fluid bed coating/agglomeration purposes: A review. Chem. Eng. Sci. 2008, 63, 3821–3842. [Google Scholar] [CrossRef]
  10. Chigier, N.; Faragó, Z. Morphological Classification of Disintegration of Round Liquid Jets in a Coaxial Air Stream. Atom. Sprays 1992, 2, 137–153. [Google Scholar] [CrossRef]
  11. Lasheras, J.C.; Hopfinger, E.J. Liquid Jet Instability and Atomization in a Coaxial Gas Stream. Annu. Rev. Fluid Mech. 2000, 32, 275–308. [Google Scholar] [CrossRef]
  12. Wachter, S.; Jakobs, T.; Kolb, T. Experimental investigation on the influence of system pressure on resulting spray quality and jet breakup applying pressure adapted twin-fluid nozzles. Int. J. Multi. Flow 2020, 125, 103189. [Google Scholar] [CrossRef]
  13. Li, L.K.B.; Dressler, D.M.; Green, S.I.; Davy, M.H. Experiments on air-blast atomization of viscoelastic liquids, Part 1: Quiescent conditions. Atom. Sprays 2009, 19, 157–190. [Google Scholar] [CrossRef]
  14. Sänger, A.D. Zerstäubung hochviskoser Fluide bei variierendem Systemdruck—Grundlagenforschung zur Hochdruck-Flugstromvergasung. Ph.D. Thesis, Karlsruher Institut für Technologie (KIT), Karlsruhe, Germany, 2018. [Google Scholar]
  15. Muller, F.L.; Davidson, J.F. Rheology of Shear Thinning Polymer Solutions. Indust. Eng. Chem. Res. 1994, 33, 2364–2367. [Google Scholar] [CrossRef]
  16. Mansour, A.; Chigier, N. Air-blast atomization of non-newtonian liquids. J. Non-Newton. Fluid Mech. 1995, 58, 161–194. [Google Scholar] [CrossRef]
  17. Aliseda, A.; Hopfinger, E.J.; Lasheras, J.C.; Kremer, D.M.; Berchielli, A.; Connolly, E.K. Atomization of viscous and non-newtonian liquids by a coaxial, high-speed gas jet. Experiments and droplet size modeling. Inter. J. Multiphase Flow 2008, 34, 161–175. [Google Scholar] [CrossRef] [Green Version]
  18. Gillberg, L.; Larsson, N.; Mathiesen, M.; Nyström, O.; Persson, J.E. Some Rheological Data and Atomization Behaviour of CWMs Containing 68 to 89 Percent Coal. In Proceedings of the International Symposium on Coal Slurry Combustion and Technology, Tampa, FL, USA, 25–27 April 1983; pp. 1229–1243. [Google Scholar]
  19. Ghezelchi, M.H.; Garcia-Perez, M.; Wu, H. Bioslurry as a Fuel. 7: Spray Characteristics of Bio-Oil and Bioslurry via Impact and Twin-Fluid Atomizers. Energy Fuels 2015, 29, 8058–8065. [Google Scholar] [CrossRef]
  20. Zhao, H.; Liu, H.F.; Xu, J.L.; Li, W.F.; Cheng, W. Breakup and atomization of a round coal water slurry jet by an annular air jet. Chem. Eng. Sci. 2012, 78, 63–74. [Google Scholar] [CrossRef]
  21. Cronin, L.; Sojka, P.E.; Lefebvre, A.H. The Effect of Fuel Film Thickness on Coal Water Slurry Atomization; SAE Transactions: Warrendale, PA, USA, 1985; pp. 577–584. [Google Scholar]
  22. Smith, C.F.; Sojka, P.E.; Thames, J.M. The influence of fluid physical properties on coal-water slurry atomization. J. Eng. Gas Turbines Power 1990, 112, 15–20. [Google Scholar] [CrossRef]
  23. Mulhem, B.; Fritsching, U.; Schulte, G.; Bauckhage, K. Atomization of suspension in twin-fluid atomizer. In Proceedings of the PARTEC 2001—International Congress for Particle Technology, Nuremberg, Germany, 27–29 March 2001. [Google Scholar]
  24. Mulhem, B.; Fritsching, U.; Schulte, G.; Bauckhage, K. Effect of solid particle characteristics on suspension atomization. At. Sprays 2003, 13, 321–343. [Google Scholar] [CrossRef]
  25. Hinze, J.O. Fundamentals of the Hydrodynamic Mechanism of Splitting in Dispersion Dropl. AIChE J. 1955, 1, 289–295. [Google Scholar] [CrossRef]
  26. Mulhem, B.; Schulte, G.; Fritsching, U. Solid–liquid separation in suspension atomization. Chem. Eng. Sci. 2006, 61, 2582–2589. [Google Scholar] [CrossRef]
  27. Capes, C. Handbook of Powder Technology: Particle Size Enlargement; Elsevier: Amsterdam, The Netherlands, 1980. [Google Scholar]
  28. Zhao, H.; Liu, H.F.; Tian, X.S.; Xu, J.L.; Li, W.F.; Lin, K.F. Outer ligament-mediated spray formation of annular liquid sheet by an inner round air stream. Exp. Fluids 2014, 55, 27. [Google Scholar] [CrossRef]
  29. Jampolski, L.; Sänger, A.; Jakobs, T.; Guthausen, G.; Kolb, T.; Willenbacher, N. Improving the processability of coke water slurries for entrained flow gasification. Fuel 2016, 185, 102–111. [Google Scholar] [CrossRef]
  30. Chaussonnet, G.; Lieber, C.; Yikang, Y.; Gu, W.; Bartschat, A.; Reischl, M.; Koch, R.; Mikut, R.; Bauer, H.J. Towards DeepSpray: Using Convolutional Neural Network to Post-Process Shadowgraphy Images of Liquid Atomization. arXiv 2019, arXiv:1910.11073. [Google Scholar]
  31. Schäfer, W.; Rosenkranz, S.; Tropea, C. Validation of the Time-Shift Technique for Spray Characterization. In Proceedings of the ILASS Americas 27th Annual Conference on Liquid Atomization and Spray Systems, Raleigh, NC, USA, 17–20 May 2015. [Google Scholar]
  32. Tian, X.S.; Zhao, H.; Liu, H.F.; Li, W.F.; Xu, J.L. Effect of central tube thickness on wave frequency of coaxial liquid jet. Fuel Process. Technol. 2014, 119, 190–197. [Google Scholar] [CrossRef]
  33. Anton Paar GmbH. Available online: https://www.anton-paar.com/corp-de/ (accessed on 6 October 2020).
  34. Searle, G. A simple viscometer for very viscous liquids. Proc. Cambridge Philos. Soc. 1912. [Google Scholar]
  35. KRÜSS GmbH. Available online: https://www.kruess.com/ (accessed on 6 October 2020).
  36. Du Noüy, P.L. An interfacial tensiometer for universal use. J. Gen. Phys. 1925, 7, 625–631. [Google Scholar] [CrossRef]
  37. Kihm, K.; Son, S. Effect of coal particle size on coal-water-slurry (CWS) atomization. Atom. Sprays 1998, 8, 503–519. [Google Scholar]
  38. Wachter, S.; Jakobs, T.; Kolb, T. Comparison of spray quality for two different flow configurations: Central liquid jet versus annular liquid sheet. In Proceedings of the 29th European Conference on Liquid Atomization and Spray Systems, Paris, France, 2–4 September 2019. [Google Scholar]
  39. Damaschke, N.; Nobach, H.; Semidetnov, N.; Tropea, C. Optical particle sizing in backscatter. Appl. Opt. 2002, 41, 5713. [Google Scholar] [CrossRef] [Green Version]
  40. Schäfer, W.; Tropea, C. Time-shift technique for simultaneous measurement of size, velocity, and relative refractive index of transparent droplets or particles in a flow. Appl. Opt. 2014, 53, 588–597. [Google Scholar] [CrossRef]
  41. Li, L.; Stegmann, P.G.; Rosenkranz, S.; Schäfer, W.; Tropea, C. Simulation of light scattering from a colloidal droplet using a polarized Monte Carlo method: Application to the time-shift technique. Opt. Exp. 2019, 27, 36388. [Google Scholar] [CrossRef]
  42. Malvern Panalytical GmbH. Available online: https://www.malvernpanalytical.com/de/ (accessed on 6 October 2020).
  43. Dodge, L.G.; Biaglow, J.A. Effect of elevated temperature and pressure on sprays from simplex swirl atomizers. J. Eng. Gas Turbines Power 1986, 108, 209–215. [Google Scholar] [CrossRef]
  44. Sigmund Lindner GmbH. Available online: https://www.sigmund-lindner.com/ (accessed on 6 October 2020).
  45. Lefebvre, A. Twin-fluid atomization: Factors influencing mean drop size. Atom. Sprays 1992, 2, 101–119. [Google Scholar] [CrossRef]
  46. Rizk, N.; Lefebvre, A. Spray characteristics of plain-jet airblast atomizers. In Proceedings of the ASME 1983 International Gas Turbine Conference and Exhibit, Phoenix, AZ, USA, 27–31 March 1983; p. 634. [Google Scholar]
  47. Cossali, E.; Hardalupas, Y. Comparison between laser diffraction and phase Doppler velocimeter techniques in high turbidity, small diameter sprays. Exp. Fluids 1992, 13. [Google Scholar] [CrossRef]
  48. Zaidi, S.H.; Altunbas, A.; Azzopardi, B.J. A comparative study of phase Doppler and laser diffraction techniques to investigate drop sizes in annular two-phase flow. Chem. Eng. J. 1998, 71, 135–143. [Google Scholar] [CrossRef]
Figure 1. Schematic view of the atmospheric spray test rig (ATMO) with the applied twin-fluid nozzle.
Applsci 10 07615 g001
Figure 2. Schematic view of the SpraySpy® system in the x,z-plane.
Applsci 10 07615 g002
Figure 3. Schematic view of a scattered laser beam exiting a transparent droplet with n = 1.333 at ϑ S = 165 for different times t 1 to t 6 as a function of droplet velocity v z . The predominant scattering mode at the presented time step is shown as the thick line.
Applsci 10 07615 g003
Figure 4. Signal of scattered light from a transparent (n = 1.333) (left) and an opaque (right) droplet in ϑ S = 165 while passing the laser beams. Detector D1 is shown in gray with dotted lines, detector D2 in black.
Applsci 10 07615 g004
Figure 5. Viscosity measurement of ethylene glycol and a glycerol/water-mixture with a linear shear rate increment applied (left); Viscosity measurement of the suspensions ethylene glycol/ink, ethylene glycol/ink/glass ( 30 w t - % ) and ethylene glycol/ink/glass ( 50 w t - % ) with a logarithmic shear rate increment applied (right).
Applsci 10 07615 g005
Figure 6. Radial distribution of the Sauter mean diameter at z = 150 mm below the nozzle orifice as a function of gas velocity (i.e., G L R ) for η l i q = 21 mPa·s (dots: SpraySpy®, values: LDS) (left); High-speed camera images of the primary breakup for η l i q = 21 mPa·s at (a) v g a s = 60 m·s 1 and (b) v g a s = 80 m·s 1 (right).
Applsci 10 07615 g006
Figure 7. Radial distribution of the Sauter mean diameter at z = 150 mm below the nozzle orifice as a function of the dynamic viscosity for v g a s = 80 m·s 1 (dots: SpraySpy®, values: LDS) (left); High-speed camera images of the primary breakup for v g a s = 80 m·s 1 at (a) η l i q = 21 mPa·s and (b) η l i q = 70 mPa·s (right).
Applsci 10 07615 g007
Figure 8. Radial distribution of the Sauter mean diameter at z = 150 mm below the nozzle orifice as a function of the glass mass fraction for v g a s = 80 m·s 1 (dots: SpraySpy®, values: LDS) (left); High-speed camera images of the primary breakup for v g a s = 80 m·s 1 at (a) ϕ P = 0 w t - % and (b) ϕ P = 30 w t - % (right).
Applsci 10 07615 g008
Figure 9. Radial distribution of the Sauter mean diameter at z = 150 mm below the nozzle orifice as a function of the glass mass fraction for v g a s = 80 m·s 1 (dots: SpraySpy®, values: LDS) (left); High-speed camera images of the primary breakup for v g a s = 80 m·s 1 at (a) ϕ P = 0 w t - % and (b) ϕ P = 50 w t - % (right).
Applsci 10 07615 g009
Table 1. Summary of the measured fluid properties—the measurements were performed at T = 20 C and p = 1 atm.
GlycolGlycerol/WaterGlycol/Ink/GlassGlycol/Ink/Glass
ϕ P in wt−%003050
ρ in kg·m 3 1110121513321537
η in mPa·s21702568
σ in mN·m 1 48654848
n r e a l in −1.4321.4451.4321.432
A in −0000
O h 0.0640.1760.0700.178
Publisher’s Note: MDPI stays neutral with regard to jurisdictional claims in published maps and institutional affiliations.

