Article

An Optimization Model for Operational Planning and Turnaround Maintenance Scheduling of Oil and Gas Supply Chain

by
Ahmed M. Ghaithan
Construction Engineering and Management Department, College of Environmental Design, King Fahd University of Petroleum and Minerals, Dhahran 31261, Saudi Arabia
Appl. Sci. 2020, 10(21), 7531; https://doi.org/10.3390/app10217531
Submission received: 1 October 2020 / Revised: 17 October 2020 / Accepted: 22 October 2020 / Published: 26 October 2020
(This article belongs to the Special Issue Planning and Scheduling Optimization)

Abstract

:
Hydrocarbon supply chain (HCSC) is a complex network that extends from oil and gas fields to demand nodes. Integrating operation and maintenance activities along this complex network is crucial since the hydrocarbon industry is the most influential sector in the world economy, and any disruptions or variations in hydrocarbon product supply will affect the whole world economy. Therefore, effective and thoughtful maintenance extends the life of an asset and enhances its reliability. To prevent huge losses in production and ultimately satisfy customer needs, the maintenance jobs are preferred to be performed during times of low demand. Thus, operation planning and maintenance scheduling decisions are dependent and should be optimized simultaneously. Therefore, the aim of this study is to develop an integrated mathematical model for the operation and maintenance planning of the oil and gas supply chain. The utility of the proposed model has been demonstrated using the Saudi Arabian HCSC. The proposed model effectively produces optimal operation and maintenance schedule decisions. A sensitivity analysis was conducted to study the effect of critical parameters on the obtained results.

1. Introduction

The hydrocarbon supply chain (HCSC) comprises oil and gas networks. The oil network involves oil fields, oil and gas separation plants (GOSPs), primary storage facilities, oil processing plants, refinery plants, secondary storage facilities, and demand nodes. In comparison, the gas network consists of gas fields, storages facilities, gas plants, fractionation plants, secondary storage facilities, and demand nodes. The two networks overlap in some entities and share some products.
Few researchers have studied the optimization of operational planning under the assumption of plant availability with full capacity, yet this assumption is practical. It is crucial to consider interruptions or plants’ sudden shutdown when planning for operation. In the real world, plants might be totally or partially unavailable due to periodic maintenance, shutdown, etc. Thus, production capacities will be reduced or reach zero. To restore the plants to their full capacities and keep them in good condition, plants should be maintained regularly and routinely to prevent unplanned failures and increase production rates. Maintenance activities reduce the sudden breakdown and prolong the unit’s life. Thus, operation planning models need to be more realistic and should consider the maintenance schedule. To prevent huge losses in production and eventually satisfy customer needs, maintenance jobs should be performed during times of low demands. Besides, connections between upstream and downstream plants need to be considered before deciding to perform maintenance activities, especially in complex networks such as HCSC.
Thus, operation planning models must be more realistic and take into account maintenance tasks. Several studies have addressed the integration of operation and maintenance planning activities within the scope of a single machine in different areas and applications, such as the inventory control area. According to the author’s knowledge, no work has been done to integrate operation planning and maintenance scheduling in the supply chain.
The study aimed to develop a mixed integer programming (MIP) model to coordinate the operation and maintenance activities of the oil supply chain plants, taking into account the best use of available human resources and maintenance resources, while satisfying the maintenance and operational constraints. The expected outputs of the proposed model are the production volumes, flow quantity, exportation volume, inventory level, as well as maintenance schedules for influential HCSC plants while maximizing profit. Maximizing profit is necessary for any organization to meet financial obligations and support the country’s budget.
The utility of the model is demonstrated using a real case (Saudi Arabia’s oil and gas supply chain). The model is expected to have a positive impact on the future management of this important component of the energy sector. A valuable and practical sensitivity analysis was conducted to study the effect of the key parameters on the obtained results. Some managerial insights will be derived and are expected to help and guide decision-makers as they build their decisions.
The integration of operation and maintenance activities have not been studied adequately, specifically in the supply chain context. In the area of the hydrocarbon supply chain, no work has tackled production planning and maintenance scheduling simultaneously. Therefore, the maintenance scheduling models of petroleum plants and integrated models in the area of inventory control will be reviewed in this section. In the HSCS, operation and maintenance schedules have been treated independently. For example, [1] developed a multi-objective model for the operational planning of the Hydrocarbon supply chain under the assumption of the entities available during the planning horizon. Few studies have studied the maintenance scheduling of single entities of a petroleum network such as the refinery plant. For instance, [2] developed a Mixed Integer Linear Programming (MILP) model for scheduling the preventive maintenance of units of a refinery plant. The proposed model aims to maximize the utilization level of units while satisfying maintenance constraints.
Mendez et al. [3] developed an MILP model for the optimization of the short term blending and scheduling problem in applications of an oil refinery. The model aims to optimize the profit and satisfy the quality requirements. The authors developed a novel method to solve the proposed model. Göthe-Lundgren et al. [4] proposed an MILP model for the production scheduling of the oil-refinery problem. In the proposed model, the production process consisted of two hydro-treatment units and one unit of distillation. The aim of the scheduling was to decide which model of operation to use in each processing unit at each point in time in order to satisfy the demand while minimizing the production cost and considering storage capacities. Antomarioni et al. [5] developed a data-driven model for determining the type of maintenance that should be performed to a refinery plant. Bertolini et al. [6] addressed an approach based on risk inspection and maintenance for maintaining activities in an oil refinery to minimize the risk. A heuristic algorithm was utilized to solve the proposed model, considering the time, human resources, and budget constraints.
Aissani et al. [7] presented a multi-agent approach for the scheduling of dynamic maintenance activities for the petroleum industry using a reinforcement approach. Amaran et al. [8] proposed an MILP model for planning the turnaround activities of interconnected plants in a chemical site. The aim of the proposed model was to maximize the net present value. Awad and Ertem [9] developed a stochastic model to schedule preventive maintenance for an oil refinery plant taking into consideration the uncertainty in maintenance time. The model aimed to minimize the total adjusted tardiness times while satisfying the amount of multiple-skill-level maintenance crew and budget limits. Xu et al. [10] developed a proactive scheduling model for maintaining refinery plants under the uncertainty of crude shipping delays. A mixed-integer nonlinear programming model was developed to optimize crude unloading, transferring, and processing at the refinery plant. Recently, [11] extended the [10] work by integrating proactive and reactive scheduling.
Several studies have tackled the issue of coordinating production and maintenance activities, especially in the inventory control area. The first pioneering work in this field was performed by Rosenblatt and Lee [12], who formulated a model to optimize economic production quantity and at the same time, generate a maintenance plan for a production system. Joshi and Gupta [13] employed the production plans along with a history of machine failure to optimize maintenance activities. In his dissertation, Pintelon [14] proposed an integrated model for production and maintenance planning simultaneously. The aim of the developed model was to find out the period between two consecutive preventive maintenance tasks. Ashayeri et al. [15] proposed an MILP model for scheduling production jobs and the preventive maintenance of a multi-line production system. The aim of the model is to examine the possibility of performing preventive maintenance before a new job or run the job without performing preventive maintenance until a breakdown happened then repair the production system. Rahim and Ben-Daya [16] reviewed inventory models that integrated production planning, quality, and maintenance activities. Iravani and Duenyas [17] developed a policy for a production inventory system operated by a single machine subjected to deterioration. The maintenance and production decisions were optimized by solving the model using the Markov decision process.
Cassady and Kutanoglu [18] developed an integrated preventive maintenance and production scheduling model. The aim of the model was to decrease the overall weighted job slowness. Cassady and Kutanoglu [19] investigated an integrated model for maintenance and production scheduling with the aim to minimize the overall anticipated weighted job completion time. Darwish and Ben-Daya [20] introduced an inventory model combining preventive maintenance and production and taking into account an inspection error. Aghezzaf et al. [21] developed a hybrid production planning and maintenance model for a deteriorating production system. To renew and restore the system, preventive maintenance was carried out on a regular basis, and minimal repair was carried out. Production and maintenance plans have been developed to reduce overall production and maintenance costs. Aghezzaf and Najid [22] extended the [21] work for a system consisting of more than one production line which operates in parallel.
Zied et al. [23] formulated a model for a manufacturing system that was subjected to random failure and assuming the demand was stochastic. The failure rate was assumed to be a function of machine working time and production rate. The output of the model was an optimal production plan combined with a preventive maintenance policy, which minimized the total cost subject to a target service level. Berrichi et al. [24] focused on the problem of maintenance and production planning in a parallel machine case by developing a bi-objective integrated model which enabled the manager to decide the production assignment to machine and plan the maintenance for each machine at the same time. Thus, machines not in duty can be taken for maintenance as per a pre-identified plan. Ayed et al. [25] developed a model for optimizing a manufacturing system that faces random failures. Due to failure, a random shortage demand was substituted by subcontracting from a different production system. It was assumed that the manufacturing system failure rates are both functions of time and production rate. A preventive maintenance schedule was determined to minimize manufacturing system decay.
Fitouhi and Nourelfath [26] formulated an integrated production and maintenance planning model for a single machine that was subjected to random failure. Preventive maintenance is applied periodically, and minimal repair was performed to renew the machine to its normal state. Yalaoui et al. [27] developed a model similar to [22] work for multi-machines. Assid et al. [28] developed a simulation model that integrated production, setup, and maintenance activities simultaneously.
Khosrojerdi et al. [29] developed a robust mathematical model for designing a power supply chain. The model considers planning the power generation and scheduling of preventive and corrective maintenance due to possible failures in the electricity transmission system. Cheng et al. [30] proposed a model for a machining system in which the production rate affects both the cutting tool age and the reliability of the machine. The developed model takes into consideration the addition to production scheduling, a preventive maintenance of the machine, and the tool replacement. Ettaye et al. [31] explored the aspect of integrated production operations and maintenance planning activities at the tactical level of multi-line systems. The policy of maintenance provides preventive substitutions at the start of every cycle as well as minimal repairs in the event random failures occur. The aim of the model was to minimize the total costs and concurrently determine the maximum production plan alongside the replacement time.
Géhan et al. [32] presented a joint optimization model for integrating master production schedule and maintenance strategy for a manufacturing system. The proposed policy allows minimizing the impacts of potential random failures. A heuristic algorithm was invented for solving the proposed model. Liu and Lv [33] discussed a maintenance optimization strategy for a multi-component system with the use of the degradation information of the system. They argued that combining the maintenance activities was cheaper than having each component of a system planned separately. Zhao et al. [34] proposed a model for the integration of maintenance and production planning considering the production losses due to preventive maintenance, corrective maintenance and operation dependent failures. Hnaien et al. [35] discussed the problem of integrating production planning and preventative maintenance for a single machine in order to maximize its production capacity. A mixed-integer linear programming model was proposed to tackle the problem.
Askri et al. [36] proposed a preventive maintenance and production policy for a manufacturing system consisting of parallel machines considering the lease contract. The aim of the proposed model was to determine the economical production quantity and the preventive maintenance interval for the machines while minimizing the total cost of production and maintenance. Amiri and Honarvar [37] investigated a bi-objective mathematical model which integrated both tasks; preventive maintenance planning and energy hub components repair under the assumption of stochastic demand. Khatab et al. [38] discussed the integration of production quality and the condition-based maintenance of a single-machine production system. The problem tackled assumes that a machine will have some product defects after a certain level of degradation. The model considers the inspection time and preventive maintenance to reduce off-specification products.
The oil and gas supply chain includes many petrochemical plants such as sweetening plants, refinery plants, gas plants, and fractionation plants which constitute connected and advanced equipment to help maximize the value of the petroleum product. To reduce the sudden breakdown, prolong their lives, and minimize the lifetime cost of energy, both operations and maintenance costs need to be optimized simultaneously. Similarly, renewable energy plants such as onshore/offshore wind energy plants involve many connected units that need to be maintained regularly. Wind power is often considered as an expensive source of energy. Therefore, coordinating operations and maintenance decisions will reduce the costs for operations and maintenance which indicates that there is large potential in cost-savings. Several studies have optimized operation and maintenance scheduling for renewable energy power plants applications. For example, Rinaldi et al. [39] developed an optimization model to coordinate the operation and maintenance activities for offshore renewable energy farm. Martin et al. [40] studied the integration of operation and maintenance scheduling of an offshore wind farm by conducting a sensitivity analysis to identify the most significant factors affecting availability and operation and maintenance costs.
Rinaldi et al. [41] optimized the operation and maintenance activities of an offshore wind farm using genetic algorithms in order to minimize operation and maintenance costs of the offshore farm while maximizing both the availability and reliability. Helsen et al. [42] studied the optimization of the operation and maintenance strategy of a wind farm using a big data approach with the aim to understand the failure mechanisms of wind turbines. Nielsen and Sørensen [43] developed a mathematical model for operation planning and maintenance scheduling of a single wind turbine. Both condition-based and corrective maintenance are compared taking into consideration constraints of design and inspection. Dinwoodie [44] developed a mathematical model for coordinating the operation and maintenance decisions for an offshore wind farm. This model minimizes the lifetime cost of energy by optimizing both the operations and maintenance costs of offshore wind farm. Seyr and Muskulus [45] conducted a comprehensive review on the area of operation and maintenance of offshore wind farms.
The above literature review revealed that the integration of operation and maintenance activities in the oil and gas supply chain area has not been tackled; however, several studies have addressed the integration of operation and maintenance activities in the scope of a single entity in different areas and applications such as inventory control. To the author’s knowledge, no work has appeared in the literature to integrate operation planning and maintenance scheduling for HCSC. Therefore, this paper fills the aforementioned gaps.

2. Materials and Methods

The focus of this research is on developing an optimization model for integrating operation planning and the turnaround maintenance of oil and gas supply. To achieve the research objectives and answer the research question, a systematic approach is followed as: first, the problem is formulated, and an optimization model is developed. Second, the actual case study employed to study the utility of the proposed model is presented. Finally, the output findings are discussed, and a sensitivity analysis is conducted to study the impact of changes in input parameters on the optimal findings.

2.1. Problem Statement

Hydrocarbon supply chain (HCSC) is a complex and long network extending from the production of crude oil and natural gas to marketing the oil and gas products. The entities along the HCSC constitute oil and gas fields, oil and gas separation plants (GOSPs), primary storage facilities, oil and gas processing plants, refinery plants, fractionation plants, secondary storage facilities, and demand nodes. The crude oil from oil fields and/or GOSPs is pumped to oil processing plants for removing sulfur. After removing the sulfur, the oil is shipped to international and local terminals. Locally, the crude oil is further transformed in refinery plants into its oil by-products (i.e., diesel, naphtha, gasoline, Liquefied Petroleum Gas (LPG), fuel oil, asphalt, and kerosene). The oil by-products are then used to satisfy international and local demands. The associated natural gas produced at gas–oil separation plants (GOSPs) and the non-associated natural gas produced directly from pure gas fields are streamed to gas plants in which they are processed into natural gas liquid (NGL), methane and hydrogen sulfide. The methane is used as a raw material by industry, and the NGL is fractionated in fractionation plants into its gas products (i.e., ethane, propane, butane, and natural gasoline) used to satisfy the local and international demand. A general representation of the entities of the HCSC are shown in Figure 1.
In the real-world, HCSC plants might be totally or partially unavailable due to periodic maintenance and sudden shutdown. Thus, their production capacities will be reduced or reach zero. To restore these plants to their full capacities and keep them in good condition, plants should be maintained regularly and routinely to prevent unplanned failures, increase plant production rates, and prolong their life. Thus, operation planning models need to be more realistic and should consider maintenance scheduling. The maintenance cycle and duration of petroleum plants such as oil processing plants, refinery plants, gas plants, and fractionation plants must be identified before model formulation.
The aim of the proposed MIP model is to coordinate the operation and maintenance activities of the HCSC plant network, taking into account the best use of available manpower and maintenance resources, while satisfying maintenance and operational constraints. The objective of the proposed model is to maximize the HCSC profit. The model will help to determine the optimal production, inventory and transport volumes and at the same time, generate an optimal maintenance schedule. Each HCSC plant is assumed to have its own storage facility to satisfy the needs during planned and/or unexpected failures, as well as a plant shutdown. In the hydrocarbon industry, inventory is an important and expensive asset; therefore, it is important to manage the inventory level and specify their capacities precisely.

2.2. Mathematical Model

In this section, an integrated operation and maintenance scheduling model was developed. The sets, indices, variables, and parameters used in the proposed model are summarized in Table 1.
After defining the notations required for model development, the constraints and objective functions will be formulated below:
The following constraint limits the number of times a plant i has to be maintained during the planning horizon:
t T S t i t = u i             i { N 1 , N 2 }
The efficiency of the maintenance at time-period intervals is implemented by equating the corresponding binary variables using the following equation where fi represents the length of time between each maintenance activity for a plant i. For instance, if a particular plant i has been maintained at time t, the second maintenance task will be performed at time t + f:
S t i t = S t i   t + f i           i { N 1 , N 2 } , t T
The size of the crew needed to perform maintenance jobs in plant i should not exceed the available manpower. The following constraint is added to ensure that there should be no maintenance task for the same crew while they are maintaining other plants. In addition, no more than a fixed number of plants can be served at the same time due to the limited number of crew available. This constraint can be represented mathematically as follows:
τ = t n i + 1 t S t i τ   R i t W i t           i { N 1 , N 2 } , t T
The material balance of the plants belong to the first level of HCSC (oil processing plant and gas plants) are represented by Equation (4) where the material flow from the upstream is equal to the the production volumes at each plant i. The processed quantities are then sent to the next level of the HCSC (refinery plants; N2, fractionation plant; N2 and demand node; N3) to satisfy the local and international demands:
r w i t p   Y i t r = j N 2 X i j t p + j N 3 X i j t p           t T , p P ,   i N 1
The inlet to the second level of the HCSC (refinery plants and fractionation plant) is then processed and fractionated to its by-products based on the inlet compositions. The by-product flow is then forced to the third level of the HCSC to satisfy the local and international demands N3, Equation (5):
p i N 1 w i j t b X i j t p = k N 3   X j k t b           t T , b B ,   j N 2 ,   k >   i
The material balance for the storage tanks belongs to the first and the second levels of the HCSC which are denoted by the two constraints:
i N 1 X i j t p + I i t 1 p = j N 2 X j k t p + j N 3 X j k t p + I i t p           t T , p P ,   j S 1 ,   k >   i
The inlet flows from the upstream plants to each store tanks plus inventory left from the previous period (t − 1) equal to the outlet from the store tank plus inventory level at time period t:
i N 2 X i j t b + I i t 1 b = + j N 3 X j k t b + I i t b           t T , b B ,   j S 2 ,   k >   i
The inlet flows from plants located at the second level to each store tanks plus inventory left from the previous period (t − 1) equal to the outlet from store tank plus inventory level at time period t.
The inlet to any petroleum plant is limited to the plant’s capacity. If a plant is in maintenance, the capacity is dropped to zero. Equations (8) and (9) represent the capacity constraints for the plants belong to the first and the second levels of HCSC, respectively:
r R Y i t r ( 1 τ = t n i + 1 t S t i τ ) C a i t           i N 1 , t T
i N 1 p P   X i j t p   ( 1 τ = t n j + 1 t S t j τ ) C a j t           j N 2 , t T
The storage tanks’ capacities are restricted by the following two constraints:
C S j m i n I j t p C S j m a x           j S 1 ,   p P ,   t T
C S j m i n I j t b C S j m a x           j S 2 , b B , t T
Exportation volumes from each crude oil type should not exceed the quota specified by OPEC to each member in the Organization of the Petroleum Exporting Countries, Equation (12). In this study, maintenance was carried out on a weekly basis, while demand is on a monthly basis. Therefore, D p t represents the set of time periods included in the demand period starting at time t, and dt denotes the duration of the demand period:
i N 1 j N 3 p P t D p t   X i j t p O P E C t           D p t = { t , , t + d t }
Equations (13) and (14) denote that the amount of sales plus shortages minus excess equals demand at any time period t:
i N 1 t D p t   X i j t p + X i t p +   X i t p = D j t p           j N 3 , p P , D p t = { t , , t + d t }
i N 2 t D p t   X i j t b + X i t b + X i t b = D j t b           j N 3 , b B , D p t = { t , , t + d t }
The profit Equation (15) involves two main parts: the revenue obtained minus expenses, which includes maintenance costs, processing costs, transportation costs, holding costs, and the penalty costs of producing over and under the specified demand.
M a x f = [ i N 1 j N 3 p P t T S p j t p   X i j t p + i N 2 j N 3 b B t T S p j t b   X i j t b ] [ i N 1 , N 2 t T S t i t   R i t τ t + n i 1 C m i τ + i N 1 r R t T C p i t r Y i t r + i N 1 j N 2 p P t T C p i j t p   X i j t p + i N 1 j N 2 p P t T C t i j t p X i j t p + i N 2 j N 3 b B t T C t i j t b X i j t b + i S 1 p P t H c i t p   I i t p + i S 2 b B t T H c i t b   I i t b + i N 3 p P t W i t p + X i t p + + i N 3 p P t W i t p X i t p + i N 3 b B t W i t b + X i t b + + i N 3 b B t w i t b X i t b ]

2.3. Case Study

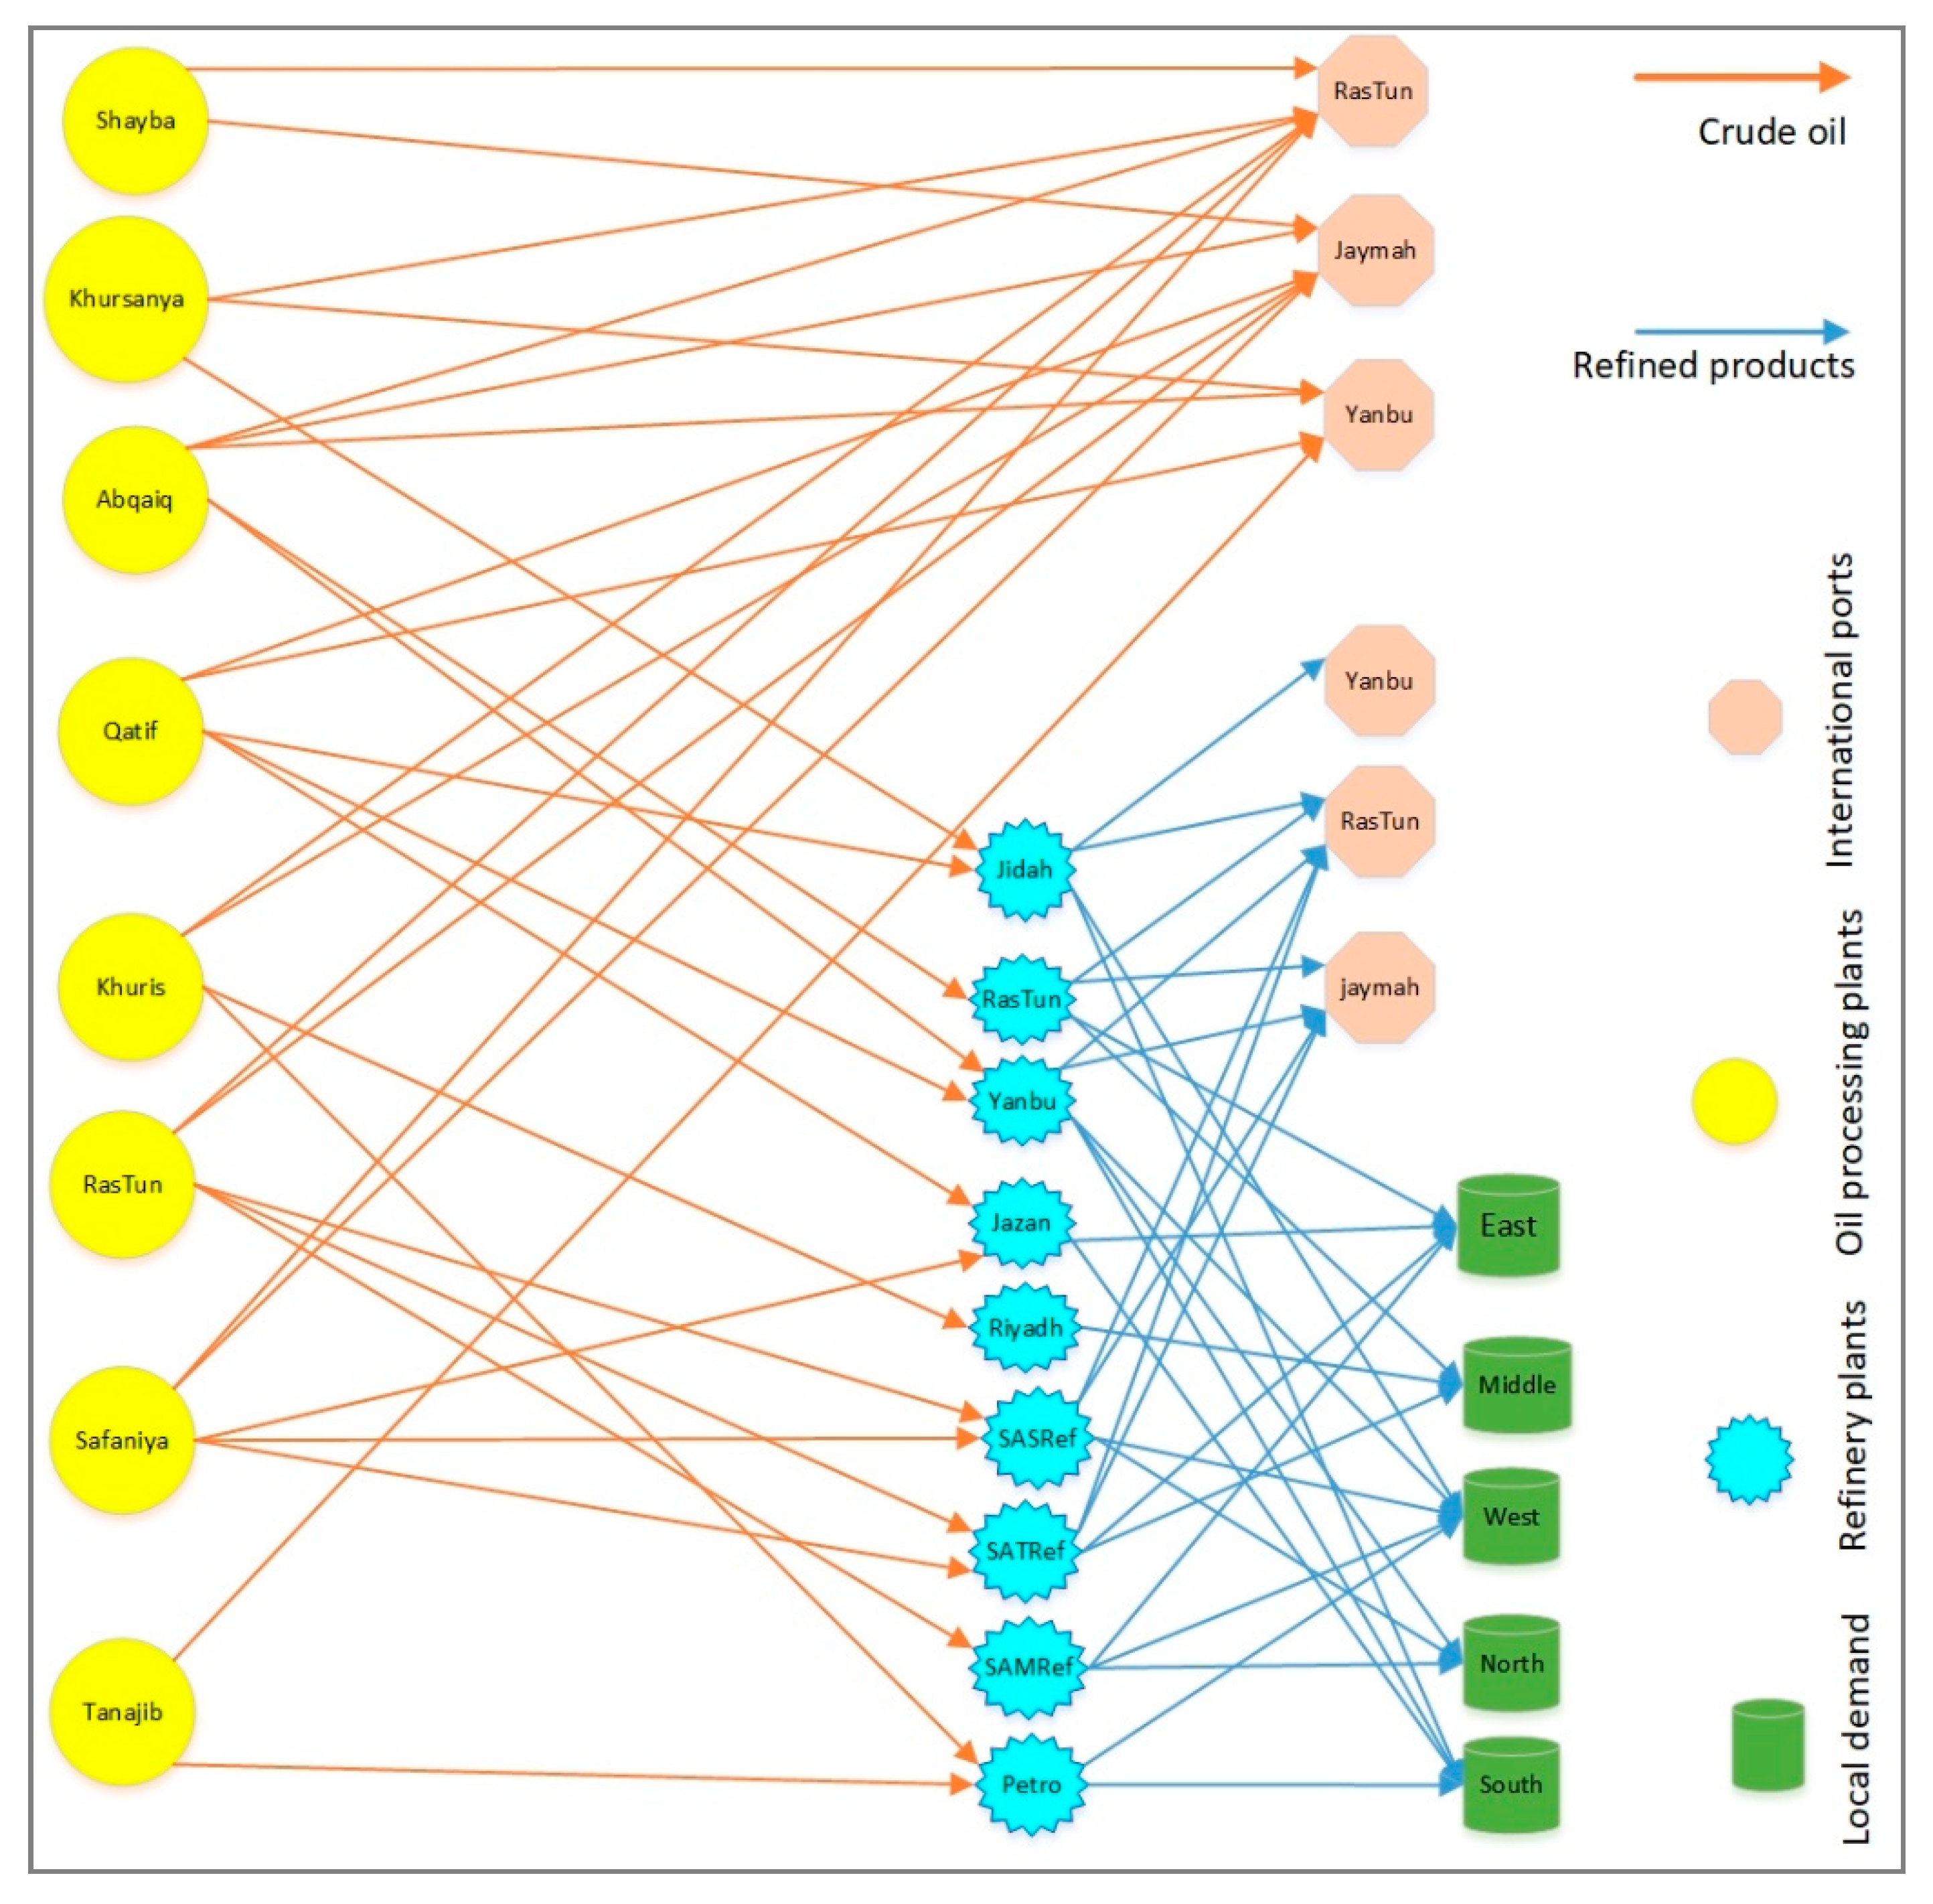
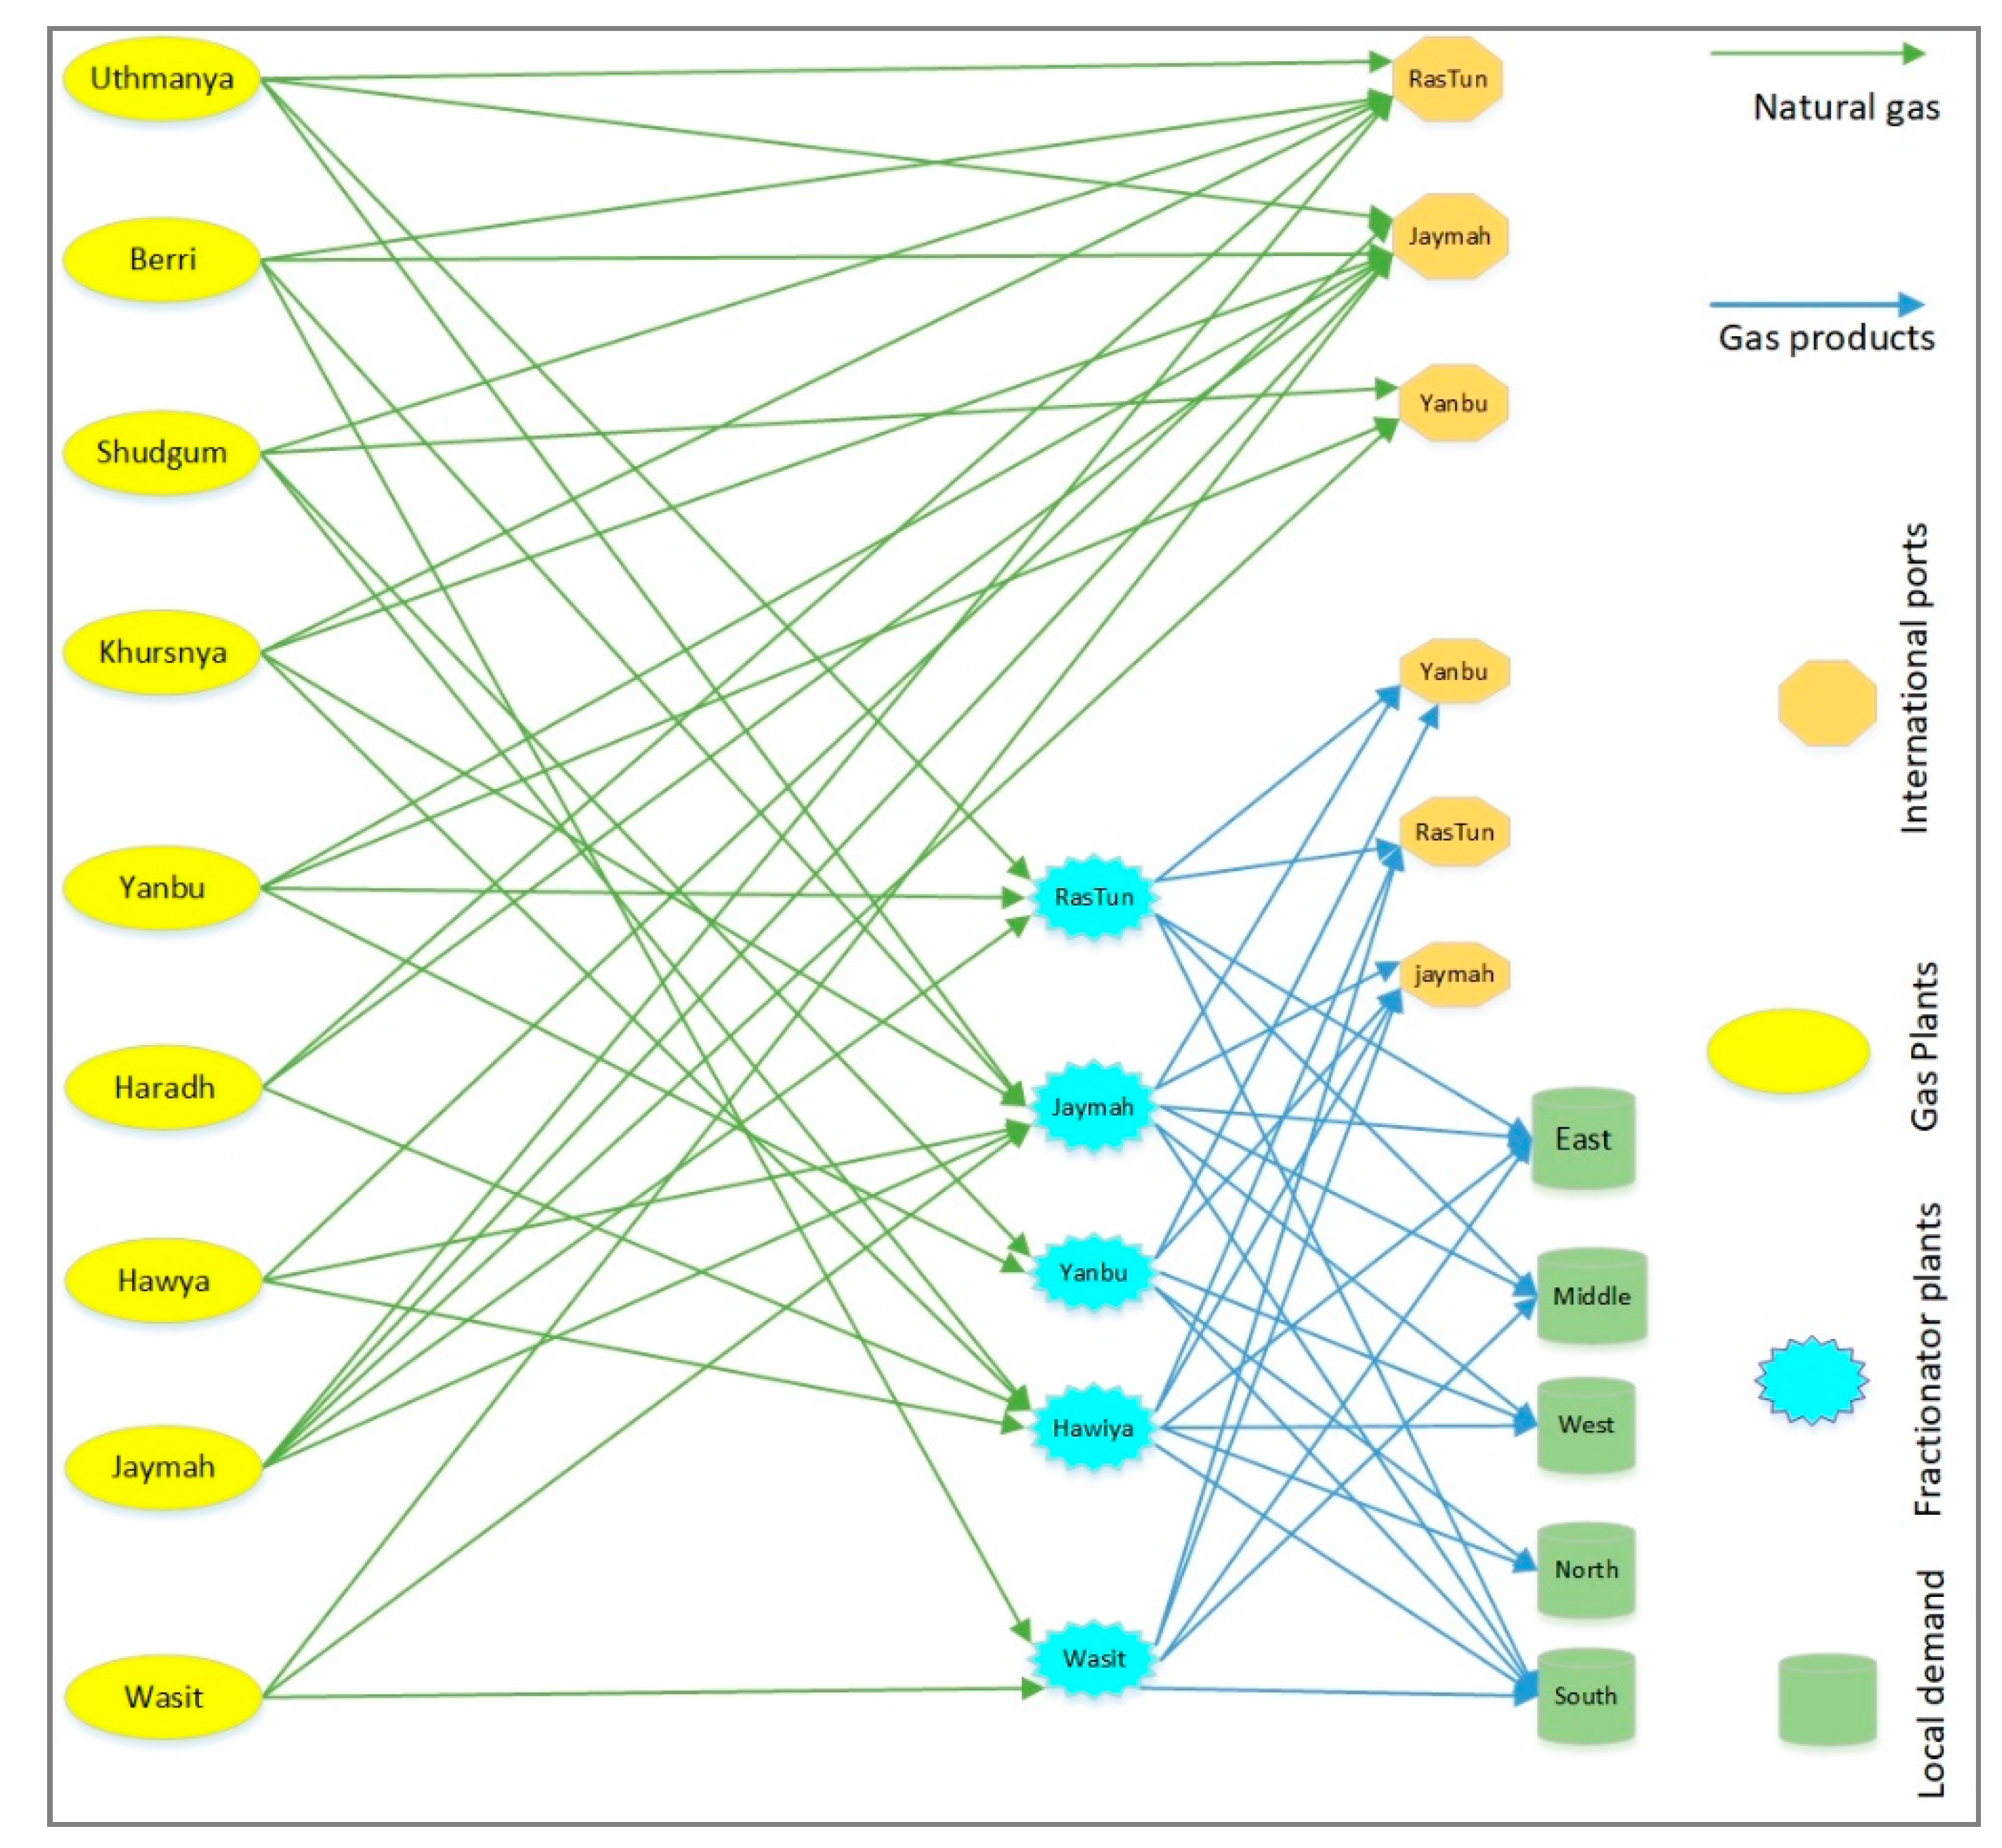
The Saudi Arabian oil and gas network was used to validate the proposed model. The entities of the oil and gas supply chain with the corresponding units and relevant data are reported below. The planning horizon was four years and discretized over 192 weeks. To simplify the development of a complex HCSC network, the supply chain was divided into two subnetworks shown in Figure 2 and Figure 3. The HCSC network is a representation of Figure from [46].
The flow and operation of the HCSC is as follows: wellhead oil of different grades; Arabian light, Arabian extra light, Arabian medium, and Arabian heavy produced in upstream units of the HCSC are transported through pipelines to eight (8) oil processing plants for the processing and removal of sulfur. The crude oil is then transported to three (3) major international terminals and (9) local refineries where crude oil is transformed into seven (7) by-products (LPG, naphtha, gasoline, diesel, kerosene, fuel oil, and asphalt) based on their yield. Oil by-products are then distributed to meet the needs of local customers in the main five (5) regions of the Kingdom and three (3) major industrial cities. Parts of LPG, naphtha, and fuel oil are used to meet international demand through terminals.
On the other side, the associated and non-associated natural gas streams produced at gas–oil separation plants (GOSPs) and gas fields, respectively, are transported to nine (9) gas plants for the impurity removal and recovery of hydrogen sulfide. The output gases are NGL and methane. The NGL is supplied to five (5) fractionation plants for the further separation and fractionation into gas products (ethane, butane, propane, and natural gasoline). Part of NGL is exported through international terminals to meet international demand, while methane and ethane are used to meet local demand. At the same time, propane, butane, and natural gasoline meet the demands of international and local customers.
Entities such as oil processing plants, refinery plants, gas plants, etc. will be totally or partially unavailable due to failures or planned maintenance. Thus, their production capacity may be reduced or reached zero. Maintenance is used to restore these entities to their full capacity and keep them in good condition. Each HCSC plant is assumed to have its own storage facility to satisfy needs during planned and/or unexpected failures. In HCSC, inventory is an expensive asset that needs to be considered. Therefore, it is essential to manage inventory levels and capacities. Therefore, when optimizing the HCSC, there is a need to consider operation and maintenance activities in an integrated manner. In this study, a proposed MILP model will be developed and solved. The model will jointly produce a maintenance schedule for each HCSC plant and operational plans such as production volumes, transported volumes, inventory levels, shortages, and excess volumes, etc.
To develop a proposed model, the maintenance cycle and duration for oil processing plants, refinery plants, gas plants, and fractionation plants must be specified, and logical relationships between plants need to be considered. For example, dependent plants are preferred to be stopped for maintenance simultaneously. In addition, similar operating units cannot be taken for maintenance at the same time in order to prevent a huge loss in production. As per consultation with people working in the oil industry, the average maintenance duration for the HCSC plant is between 3–4 weeks. It is assumed that every HCSC plant needs to be maintained twice over the four-year planning horizon. The maintenance crew required to perform maintenance activity in each HCSC plant is ten workers, and the total number of crews available is 20. Every worker earns, on average $120 a week.
Real data were collected from [1,47,48] and were used as input to the proposed model to evaluate its utility. To represent the above stated problem, the MIP model has been developed and solved using the CPLEX 13.3 commercial solver [49]. All computations were done on a PC type intel (R) Core (TM)2 Quad CPU processor with 2.67 GHz and 4 GB RAM using the GAMS (General Algebraic Modeling System) [50]. The model output will be discussed and analyzed in the following sections.

3. Results

To investigate the utility of the proposed model, the Saudi Arabian oil and gas supply chain was employed. The entities of the HCSC with their associated units and relevant data are reported in Section 4. The planning horizon is four years with a one week planning period. In this study, maintenance tasks are carried out on a weekly basis, while demand is on a monthly basis.
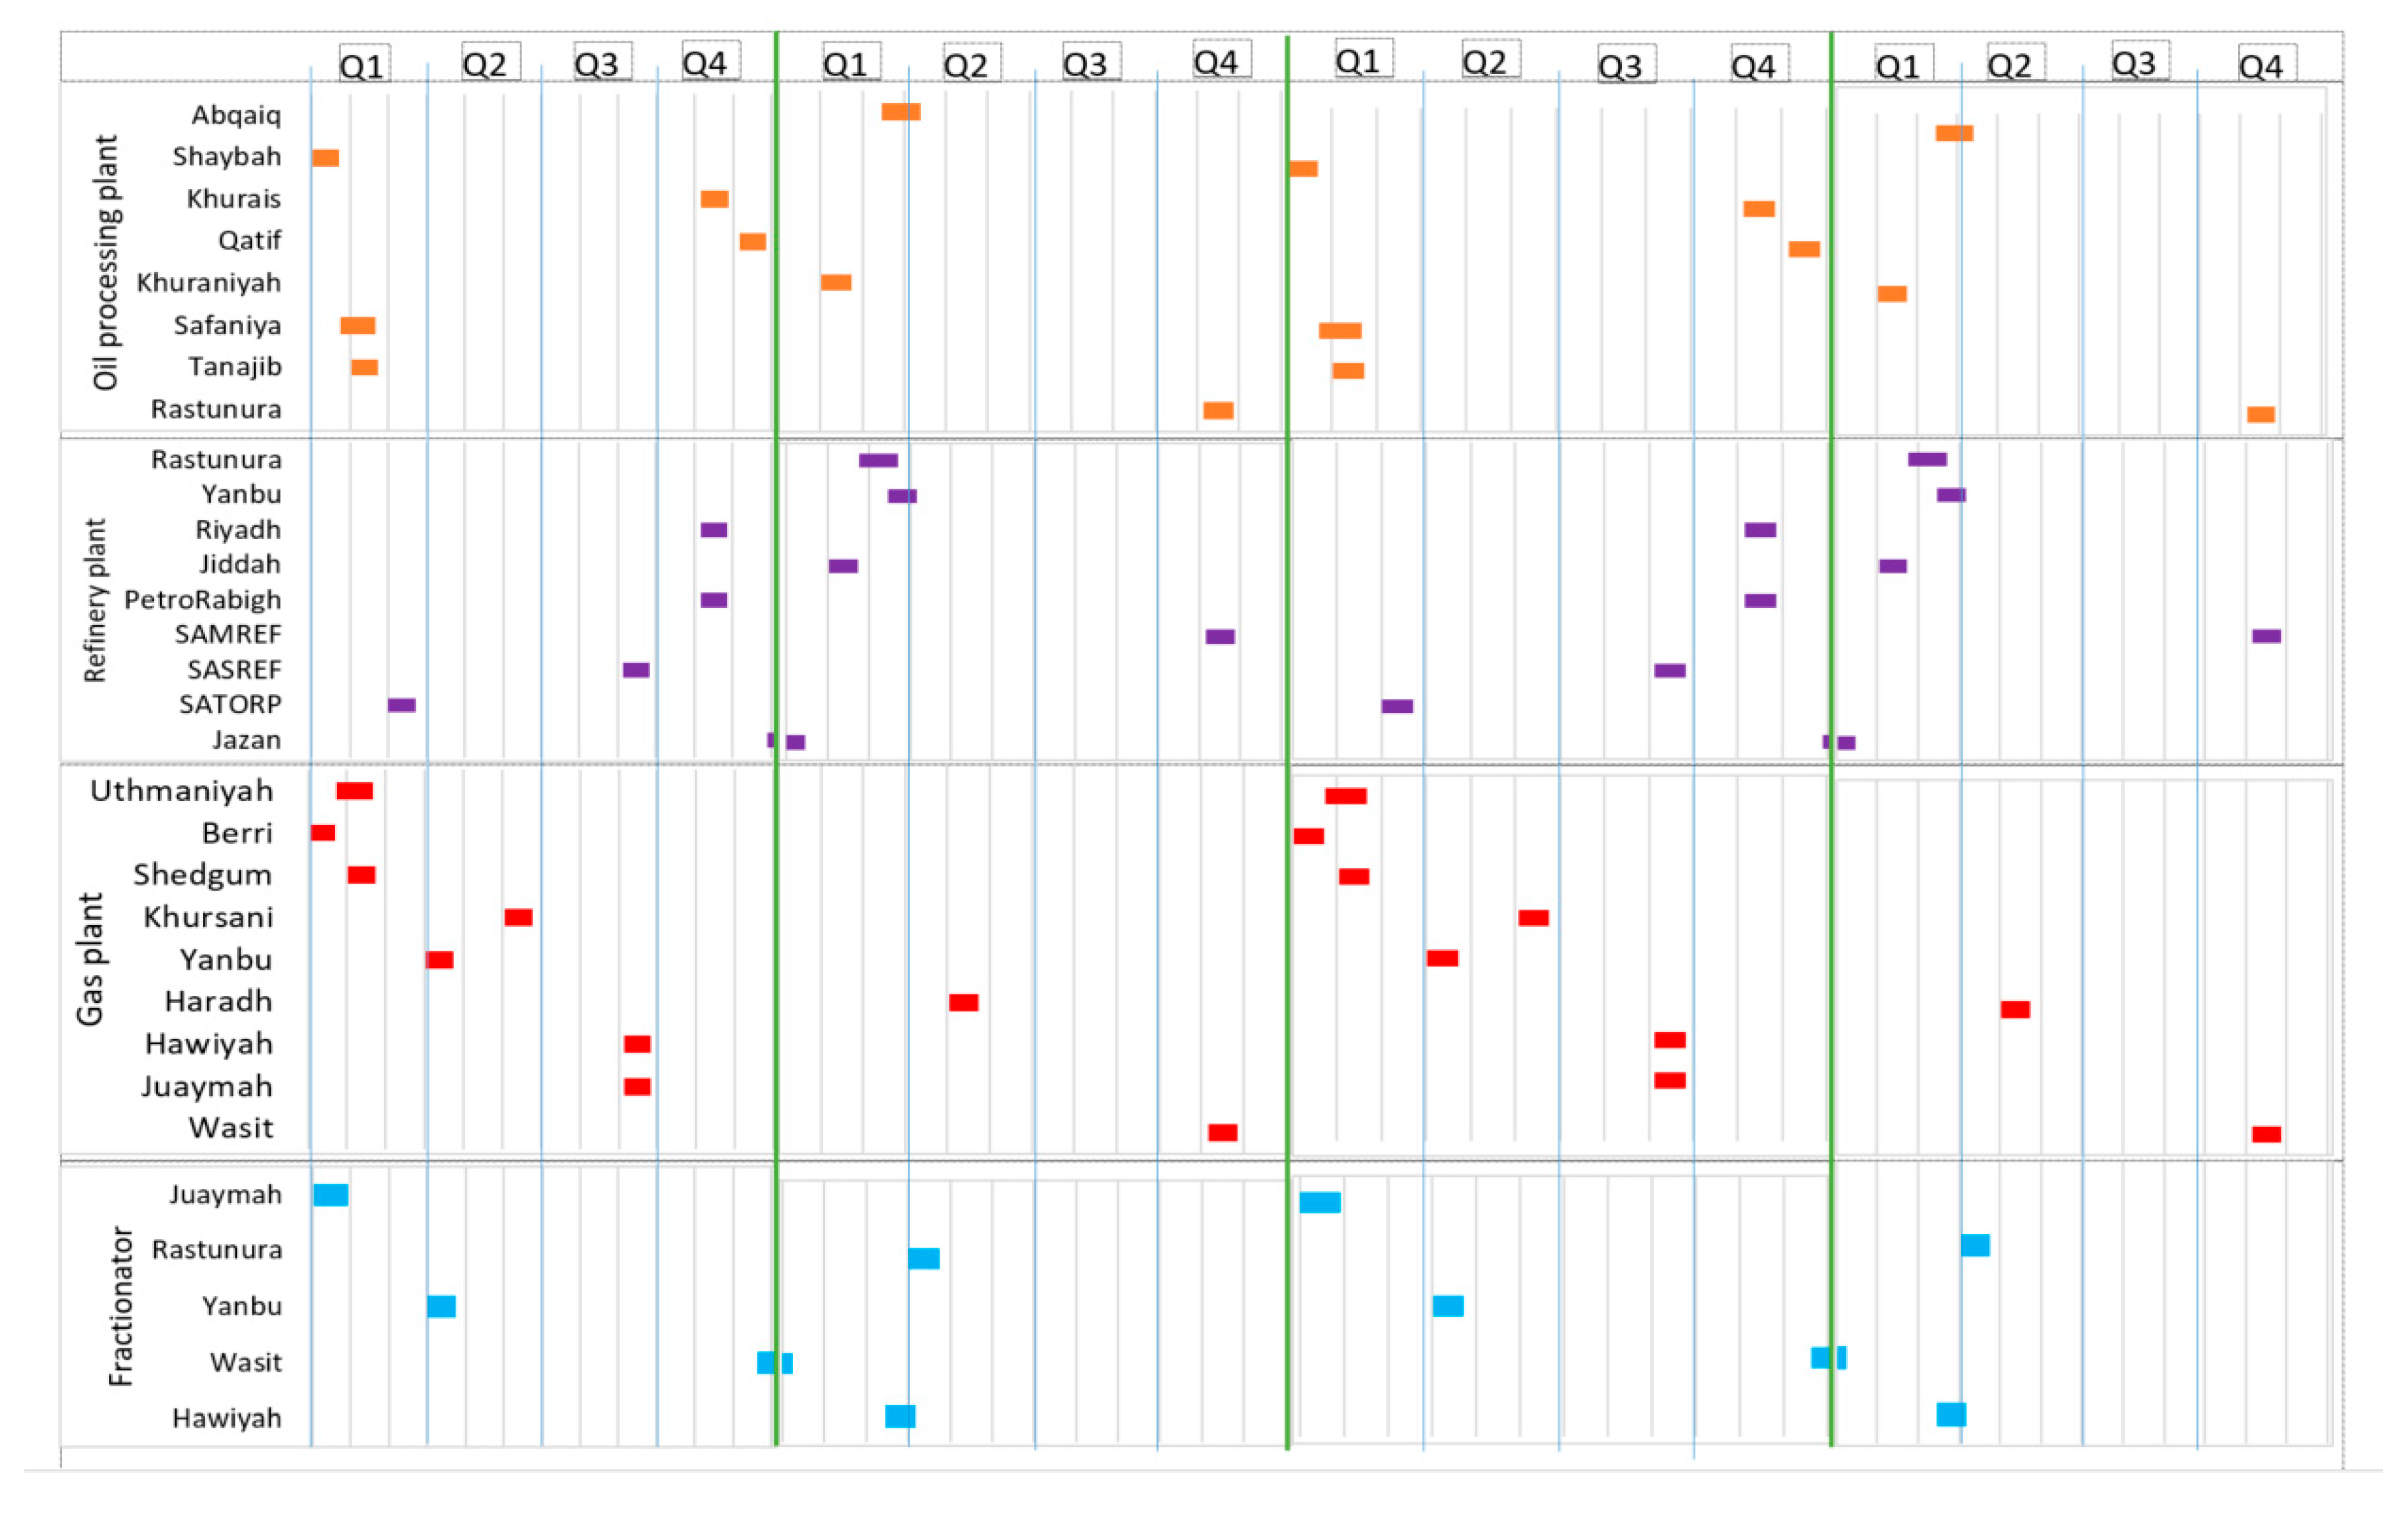
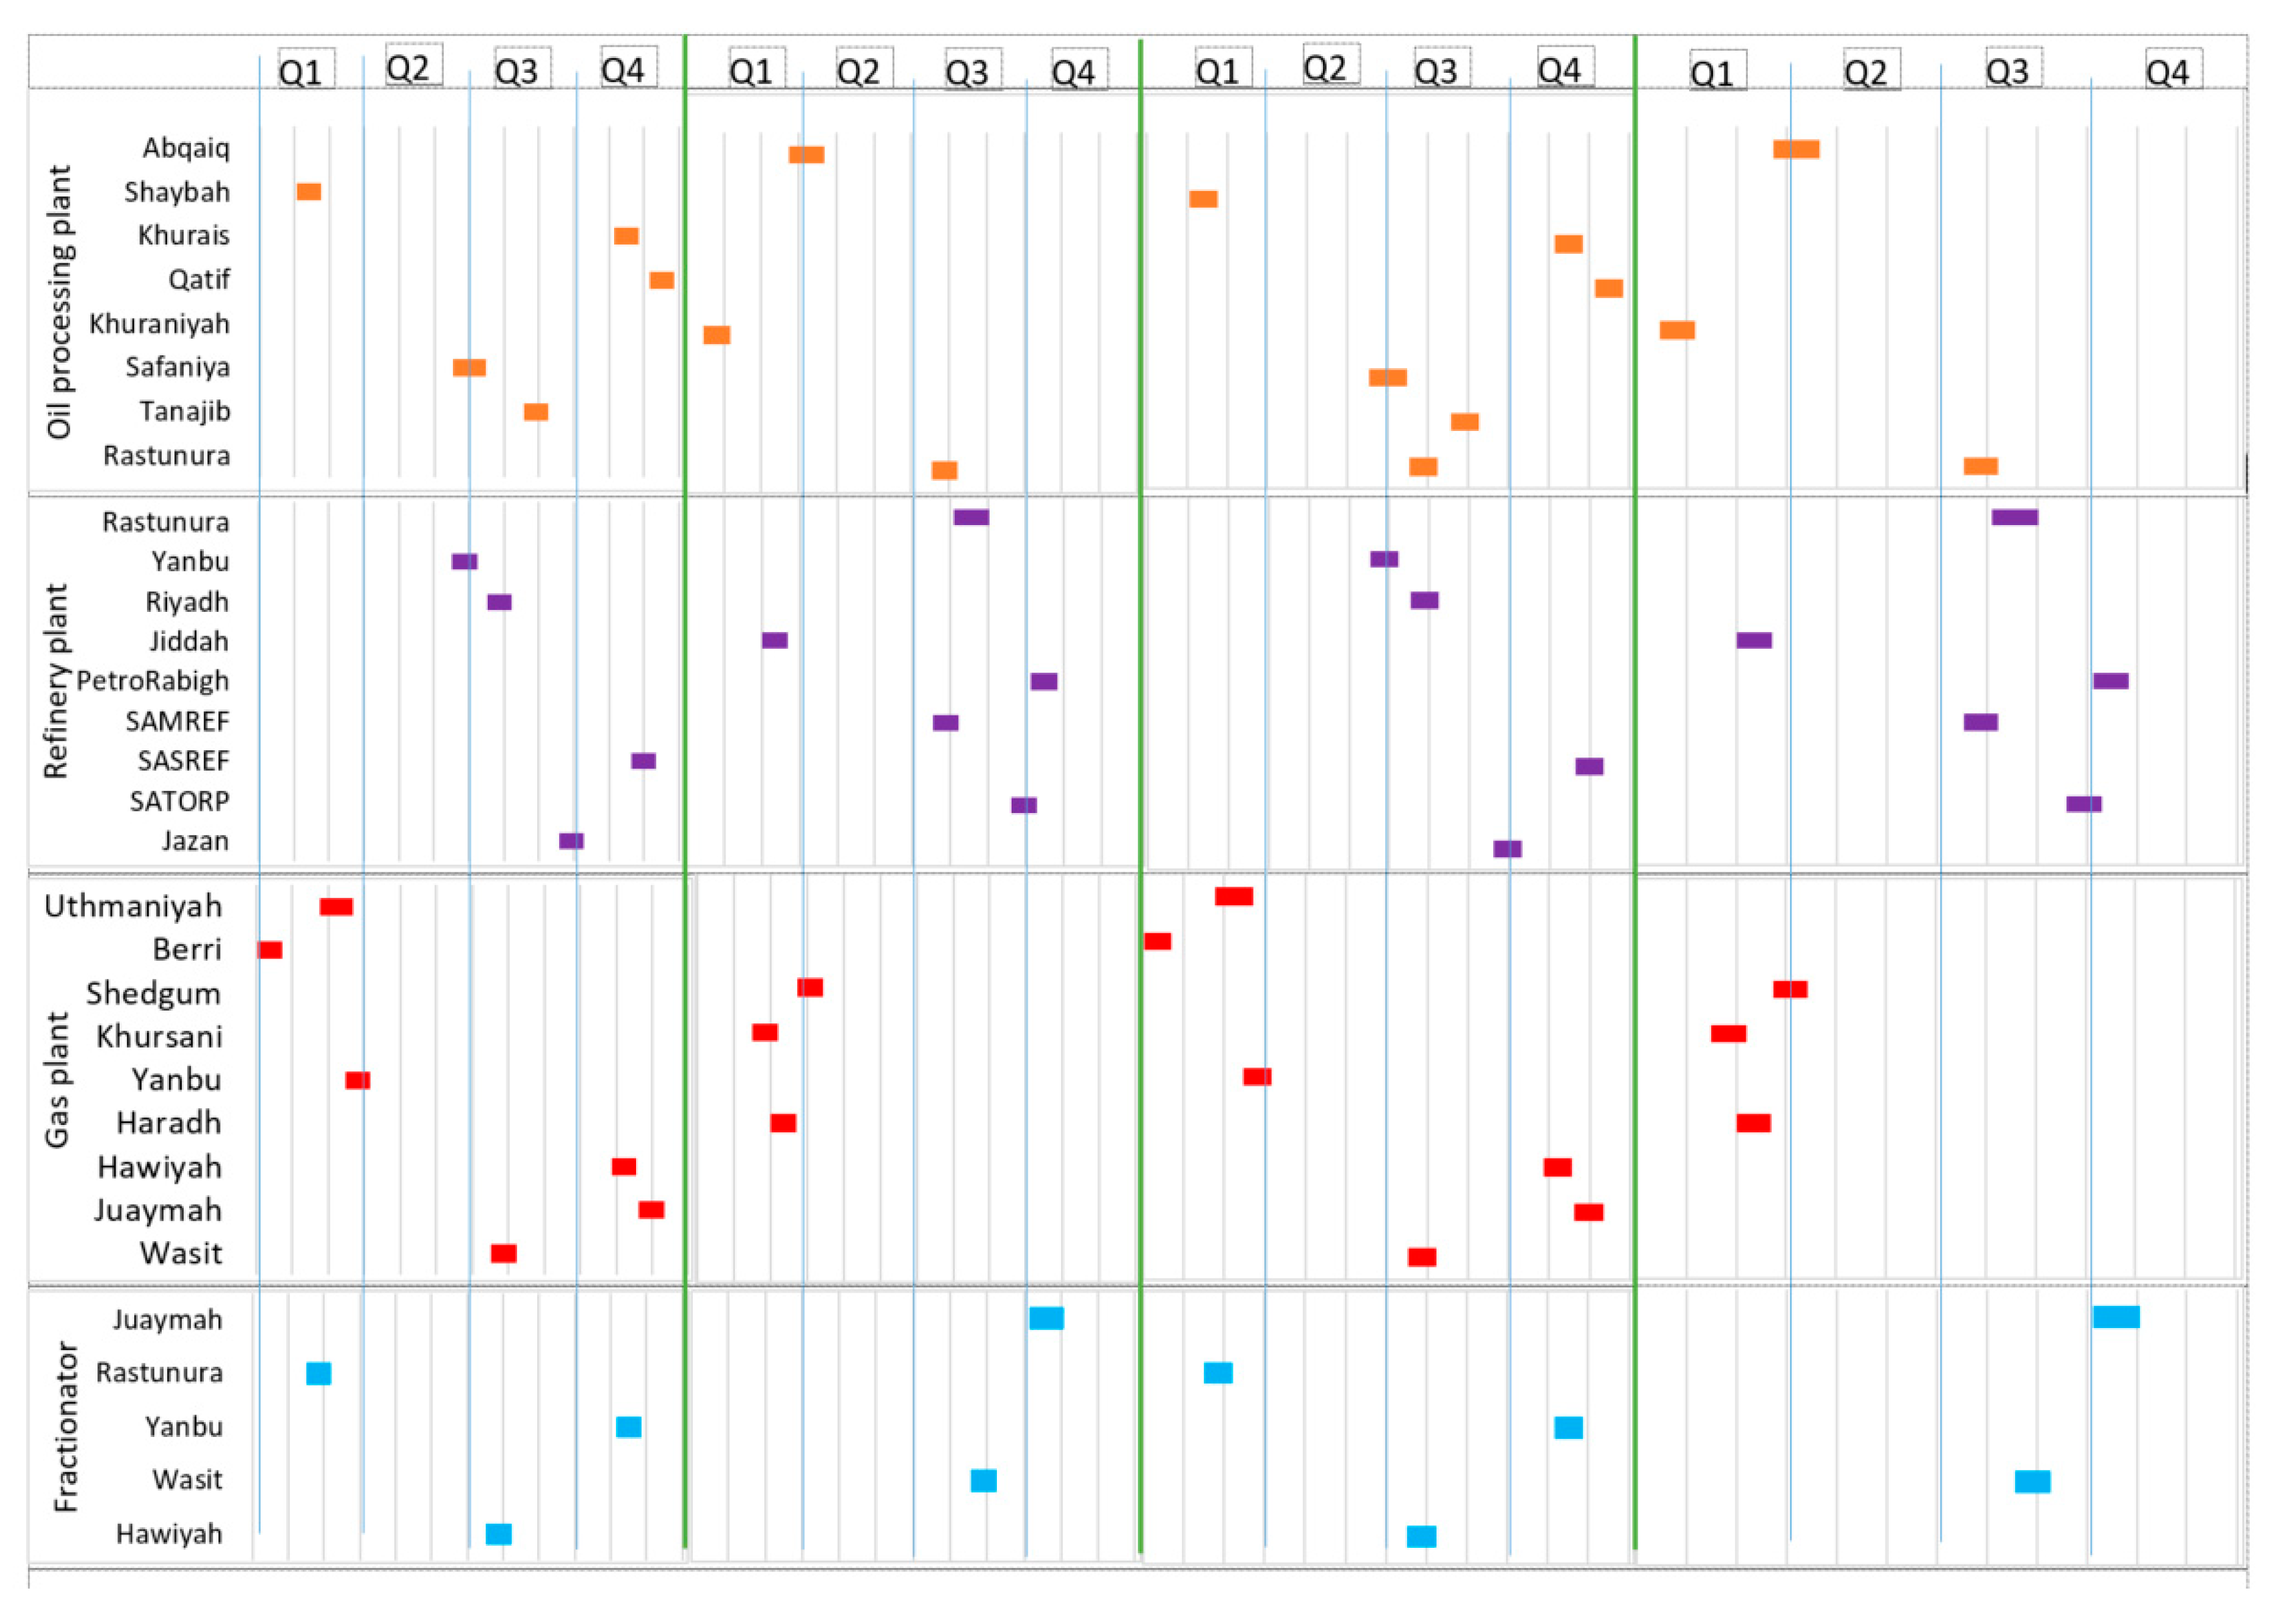
The maintenance schedule for all HCSC entities over the planning horizon is displayed in Figure 4. The Gantt chart shows a schedule displaying which each unit will be taken for maintenance and in which weeks. The width of the bar indicates the duration of maintenance in weeks.
The following conclusions can be derived to describe the Gantt chart:
  • It was observed that the proposed model distributes maintenance activities uniformly and perfectly among the HCSC plants along the time horizon of four years.
  • In addition, it is shown that the model minimizes the amount of lost sales by forcing most of HCSC units to be maintained during the months of low demand. Almost all HCSC units are taken for maintenance during the quarters of low demand (quarters 1, 2, and 4). The third quarter is the summer period, which represents the months of high demand.
  • The HCSC is a complex network that involves multi-connections where each plant belongs to the upstream is connected to more than one downstream plant and even to more than one demand node. Similarly, each plant has tanks with enough capacity to feed the associated downstream plants during the maintenance period. This situation provides flexibility for choosing maintenance timing. Therefore, the majority of HCSC plants were taken for maintenance randomly at different times.
  • Few connected plants have been taken for maintenance at the same time. For instance, Abqaiq oil processing plant and RasTunura refinery plant are maintained simultaneously. Similarly, both the Tanajib oil processing plants and PetroRabigh refinery plant are maintained at the same time.
  • For natural gas plants, maintenance tasks are decoupled; almost all connected upstream and downstream plants are maintained randomly because each downstream plant has connections with more than one upstream unit, and the storage capacity is enough during the maintenance time. In the sensitivity analysis section, the impact of upstream storage capacities on maintenance schedule and arrangement will be investigated.
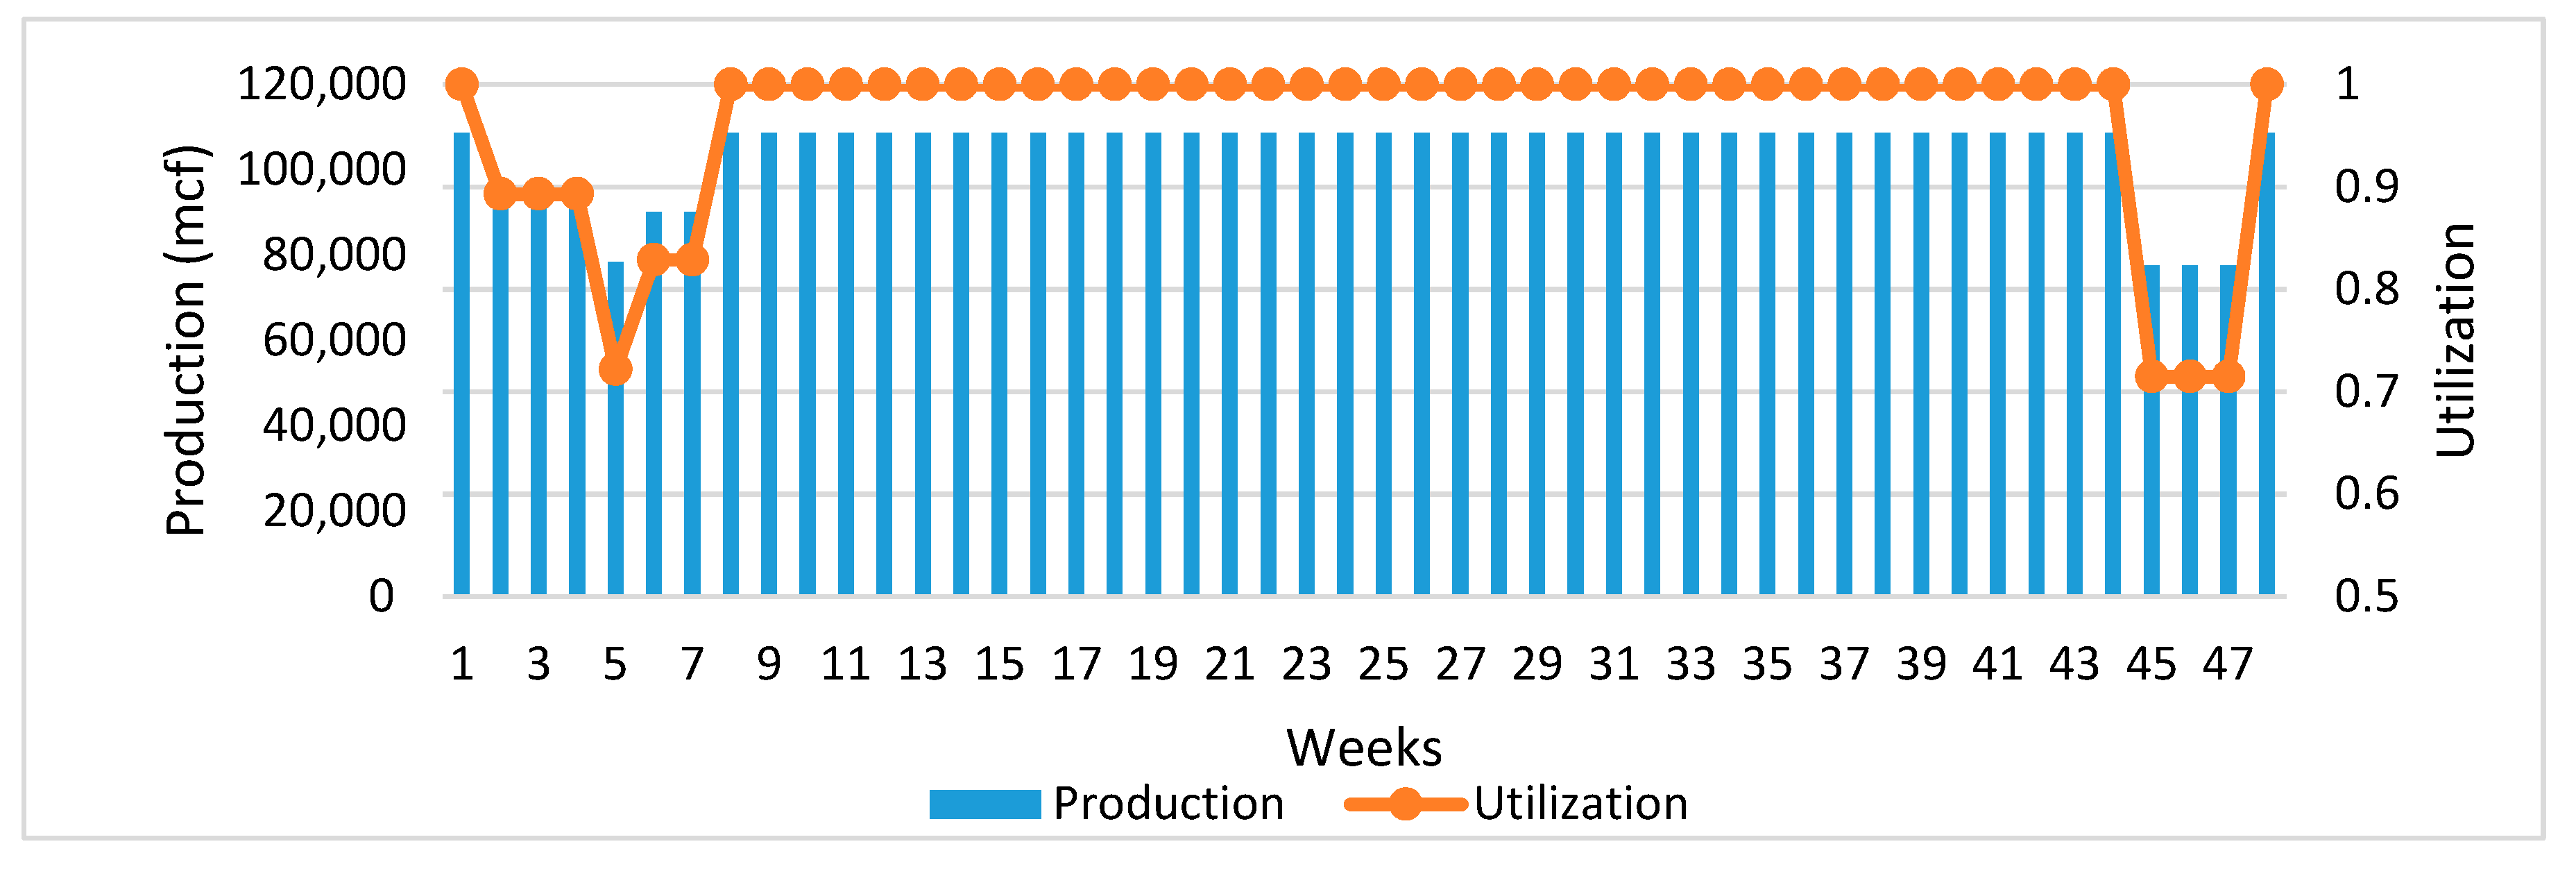
For the deep investigation, a sample of output for some selected plants will be displayed. For instance, the maintenance schedule, utilization, and production for gas plants during the first year are shown in Figure 5. The third quarter represents the months of the highest demand. Therefore, almost all gas plants have been taken for maintenance during the months of the demand (Quarters 1, 2 and 4).
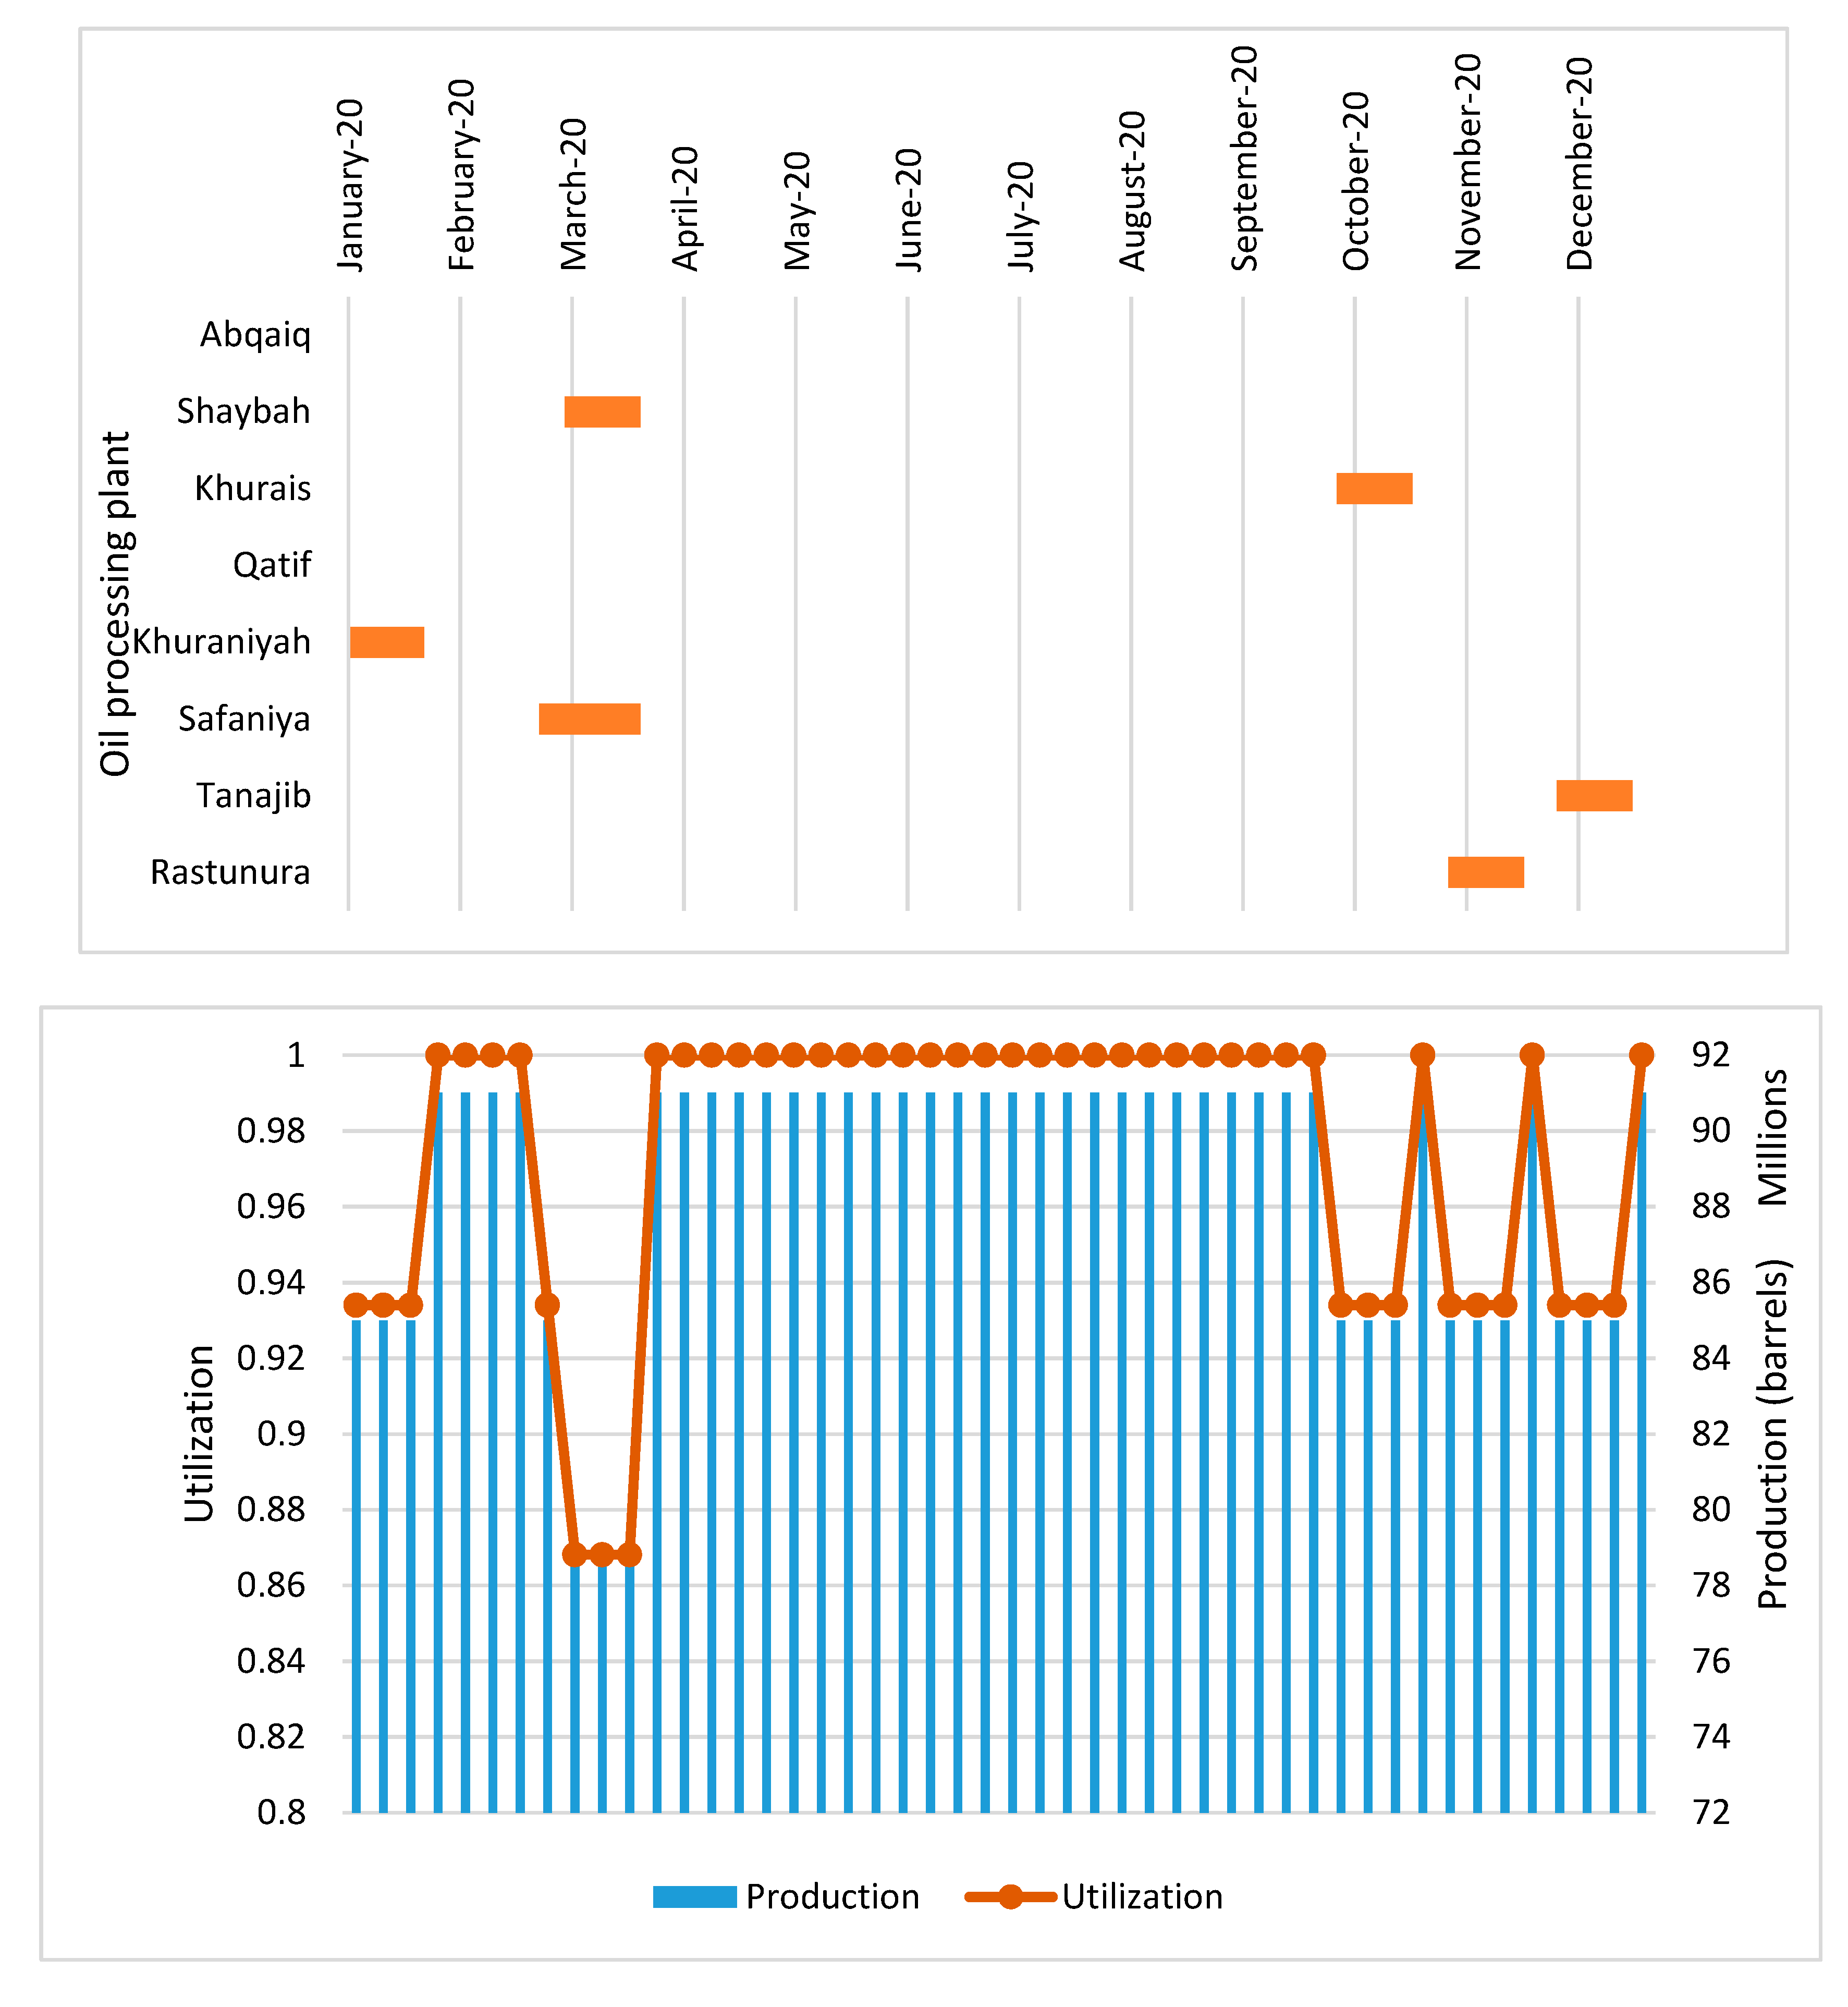
Similarly, Figure 6 shows the oil processing plants’ maintenance schedule, production, and utilization for the first year.
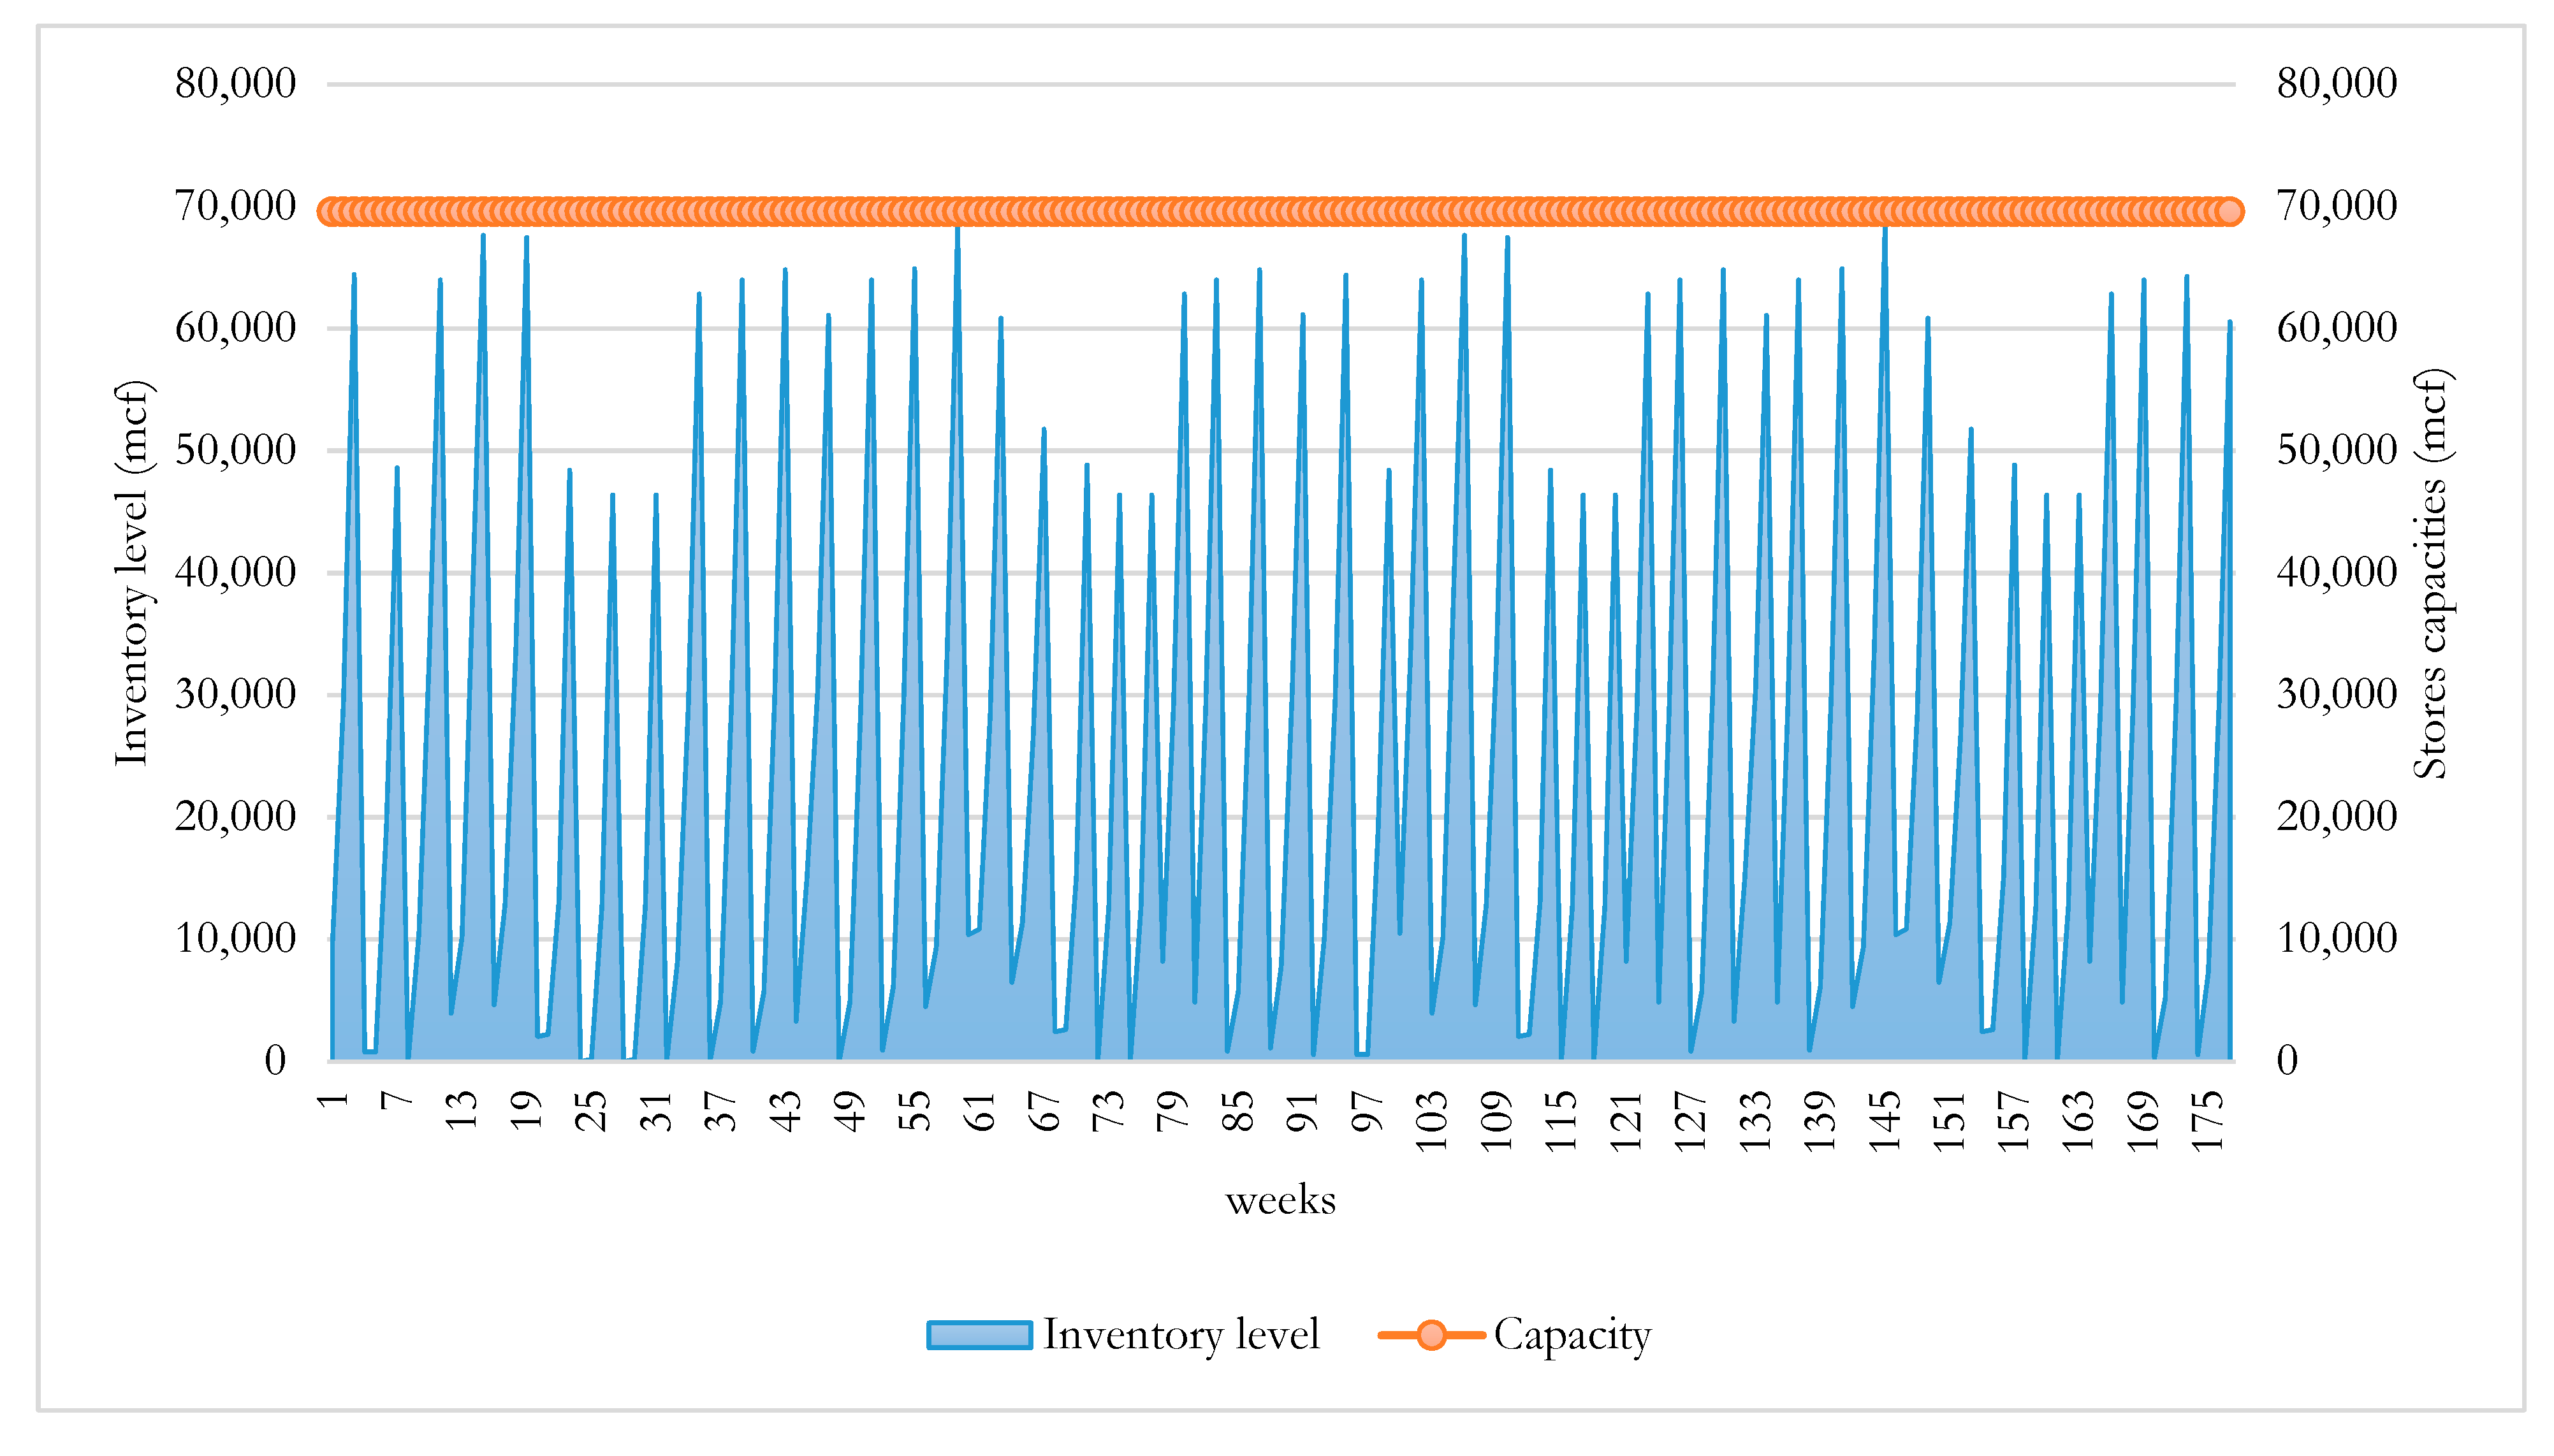
Figure 7 indicates the fractionation plant storage capacities and inventory levels fluctuations across the planning horizon. Production and maintenance are carried out on a weekly basis, while demand is on a monthly basis. As a result, the inventory level accumulated over the first four weeks of a month, then decreased as demand occurred at the end of the last week of a month.

Sensitivity Analysis

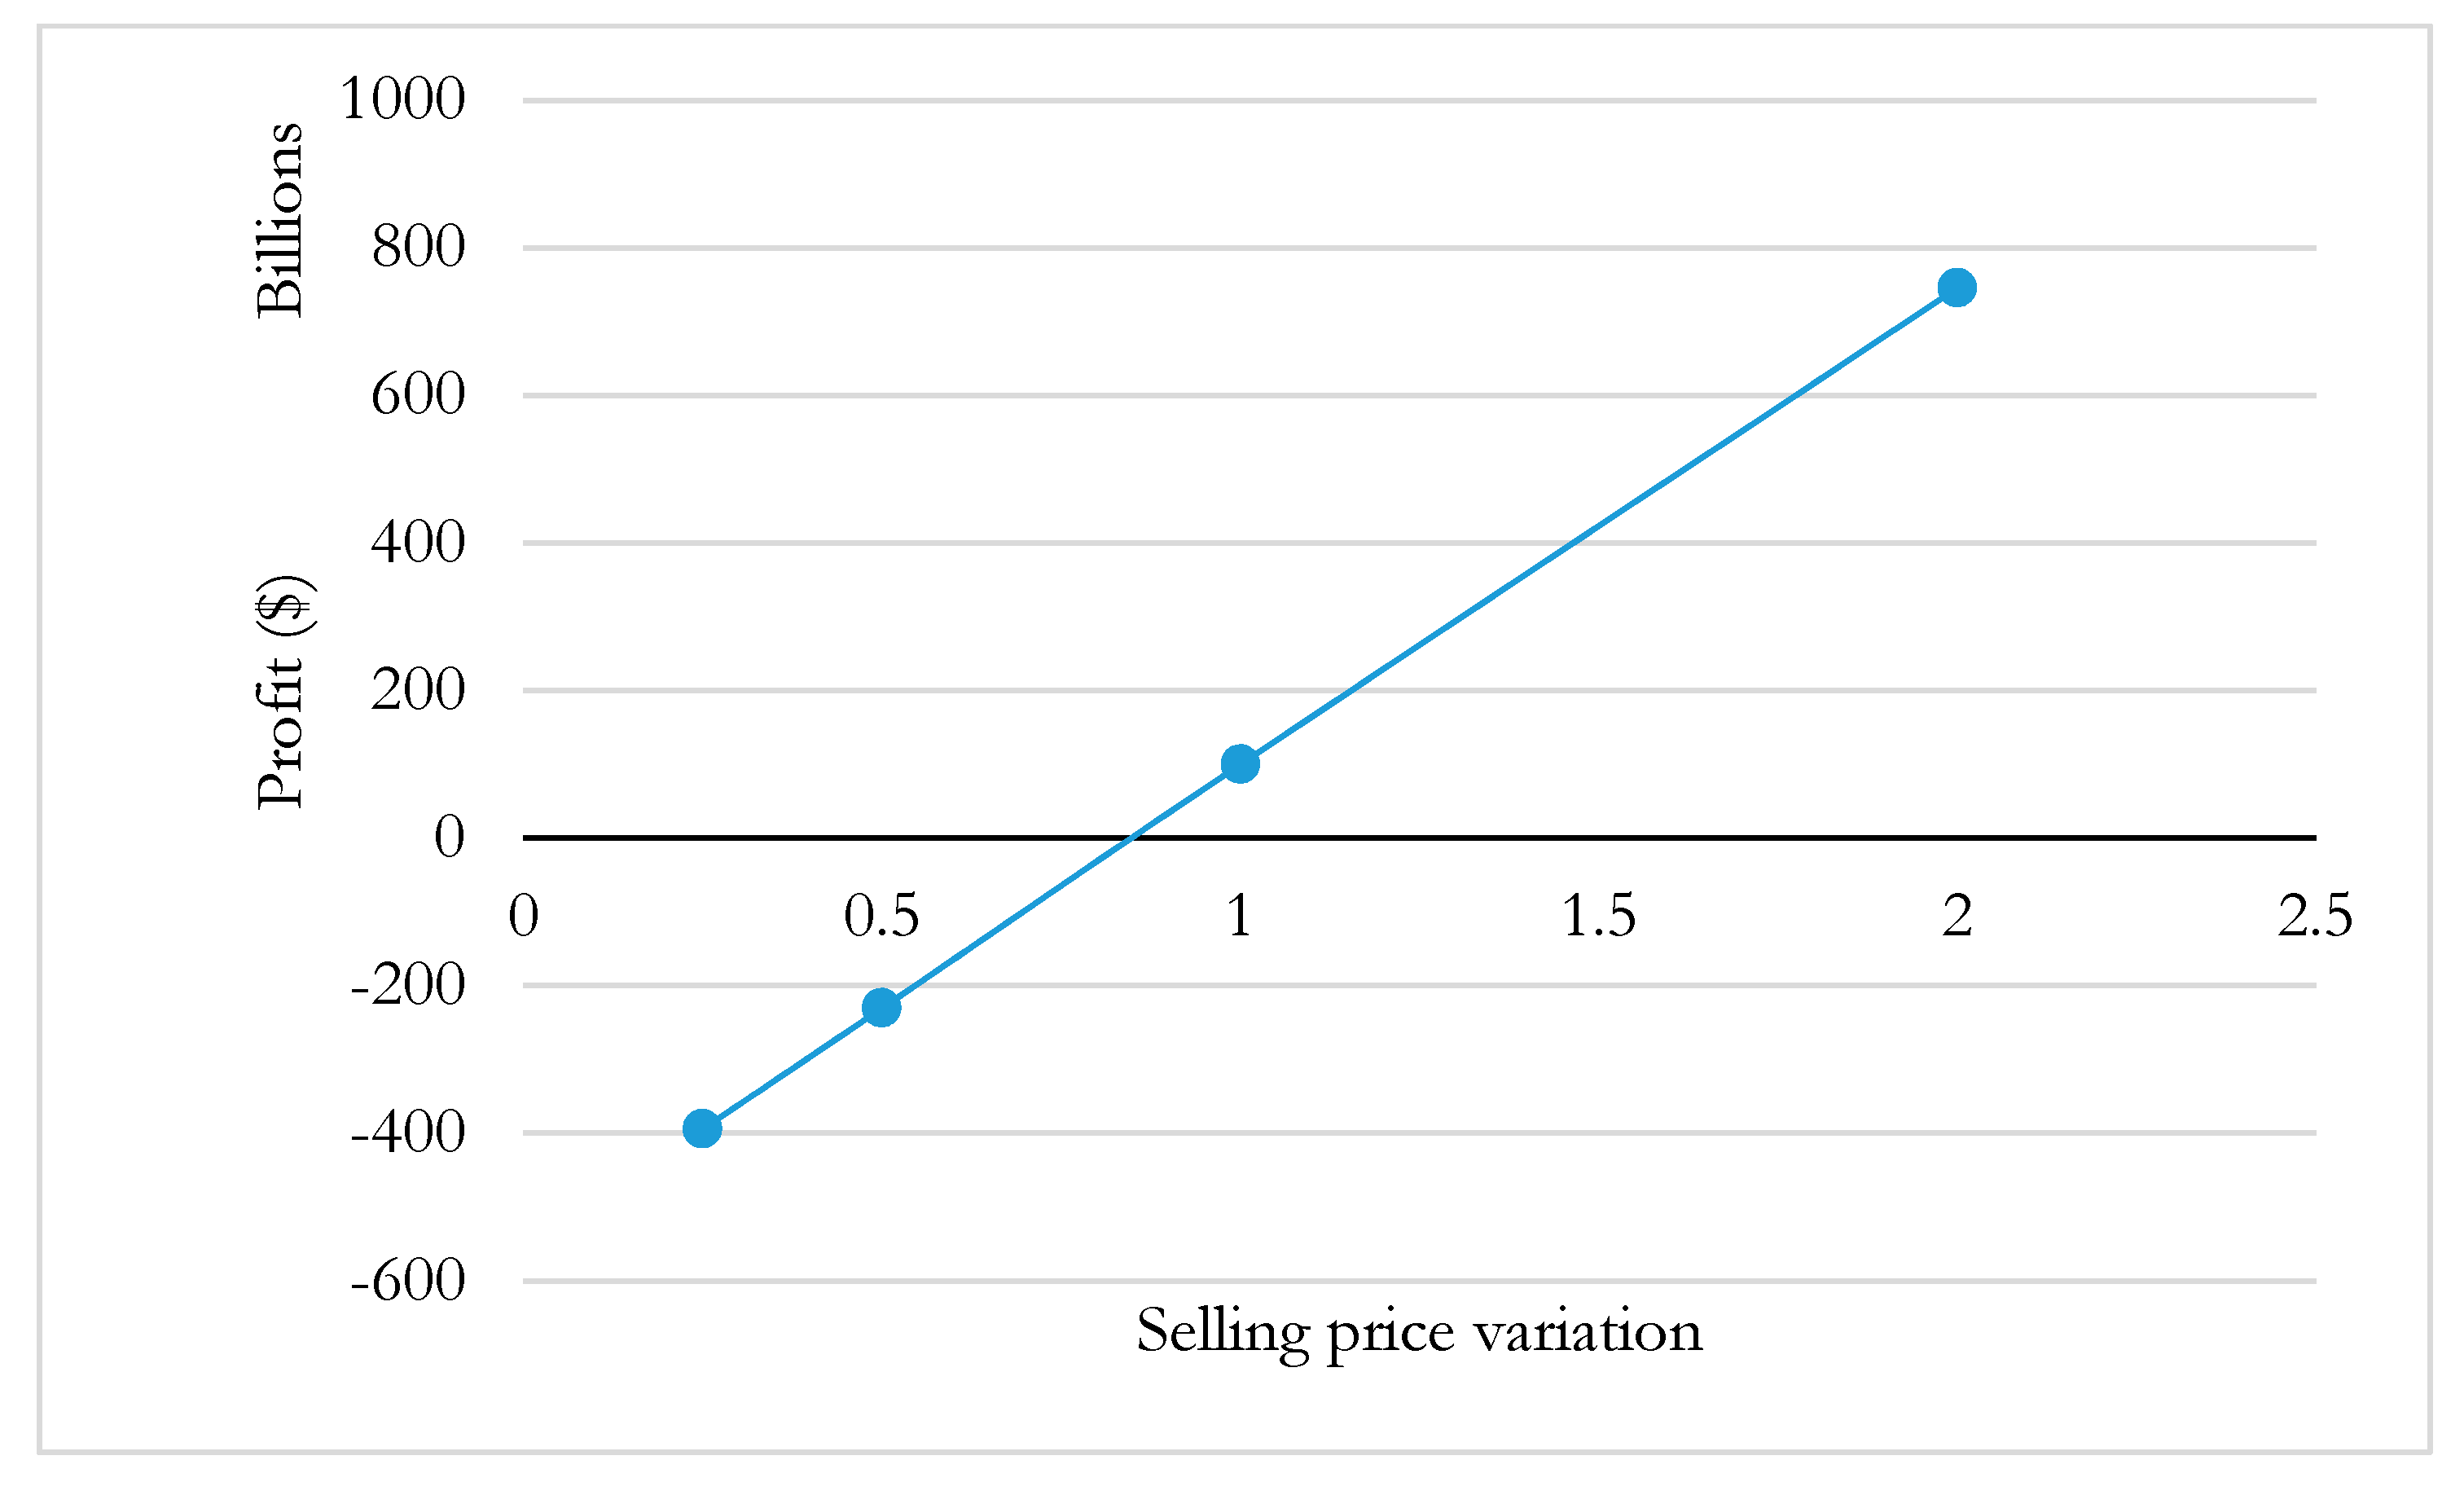
A valuable sensitivity analysis was conducted to show how the model was sensitive to the changes in the key parameters. In this study, the impact of changes in selling prices, demand, and store capacity on model output will be evaluated. Figure 8 shows the variation in profit with changes in selling price. It is noted that as the selling price increases, the total profit linearly increases.
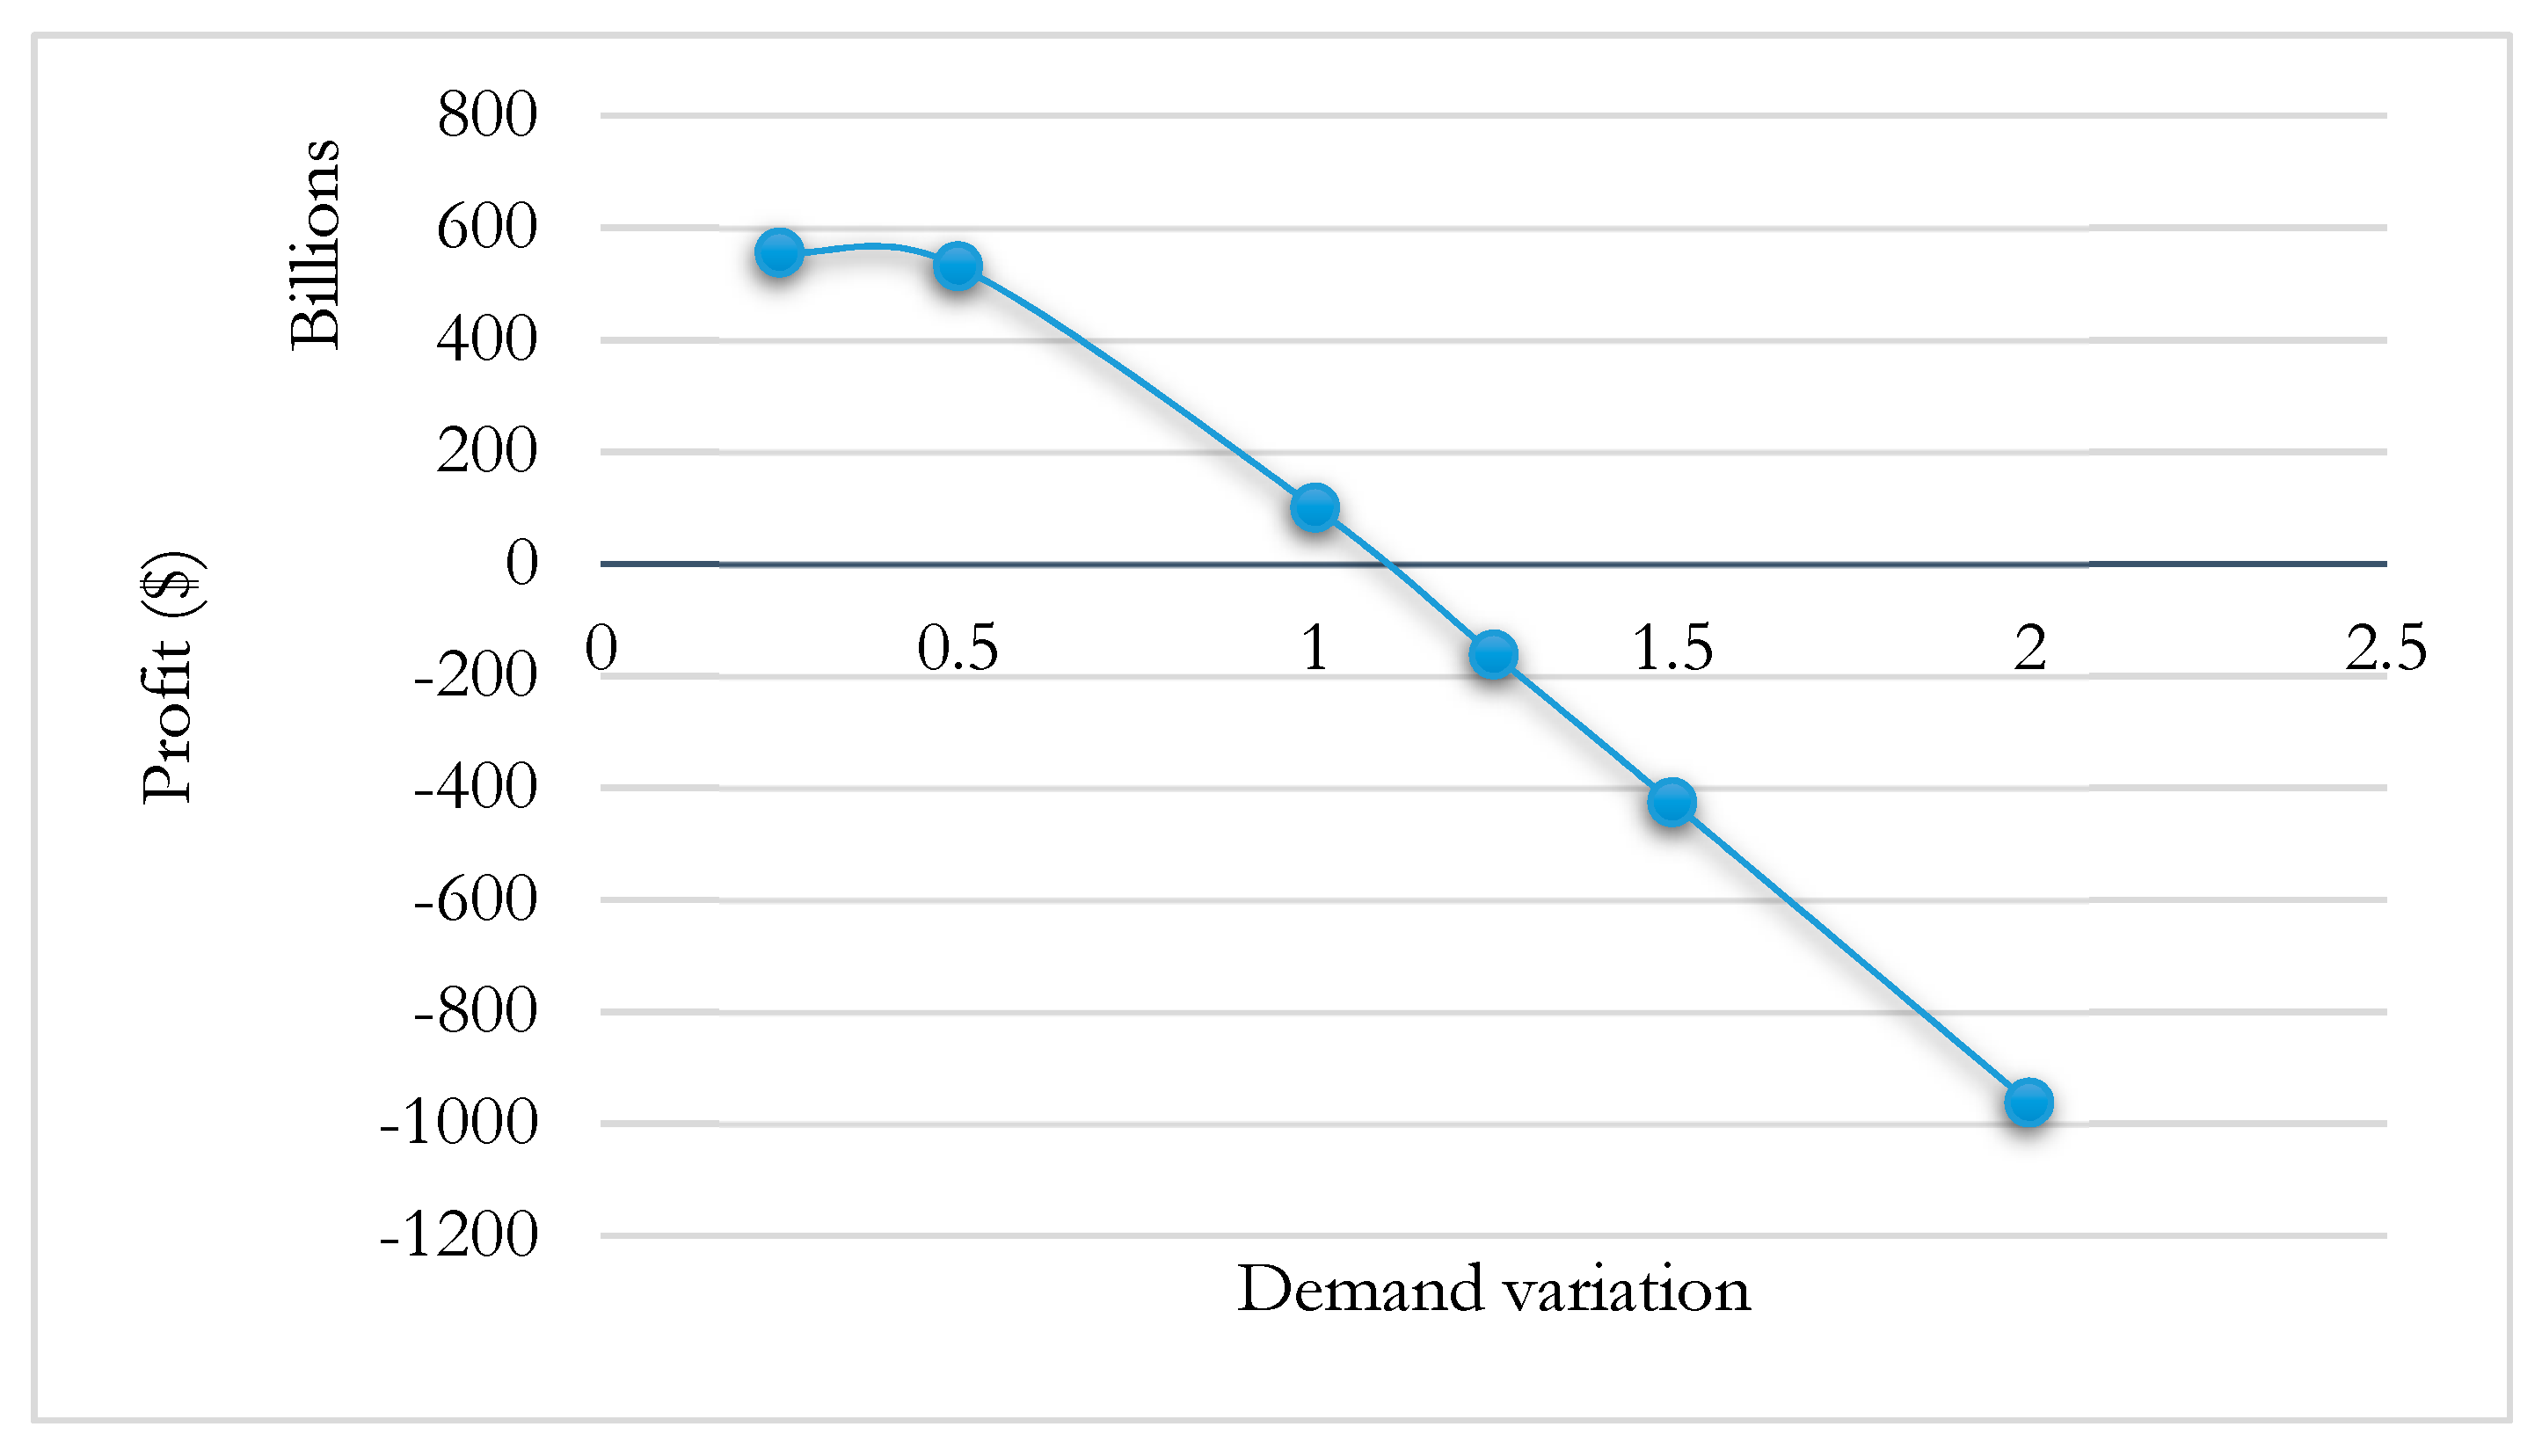
Figure 9 shows the fluctuations in profit with variability in demand. As demand increases, profit decreases because plant and storage capacities are kept constant; therefore, lost sales increase, which leads to customer dissatisfaction and ultimately lower profitability.
The impact of storage capacity variability on profitability is demonstrated in Figure 10. It is revealed that as storage capacity increases, profit increases due to a decline in lost sales and the satisfaction of most customer needs. Reducing store capacities by more than 55% will generate non-profitable plans.
The impact of upstream storage capacities on the maintenance schedule and arrangement is investigated in Figure 11.
The subsequent investigations can be derived from the above Gantt chart after reducing the storage capacity of upstream petroleum plants by 50%:
  • The maintenance activities were distributed uniformly and perfectly among HCSC plants and over the study period.
  • The majority of petroleum plants are taken for maintenance during the quarters of low demands.
  • Due to the reducing storage capacities of upstream plants, most of the connected plants have been taken for maintenance at the same time because the storage capacity of the upstream units is not sufficient to feed downstream units. For instance, the Jiddah refinery plant and Khurasaniya oil processing plant have been maintained in the same period. Similarly, both Riyadh and PetroRabigh refinery plants are maintained with Khurais oil processing plant.
  • Likewise, RasTunura and Yanbu refinery plants were maintained exchangeably; Rastunura is maintained during the first two weeks of the Abqaiq oil processing plant’s maintenance time, and then Yanbu is maintained during the last two weeks of the Abqaiq oil processing plant’s maintenance period because during the first two weeks of maintaining the Abqaiq plant, inventory capacity is sufficient to feed only RasTunura refinery plant and vice versa for Yanbu refinery plant.
  • For natural gas petroleum plants, Jaymah fractionation plant is recommended to be maintained with Uthmaniya and Berri gas plants. Similarly, the Yanbu fractionation plant and Yanbu gas plants are maintained at the same time.
To determine the significance of integration between operations and scheduling activities during modelling, the model was resolved without integration (only maintenance model). The obtained maintenance schedule is depicted in Figure 12.
It appeared that the HCSC units were taken for maintenance on a random basis during the planning period without taking into account the seasons of high or low demand, which would inevitably result in a huge loss of production and ultimately does not satisfy most customer needs.

4. Discussion

In this study, an integrated operation and maintenance model for both the oil and gas supply chain was developed. The model integrated and generated operation plans and maintenance schedules for the HCSC plants jointly. The integration between the operation and maintenance activities was studied and compared to a model without integration. The obtained results justified the importance of the proposed model. The results of the model were promising in which the model forced all the HCSC plants to be maintained during the months of low demand to prevent huge losses in the production and satisfy most of the demand and minimize lost sales as much as possible. The output of the model shows the role of storage in satisfying needs during plant maintenance, as well as the impact of storage capacities on coupling or decoupling maintenance tasks for connected plants. The model can be extended by addressing the uncertainty of input parameters such as the demand, price, etc.

Funding

This research received no external funding.

Acknowledgments

The author would like to acknowledge the financial support provided by the Deanship of Scientific Research (DSR) at King Fahd University of Petroleum and Minerals (KFUPM) for funding this work through project NO. SR181022.

Conflicts of Interest

The author declares no conflict of interest.

References

  1. Ghaithan, A.M.; Attia, A.; Duffuaa, S.O. Multi-objective optimization model for a downstream oil and gas supply chain. Appl. Math. Model. 2017, 52, 689–708. [Google Scholar] [CrossRef]
  2. Alkhamis, T.M.; Yellen, J. Refinery units maintenance scheduling using integer programming. Appl. Math. Model. 1995, 19, 543–549. [Google Scholar] [CrossRef]
  3. Mendez, C.A.; Grossmann, I.E.; Harjunkoski, I.; Kaboré, P. A simultaneous optimization approach for off-line blending and scheduling of oil-refinery operations. Comput. Chem. Eng. 2006, 30, 614–634. [Google Scholar] [CrossRef]
  4. Göthe-Lundgren, M.; Lundgren, J.T.; Persson, J.A. An optimization model for refinery production scheduling. Int. J. Prod. Econ. 2002, 78, 255–270. [Google Scholar] [CrossRef]
  5. Antomarioni, S.; Bevilacqua, M.; Potena, D.; Diamantini, C. Defining a data-driven maintenance policy: An application to an oil refinery plant. Int. J. Qual. Reliab. Manag. 2019. [Google Scholar] [CrossRef]
  6. Bertolini, M.; Bevilacqua, M.; Ciarapica, F.E.; Giacchetta, G. Development of risk-based inspection and maintenance procedures for an oil refinery. J. Loss Prev. Process Ind. 2009, 22, 244–253. [Google Scholar] [CrossRef]
  7. Aissani, N.; Beldjilali, B.; Trentesaux, D. Dynamic scheduling of maintenance tasks in the petroleum industry: A reinforcement approach. Eng. Appl. Artif. Intell. 2009, 22, 1089–1103. [Google Scholar] [CrossRef]
  8. Amaran, S.; Sahinidis, N.V.; Sharda, B.; Morrison, M.; Bury, S.J.; Miller, S.; Wassick, J.M. Long-term turnaround planning for integrated chemical sites. Comput. Chem. Eng. 2015, 72, 145–158. [Google Scholar] [CrossRef]
  9. Awad, M.; Ertem, M. Stochastic scheduling of workforce-constrained preventive maintenance activities in petroleum plants. In Proceedings of the 2017 Annual Reliability and Maintainability Symposium (RAMS), Orlando, FL, USA, 23–26 January 2017; pp. 1–5. [Google Scholar]
  10. Xu, J.; Qu, H.; Wang, S.; Xu, Q. A new proactive scheduling methodology for front-end crude oil and refinery operations under uncertainty of shipping delay. Ind. Eng. Chem. Res. 2017, 56, 8041–8053. [Google Scholar] [CrossRef]
  11. Qu, H.; Wang, S.; Xu, Q. Integrated Proactive and Reactive Scheduling for Refinery Front-end Crude Movement with Consideration of Unit Maintenance. Ind. Eng. Chem. Res. 2019, 58, 12192–12206. [Google Scholar] [CrossRef]
  12. Rosenblatt, M.J.; Lee, H.L. Economic production cycles with imperfect production processes. IIE Trans. 1986, 18, 48–55. [Google Scholar] [CrossRef]
  13. Joshi, S.; Gupta, R. Scheduling of routine maintenance using production schedules and equipment failure history. Comput. Ind. Eng. 1986, 10, 11–20. [Google Scholar] [CrossRef]
  14. Pintelon, L. Performance reporting and decision tools for maintenance management. Ph.D. Thesis, Department of Industrial Management, Catholic University of Leuven, Leuven, Belgium, 1990. (Unpublished). [Google Scholar]
  15. Ashayeri, J.; Teelen, A.; Selenj, W. A production and maintenance planning model for the process industry. Int. J. Prod. Res. 1996, 34, 3311–3326. [Google Scholar] [CrossRef]
  16. Rahim, M.A.; Ben-Daya, M. Integrated Models in Production Planning, Inventory, Quality, and Maintenance; Springer Science & Business Media: Berlin, Germany, 2012. [Google Scholar]
  17. Iravani, S.M.; Duenyas, I. Integrated maintenance and production control of a deteriorating production system. IIE Trans. 2002, 34, 423–435. [Google Scholar] [CrossRef]
  18. Cassady, C.R.; Kutanoglu, E. Integrating preventive maintenance planning and production scheduling for a single machine. IEEE Trans. Reliab. 2005, 54, 304–309. [Google Scholar] [CrossRef]
  19. Cassady, C.R.; Kutanoglu, E. Minimizing job tardiness using integrated preventive maintenance planning and production scheduling. IIE Trans. 2003, 35, 503–513. [Google Scholar] [CrossRef]
  20. Darwish, M.A.; Ben-Daya, M. Effect of inspection errors and preventive maintenance on a two-stage production inventory system. Int. J. Prod. Econ. 2007, 107, 301–313. [Google Scholar] [CrossRef]
  21. Aghezzaf, E.H.; Jamali, M.A.; Ait-Kadi, D. An integrated production and preventive maintenance planning model. Eur. J. Oper. Res. 2007, 181, 679–685. [Google Scholar] [CrossRef]
  22. Aghezzaf, E.-H.; Najid, N.M. Integrated production planning and preventive maintenance in deteriorating production systems. Inf. Sci. 2008, 178, 3382–3392. [Google Scholar] [CrossRef]
  23. Zied, H.; Sofiene, D.; Nidhal, R. An optimal production/maintenance planning under stochastic random demand, service level and failure rate. In Proceedings of the 2009 IEEE International Conference on Automation Science and Engineering, Bangalore, India, 22–25 August 2009; pp. 292–297. [Google Scholar]
  24. Berrichi, A.; Amodeo, L.; Yalaoui, F.; Châtelet, E.; Mezghiche, M. Bi-objective optimization algorithms for joint production and maintenance scheduling: Application to the parallel machine problem. J. Intell. Manuf. 2009, 20, 389. [Google Scholar] [CrossRef]
  25. Ayed, S.; Sofiene, D.; Nidhal, R. Joint optimisation of maintenance and production policies considering random demand and variable production rate. Int. J. Prod. Res. 2012, 50, 6870–6885. [Google Scholar] [CrossRef]
  26. Fitouhi, M.-C.; Nourelfath, M. Integrating noncyclical preventive maintenance scheduling and production planning for multi-state systems. Reliab. Eng. Syst. Saf. 2014, 121, 175–186. [Google Scholar] [CrossRef]
  27. Yalaoui, A.; Chaabi, K.; Yalaoui, F. Integrated production planning and preventive maintenance in deteriorating production systems. Inf. Sci. 2014, 278, 841–861. [Google Scholar] [CrossRef]
  28. Assid, M.; Gharbi, A.; Hajji, A. Joint production, setup and preventive maintenance policies of unreliable two-product manufacturing systems. Int. J. Prod. Res. 2015, 53, 4668–4683. [Google Scholar] [CrossRef]
  29. Khosrojerdi, A.; Zegordi, S.H.; Allen, J.K.; Mistree, F. A method for designing power supply chain networks accounting for failure scenarios and preventive maintenance. Eng. Optim. 2016, 48, 154–172. [Google Scholar] [CrossRef]
  30. Cheng, G.Q.; Zhou, B.H.; Li, L. Joint optimisation of production rate and preventive maintenance in machining systems. Int. J. Prod. Res. 2016, 54, 6378–6394. [Google Scholar] [CrossRef]
  31. Ettaye, G.; El Barkany, A.; El Khalfi, A. Integrating production and maintenance for a multi-lines system. Int. J. Perform. Eng. 2017, 13, 29. [Google Scholar] [CrossRef] [Green Version]
  32. Géhan, M.; Castanier, B.; Lemoine, D. Integration of maintenance in the tactical production planning process under feasibility constraint. In IFIP International Conference on Advances in Production Management Systems; Springer: Berlin/Heidelberg, Germany, 2014; pp. 467–474. [Google Scholar]
  33. Liu, Q.; Lv, W. Multi-component manufacturing system maintenance scheduling based on degradation information using genetic algorithm. Ind. Manag. Data Syst. 2015, 115, 1412–1434. [Google Scholar] [CrossRef]
  34. Zhao, S.; Wang, L.; Zheng, Y. Integrating production planning and maintenance: An iterative method. Ind. Manag. Data Syst. 2014, 114, 162–182. [Google Scholar] [CrossRef]
  35. Hnaien, F.; Yalaoui, F.; Mhadhbi, A.; Nourelfath, M. A mixed-integer programming model for integrated production and maintenance. IFAC-Pap. 2016, 49, 556–561. [Google Scholar] [CrossRef]
  36. Askri, T.; Hajej, Z.; Rezg, N. Jointly production and correlated maintenance optimization for parallel leased machines. Appl. Sci. 2017, 7, 461. [Google Scholar] [CrossRef] [Green Version]
  37. Amiri, S.; Honarvar, M. Providing an integrated Model for Planning and Scheduling Energy Hubs and preventive maintenance. Energy 2018, 163, 1093–1114. [Google Scholar] [CrossRef]
  38. Khatab, A.; Diallo, C.; Aghezzaf, E.-H.; Venkatadri, U. Integrated production quality and condition-based maintenance optimisation for a stochastically deteriorating manufacturing system. Int. J. Prod. Res. 2019, 57, 2480–2497. [Google Scholar] [CrossRef]
  39. Rinaldi, G. An integrated Operation and Maintenance Framework for Offshore Renewable Energy. Ph.D. Thesis, University of Exeter, Exeter, UK, 2019. [Google Scholar]
  40. Martin, R.; Lazakis, I.; Barbouchi, S.; Johanning, L. Sensitivity analysis of offshore wind farm operation and maintenance cost and availability. Renew. Energy 2016, 85, 1226–1236. [Google Scholar] [CrossRef] [Green Version]
  41. Rinaldi, G.; Pillai, A.C.; Thies, P.R.; Johanning, L. Multi-objective optimization of the operation and maintenance assets of an offshore wind farm using genetic algorithms. Wind Eng. 2020, 44, 390–409. [Google Scholar] [CrossRef] [Green Version]
  42. Helsen, J.; Peeters, C.; Doro, P.; Ververs, E.; Jordaens, P.J. Wind farm operation and maintenance optimization using big data. In Proceedings of the 2017 IEEE Third International Conference on Big Data Computing Service and Applications (BigDataService), San Francisco, CA, USA, 6–9 April 2017; pp. 179–184. [Google Scholar]
  43. Nielsen, J.J.; Sørensen, J.D. On risk-based operation and maintenance of offshore wind turbine components. Reliab. Eng. Syst. Saf. 2011, 96, 218–229. [Google Scholar] [CrossRef]
  44. Dinwoodie, I. Modelling the Operation and Maintenance of Offshore Wind Farms. Ph.D. Thesis, University of Strathclyde, Glasgow, UK, 2014. [Google Scholar]
  45. Seyr, H.; Muskulus, M. Decision support models for operations and maintenance for offshore wind farms: A review. Appl. Sci. 2019, 9, 278. [Google Scholar] [CrossRef] [Green Version]
  46. Murray, S. Energy to the World: The Story of Saudi Aramco; Aramco Services Company: Houston, TX, USA, 2011. [Google Scholar]
  47. Attia, A.M.; Ghaithan, A.M.; Duffuaa, S.O. Data on upstream segment of a hydrocarbon supply chain in Saudi Arabia. Data Brief 2019, 27, 104804. [Google Scholar] [CrossRef]
  48. Attia, A.M.; Ghaithan, A.M.; Duffuaa, S.O. A multi-objective optimization model for tactical planning of upstream oil & gas supply chains. Comput. Chem. Eng. 2019, 128, 216–227. [Google Scholar]
  49. Manual, C.U. IBM ILOG CPLEX Optimization Studio. Version 1987, 12, 1987–2018. [Google Scholar]
  50. Brook, A.; Kendruck, D.; Meeraus, A. GAMS—General Algebraic Modeling System: A User’s Guide; Scientific Press: Redwood City, CA, USA, 1988. [Google Scholar]
Figure 1. Schematic representation of downstream oil and gas supply chain.
Applsci 10 07531 g001
Figure 2. The oil network.
Applsci 10 07531 g002
Figure 3. The natural gas network.
Applsci 10 07531 g003
Figure 4. Maintenance schedule for all hydrocarbon supply chain (HCSC) plants (operations and maintenance model); Color code: Orange: oil processing plants; Purple: Refinery plants; Red: Gas plants; Light Blue: Fractionator plants.
Applsci 10 07531 g004
Figure 5. Gas plants maintenance scheduling, production plans, and utilization (year 1).
Applsci 10 07531 g005aApplsci 10 07531 g005b
Figure 6. Oil processing plants maintenance scheduling, production, and utilization (year 1).
Applsci 10 07531 g006
Figure 7. Fractionation plants inventory level and storage capacity.
Applsci 10 07531 g007
Figure 8. Profatibility changes with variation in demand.
Applsci 10 07531 g008
Figure 9. Profitability changes with the variation in demand.
Applsci 10 07531 g009
Figure 10. Profitability changes with variation in store capacity.
Applsci 10 07531 g010
Figure 11. Maintenance schedule for all HCSC plants (reducing the storage capacity of upstream petroleum plants by 50%); Color code: Orange: oil processing plants; Purple: Refinery plants; Red: Gas plants; Light Blue: Fractionator plants.
Applsci 10 07531 g011
Figure 12. Maintenance schedule for all HCSC plants (maintenance model only); Color code: Orange: oil processing plants; Purple: Refinery plants; Red: Gas plants; Light Blue: Fractionator plants.
Applsci 10 07531 g012
Table 1. Sets, subsets, variable and parameters notations.
Sets
i ,   j   I   :All nodes;
N 1 I :Set of petroleum plants belong to the first level of the supply chain;
N 2   I :Set of petroleum plants belong to the second level of the supply chain;
N 3 I :Set of demand nodes;
S 1 I :Set of storage tanks belong to the first level of the supply chain;
S 2   I :Set of storage tanks belong to the second level of the supply chain;
R:Set of raw material imported from upstream of the supply chain to the first level;
P:Set of products processed at level 1;
B:Set of products processed at level 2;
T :Time horizon.
Indices
t:Time periods in weeks,   t = { 1 , 2 , , T } ;
r:Raw material imported from upstream, r = { 1 , 2 , , R } ;
p:Product produced at level 1, p = { 1 , 2 , , P } ;
b:Product produced at level 2, b = { 1 , 2 , , B } .
Decision Variables
Y i t r :Supply of raw material r from upstream to plants belong to first level i N 1 at time t ;
X i j t p :Flow of product p from plant i to customer/plant j at time t;
X i j t b :Flow of by-product b from plant i to customer/plant j at time t;
I i t p :Inventory level of product p at time t at plants of level 1;
I i t b :Inventory level of product p at time t at plants of level 2;
x i t p + , x i t p :Amount of product p   P produced above, below the demand of demand node i   N 3 during time t T ;
x i t b + , x i t b :Amount of product b   B produced above, below the demand of demand node i   N 3 during time t T ;
S t i t : { 1   if plant   i   starts its maintenance at period   t , 0   otherwise .
Parameters
D t i :The duration of maintenance for the plant i.
R i t :The manpower required for maintaining plant i during time t.
W i t :The total manpower available for plant i during time t.
C a i :Capacity of plant i.
C S i :Capacity of storage tank i.
C r i j :Capacity of route connecting plant with plant/customer j.
D j t p :Demand quantities of product p at demand node j N 3 at time t.
D j t b :Demand quantities of by-product b at demand node j N 3 at time t.
L s j t p :Lost sales of products p at demand node j N 3 at time t;
L s j t b :Lost sales of by-products b at demand node j N 3 at time t;
C m i t :Cost of maintaining plant i at time t;
C p i t r :Cost of processing raw material r at plant i at time t;
C p i j t p :Cost of processing product stream X i j t p coming from plant i and processed at plant j at time t;
C t i j t p :Cost of shipping product p from plant i to customer/plant j at time t;
C t i j t b :Cost of shipping by-product b from plant i to customer/plant j at time t;
w i t p + , w i t p :Cost incurred due to producing product p P more than, less than the demand of node i N 3 at time t T ;
w i t b + , w i t b :Cost incurred due to producing product b B more than, less than the demand of node i N 3 at time t T ;
H c i t p :Inventory holding cost of product p per period t at plants i of level 1;
H c i t b :Inventory holding cost of product b per period t at plants i of level 2;
S p j t p :Selling price of product p at demand node j N 3 at time t;
S p j t b :Selling price of by-product b at demand node j N 3 at time t;
w i t p :Composition of product p obtained from raw materials streaming from upstream to the plant i at time t;
w i j t b :Composition of by-product b obtained from product p streaming from plant i to plant j at time t;
O P E C t :Market share of crude oil specified to an oil production country at time t.
Publisher’s Note: MDPI stays neutral with regard to jurisdictional claims in published maps and institutional affiliations.