Article

Computational Fluid Dynamics Study of Superselective Intra-arterial Chemotherapy for Oral Cancer: Flow Simulation of Anticancer Agent in the Linguofacial Trunk

Department of Oral and Maxillofacial Surgery, Graduate School of Medicine, Yokohama City University, Kanagawa 236-0004, Japan
*
Author to whom correspondence should be addressed.
Appl. Sci. 2020, 10(21), 7496; https://doi.org/10.3390/app10217496
Submission received: 20 September 2020 / Revised: 7 October 2020 / Accepted: 22 October 2020 / Published: 25 October 2020
(This article belongs to the Special Issue Recent Developments and Emerging Trends in Biomechanics)

Abstract

:
Superselective intra-arterial chemotherapy (SSIAC) for oral cancer can deliver a higher concentration of anticancer agent into a tumor-feeding artery than intravenous systemic chemotherapy. However, the agent distribution between the lingual artery and facial artery (FA) is not clear in SSIAC for patients with the linguofacial trunk. The agent distribution in the SSIAC method was investigated using computational fluid dynamics (CFD). Ten three-dimensional vessel models were created from CT images of two patients with oral cancer (patients A and B) with the linguofacial trunk. Catheter models were combined with vessel models to mimic intra-arterial infusion, and the agent flow was analyzed. In patient A models, the agent distribution varied depending on the catheter tip position in the linguofacial trunk, while all anticancer agents flowed into the FA only in patient B models. This study revealed that the behavior of the agent in the common trunk is determined by the blood flow field which depends on the topography of the vessels in each patient. Therefore, the catheter tip position should be changed according to the vessel topography to deliver anticancer agents into the tumor-feeding artery. Moreover, CFD can be a useful method to predict the agent flow for each patient before SSIAC.

1. Introduction

The standard treatment for oral cancer is surgery. However, surgery for advanced oral cancer may cause several poor oral functions such as mastication, swallowing, and speech. As an alternative to surgery, intra-arterial chemotherapy (IAC) for oral cancer has been developed due to the advancement of interventional radiology [1]. In Seldinger’s method [2,3], a catheter is inserted via the femoral artery into the tumor-feeding arteries of oral cancer, which arise from the external carotid artery (ECA), and an anticancer agent is injected through the catheter. However, the catheter needs to be inserted into the tumor-feeding artery every time the agent is injected. Moreover, cerebral infarction may occur [4], because the catheter passes through the common carotid artery (CCA) during the procedure. In contrast, Tohnai et al. developed “retrograde superselective IAC (SSIAC)” [5]. In this method, a hook-shaped catheter is inserted via the superficial temporal artery into the tumor-feeding arteries (Figure 1a). With this method, the risk of complications from catheter insertion is reduced because a catheter is handled in the region above the bifurcation of the ECA and internal carotid artery (ICA). Furthermore, a catheter is placed into the tumor-feeding artery, which provides concurrent radiotherapy to patients [6].
There are some limitations in SSIAC due to the complexity of the catheter placement procedure. SSIAC requires a skilled technique, and the difficulty of insertion into the targeted tumor-feeding artery depends on the anatomical topography of the ECA and its branches in each patient. For instance, the lingual artery (LA) and facial artery (FA), which the main arteries that feed oral cancer, arise from the ECA with a common trunk. The incidence rates of the linguofacial and thyrolingual trunks are 2.7–31% [7,8,9] and 0.7–3% [7,8,9,10], respectively. The mechanism of the distribution of the amount of agent among the branches that arise from the common trunk has not been fully understood (Figure 1b), although SSIAC can deliver a high drug concentration as long as the catheter tip is located in the tumor-feeding artery that arises directly from the ECA [5]. In addition to the topological feature of the artery, spasm of vessels [11] caused by inappropriate procedures could make catheter placement more difficult. In cases with difficulty in catheter insertion into the tumor-feeding arteries, a linear catheter is inserted and placed in the vicinity of the bifurcation of the tumor-feeding artery in the main trunk of the ECA instead of inserting a hook-shaped catheter, which is known as conventional IAC (CIAC, Figure 1c) [5]. It has been demonstrated that CIAC delivers a lower anticancer agent concentration to the tumor tissue compared to SSIAC [5].
Another issue with IAC is that the method to confirm the perfusion area of the agent in both CIAC and SSIAC has not been well developed. One confirmation method is to inject indigo carmine dye via the placed catheter [4,12]. However, the staining is generally performed manually; hence, there is a possibility that the perfusion area of the anticancer agent cannot be reproduced by this method because the injection pressure of the dye by hand is quite higher than that by syringe driver, which is used to inject an anticancer agent.
We believe that a new simulation is required, which allows clinicians to predict the distribution of anticancer agents among the ECA branches for each patient in advance of catheter insertion. Therefore, we have been using computational fluid dynamics (CFD) to elucidate the mechanism of anticancer agent distribution in IAC, because CFD has been widely used to investigate physical variables in the fluid phenomenon that cannot be reproduced experimentally. Our previous study demonstrated that the mass distribution of the anticancer agent in IAC is dominated by blood flow field and the flow of the agent into the targeted tumor-feeding artery is determined whether the blood flow that comes from the inlet of the CCA toward the artery contacts the catheter tip or not [13]. In the situations, the anticancer agent flow in the linguofacial trunk is thought to be dominated by the blood flow field in the common trunk. However, in our past study, the vessel model was made from medical images of patients without the common trunk. Therefore, both blood and anticancer agent flow in the common trunk have not been fully addressed. In addition, in clinical practice, we have experienced some oral cancer residual or recurrence cases after SSIAC, which had been done through the linguofacial trunk. Therefore, this study focused on the flow of the anticancer agent and blood in the linguofacial trunk. This study hypothesized that the distribution of anticancer agents among the ECA branches with a common trunk can be affected by the catheter tip position and analyzed the agent flow. This study aimed to investigate the flow distribution of anticancer agents in the ECA with the linguofacial trunk.
This article is structured as follows: The geometrical model creation, the mathematical methodology, the numerical condition, and the other settings for the CFD analysis are described in Section 2. The analyses with visualized data are provided in Section 3. The mechanism of the distribution of the agent in the linguofacial trunk and the mechanical effect of IAC on the vessels are discussed in Section 4. Finally, the conclusion is presented in Section 5.

2. Materials and Methods

This computational fluid dynamics study was performed based on our previous studies [13,14], and was approved by the Ethics Committee of Yokohama City University (No. B200600075).

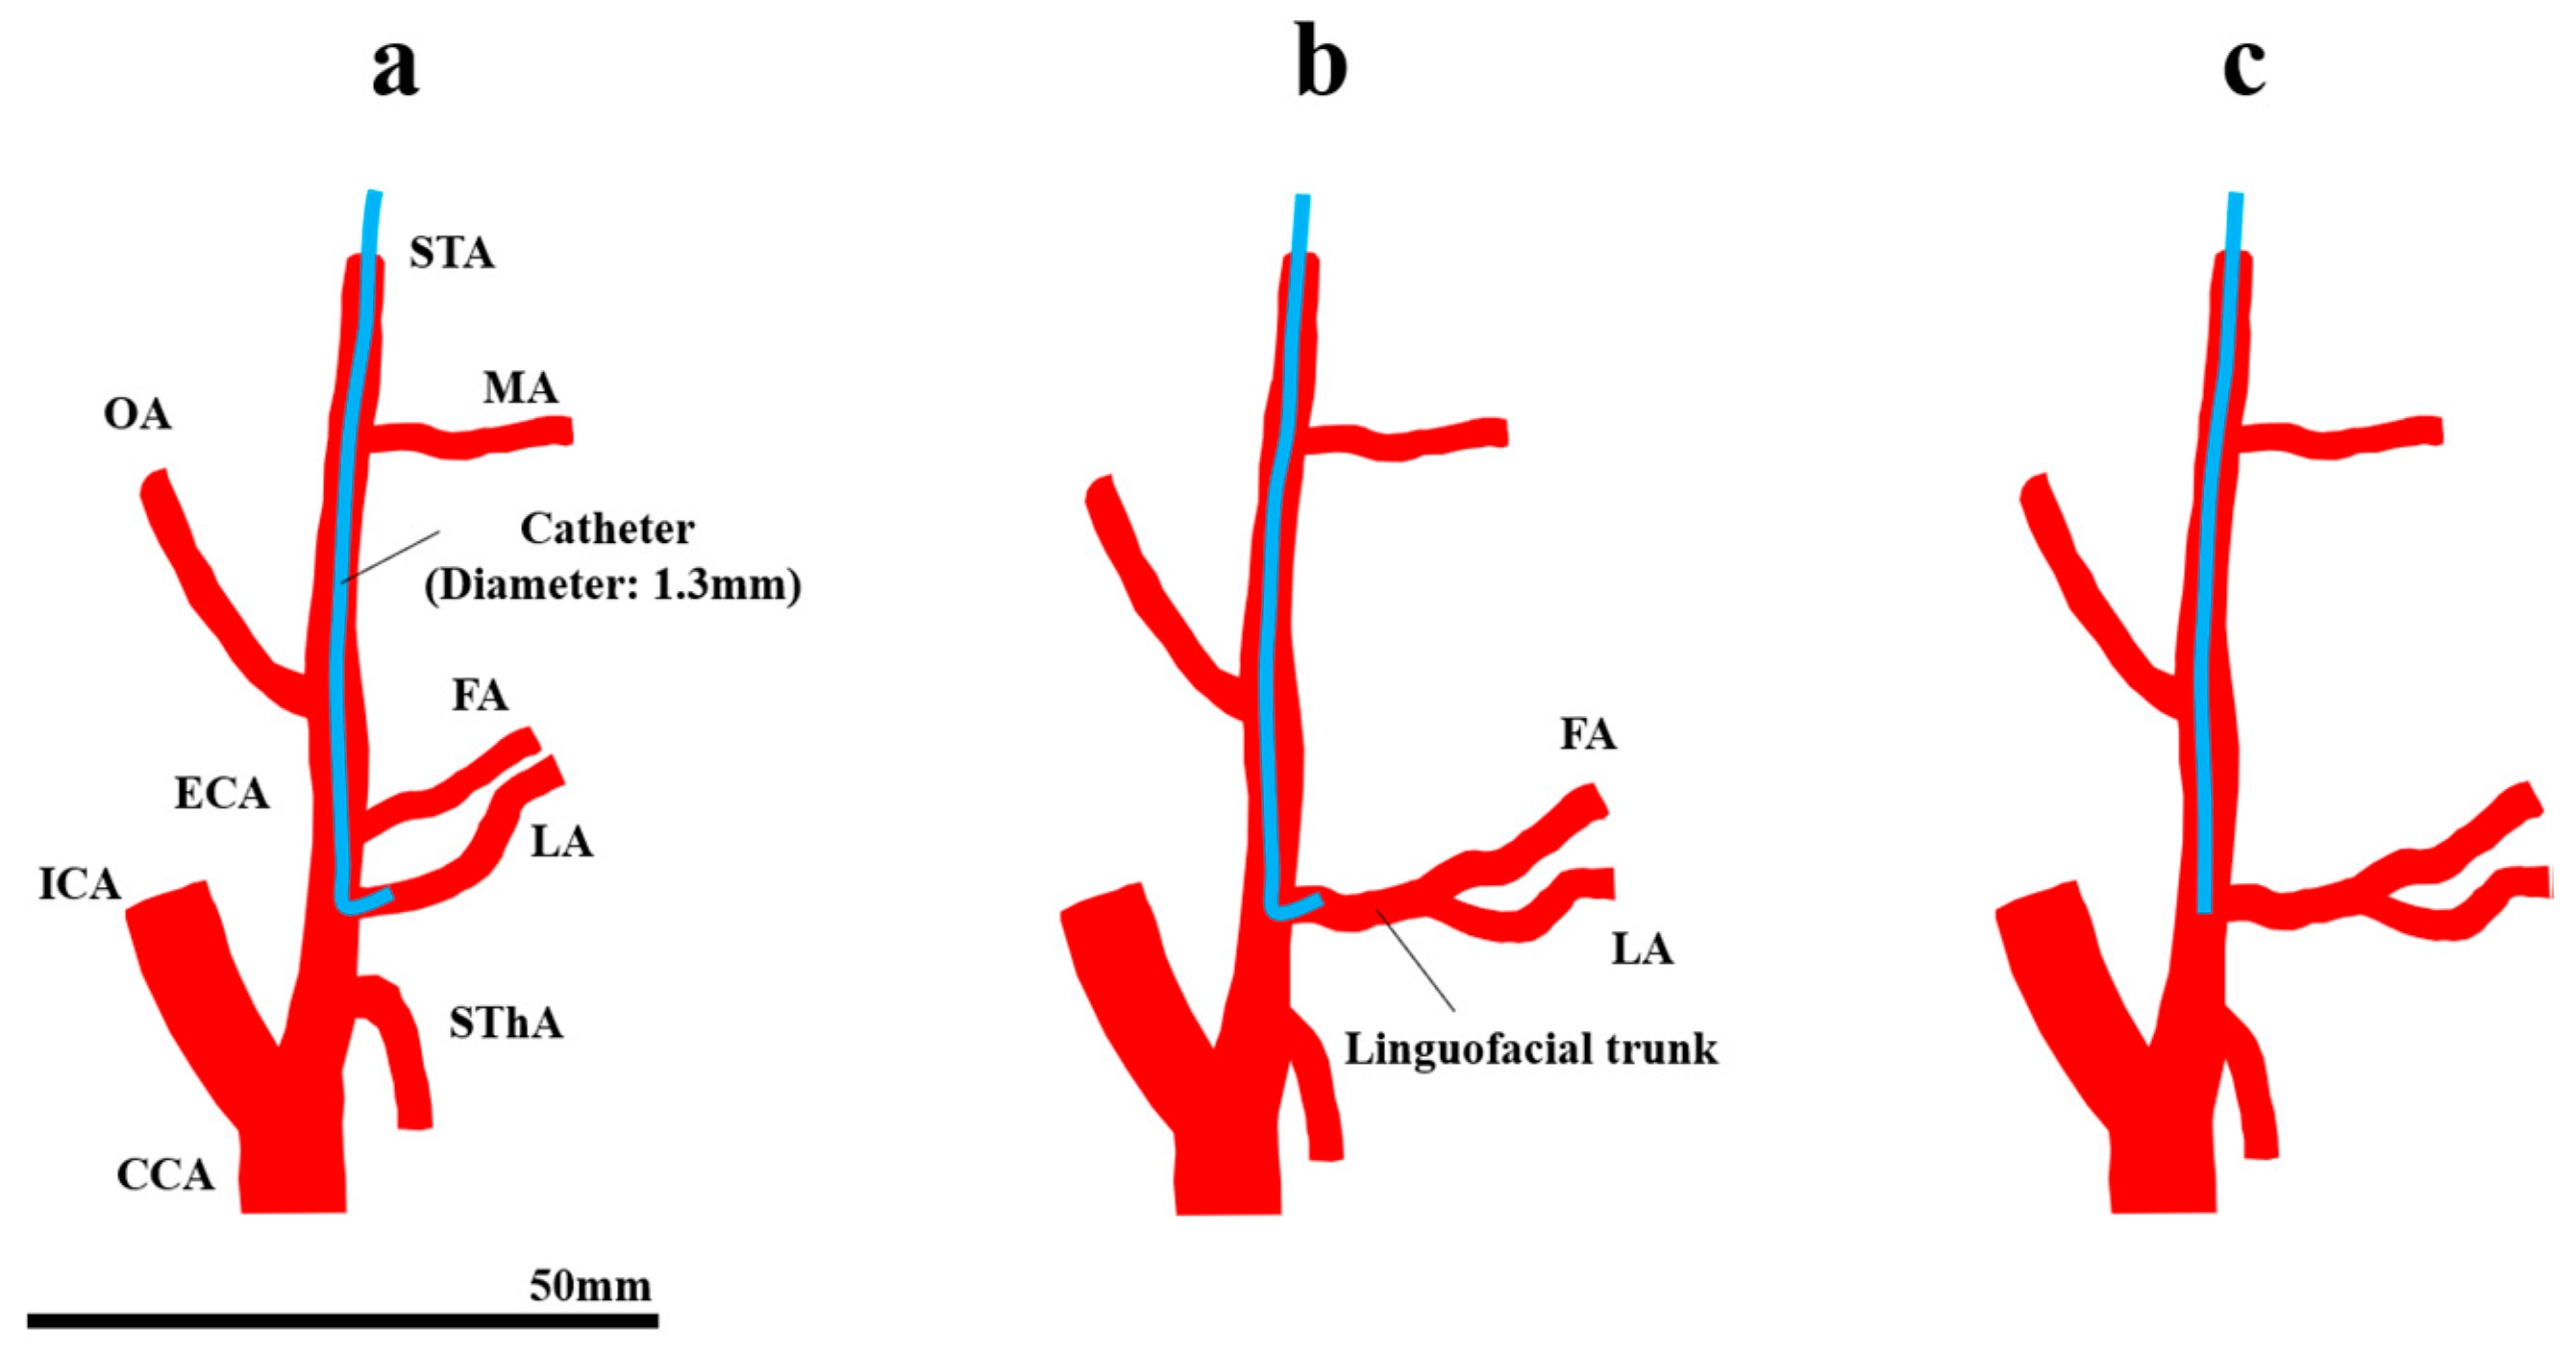
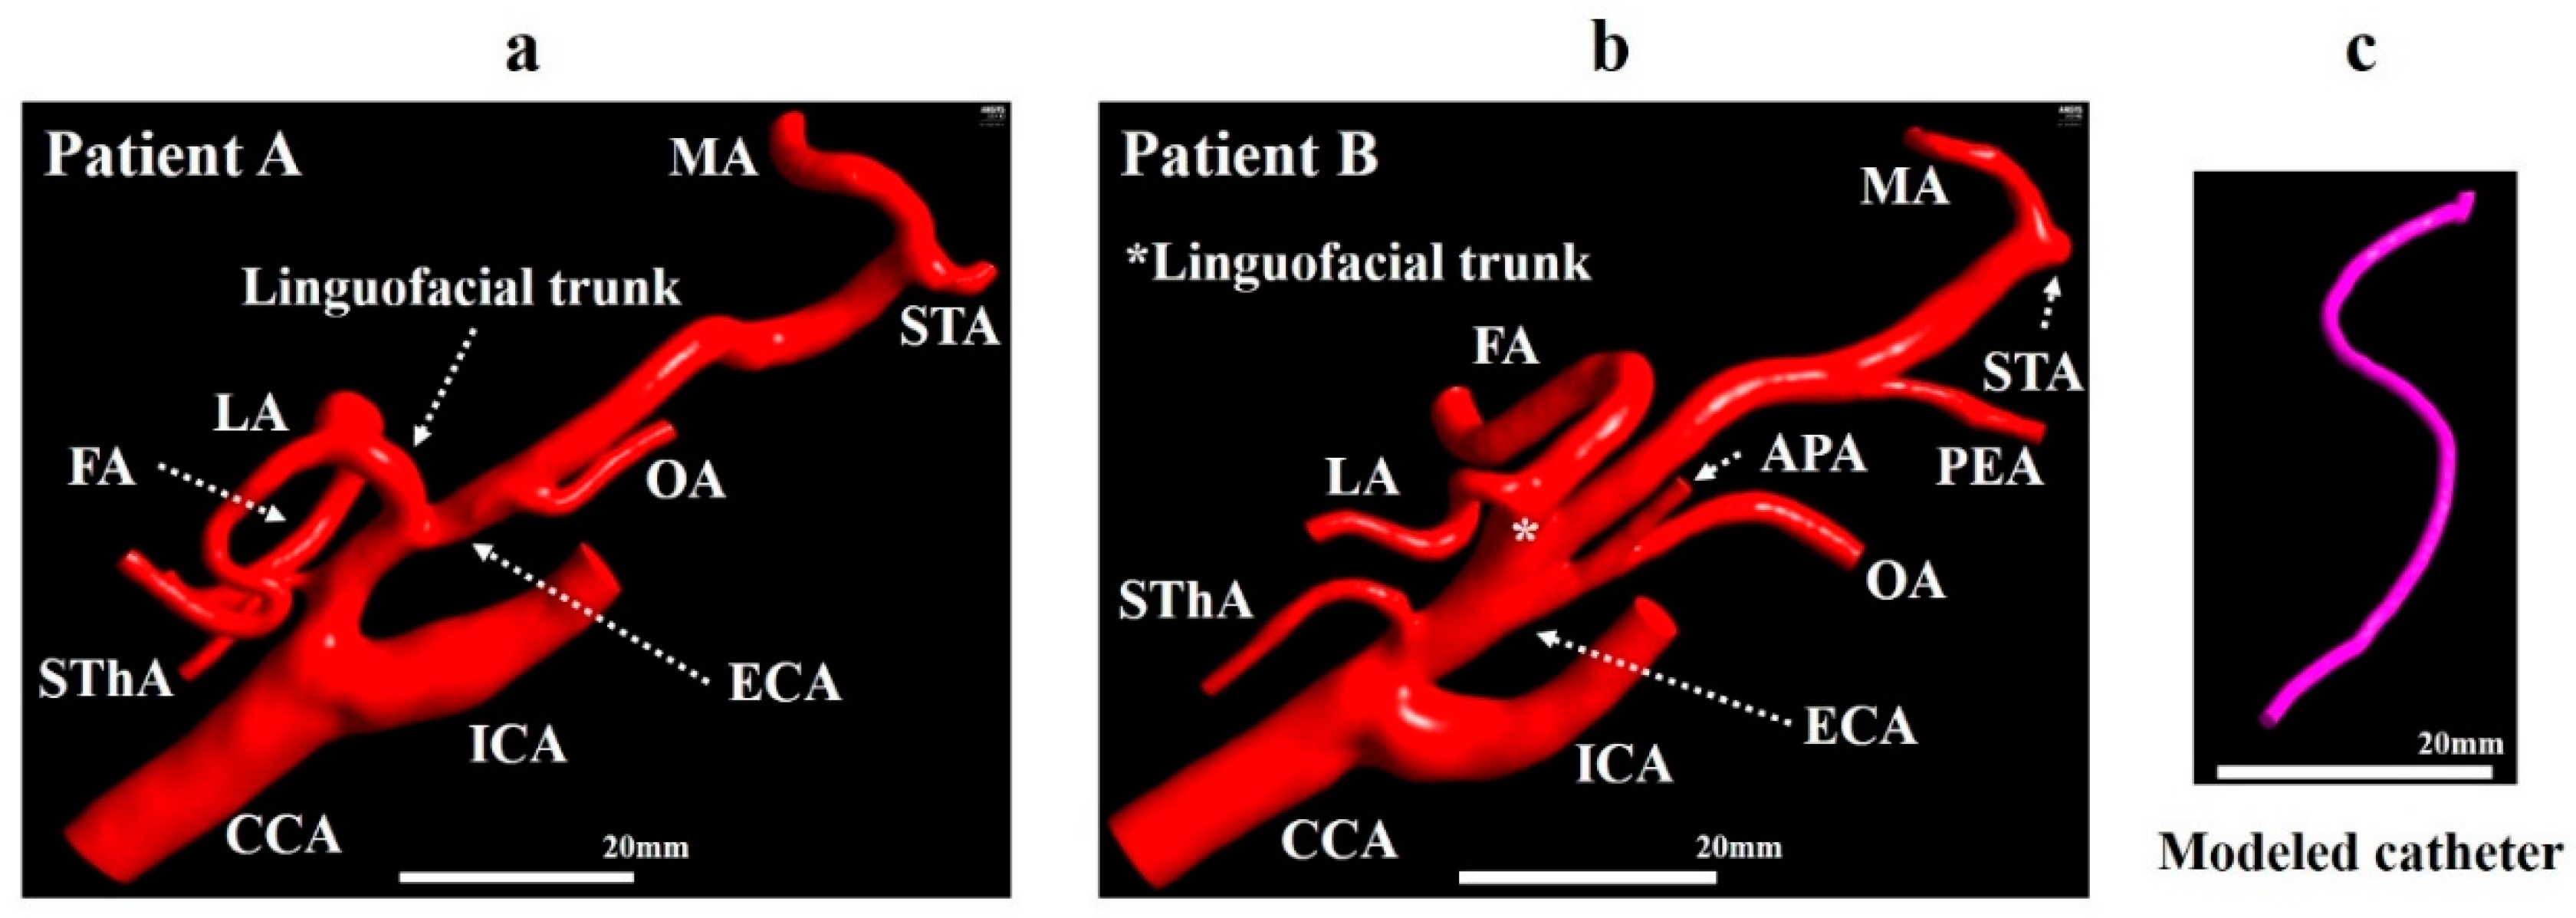
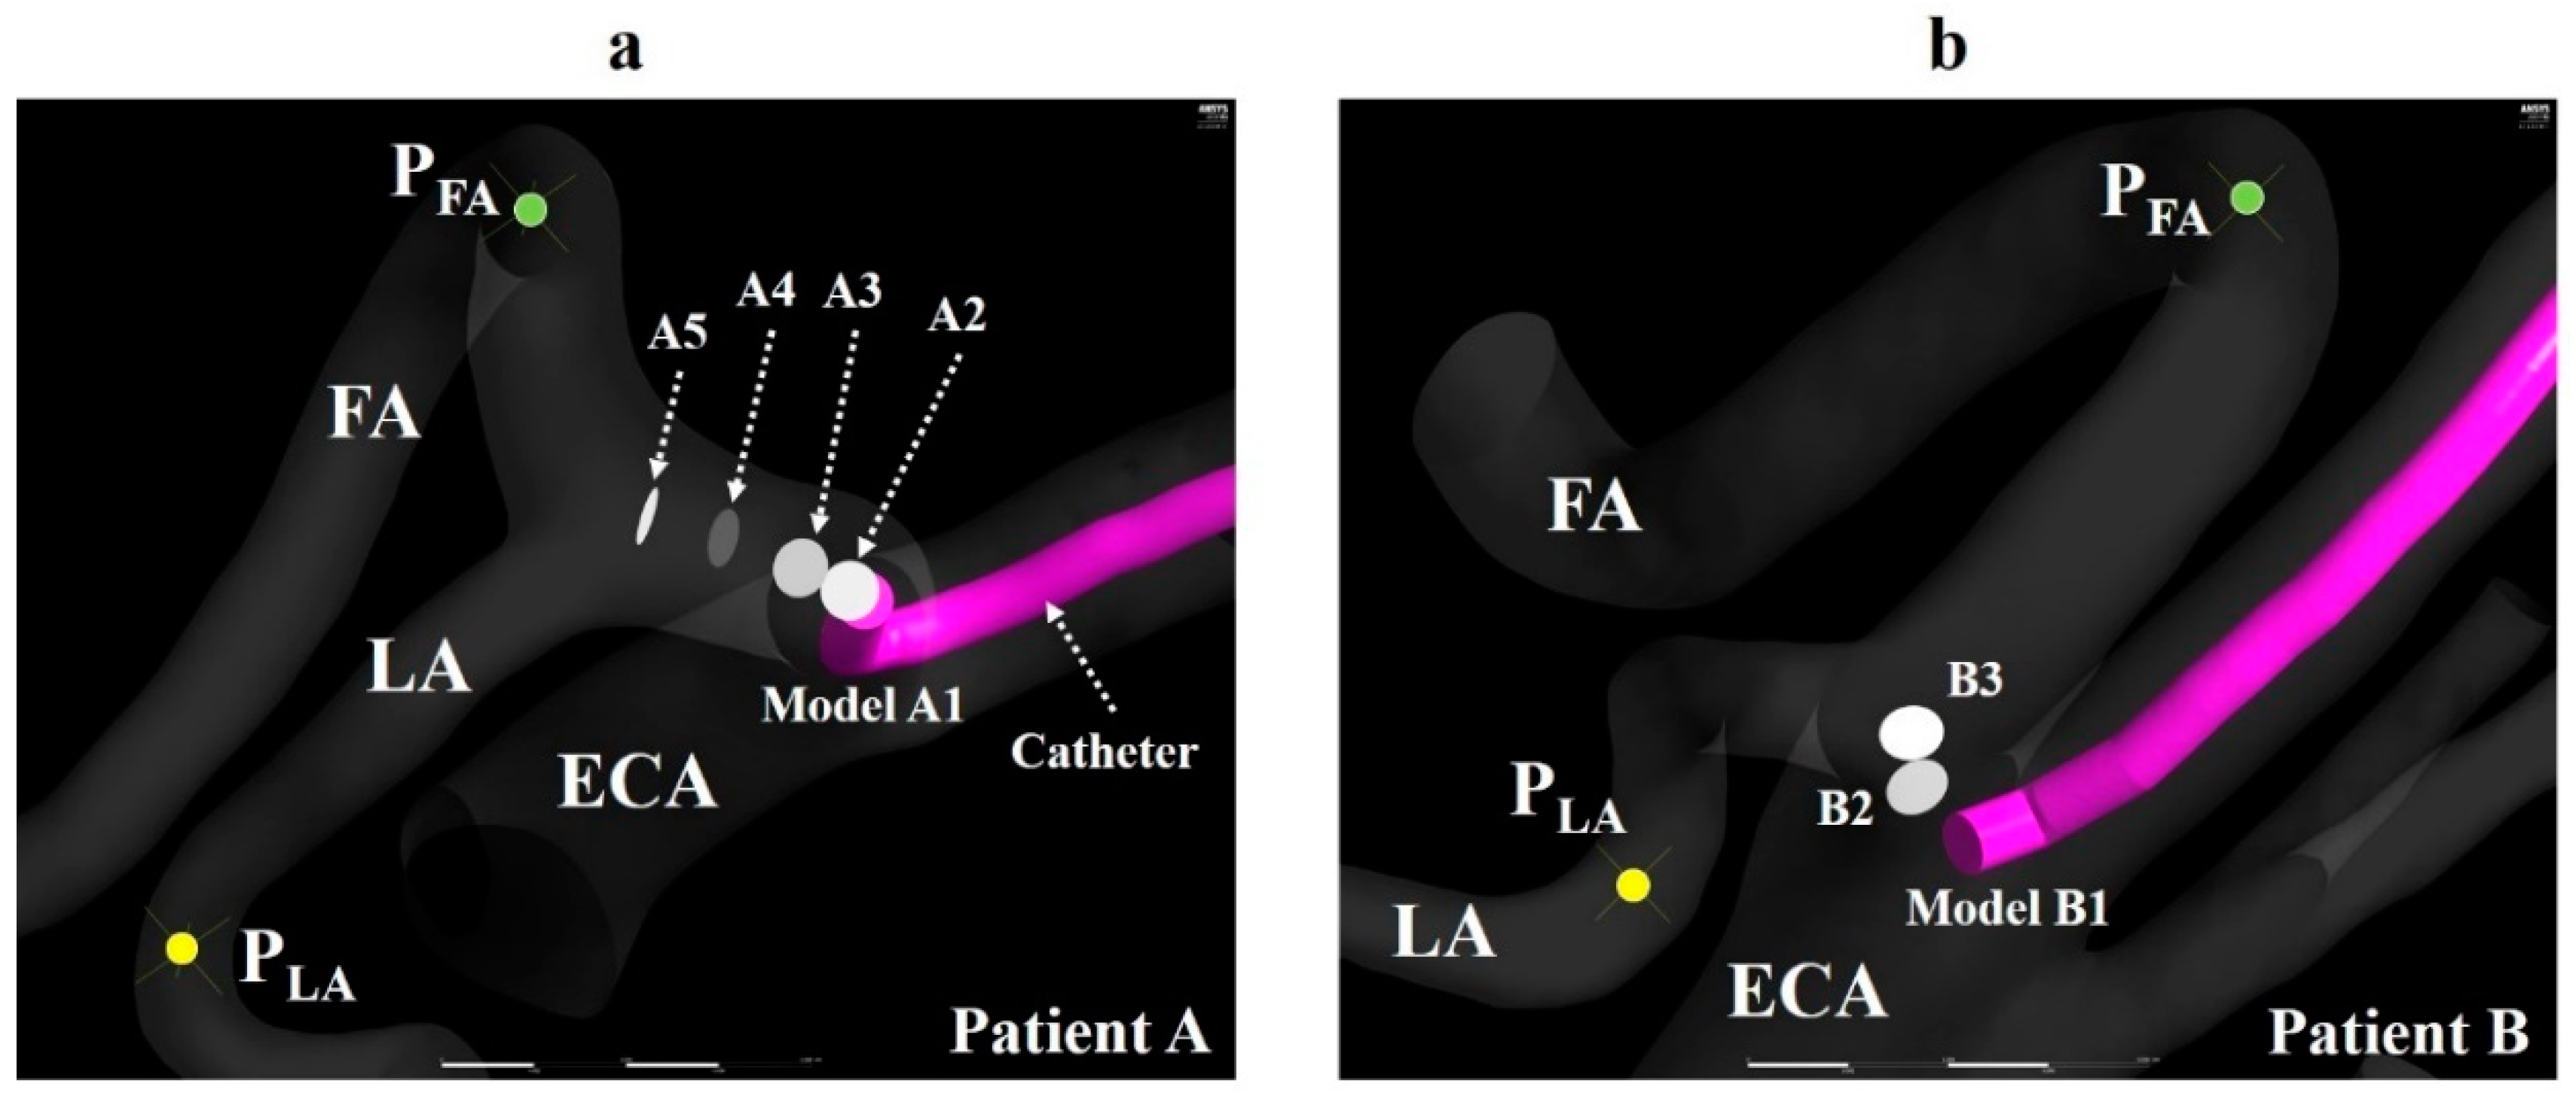
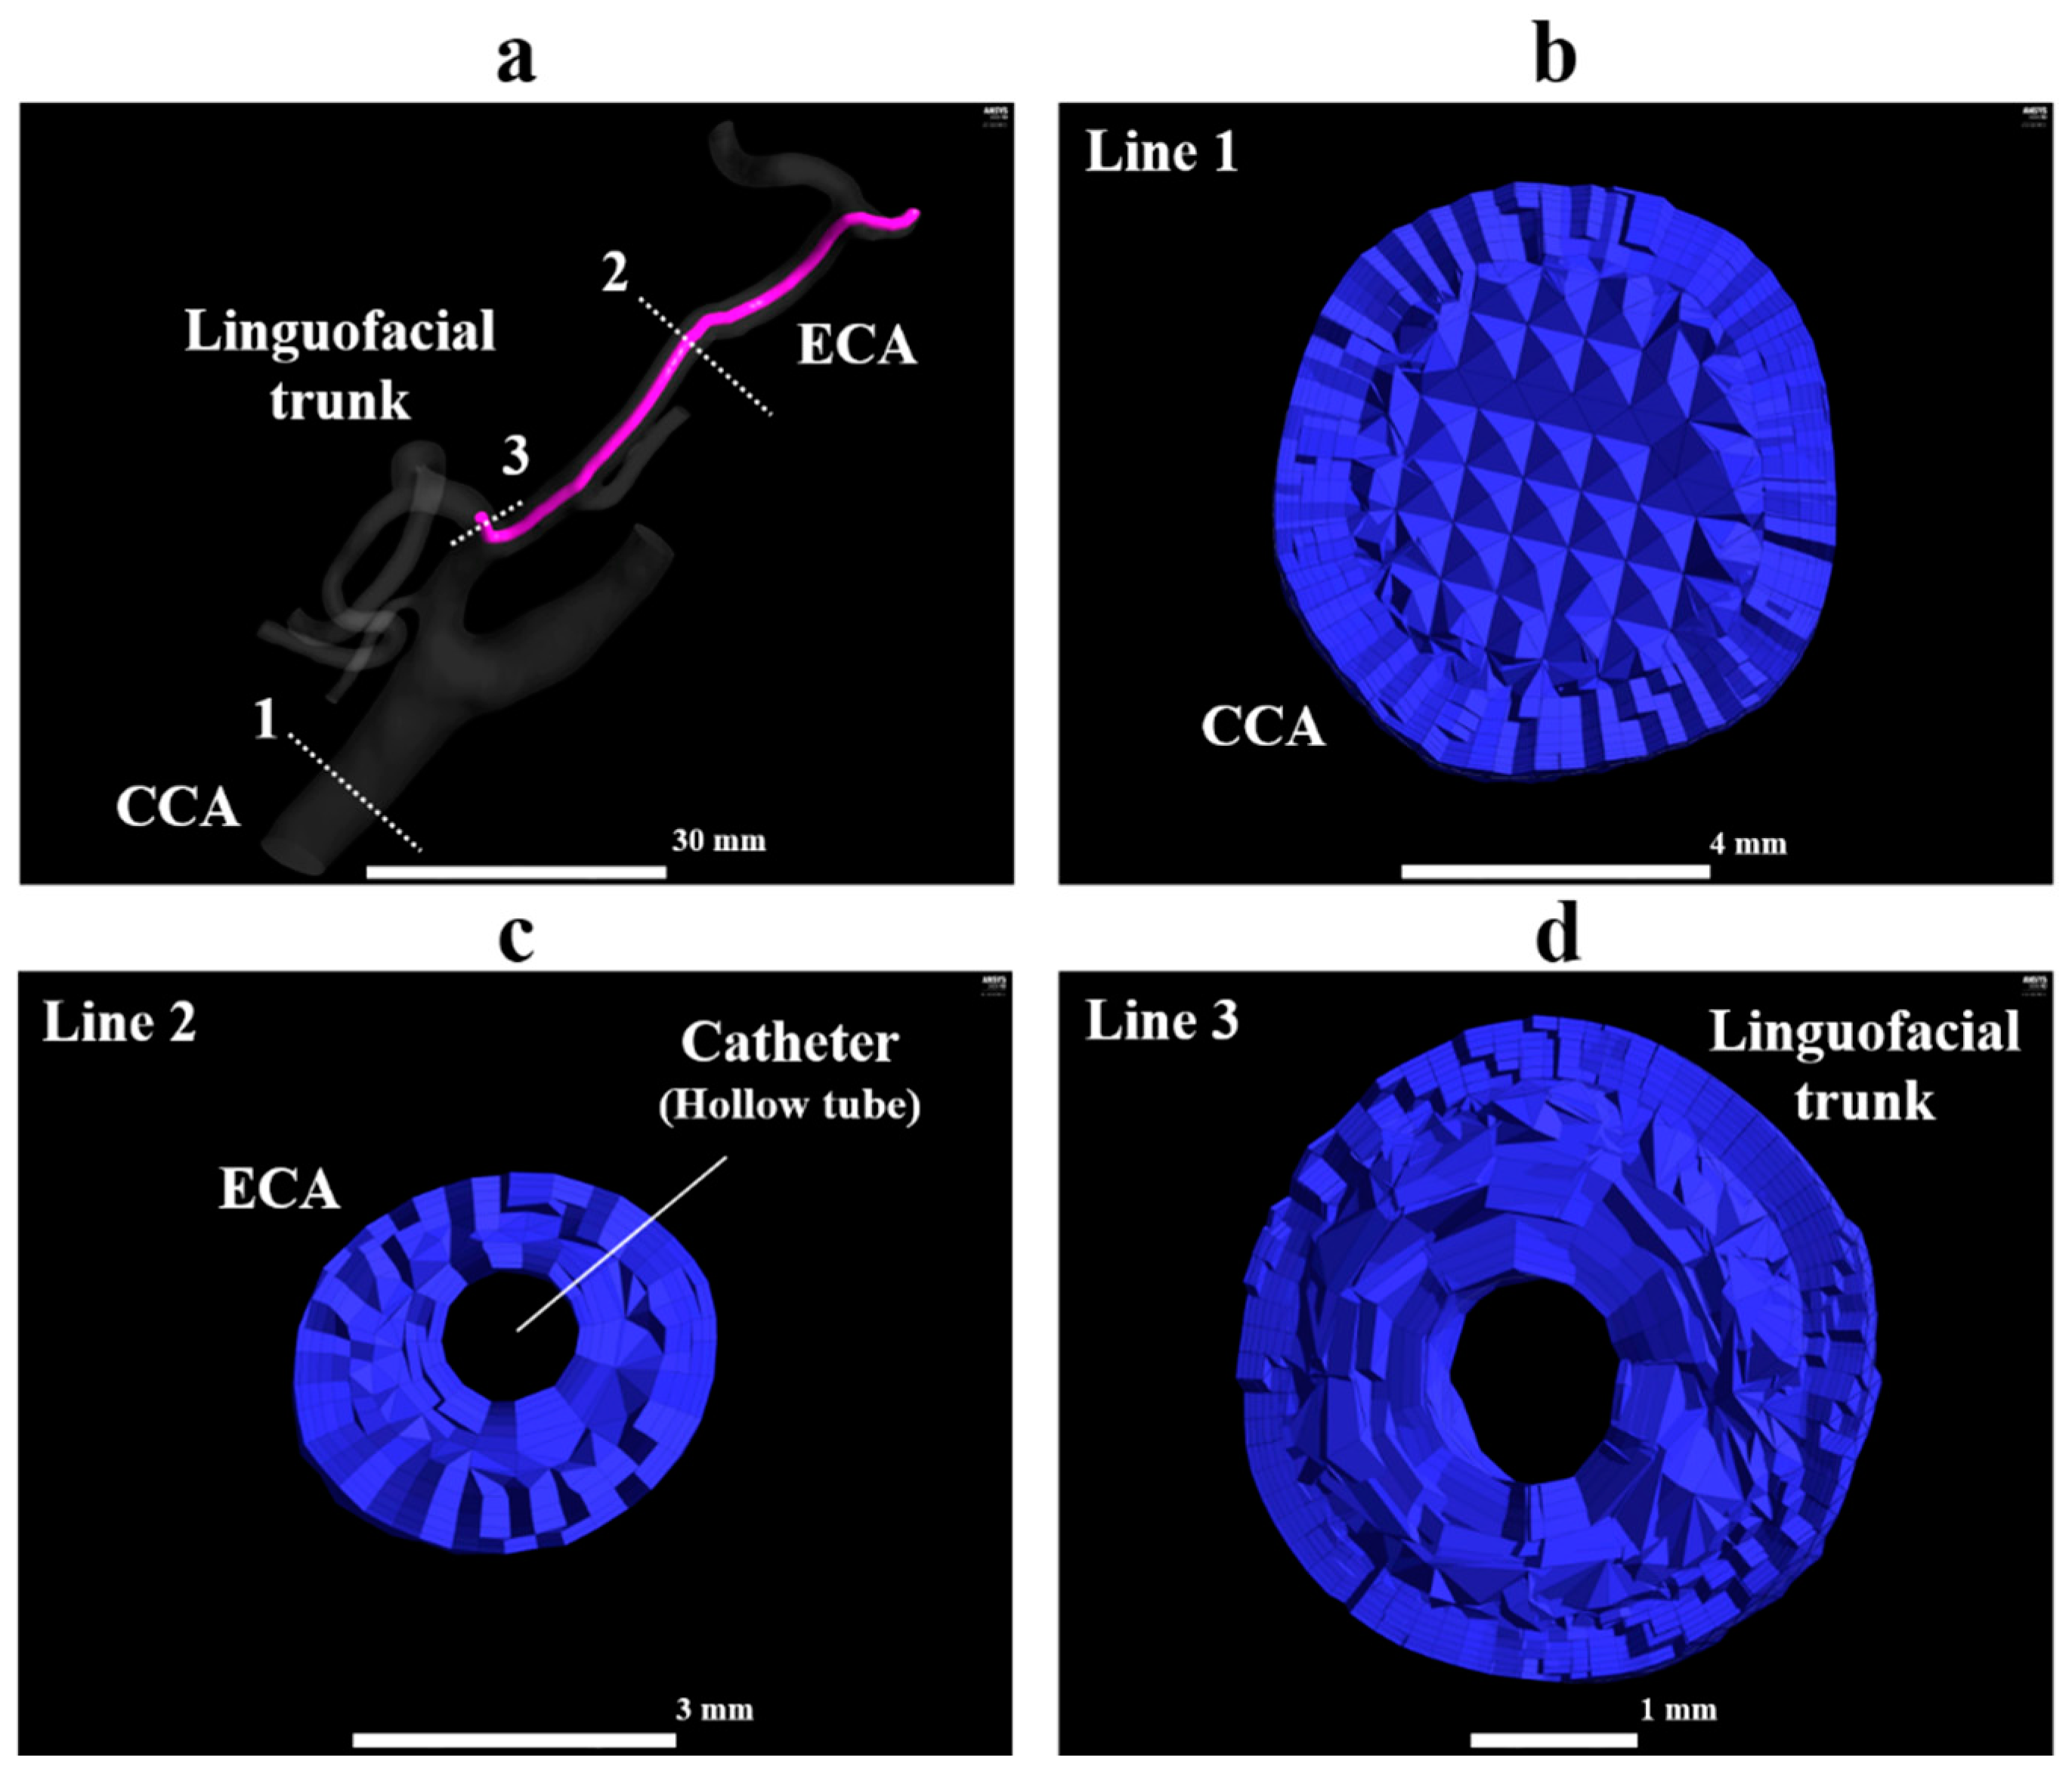
2.1. Geometrical Model and Mesh Generation

Digital Imaging and Communications in Medicine data obtained by CT angiography in two patients with right oral cancer with the linguofacial trunk (patients A and B) were imported into the 3D Slicer software (4.10.2, The Slicer Community, http://www.slicer.org). In 3D Slicer, the vascular tissue was extracted by applying thresholding functions. The analysis region for the CFD was extracted manually. The models for patient A included the CCA, ICA, superior thyroid artery (SThA), LA, FA, occipital artery (OA), maxillary artery (MA), and superficial temporal artery (STA) (Figure 2a). In addition to these eight branches, the models for patient B included the ascending pharyngeal artery (APA) and postauricular artery (PAA) (Figure 2b). The diameters of the inlet of the CCA in patient A model and patient B model were 7.0 and 6.9 mm, respectively.
The centerlines of the ECA and linguofacial trunk were presented using the VMTK module in 3D Slicer. Then, a catheter with a diameter of 1.3 mm was created, assuming a catheter used clinically (Figure 2c), and placed according to the centerline using Markups to Model function. Models A0 and B0 and models A1–A5 and B1–B3 were generated to mimic the CIAC and SSIAC, respectively. The catheter position was defined as follows (Figure 3a,b).
1. The catheter tip was placed in the main trunk of the ECA (models A0 and B0).
2. The catheter tip was placed at the bifurcation point of the LA and FA (models A5 and B3).
3. The catheter tip was pulled toward the central site of the linguofacial trunk and placed every 2 mm along the centerline of the linguofacial trunk (models A1–A4 and B1–B2).
In all models, the observation point was set in the LA and FA and named as PLA and PFA, respectively (Figure 3a,b). The zones within a radius of 2 mm from the center of the catheter tip, PLA, and PFA were defined as the catheter zone, LA zone, and FA zone, respectively. These zones were used to calculate the concentration gradients of fluids (section “Numerical condition”). A smaller number of models were created for patient B than for patient A, because the length of the linguofacial trunk in patient B was shorter than that in patient A. These generated models for the vessel and catheter were imported into Mimics 18 (Materialise, Leuven, Belgium) in Standard Triangle Language (STL) format, and the vessel and catheter were combined using Boolean operators. STL data were imported into 3-matic 10.0 (Materialise, Leuven, Belgium), and the CCA, ICA, and ECA branches were segmented. A total of six models for patient A and of four models for patient B were imported into the ICEM CFD (2019 R1, ANSYS Inc., Canonsburg, PA, USA) for the mesh generation. The mesh size was determined based on our previous study [14]. Figure 4 shows the mesh for model A1. The mesh in the present study was composed of tetrahedral cells in the artery core and from 4 to 7 prismatic layers in the region near the artery wall and the catheter wall. The inside of the catheter was treated as a hollow tube without mesh. The average lengths of the cell edge in patient A models and patient B models were 0.11 and 0.13 mm, respectively. The average total numbers of cells for patients A and B were 1,756,023 and 2,623,782, respectively.

2.2. Numerical Method

The tetra-prism mesh was imported into Fluent (2019 R1, ANSYS Inc., Canonsburg, PA, USA). A species transportation model was utilized to track blood and anticancer agent flow. In the species transportation model, the concentration (mass fractions) of species can be traced by solving mass and momentum conservation equations and species transportation equation. In Fluent, the species transportation equation is written as follows:
t ( ρ m Y i ) + · ( ρ m v Y i ) = · J i
where Y i is the local mass fraction and subscription i is the species number. For species number, the anticancer agent and blood were set as 0 and 1, respectively. The mass fraction of the anticancer agent ( Y 0 ) was determined using Equation (1), while the mass fraction of blood ( Y 1 ) was calculated as the difference between 1 and Y 0 because the sum of the mass fraction is 1. J i is the diffusion flux of species i , which was caused by gradients of Y i and diffusion coefficient between species. In this study, the effect of the type of IAC (CIAC and SSIAC), catheter tip positions, and injection mass on the distribution of the fluids among the ECA branches were focused on. Hence, the fluid injected from the catheter tip was assumed to be water (H2O) and defined as the “agent.” No study investigated the diffusion coefficient between blood and anticancer agent or H2O. Moreover, the diffusion coefficients between the two liquids reportedly ranged from 0.25 × 10⁻⁹ to 4.56 × 10⁻⁹ m2/s [15]. Therefore, the self-diffusion coefficient of H2O at 25 °C, 2.299 × 10⁻⁹ m2/s [16], was utilized for the value. ρ m is the density (kg/m3) of the mixture of agent and blood and described in the section “Properties for fluids.”

2.3. Boundary Condition

The models of patient A had two velocity inlets (an inlet of the CCA and catheter tip) and six outlets (ICA, LA, FA, SThA, OA, MA). Models of patient B had two velocity inlets and eight outlets (ICA, LA, FA, SThA, OA, MA, APA, and PAA). The outlet of the STA was treated as the wall, because, in an actual phenomenon, the peripheral region of the STA is ligated with sutures after catheter insertion, and both anticancer agents and blood do not flow. For the inflow boundary condition, the velocities of the CCA of patients A and B were measured using ultrasonography, and the mean velocities of four cardiac cycles were calculated. The mean velocities of 0.40 m/s and 0.37 m/s for patients A and B were provided as the top velocities of parabolic flow at inlets of the CCA, respectively. At the catheter tip, a mass inflow of 1.38 × 10⁻⁵ kg/s was prescribed, which is equivalent to 50 mL/h, the velocity of injection with syringe driver in the actual phenomenon. For models A0 and B0, in addition to this boundary condition at the catheter tip, a mass inflow of 99.82 × 10⁻⁵ kg/s, which is equivalent to 1 mL/s, was also prescribed at the catheter tip, assuming manual injection of the dye for confirmation of the perfusion area. The value of mass inflow was gained by multiplying the density of the agent (998.2 kg/m3 = 99.82 × 10⁻⁵ kg/mL) by the velocity of manual injection of the dye in actual phenomenon (1 mL/s). For the outlet of all models, a zero-dimensional (0D) resistance model was applied to reproduce physiologically accurate blood flow in the carotid artery, which was developed in a previous study [14].

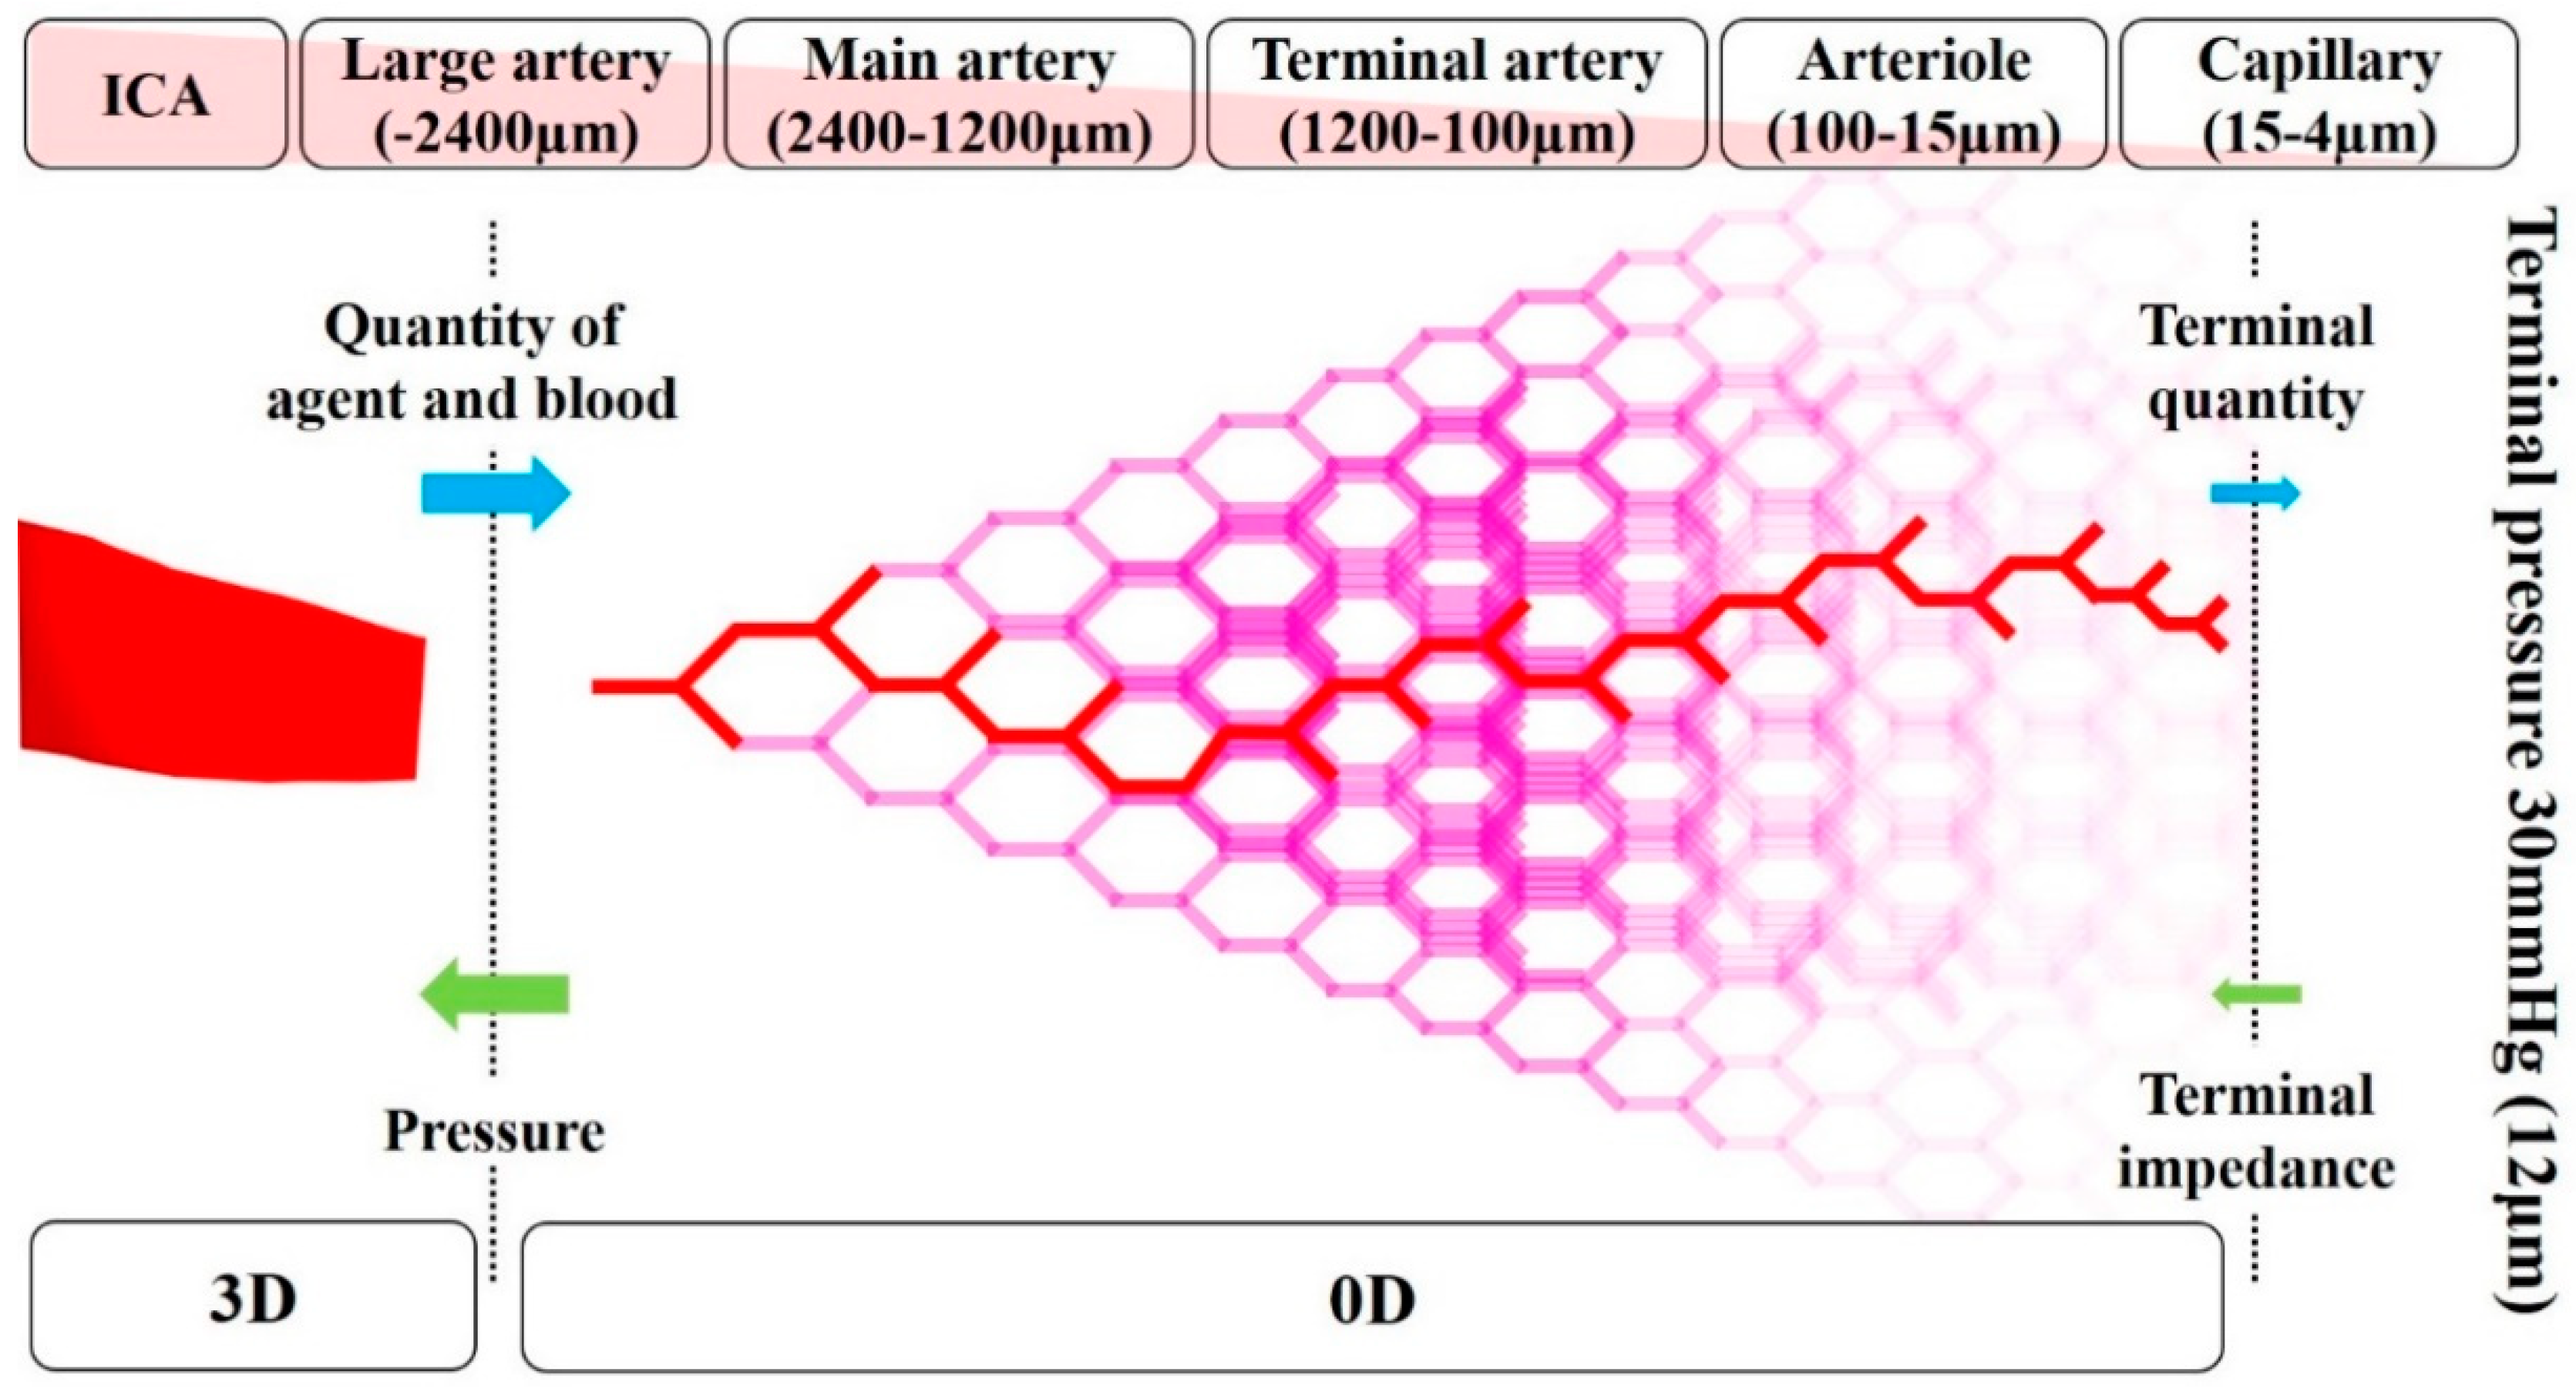
2.4. Zero-Dimensional Resistance Model

The image-based modeling method has been widely used to create geometrical vessel models for blood flow CFD analysis [17,18,19]. However, the peripheral vessels that are not depicted by medical images cannot be included in the models by this method, even though these vessels affect the simulation result. Therefore, in the previous study [14], a zero-dimensional (0D) resistance model was developed based on anatomical and physiological knowledge of human vessels to analyze blood flow in the carotid artery. It was demonstrated that physiologically accurate blood flow can be reproduced in the CFD analysis with the 0D resistance model [14]. The 0D resistance model returns the pressure (mmHg) at outlets in the 3D region according to the mass flow of blood and agent (kg/s) (Figure 5). In the 0D resistance model, the number of bifurcations in each five-vessel group, namely, large artery, the main artery, terminal artery, arteriole, and capillary, was calculated according to the area of outlet in the 3D region. According to the number of bifurcations, the terminal quantity of blood and agent was calculated. The terminal pressure at the capillary was fixed at 30 mmHg, which is assumed as the continuous pressure of the vein. Hence, the pressure at the outlet in the 3D region can be calculated backward.

2.5. Properties of fluids

In both the 3D and 0D regions, the density of the mixture of the agent and blood was defined by volume-weighted-mixing law in Fluent. Under this law, the density was calculated as a function of Y i as shown below:
ρ m = 1 i Y i ρ i
where ρ i is the density of the species i . ρ 0 (density of agent) and ρ 1 (density of blood) were set as 1050.0 and 998.2 m3/kg [13], respectively. In the 3D region, the viscosity of the mixture was defined using mass-weighted-mixing law as follows:
μ m = i Y i μ i
where μ m is the viscosity of the mixture and μ i is the viscosity of species i . μ 0 (viscosity of agent) and μ 1 (viscosity of blood) were set as 0.0010 and 0.0046 Pa s, respectively [13]. In the 0D resistance model, the viscosity of blood ( μ 1 ) was defined as the function of the diameter of the vessel detailed in [13,14].

2.6. Numerical Condition

The Reynolds numbers at the inlet of the CCA in patient A model and patient B model were 639 and 583, respectively. The values for the catheter tip in the analysis with the boundary condition of the syringe driver and that of manual injection were 13 and 978, respectively. Hence the fluid flow in this study can be regarded as laminar. In actual practice, an anticancer agent is injected for 1 h at a constant velocity, which is a sufficiently long time compared to the duration of one cardiac cycle in the human body (less than 1 s). Therefore, the fluctuation of the blood flow velocity in the carotid artery caused by cardiac cycles was thought to be negligible. The steady-state analysis was used to resolve the fluid field.
The steady-state analysis was performed on a computer with Microsoft Windows (Microsoft Windows 10 Professional, Microsoft Corp., Redmond, WA, USA). A semi-implicit method for pressure linkage equations scheme for coupling with velocity and pressure was utilized. The 0D resistance model was applied using a user-defined function code. The distribution rate of the agent at the outlet was monitored during the analysis, which was calculated by dividing the mass of the agent at the outlets by one at the catheter tip. Each analysis was regarded to converge when the distribution rate showed oscillations <10−3. The gradients of the mass fraction of the agent in the catheter zone, FA zone, and LA zone were calculated using Fluent after convergence was achieved.

2.7. Wall Share Stress Observation
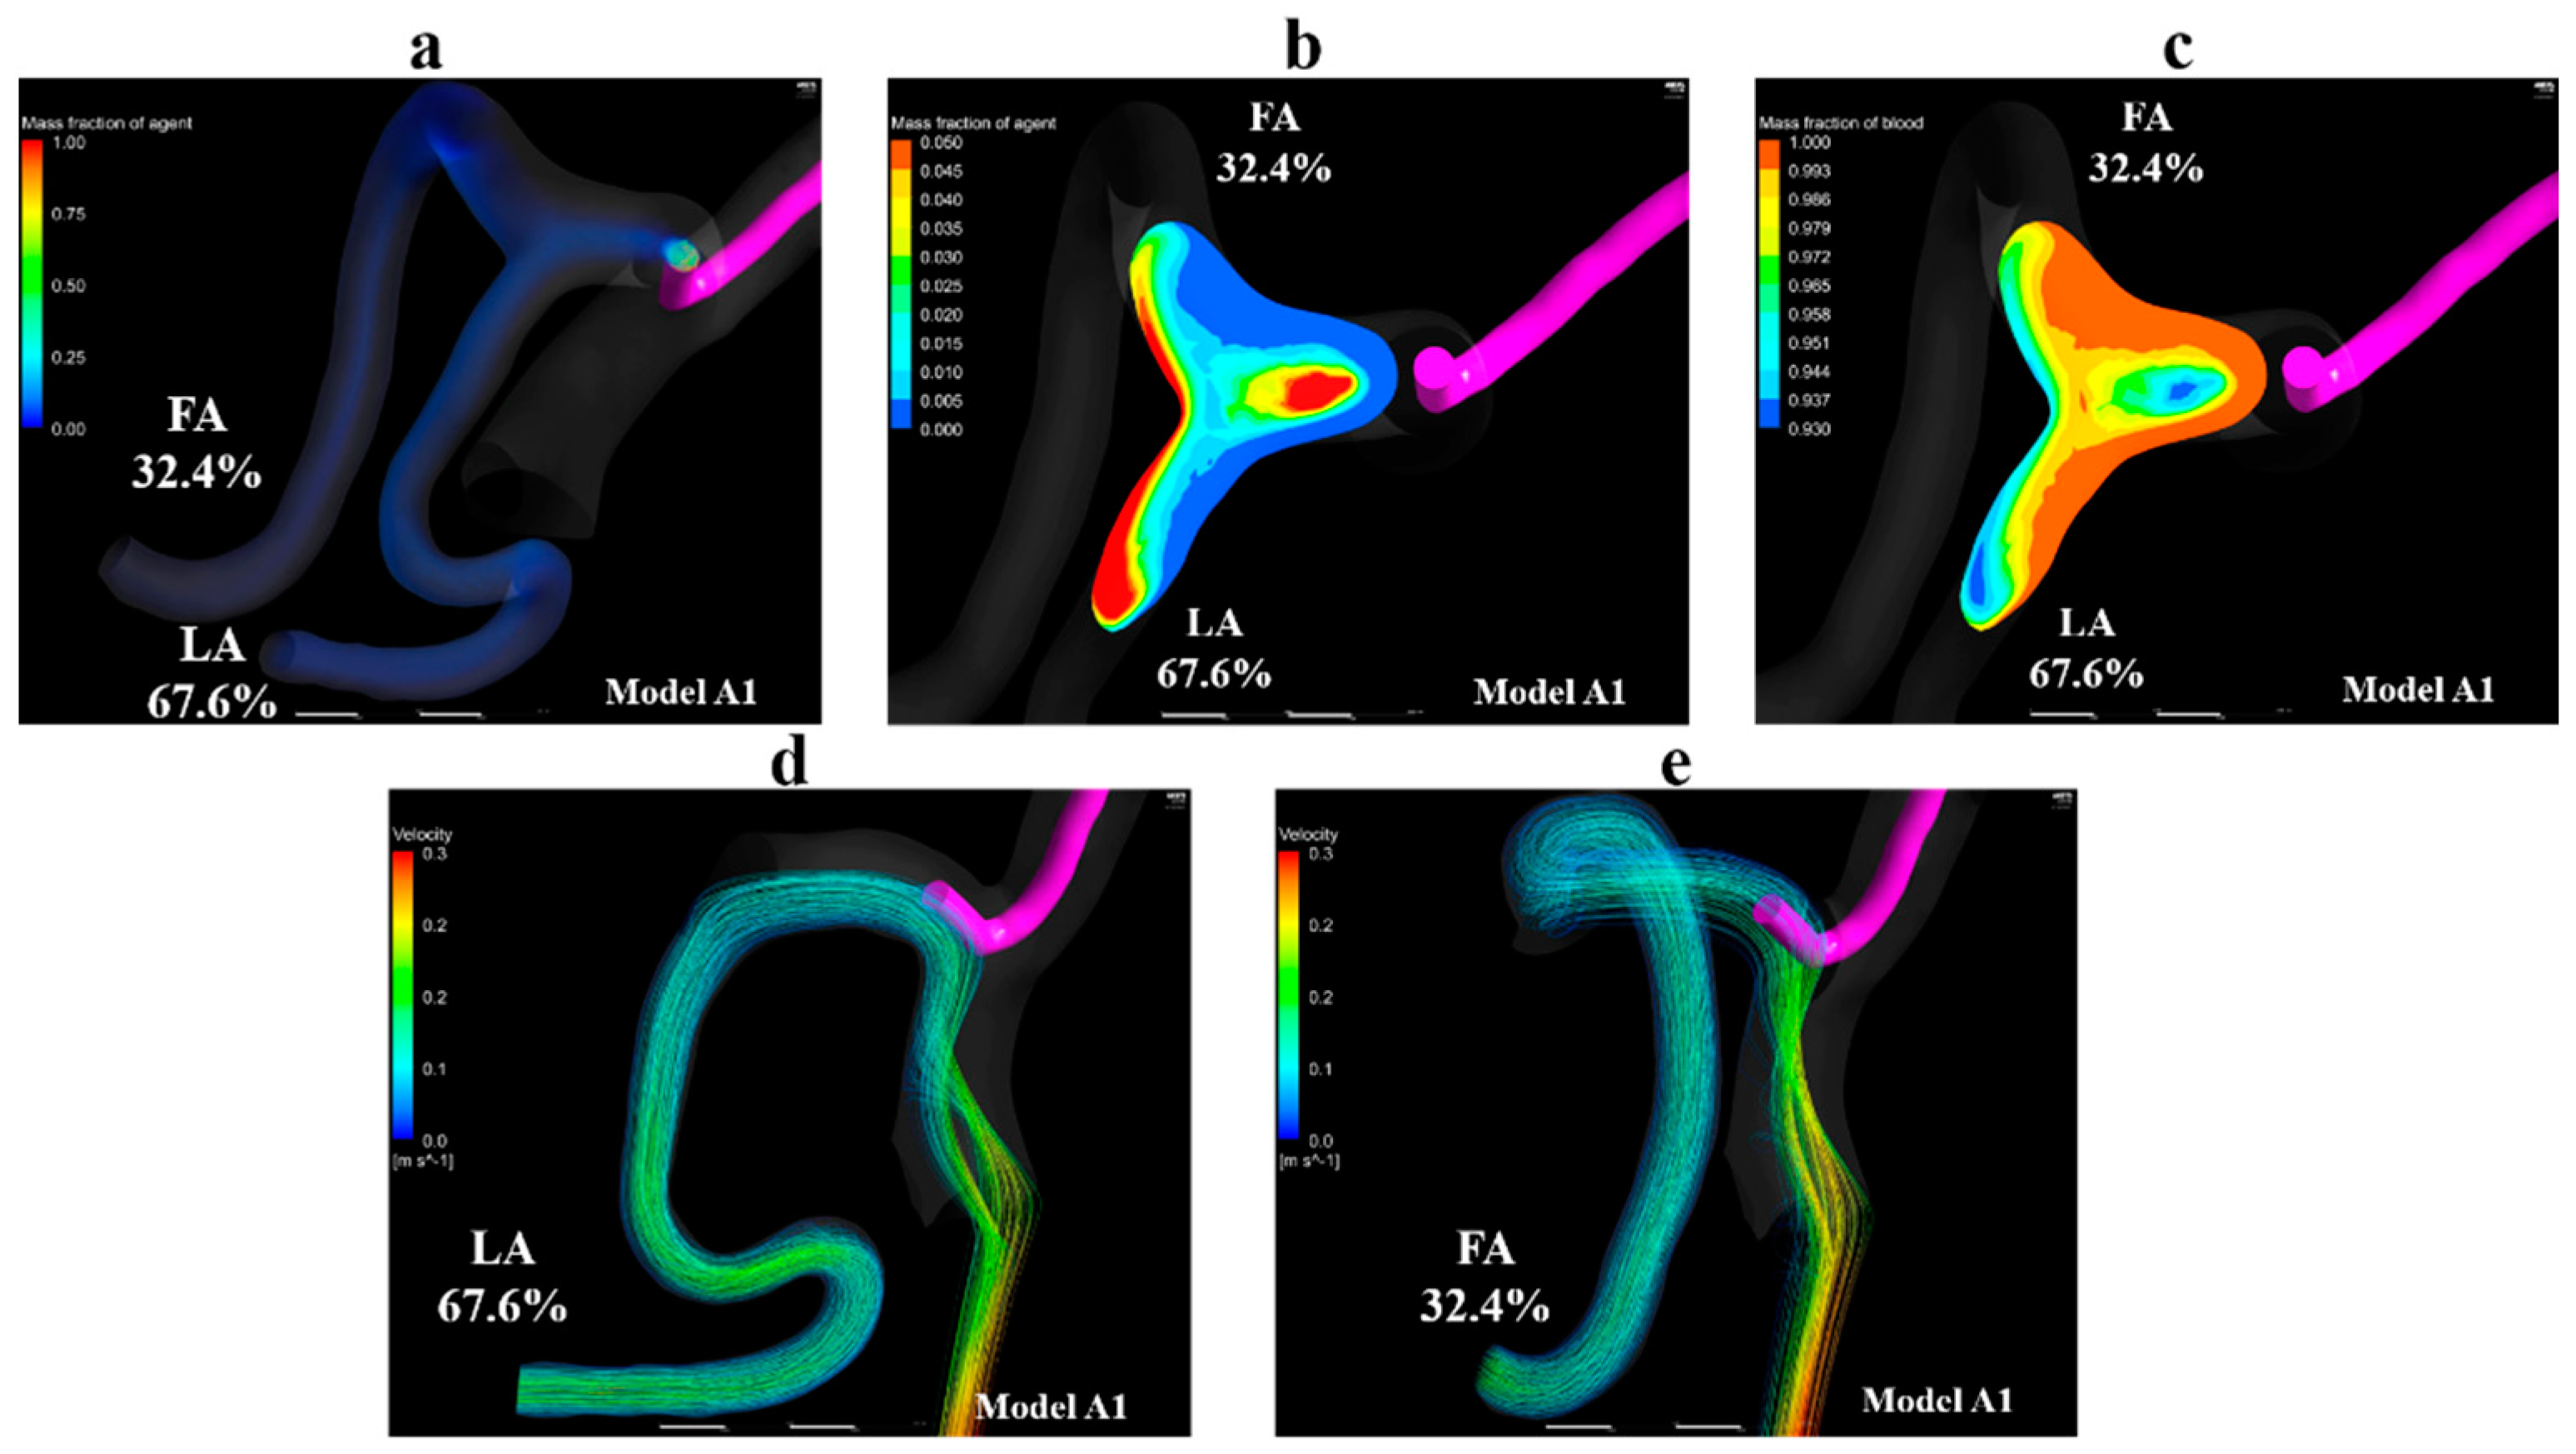
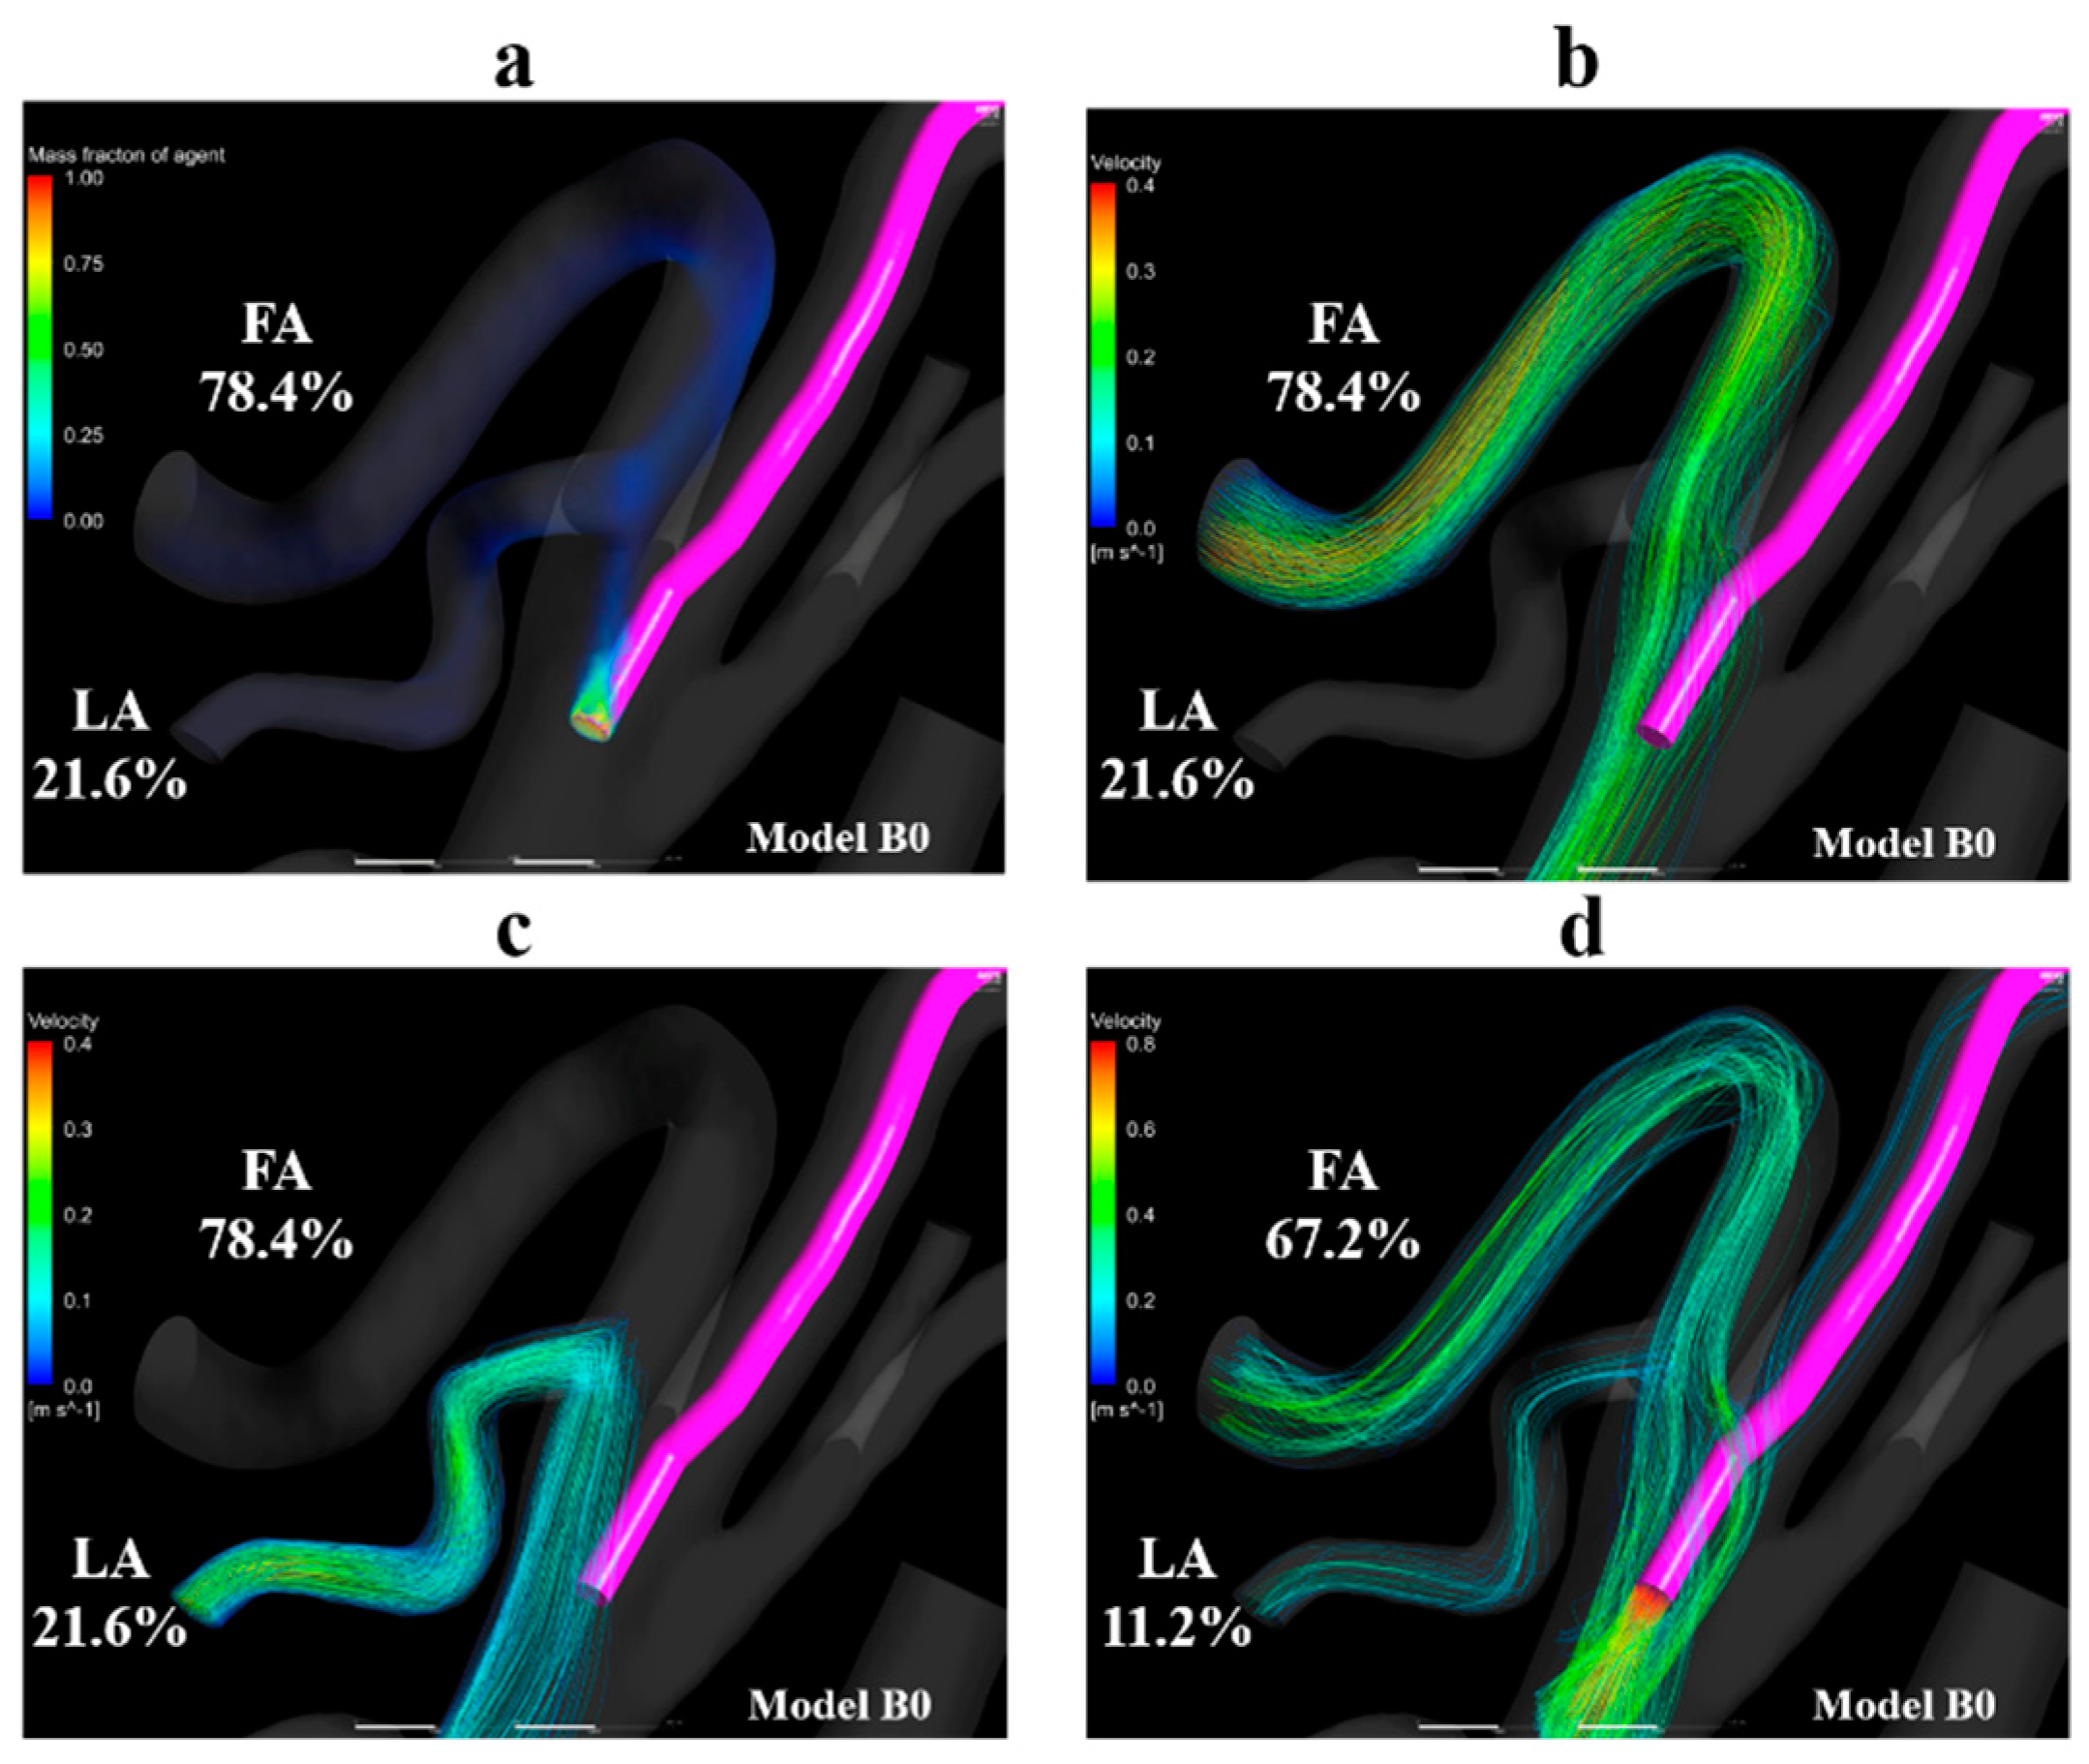
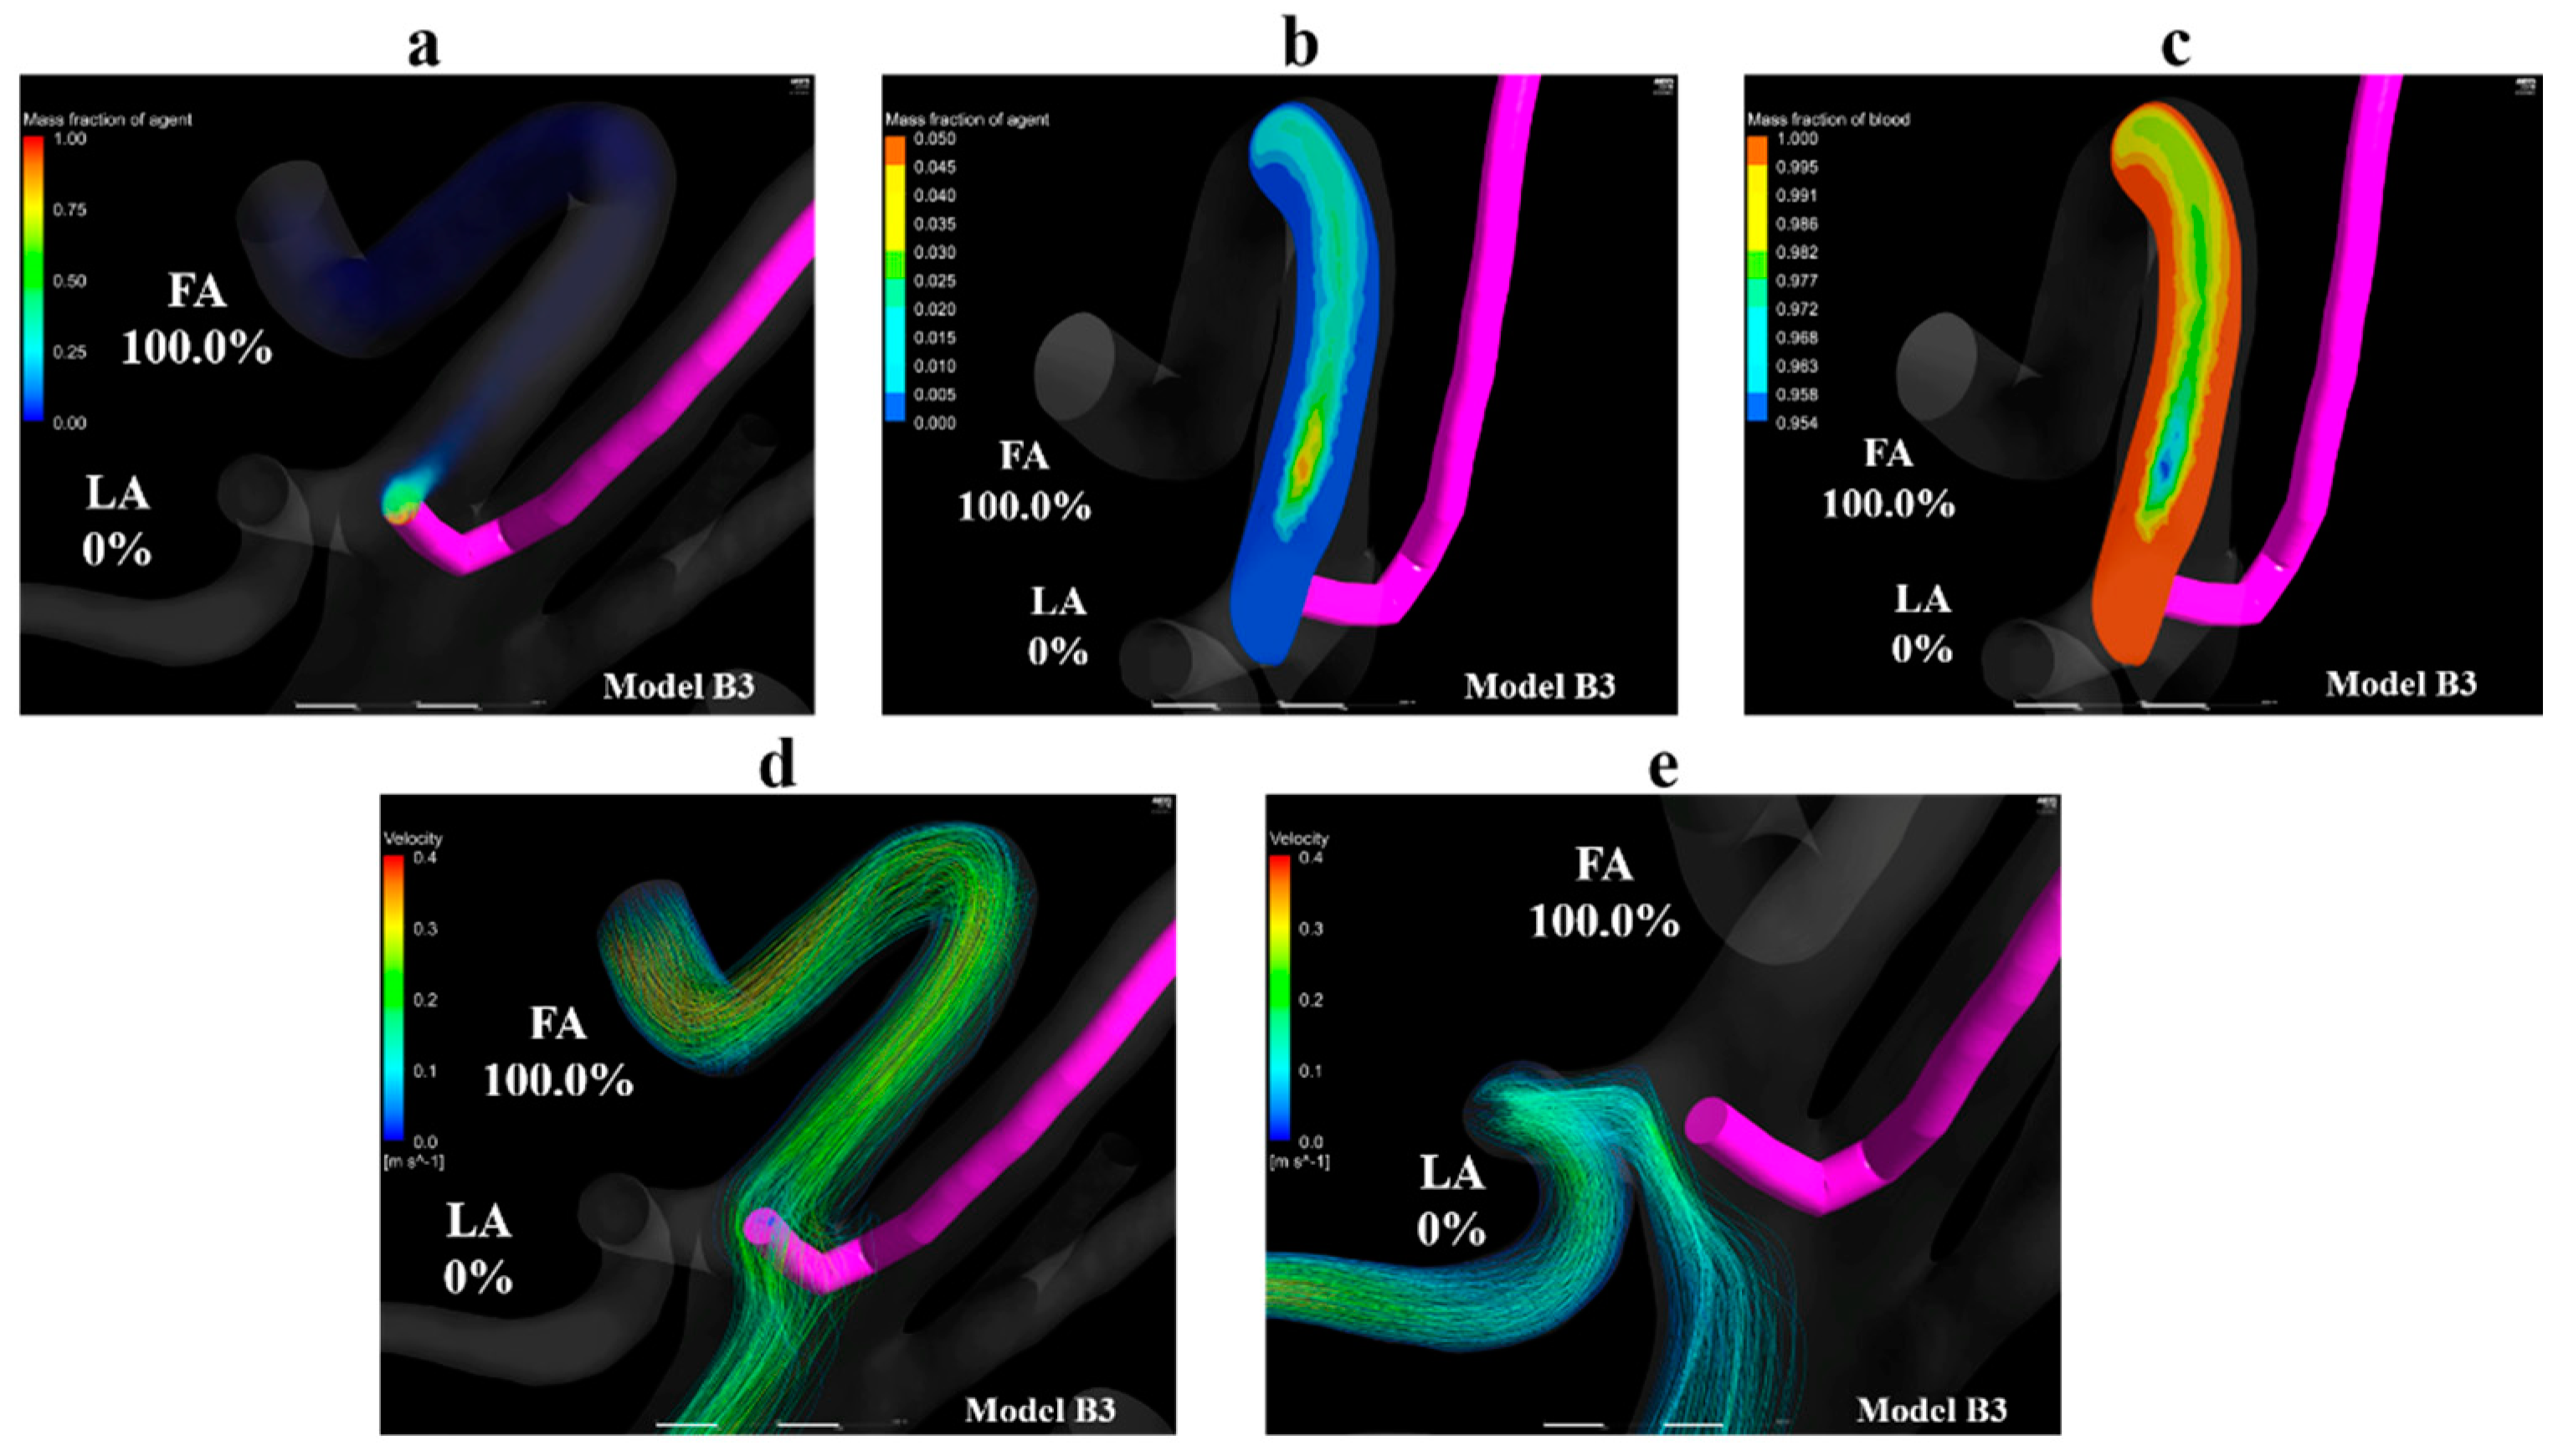
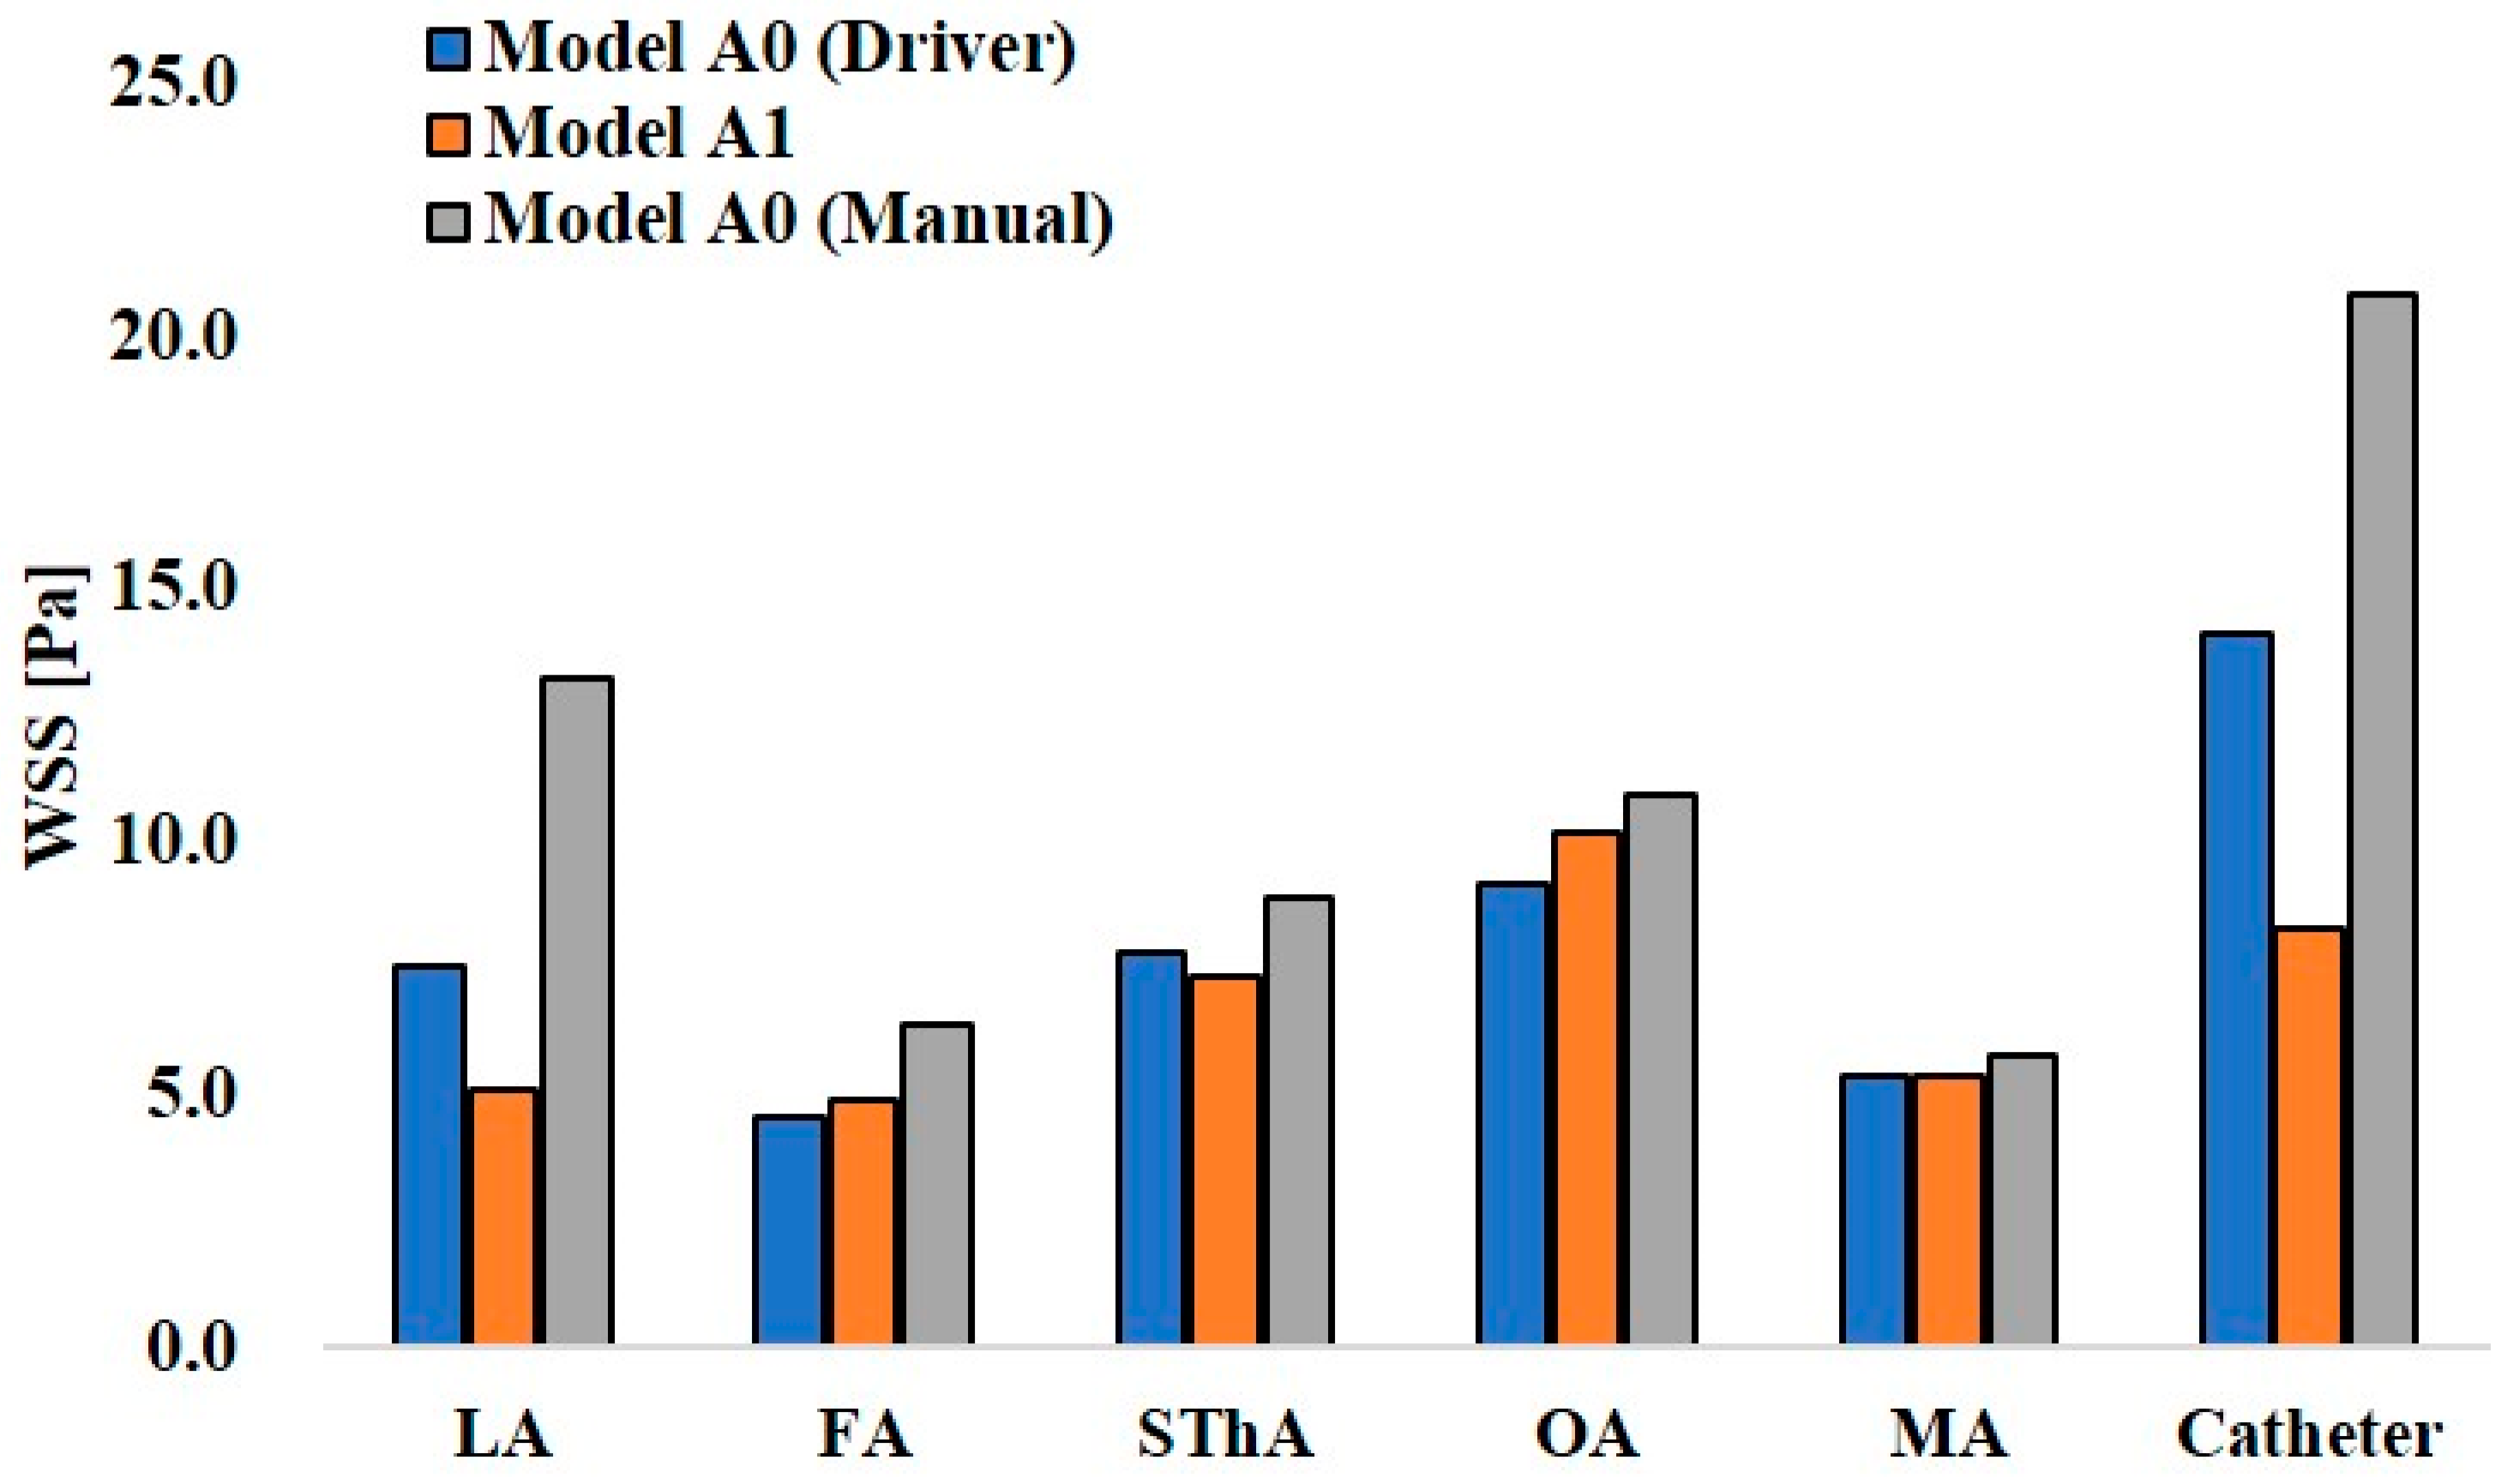
Wall share stress (WSS) was calculated in models A0 and B0 with two injection conditions and in models A1 and B1 to evaluate the mechanical loading on the vessel and catheter during the injection.

3. Results

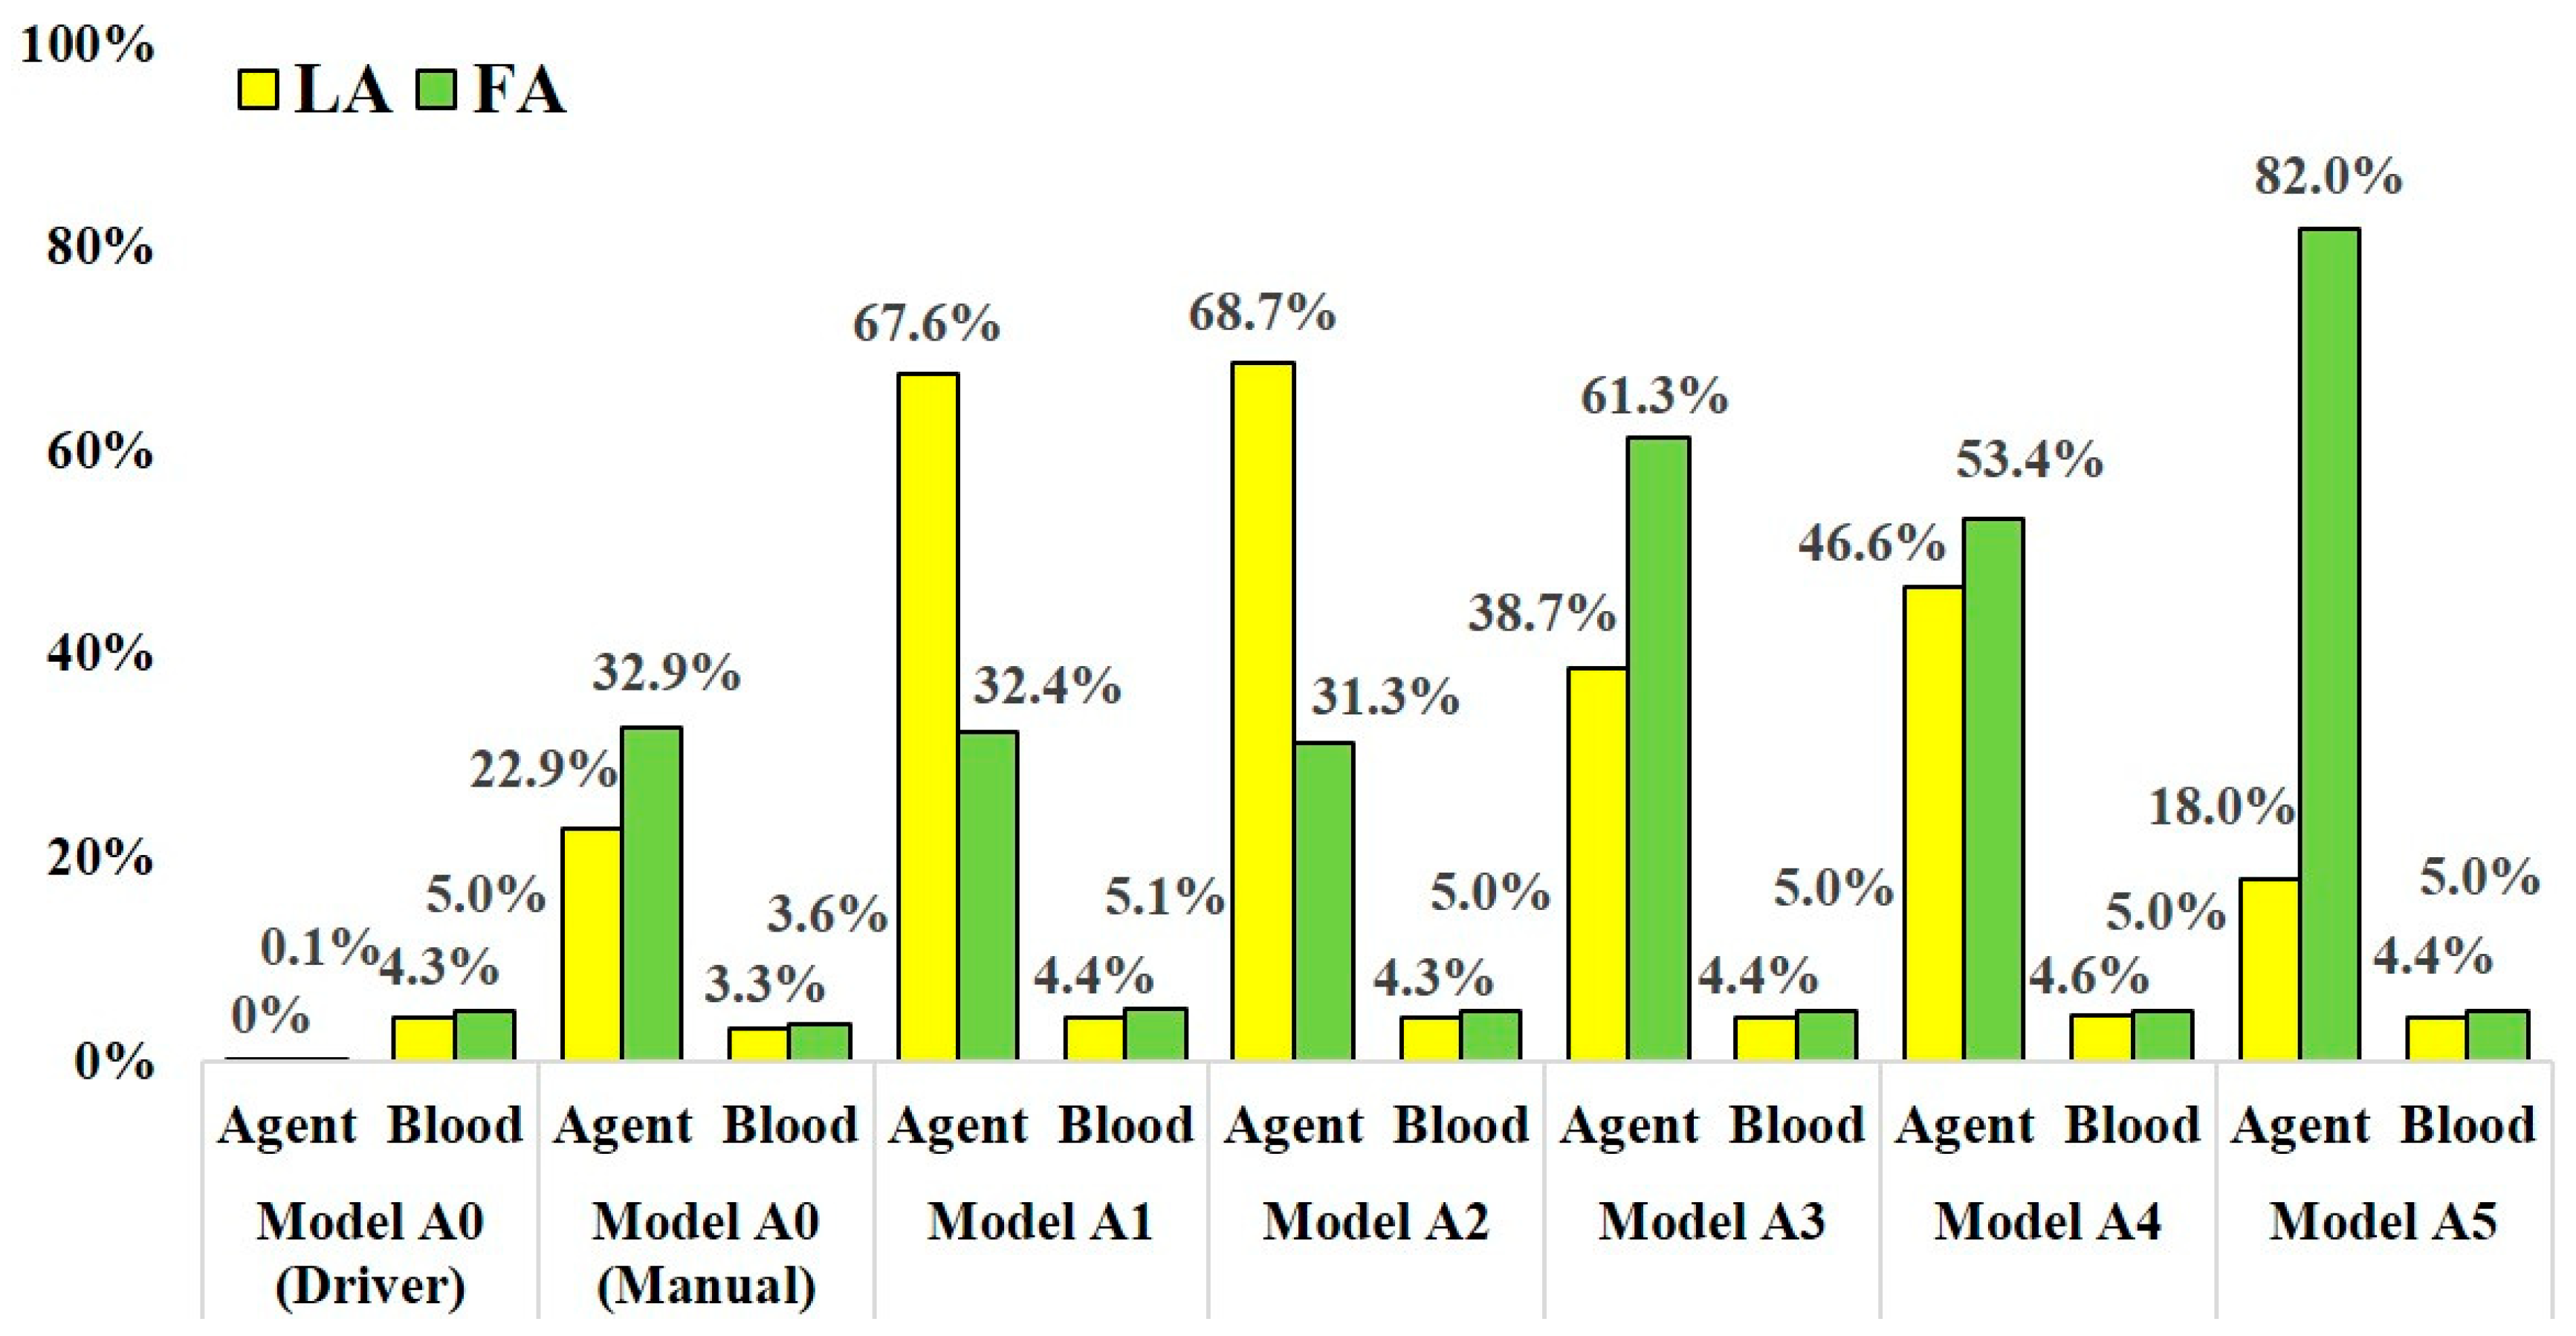
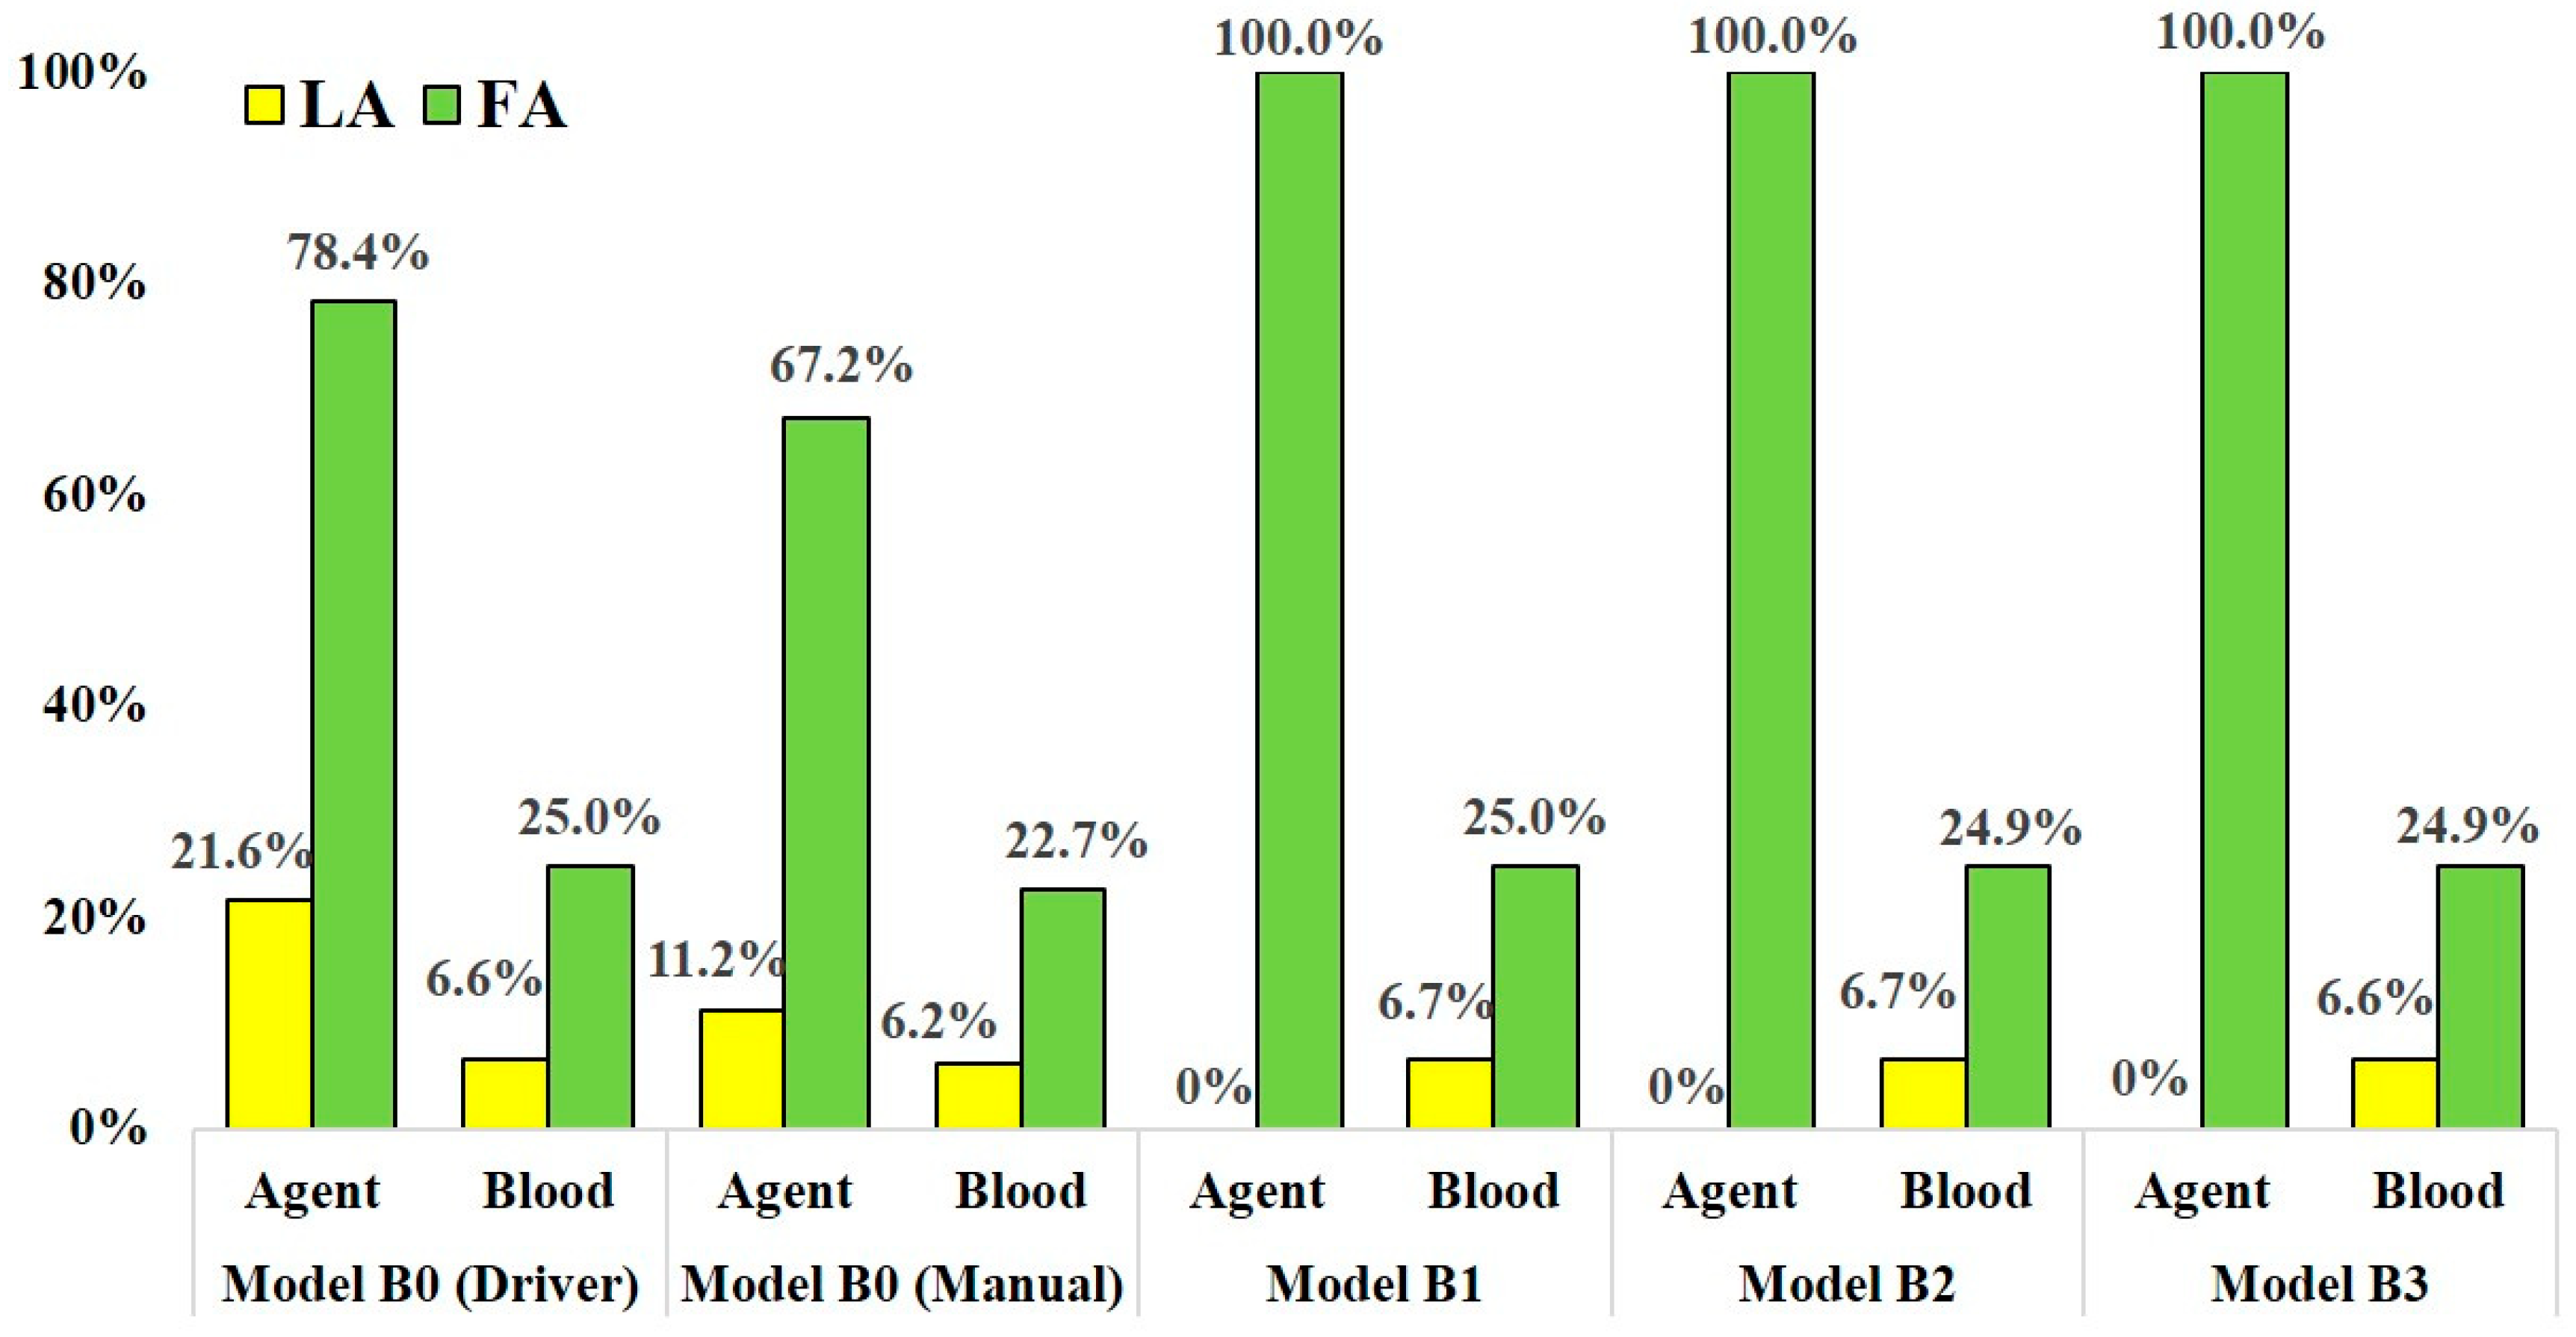
3.1. Mass Distribution of the Agent and Blood

The simulation of models A and B took approximately 48 min and 51 min to complete, respectively.
Table 1 and Table 2 show the distribution rates of the anticancer agent and blood at the outlets in models A and B, respectively. Figure 6 and Figure 7 show the distribution rates at the LA and FA for models A and B, respectively. The blood distribution rate was calculated by dividing the mass of blood at the outlets by one at the inlet of the CCA in each model. In all analyses, including analyses for models A0 and B0 with two injection conditions, the distribution rates of the agent were not consistent with those of blood.
In models A1–A5, which assumed SSIAC, the anticancer agent flowed into both the LA and FA. However, the distribution rate of the agent fluctuated depending on the catheter tip position in the linguofacial trunk. The distribution rates of the agent at the LA and FA among models A1–A5 ranged from 18.0 to 68.7% and from 31.3 to 82.0%, respectively. The distribution rate of blood among these models was stable regardless of the catheter position. The distribution rate of blood at the LA and FA ranged from 4.3% to 4.6% and 5.0% to 5.1%, respectively.
In the analysis for model A0, which assumed CIAC, with the boundary condition assuming injection by syringe driver, the agent did not flow into the LA, but 0.1% of the agent flowed into the FA. Most of the agents flowed into the MA with a distribution rate of 98.1%. In contrast, in the analysis with boundary condition assuming manual injection, the agent flowed into both the LA and FA, and the distribution rates were 22.9% and 32.9%, respectively. Moreover, flow into the ICA was also observed with a distribution rate of 0.9%.
In models B1-B3, which assumed SSIAC, the total amount of the agent injected from the catheter tip flowed into the FA, showing a distribution rate of 100.0%, unlike that in models A1–A5. The distribution rates of blood at the LA and FA were stable, similar to that in models A1–A5. The distribution rates of blood at the LA and FA in model B1–B3 ranged from 6.6% to 6.7% and 24.9% to 25.0%, respectively. In the analyses of model B0 with both syringe driver and manual injection, the agent flowed into the LA and FA, unlike that in model A0. In model B0, the distribution rates of the agent at the LA and FA with boundary conditions assuming syringe driver and manual injection were 21.6% and 78.4% and 22.9% and 67.2%, respectively. There was less discrepancy in the distribution rates of the agent between the two injection conditions compared to those of model A0.

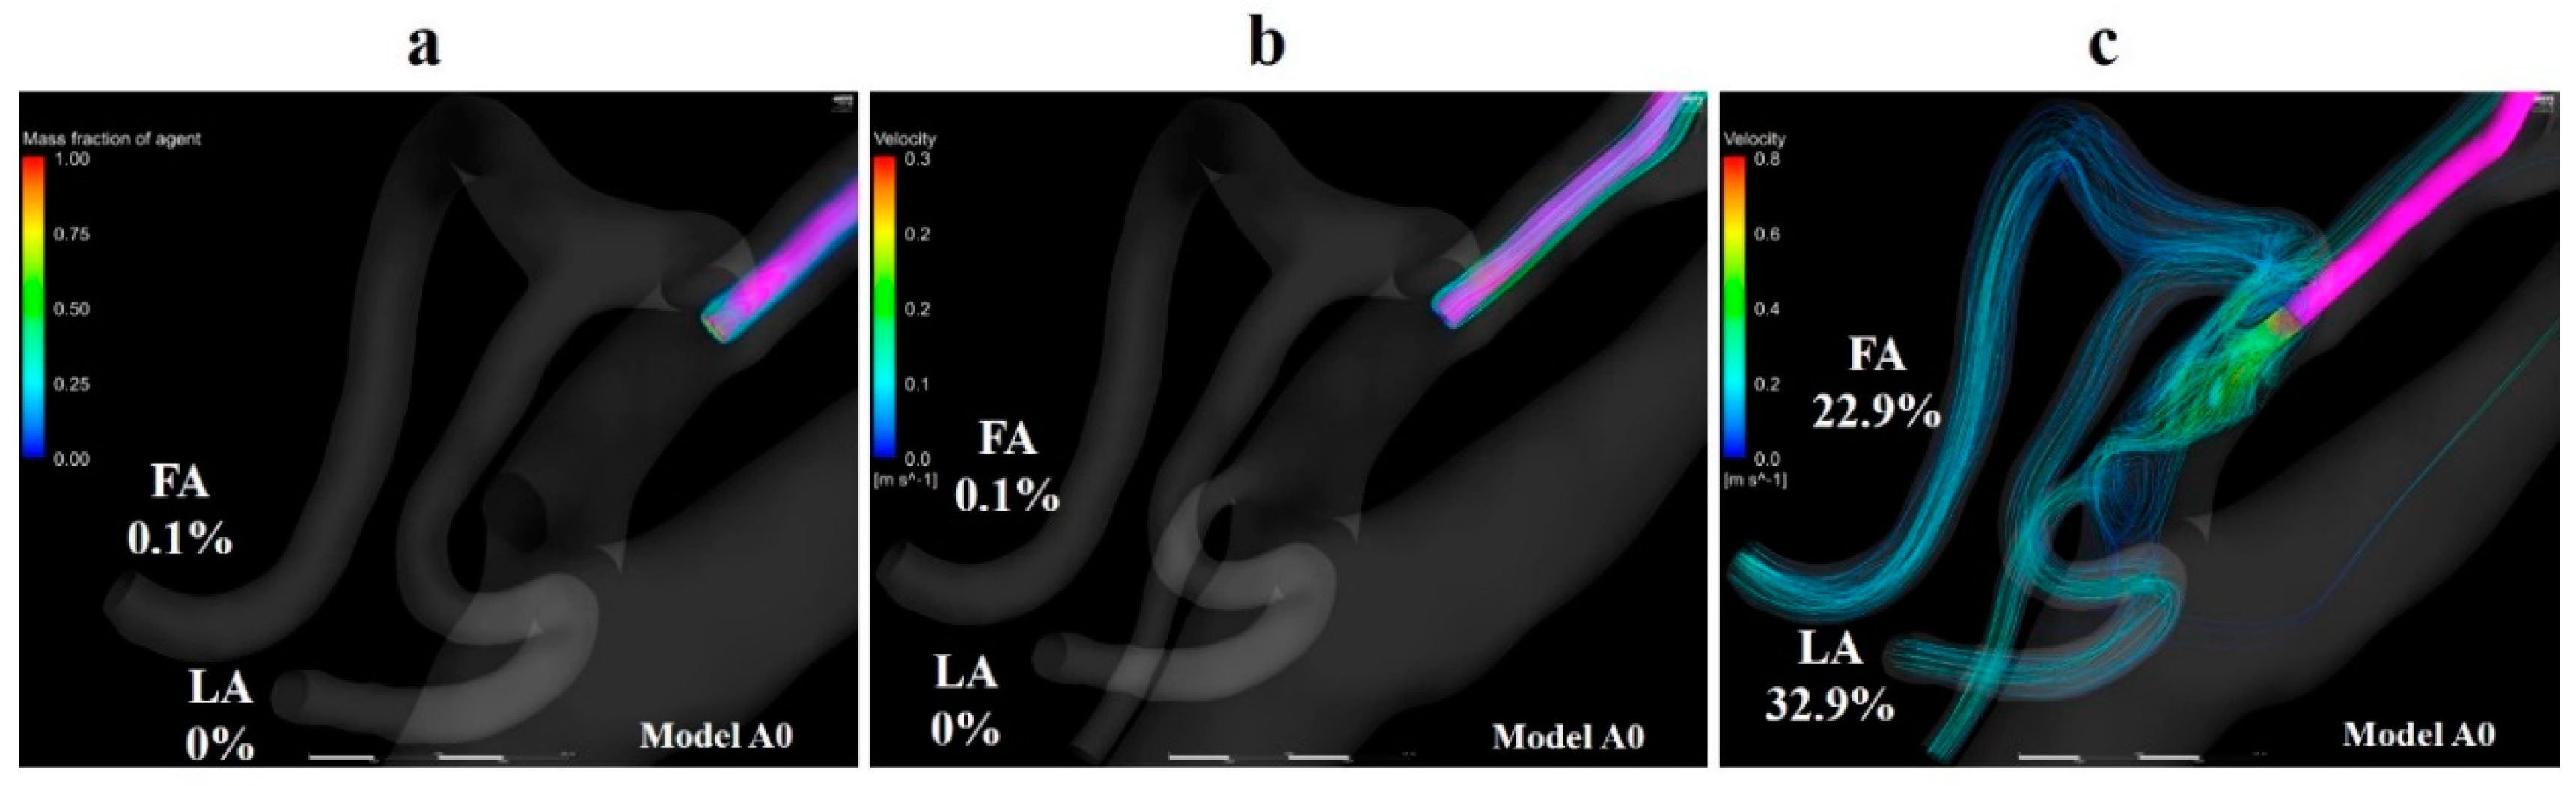
3.2. Volume Rendering Images and Streamlines

Volume rendering images for the mass fraction of agents and streamlines were depicted using CFD-POST (2019 R1, ANSYS Inc., Canonsburg, PA, USA) to visualize the distribution and locus of fluids. Figure 8a,b show the volume-rendering images of Y 0 and streamlines that originate from the catheter tip in model A0 with the boundary condition of syringe driver injection, respectively. The volume-rendering images and streamlines revealed that the agent flowed toward the peripheral region in the ECA immediately after the injection, and the agent was distributed along the streamlines. Figure 8c shows streamlines that originate from the catheter tip in model A0 with manual injection. This figure revealed that the flow field in the vessel was significantly modified by the inflow of the agent from the catheter tip. The streamlines directly moved toward the LA and FA. Moreover, a few of them headed for the ICA.
Figure 9a shows volume-rendering images for the mass fraction of the agent in model A1. Figure 9b,c show contour plots of the mass fraction of the agent and blood in the linguofacial trunk in model A1, respectively. Figure 9d,e shows streamlines toward the LA and FA, respectively. These images revealed that the streamlines toward the LA and FA, the outlets at which the inflow of agent was observed, passed through the vicinity of the catheter tip. Moreover, the mass fraction of the agent was observed along the streamlines. In models A2–A5, all streamlines toward the LA and FA passed through the vicinity of the catheter tip, similar to those in model A1. Figure 9b,c demonstrate that the flow of agent and blood is divided into the flow toward the FA and the one toward the LA in the linguofacial trunk.
Figure 10a shows the volume-rendering image of the mass fraction of agent in model B0 with the condition of syringe driver. Figure 10b,c shows the streamlines toward the FA and LA, respectively. Figure 10d shows the streamlines that originate from the catheter tip in model B0 with the boundary condition of manual injection. Figure 10a–c revealed that the streamlines toward the FA and LA both passed through the vicinity of the catheter tip. In contrast, in Figure 10d, the streamlines from the catheter tip directly headed for the LA and FA the same as those in model A0 (Figure 8c).
Figure 11a shows the volume-rendering image of the mass fraction of the agent in model B3. Figure 11b,c show the contour plots of the mass fraction of agent and blood in the common trunk in model B3, respectively. Figure 11d,e show streamlines toward the FA and LA in model B3, respectively. Figure 11a,b reveal that the mass fraction of the agent is distributed in the upper region of the linguofacial trunk, and no mass fraction of the agent can be seen in the vicinity of the LA in model B3. Figure 11b,c highlights this finding; the mass fraction of the agent is 0 in the LA. Figure 11d shows that the catheter tip was entirely covered by streamlines toward the FA. In contrast, Figure 11e reveals the streamlines toward the LA did not pass through the vicinity of the catheter tip. These findings were commonly observed in models B1 and B2.

3.3. Gradient of Mass Fraction of the Agent

Table 3 and Table 4 show the gradient of mass fraction of the agent in the catheter tip zone, LA zone, and FA zone in models A0–A5 and models B0–B3, respectively. Regardless of the injection conditions and the type of IAC, the gradient was the largest in the catheter tip zone. However, when comparing the two injection conditions, the gradients of the agent at the catheter zones in models A0 and B0 with manual injection were lower than those in the other models with syringe driver injection. In the LA zone and FA zone, the gradients of the agent were higher in the analyses with manual injection than those with syringe driver injection.

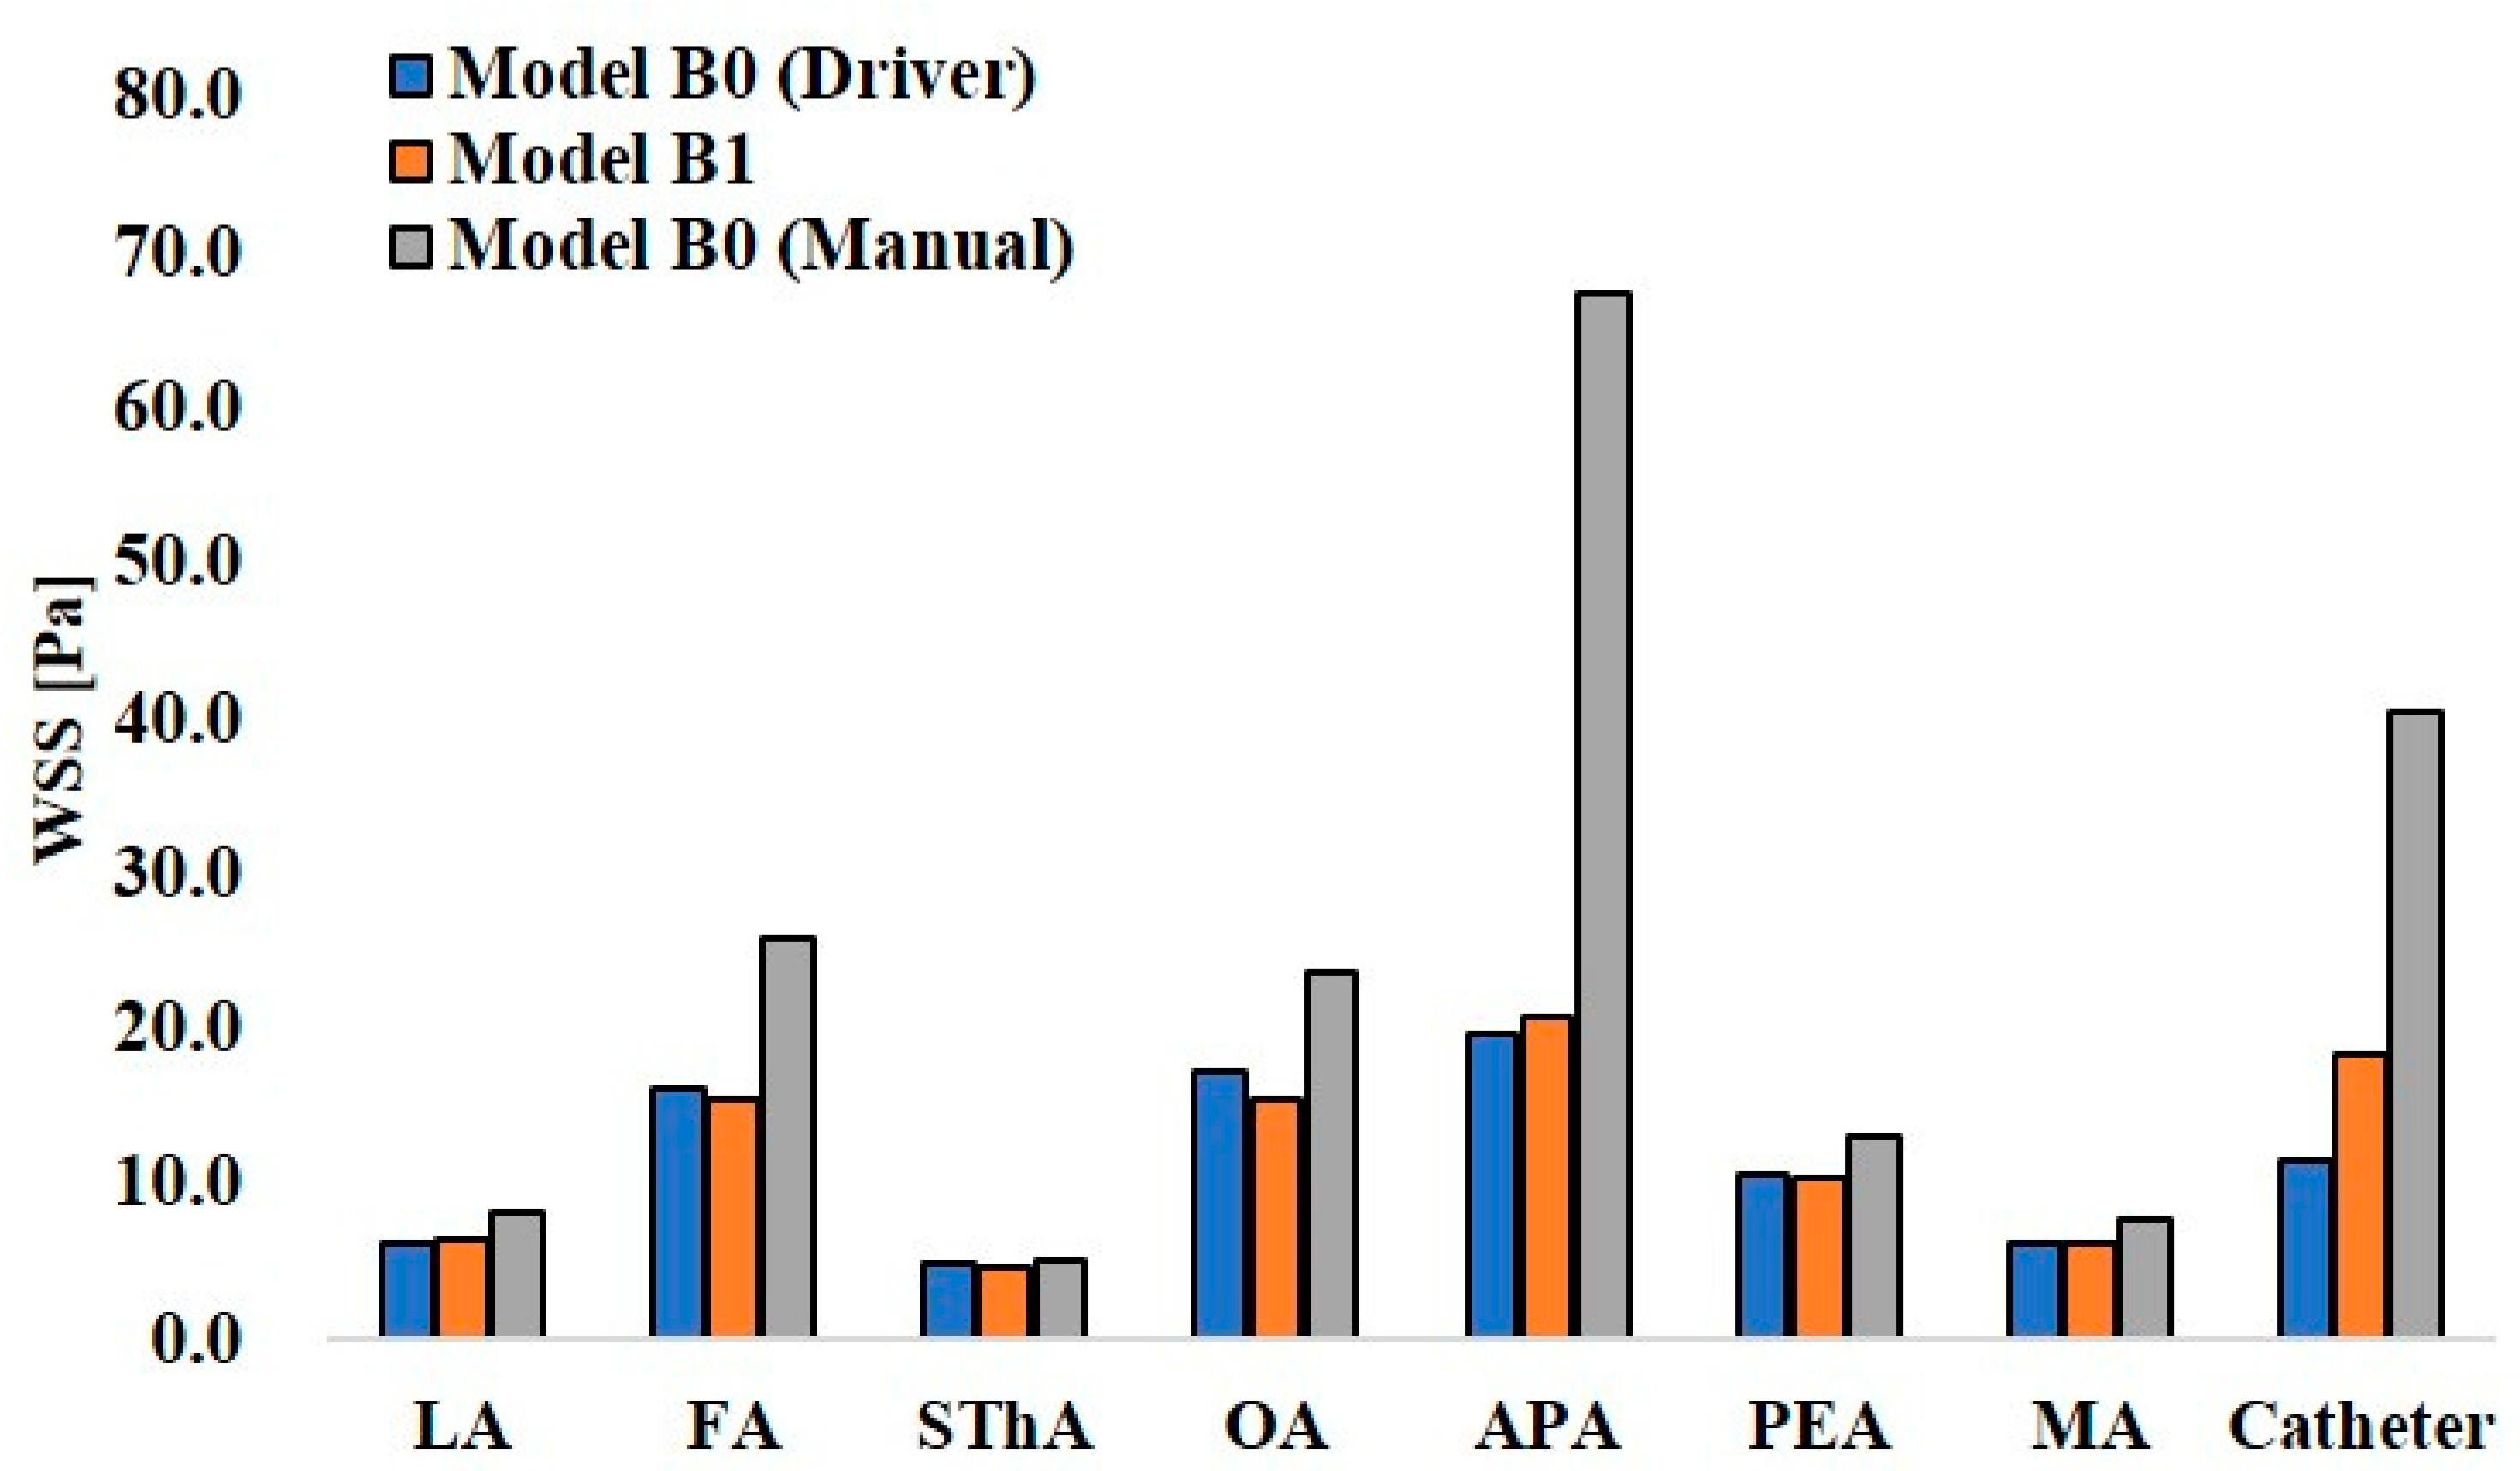
3.4. Wall Share Stress

Figure 12 and Figure 13 show the maximum WSS values at the ECA branches and catheter wall in models A0 and A1 and models B0 and B1, respectively. In the analysis of model A0 with syringe driver injection, the highest WSS of 14.1 Pa was observed at the catheter wall. Among the ECA branches, the OA showed the highest WSS value of 9.2 Pa. In model A0 with manual injection, the WSS values at all walls, including the catheter, increased, and the highest value of 20.8 Pa was observed at the catheter wall. However, among the ECA branches, the LA showed the highest value of 13.3 Pa. Thus, there was a difference in the distribution of WSS between the two injection conditions in model A0, which assumed CIAC. In model A1, the analysis for SSIAC, the OA showed the highest WSS of 10.2 Pa.
In the analysis for manual injection in model B0, all walls, including the catheter wall, showed higher WSS values than those in the analysis of the syringe driver, showing the same tendency as that in model A0. Especially, the APA in model B0 showed 67.5 Pa, a quite higher value than those in the other walls.

4. Discussion

In IAC for oral cancer, the flow of anticancer agents into the tumor-feeding arteries directly influences the success of the treatment. Therefore, clinicians should understand how the anticancer agent flows in the carotid artery. However, no measure provides clinicians with direct observation of the flow of the anticancer agent in vessels. Hence, this study utilized a CFD analysis to develop a new simulation system to predict the distribution of anticancer agents in patients with oral cancer. Only a few studies have analyzed the flow of anticancer agents using CFD. Rhode et al. [20] analyzed the anticancer agent flow in the carotid artery with the linguofacial trunk assuming Seldinger’s method. However, in their analysis model, the STA, OA, and MA, which are the main ECA branches, were excluded. Because the catheter was placed in the CCA, the anticancer agent flowed into the ICA, which can cause brain dysfunction in actual practice. Furthermore, the boundary condition was determined by setting the distribution rate of the blood among the ECA branches, which cannot reproduce the patient-specific blood flow field in vessels. In contrast, the analysis model included all the main ECA branches in the present study, and the catheter was placed in the ECA or linguofacial trunk. The boundary condition was patient-specific using the 0D resistance model, which can reproduce an accurate blood flow field in the numerical analysis [14]. Moreover, in the present study, convergence was achieved within a reasonable time considering the clinical application of this analysis method.
In all analyses with the boundary condition assuming injection with a syringe driver, the agent was delivered into the outlets for which the streamlines that flowed in the vicinity of the catheter headed. In the present study, the mass fraction of the agent was calculated by solving the convection-diffusion equation of the species (Equation (1)), which consists of the terms for convection and diffusion. Therefore, it is clear that the convection term is more effective than the diffusion term on the solutions, judging from the scales of the space (cm), time (s), and diffusion coefficient between blood and agent (1 × 10⁻⁹ m2/s). Furthermore, the velocity of the blood was significantly higher than that of the anticancer agent. Therefore, the agent was transferred by the blood flow immediately after the injection. The volume-rendering images and streamlines in Figure 9a,d,e and Figure 10a–c and Figure 11a,d represent this phenomenon. Moreover, in all models for both patients A and B, the distribution rate of the anticancer agent was inconsistent with that of blood. This suggests that the distribution of agents between the LA and FA in the ECA with the linguofacial trunk is not determined by the amount of blood but by how blood flows in the vicinity of the catheter. In addition to these findings, this CFD study revealed that the blood flow within a 2-mm radius from the catheter tip plays an important role in determining the agent flow because higher agent gradients were observed in the catheter tip zones in all models compared to the LA and FA zones.
There was a discrepancy in the distribution rates of the agent between the two boundary conditions in models A0 and B0. In the analysis with the boundary condition assuming manual injection, streamlines that directly moved toward the LA and FA from the catheter tip were observed (Figure 8c and Figure 10d). This indicates that the blood flow field was significantly changed by the higher velocity at the catheter tip than that made by syringe driver injection. Higher gradients of the agent in the LA and FA zones than those in other analyses were thought to be caused by this distinct flow field. In model B0, less discrepancy in the distribution rates of the agent was observed between two boundary conditions than that in model A0. This was due to the difference of the distribution of streamlines of the fluid around the catheter tip between the two models. In model B0, the streamlines toward the LA and FA both passed through the vicinity of the catheter under the boundary condition of the syringe driver (Figure 10b,c). This blood flow delivered the agent into both the LA and FA even though the catheter tip was placed in the main trunk of the ECA. While in model A0, the flow field toward the peripheral region of the ECA was observed around the catheter tip. This flow delivered the agent into the MA (Figure 8b). These results suggest that the manual dye injection cannot reproduce the fluid field of the anticancer agent prescribed by the syringe driver in the actual phenomenon. In actual practice for patient A, clinicians may conclude that the agent flows into the LA-based on the findings of manual injection staining, even though the anticancer agent can be mainly delivered into the MA by a syringe driver. Besides, there is a possibility that the dye may flow into the ICA, which can cause cerebral disorders.
Among the models that assumed SSIAC, models A1–A4 showed the inflow of anticancer agents into both the LA and FA, while the anticancer agent flowed into only FA in models B1–B3. This difference was thought to be caused by the characteristics of blood flow fields in two patients, which arose from the anatomical topography of the vessel. The angle between the common trunk and ECA and the angle between the FA and common trunk of patient B were smaller than those of patient A (Figure 2). Therefore, the blood flowed from the CCA toward the FA more directly than that of patient A (Figure 11d). Then, the catheter tip was covered by this blood flow in models B1–B3. As a result, the agent was transferred to only the FA by this blood flow field. Furthermore, the blood flow toward the LA was located further from the catheter tip than that toward the FA (Figure 11e). To deliver the anticancer agent into the LA, the catheter tip needs to be placed in the zone closer to the LA, or the anticancer agent should be injected at a higher velocity to allow the agent to reach the blood flow toward the LA. In contrast, in patient A, the common trunk branches had a larger angle against the ECA compared to that in patient B. Besides, the length of the common trunk is longer than that of patient B. Therefore, blood flow towards the LA and the FA both passed through the vicinity of the catheter tip in the common trunk, which allowed the anticancer agent to flow into both the LA and FA. These suggest that the distribution of the agent between the LA and FA in the ECA with the linguofacial trunk varies among patients due to the anatomical topology of vessels. Thus, clinicians should not assume that the anticancer agent is evenly distributed between the LA and FA but recognize that the distribution can be changeable even if the catheter is placed in the common trunk. Moreover, there is a possibility that the anticancer agent flows to only one branch of the common trunk, as observed in models B1–B3.
WSS is related to vascular epithelial injury and arteriosclerosis. In models A0 and B0, the analyses assuming manual injection resulted in higher WSS at all walls than those in the analyses assuming syringe driver injection (Figure 12 and Figure 13). In model B0, the WSS at the APA was 67.5 Pa, which exceeded the yield stress of the artery (37.9 Pa [21]). This indicates that manual injection of dye can cause acute epithelial injury in the carotid artery. When comparing the WSS values for CIAC and SSIAC, in model A1, the OA showed a higher WSS value than that in model A0 with the boundary condition of syringe driver injection. In model B1, the WSS showed a higher value at the APA than that in model B0 with the boundary condition of syringe driver injection. These results imply that SSIAC loads mechanical stress on the ECA branches that arise from the ECA, even apart from the tumor-feeding arteries. To our knowledge, no study follows the functional and morphological changes in patients’ vessels after IAC. However, the present study indicates that there is a possibility that irreversible changes may occur in the ECA walls during or after IAC.
There are some limitations to the present study. Peripheral vascular network in tumor tissue is distinct from one in healthy tissue due to the abnormal growth of vessels termed as angiogenesis, which was not considered in the 0D model. In the future, a new outflow boundary condition should be developed to take the effect of angiogenesis on the outlet pressure in the 3D region into consideration. Transient analysis is also needed to analyze the distribution of the anticancer agent for the whole duration of the injection (1 h). However, we anticipate that it requires longer computational time compared to that in the present study, which is not useful when considering the clinical application of this simulation.

5. Conclusions

This CFD study revealed that the distribution of agents in the SSIAC between the LA and FA in patients with the linguofacial trunk is not consistent with the blood distribution. The distribution is determined by the blood flow field, which differs among patients due to the anatomical topology of the vessels. Particularly, the blood flow field in the zone within a 2 mm radius from the catheter tip plays an important role in determining the destination of the anticancer agent. The present study suggested a new simulation to predict the distribution of agents between the LA and FA according to the catheter position for each patient before catheter insertion.

Author Contributions

H.K. designed the study, performed the computational analysis, and wrote the manuscript with help of T.I. T.I. helped in the design of the study and contributed to drafting the manuscript. Y.Y. verified the computational method. K.M. supervised the overall project and conceived the study. All authors have read and agreed to the published version of the manuscript.

Funding

This research was supported in part by Grants-in-Aid for Scientific Research (JSPS KAKENHI Grant Number 19K19240) from the Japan Society for the Promotion of Science, Japan.

Conflicts of Interest

The authors declare no conflict of interest.

Abbreviations

0Dzero-dimensional
3Dthree-dimensional
APAascending pharyngeal artery
CCAcommon carotid artery
CIACconventional intra-arterial chemotherapy
ECAexternal carotid artery
FAfacial artery
ICAinternal carotid artery
LAlingual artery
MAmaxillary artery
OAoccipital artery
PAAposterior auricular artery
SSIACsuperselective intra-arterial chemotherapy
STAsuperficial temporal artery
SThAsuperior thyroid artery
WSSwall share stress

References

  1. Homma, A.; Onimaru, R.; Matsuura, K.; Robbins, K.T.; Fujii, M. Intra-arterial chemoradiotherapy for head and neck cancer. Jpn. J. Clin. Oncol. 2016, 46, 4–12. [Google Scholar] [CrossRef] [PubMed]
  2. Robbins, K.T. The evolving role of combined modality therapy in head and neck cancer. Arch. Otolaryngol. Head Neck Surg. 2000, 126, 265–269. [Google Scholar] [CrossRef] [PubMed]
  3. Robbins, K.T.; Kumar, P.; Wong, F.S.; Hartsell, W.F.; Flick, P.; Palmer, R.; Weir, A.B., 3rd; Neill, H.B.; Murry, T.; Ferguson, C.; et al. Targeted chemoradiation for advanced head and neck cancer: Analysis of 213 patients. Head Neck 2000, 22, 687–693. [Google Scholar] [CrossRef]
  4. Tohnai, I. Chemotherapy using intra-arterial infusion for oral cancer. Nagoya J. Med. Sci. 2006, 68, 101–108. [Google Scholar] [PubMed]
  5. Tohnai, I.; Fuwa, N.; Hayashi, Y.; Kaneko, R.; Tomaru, Y.; Hibino, Y.; Ueda, M. New superselective intra-arterial infusion via superficial temporal artery for cancer of the tongue and tumour tissue platinum concentration after carboplatin (CBDCA) infusion. Oral. Oncol. 1998, 34, 387–390. [Google Scholar] [CrossRef]
  6. Fuwa, N.; Kodaira, T.; Furutani, K.; Tachibana, H.; Nakamura, T.; Nakahara, R.; Tomoda, T.; Inokuchi, H.; Daimon, T. Intra-arterial chemoradiotherapy for locally advanced oral cavity cancer: Analysis of therapeutic results in 134 cases. Br. J. Cancer 2008, 98, 1039–1045. [Google Scholar] [CrossRef] [PubMed] [Green Version]
  7. Mata, J.R.; Mata, F.R.; Souza, M.C.; Nishijo, H.; Ferreira, T.A. Arrangement and prevalence of branches in the external carotid artery in humans. Ital. J. Anat. Embryol. 2012, 117, 65–74. [Google Scholar] [PubMed]
  8. Ozgur, Z.; Govsa, F.; Ozgur, T. Assessment of origin characteristics of the front branches of the external carotid artery. J. Craniofacial Surg. 2008, 19, 1159–1166. [Google Scholar] [CrossRef] [PubMed]
  9. Yonenaga, K.; Tohnai, I.; Mitsudo, K.; Mori, Y.; Saijo, H.; Iwai, T.; Yonehara, Y.; Ota, Y.; Torigoe, K.; Takato, T. Anatomical study of the external carotid artery and its branches for administration of superselective intra-arterial chemotherapy via the superficial temporal artery. Int. J. Clin. Oncol. 2011, 16, 654–659. [Google Scholar] [CrossRef] [PubMed]
  10. Troupis, T.G.; Dimitroulis, D.; Paraschos, A.; Michalinos, A.; Protogerou, V.; Vlasis, K.; Troupis, G.; Skandalakis, P. Lingual and facial arteries arising from the external carotid artery in a common trunk. Am. Surg. 2011, 77, 151–154. [Google Scholar] [CrossRef] [PubMed]
  11. Gemmete, J.J. Complications associated with selective high-dose intraarterial cisplatin and concomitant radiation therapy for advanced head and neck cancer. J. Vasc. Interv. Radiol. 2003, 14, 743–748. [Google Scholar] [CrossRef] [PubMed]
  12. Takagi, S.; Inenaga, R.; Oya, R.; Nakamura, S.; Ikemura, K. Blood vessel density correlates with the effects of targeted intra-arterial carboplatin infusion with concurrent radiotherapy for squamous cell carcinomas of the oral cavity and oropharynx. Br. J. Cancer 2006, 94, 1580–1585. [Google Scholar] [CrossRef] [PubMed] [Green Version]
  13. Kitajima, H.; Oshima, M.; Iwai, T.; Ohhara, Y.; Yajima, Y.; Mitsudo, K.; Tohnai, I. Computational fluid dynamics study of intra-arterial chemotherapy for oral cancer. Biomed. Eng. Online 2017, 16, 1–26. [Google Scholar] [CrossRef] [PubMed]
  14. Ohhara, Y.; Oshima, M.; Iwai, T.; Kitajima, H.; Yajima, Y.; Mitsudo, K.; Krdy, A.; Tohnai, I. Investigation of blood flow in the external carotid artery and its branches with a new 0D peripheral model. Biomed. Eng. Online 2016, 15, 16. [Google Scholar] [CrossRef] [PubMed] [Green Version]
  15. Haynes, W.M. CRC Handbook of Chemistry and Physics, 93rd ed.; CRC Press: Boca Raton, FL, USA, 2012; Section 6; pp. 250–251. [Google Scholar]
  16. Holz, M.; Heil, S.R.; Sacco, A. Temperature-dependent self-diffusion coefficients of water and six selected molecular liquids for calibration in accurate 1H NMR PFG measurements. Phys. Chem. Chem. Phys. 2000, 2, 4740–4742. [Google Scholar] [CrossRef]
  17. Antiga, L.; Piccinelli, M.; Botti, L.; Ene-Iordache, B.; Remuzzi, A.; Steinman, D.A. An image-based modeling framework for patient-specific computational hemodynamics. Med. Biol. Eng. Comput. 2008, 46, 1097–1112. [Google Scholar] [CrossRef] [PubMed] [Green Version]
  18. Torii, R.; Keegan, J.; Wood, N.B.; Dowsey, A.W.; Hughes, A.D.; Yang, G.-Z.; Firmin, D.N.; Thom, S.A.M.G.; Xu, X.Y. MR image-based geometric and hemodynamic investigation of the right coronary artery with dynamic vessel motion. Ann. Biomed. Eng. 2010, 38, 2606–2620. [Google Scholar] [CrossRef] [PubMed]
  19. Madhavan, S.; Kemmerling, E.M.C. The effect of inlet and outlet boundary conditions in image-based CFD modeling of aortic flow. Biomed. Eng. Online 2018, 17, 66. [Google Scholar] [CrossRef] [PubMed] [Green Version]
  20. Rhode, S.; Paul, M.C.; Martens, E.; Campbell, D.F. Simulation of hemodynamic flow in head and neck cancer chemotherapy. Biomed. Eng. Online 2011, 10, 104. [Google Scholar] [CrossRef] [PubMed] [Green Version]
  21. Fry, D. Acute vascular endothelial changes associated with increased blood velocity gradients. Circ. Res. 1968, 22, 165–197. [Google Scholar] [CrossRef] [PubMed] [Green Version]
Figure 1. Retrograde intra-arterial chemotherapy for oral cancer. (a) Superselective intra-arterial chemotherapy, (b) the FA and LA bifurcate from the common trunk, and (c) conventional intra-arterial chemotherapy. CCA, common carotid artery; ECA, external carotid artery; FA, facial artery; ICA, internal carotid artery; LA, lingual artery; MA, maxillary artery; OA, occipital artery; STA, superficial temporal artery; SThA, superior thyroid artery.
Applsci 10 07496 g001
Figure 2. Geometrical model. (a) Vessel model for patient A. (b) Vessel model for patient B. (c) Modeled catheter. APA, ascending pharyngeal artery; CCA, common carotid artery; ECA, external carotid artery; FA, facial artery; ICA, internal carotid artery; LA, lingual artery; MA, maxillary artery; OA, occipital artery; PAA, postauricular artery; STA, superficial temporal artery; SThA, superior thyroid artery.
Applsci 10 07496 g002
Figure 3. Catheter tip location. (a) The catheter tip position (A1–A5) and observation points (PFA and PLA) of the LA and FA in model A. (b) The catheter tip position (B1–B3) and observation points (PFA and PLA) of the LA and FA in model B. The walls of the catheter in models A2–A5 and B2–B3 are hidden. ECA, external carotid artery; FA, facial artery; LA, lingual artery.
Applsci 10 07496 g003
Figure 4. Tetrahedral and prismatic mesh in model A1. (a) The whole view of model A1, (b) the orthogonal view of the volume mesh at line 1, (c) the orthogonal view of the volume mesh at line 2, (d) the orthogonal view of the volume mesh at line 3. ECA, external carotid artery; FA, facial artery; LA, lingual artery.
Applsci 10 07496 g004
Figure 5. Conceptual diagram for the zero-dimensional resistance model.
Applsci 10 07496 g005
Figure 6. The distribution rate of anticancer agent and blood at the LA and FA in models A0–A5.
Applsci 10 07496 g006
Figure 7. The distribution rate of anticancer agent and blood at the LA and FA in models B0–B3.
Applsci 10 07496 g007
Figure 8. Volume-rendering image and streamlines in model A0. (a) Volume-rendering image of the mass of agent in model A0 with injection condition of the syringe driver, (b) streamlines originate from the catheter tip in model A0 with injection conditions of the syringe driver, (c) streamlines originate from the catheter tip in model A0 with injection conditions of the syringe driver. The number of figures shows the distribution rate of the agent. FA, facial artery; LA, lingual artery.
Applsci 10 07496 g008
Figure 9. Volume-rendering image, contour plots, and streamlines in model A1. (a) Volume-rendering image of the mass fraction of agent in model A1, (b) contour plot of the mass fraction of agent in the linguofacial trunk in model A1, (c) contour plot of the mass fraction of blood in the linguofacial trunk in model A1, (d) streamlines toward the LA in model A1, (e) streamlines toward the FA in model A1. The number of figures shows the distribution rate of the agent. FA, facial artery; LA, lingual artery.
Applsci 10 07496 g009
Figure 10. Volume-rendering image and streamlines in model B0. (a) Volume-rendering image of the mass fraction of agent in model B0 with injection condition of the syringe driver, (b) streamlines toward the FA in model B0, (c) streamlines toward the LA in model B0. (d) Streamlines originate from the catheter tip in model B0 with the injection condition of the syringe driver. The number of figures shows the distribution rate of the agent. FA, facial artery; LA, lingual artery.
Applsci 10 07496 g010
Figure 11. Volume-rendering images, contour plots, and streamlines in model B3. (a) Volume-rendering image of an anticancer agent in model B3, (b) contour plots of the mass fraction of agent in the linguofacial trunk in model B3, (c) contour plots of the mass fraction of blood in the linguofacial trunk in model B3, (d) streamlines towards the FA in model B3, (e) streamlines toward the LA in model B3. The number of figures shows the distribution rate of the agent. FA, facial artery; LA, lingual artery.
Applsci 10 07496 g011
Figure 12. Wall share stress in models A0 and A1.
Applsci 10 07496 g012
Figure 13. Wall share stress in models B0 and B1.
Applsci 10 07496 g013
Table 1. Distribution rate (%) of anticancer agent and blood in models A0–A5.
Model A0 (Driver)Model A0 (Manual)Model A1Model A2Model A3Model A4Model A5
AgentBloodAgentBloodAgentBloodAgentBloodAgentBloodAgentBloodAgentBlood
LA04.322.93.367.64.468.74.338.74.446.64.618.04.4
FA0.15.032.93.632.45.131.35.061.35.053.45.082.05.0
SThA02.7181.802.702.702.702.702.7
OA1.84.72.14.804.704.704.704.704.7
MA98.113.822.913.2013.9013.8013.8013.8013.9
ICA069.50.973.3069.3069.5069.4069.3069.4
Table 2. Distribution rate (%) of anticancer agent and blood in models B0–B3.
Model B0 (Driver)Model B0 (Manual)Model B1Model B2Model B3
AgentBloodAgentBloodAgentBloodAgentBloodAgentBlood
LA21.66.611.26.206.706.706.6
FA78.425.067.222.7100.025.0100.024.9100.024.9
SThA02.803.002.802.8302.8
OA08.90.59.408.908.9208.9
APA03.50.23.403.503.4903.5
PEA04.08.33.804.003.9704.0
MA04.212.63.704.204.2304.2
ICA045.0047.7044.9045.0045.0
Table 3. Gradient of mass fraction of the anticancer agent in the catheter zone, LA zone, and FA zone in models A0–A5.
Model A0 (Driver)Model 0 (Manual)Model A1Model A2Model A3Model A4Model A5
Catheter zone1093.8236.1351.4311.6309.5253.3351.4
LA zone089.824.725.815.024.824.7
FA zone045.212.212.915.217.012.2
Table 4. Gradient of mass fraction of the anticancer agent in the catheter zone, LA zone, and FA zone in models B0–B3.
Model B0 (Driver)Model B0 (Manual)Model B1Model B2Model 3
Catheter zone440.257.2307.3163.593.6
LA zone8.49.7000
FA zone6.715.45.57.53.5
Publisher’s Note: MDPI stays neutral with regard to jurisdictional claims in published maps and institutional affiliations.

