1. Introduction
Osteoarthritis (OA) is the most common arthritis occurring at the temporomandibular joint (TMJ). OA is a destructive process in which deformation of the osteoarticular surface of the mandibular condyle and mandibular fossa occurs. The most common cause of OA is excessive mechanical loading on joint tissue. When load is continuously applied and the articular surface softens (chondromalacia), resorption of the subarticular bone appears. A progressive bone change leads to loss of the subchondral cortical layer and bone erosion, which becomes evident in radiological osteoarthritis [
1].
TMJ OA can be diagnosed through medical history, clinical diagnosis, and radiographic examination. TMJ OA clinically shows characteristic signs, including limited movement of the lower jaw due to pain, crepitus, and local paraspinal tenderness in joint promotion. OA can be determined when a radiographic examination shows structural bone change [
2]. In addition, OA is useful for evaluating the condylar and ramal asymmetry of the mandible in patients with juvenile idiopathic arthritis (JIA) using orthopantomographies [
3].
Panoramic radiographs are widely used in the early stages of diagnosis when bone change in the TMJ is suspected. However, bone change is difficult to identify by simple imaging because the TMJ has small bone structures at the joint site, and the joint is covered by the wide skull [
4]. Furthermore, owing to insufficiently demineralized bone tissue in the early stage of osteoarthritis, structural changes or lesions in the TMJ are often not identified in simple radiographs [
5]. Thus, skilled experts with sufficient clinical experience are required for reading panoramic radiographs and additional radiography should be recommended if necessary. Unfortunately, it is inconvenient to transmit panoramic radiographs to a professional reading expert and wait for the result when medical staff who can accurately diagnose osteoarthritis based on panoramic radiographs are unavailable on-site. Moreover, because it is difficult for a doctor to immediately determine the treatment status of osteoarthritis, the task of transmitting panoramic radiographs and waiting for the reading results must, inevitably, be repeatedly performed.
To resolve these problems, this paper proposes a method for automatically diagnosing osteoarthritis of the TMJ using artificial intelligence (AI) technology. Recent developments in AI technology have provided various methods of analyzing X-ray images [
6]. The applicability of convolutional neural network (CNN) technology has been validated in many areas, including extracting specific parts of X-ray images and identifying abnormalities [
7,
8,
9,
10,
11,
12]. Many studies have been conducted on dental X-ray image analysis, including tooth detection through panoramic image analysis, osteoporosis analysis, and sinusitis analysis. However, studies using only panoramic X-ray analysis are still insufficient.
Thus, this study focused on automated detection of the mandibular condyle, including cases where the mandibular condylar region is truncated because of incorrect imaging or the mandibular condylar region is indistinguishable from the surrounding structures owing to the failure to adjust the radiographic density. Recently-developed CNN technology was applied to medical imaging to develop a new algorithm for diagnosing and classifying the severity of OA occurring in the TMJ. The detection accuracy of the newly developed algorithm was analyzed using a validation dataset containing radiological images. Furthermore, the AI model was used to develop an expert system that can be immediately applied in clinical practice sites.
2. Related Work
Sherman recognition and classification of objects using CNN-based models are the most popular cases of technology use [
13]. However, the simple use of CNNs typically requires a substantial amount of training data and is time-consuming. Nevertheless, the recent advent of an object detection technique that classifies objects through bounding boxes has significantly improved the accuracy of object recognition algorithms [
8]. A region-based convolutional neural network (R-CNN), which forms the basis of object detection, is used first to extract the region-of-interest from the candidate group and then to determine the individual algorithm groups.
One advantage of R-CNNs is that they can quickly extract regions with relatively high accuracy, even with smaller datasets. Starting with the R-CNN algorithm in 2013, object detection techniques have developed into various algorithms, including Fast R-CNN, Faster R-CNN, YOLO (You Only Look Once), and RefineDet [
14]. Notably, Faster R-CNN is slightly slower than other existing algorithms; however, in terms of accuracy, models based on Faster R-CNN show superior performance, compared to most models [
15,
16]. Accordingly, in this study, the Faster R-CNN framework was utilized.
AI algorithms for dental panoramic images are used to obtain various properties in various applications, such as tooth shape, tooth age, dental plaque, landmark detection, orthodontics, and osteoporosis disease [
7,
8,
9,
10,
11,
12]. De Tobel et al. proposed a novel algorithm to classify the tooth age of infants and toddlers by applying dental panoramic radiography [
7]. Their algorithm successfully analyzes dental panoramic radiographs through a basic CNN by analyzing the teeth of infants and toddlers but suffers from manual placement of the bounding box. In a study in 2017, automated tooth detection and numbering was conducted by a CNN that used a heuristic method to detect teeth [
9]. Advances in the teeth detection field have led to heuristic techniques, thereby significantly increasing the accuracy of tooth shape determination [
10].
An algorithm for diagnosing the jaw region through dental panoramic radiography was first developed in 2018. Specifically, Poedjiastoeti and Suebnukarn [
11] proposed an algorithm for identifying and finding jaw tumors in a panoramic image and further validated the proposed algorithm through activation maps. Further, Ariji et al. [
12] conducted a study in which they found and analyzed mandible lesions by using object detection algorithms, including YOLO and DetectNet [
17].
3. Materials and Methods
Inspired by previous studies, we designed an algorithm to diagnose TMJ OA, as shown in
Figure 1. First, two algorithms were developed: one algorithm that detects the TMJ and surrounding anatomical structures (including joint fossa and condyle) (Model 1) and another algorithm that determines whether the detected anatomical region has any abnormality based on the shape of the TMJ (Model 2). Finally, an algorithm to determine the presence or absence of TMJ OA was developed (Model 3).
As shown in
Figure 2, a retrospective evaluation was performed for 1292 patients aged between 20 and 60 (700 men, 592 women, average age: 43.3 years). The patient group comprised patients who had received treatment in one of the hospitals affiliated with the AIQUB Dental Network in South Korea between July and September 2018. This system is an AI-based diagnostic system and it was assumed that it should be applied to a general patient group whose age or identity is unknown.
Among the panoramic images of the experimental group, 966 and 326 images were classified as normally and abnormally photographed, respectively. Furthermore, 1932 normally photographed condyle images were divided into left-side and right-side images, and further sub-divided into 1154 normally photographed images and 778 abnormally photographed images.
To train the model, each image was labeled with the assistance of two oral physicians. To capture the condylar region within full panoramic images, the condyle was labeled for the total set of 987 images. The images extracted through this technique were divided into left-side and right-side images, which amounted to a total of 2594 images. Among these, 1932 well-photographed images of the condyle were classified as normal and abnormal.
In this study, two condyles were separated and classified because, in degenerative diseases, it was judged that the degree of wear of the condyle can be assessed independently of whether the two condyles are symmetric. Although there are serious diseases due to the asymmetry of each condyle [
3,
18], instead of looking for diseases that come from asymmetry, we wanted to focus on catching the lesions from degenerative diseases.
Next, model training was performed by using the collected data, as shown in
Figure 2. To train the architecture of the first R-CNN model, 800 of the 987 labeled images were used for training and the other 187 images were used as test data. The images were divided into two types and labeled as left and right before training.
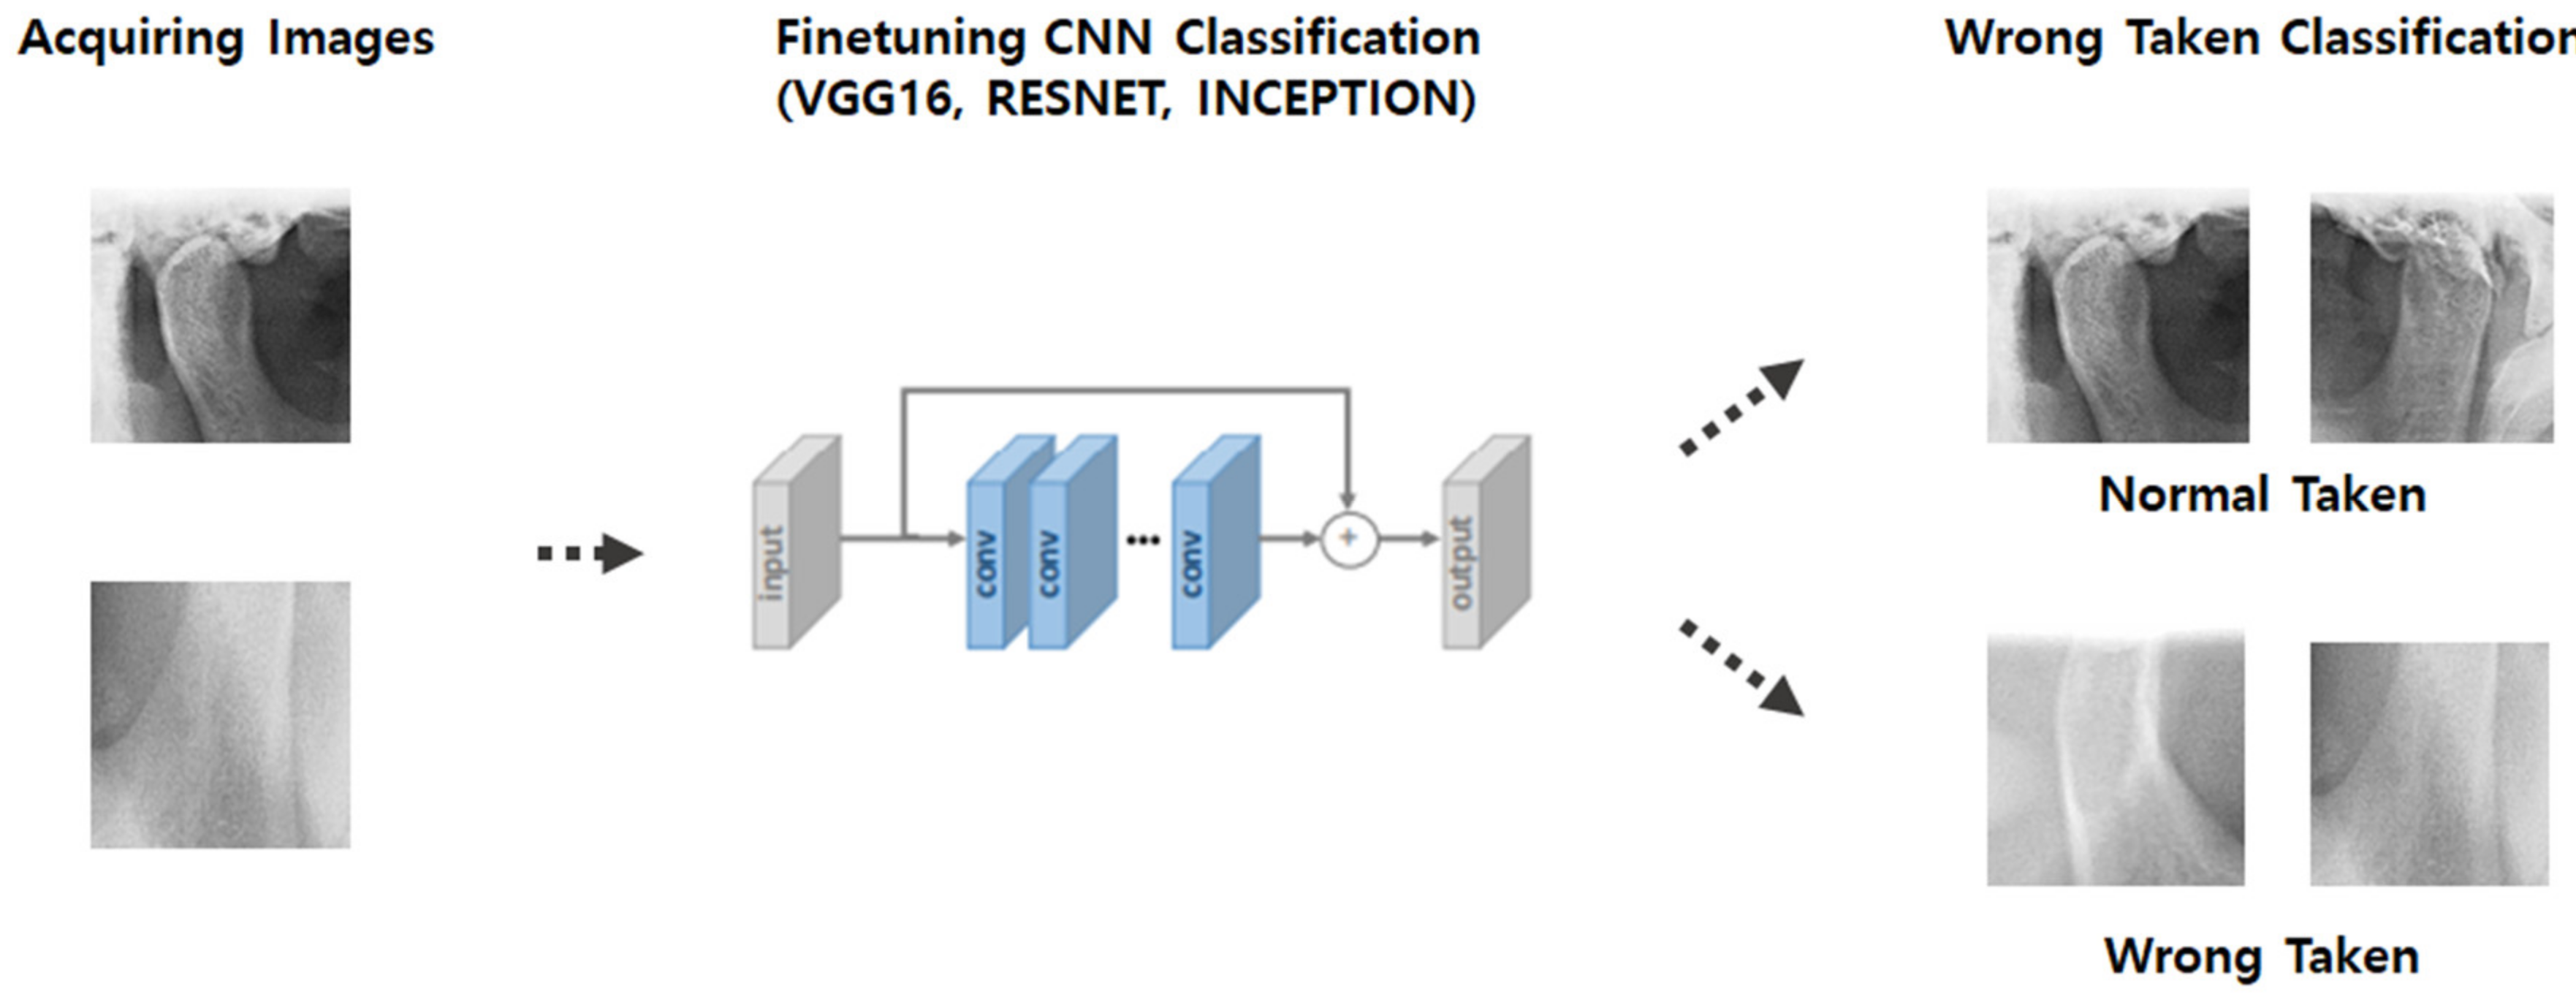
As shown in
Figure 3 and
Figure 4, the model of the second classification step applied the CNN algorithm to the condylar region extracted using the results from the first step and determined whether the extracted condyle was appropriately photographed. The second model consisted of a set of 2584 images, which were further sub-divided into 2066 and 518 images as training and test sets, respectively.
As shown in
Figure 5, the model of the third classification step was designed to predict normal and abnormal images for the condyle images extracted through the results from the second step. The third model consisted of a set of 1932 images, which were subdivided into 923 and 231 images as training and test sets, respectively.
4. Results
4.1. Condyle Detection (Model 1)
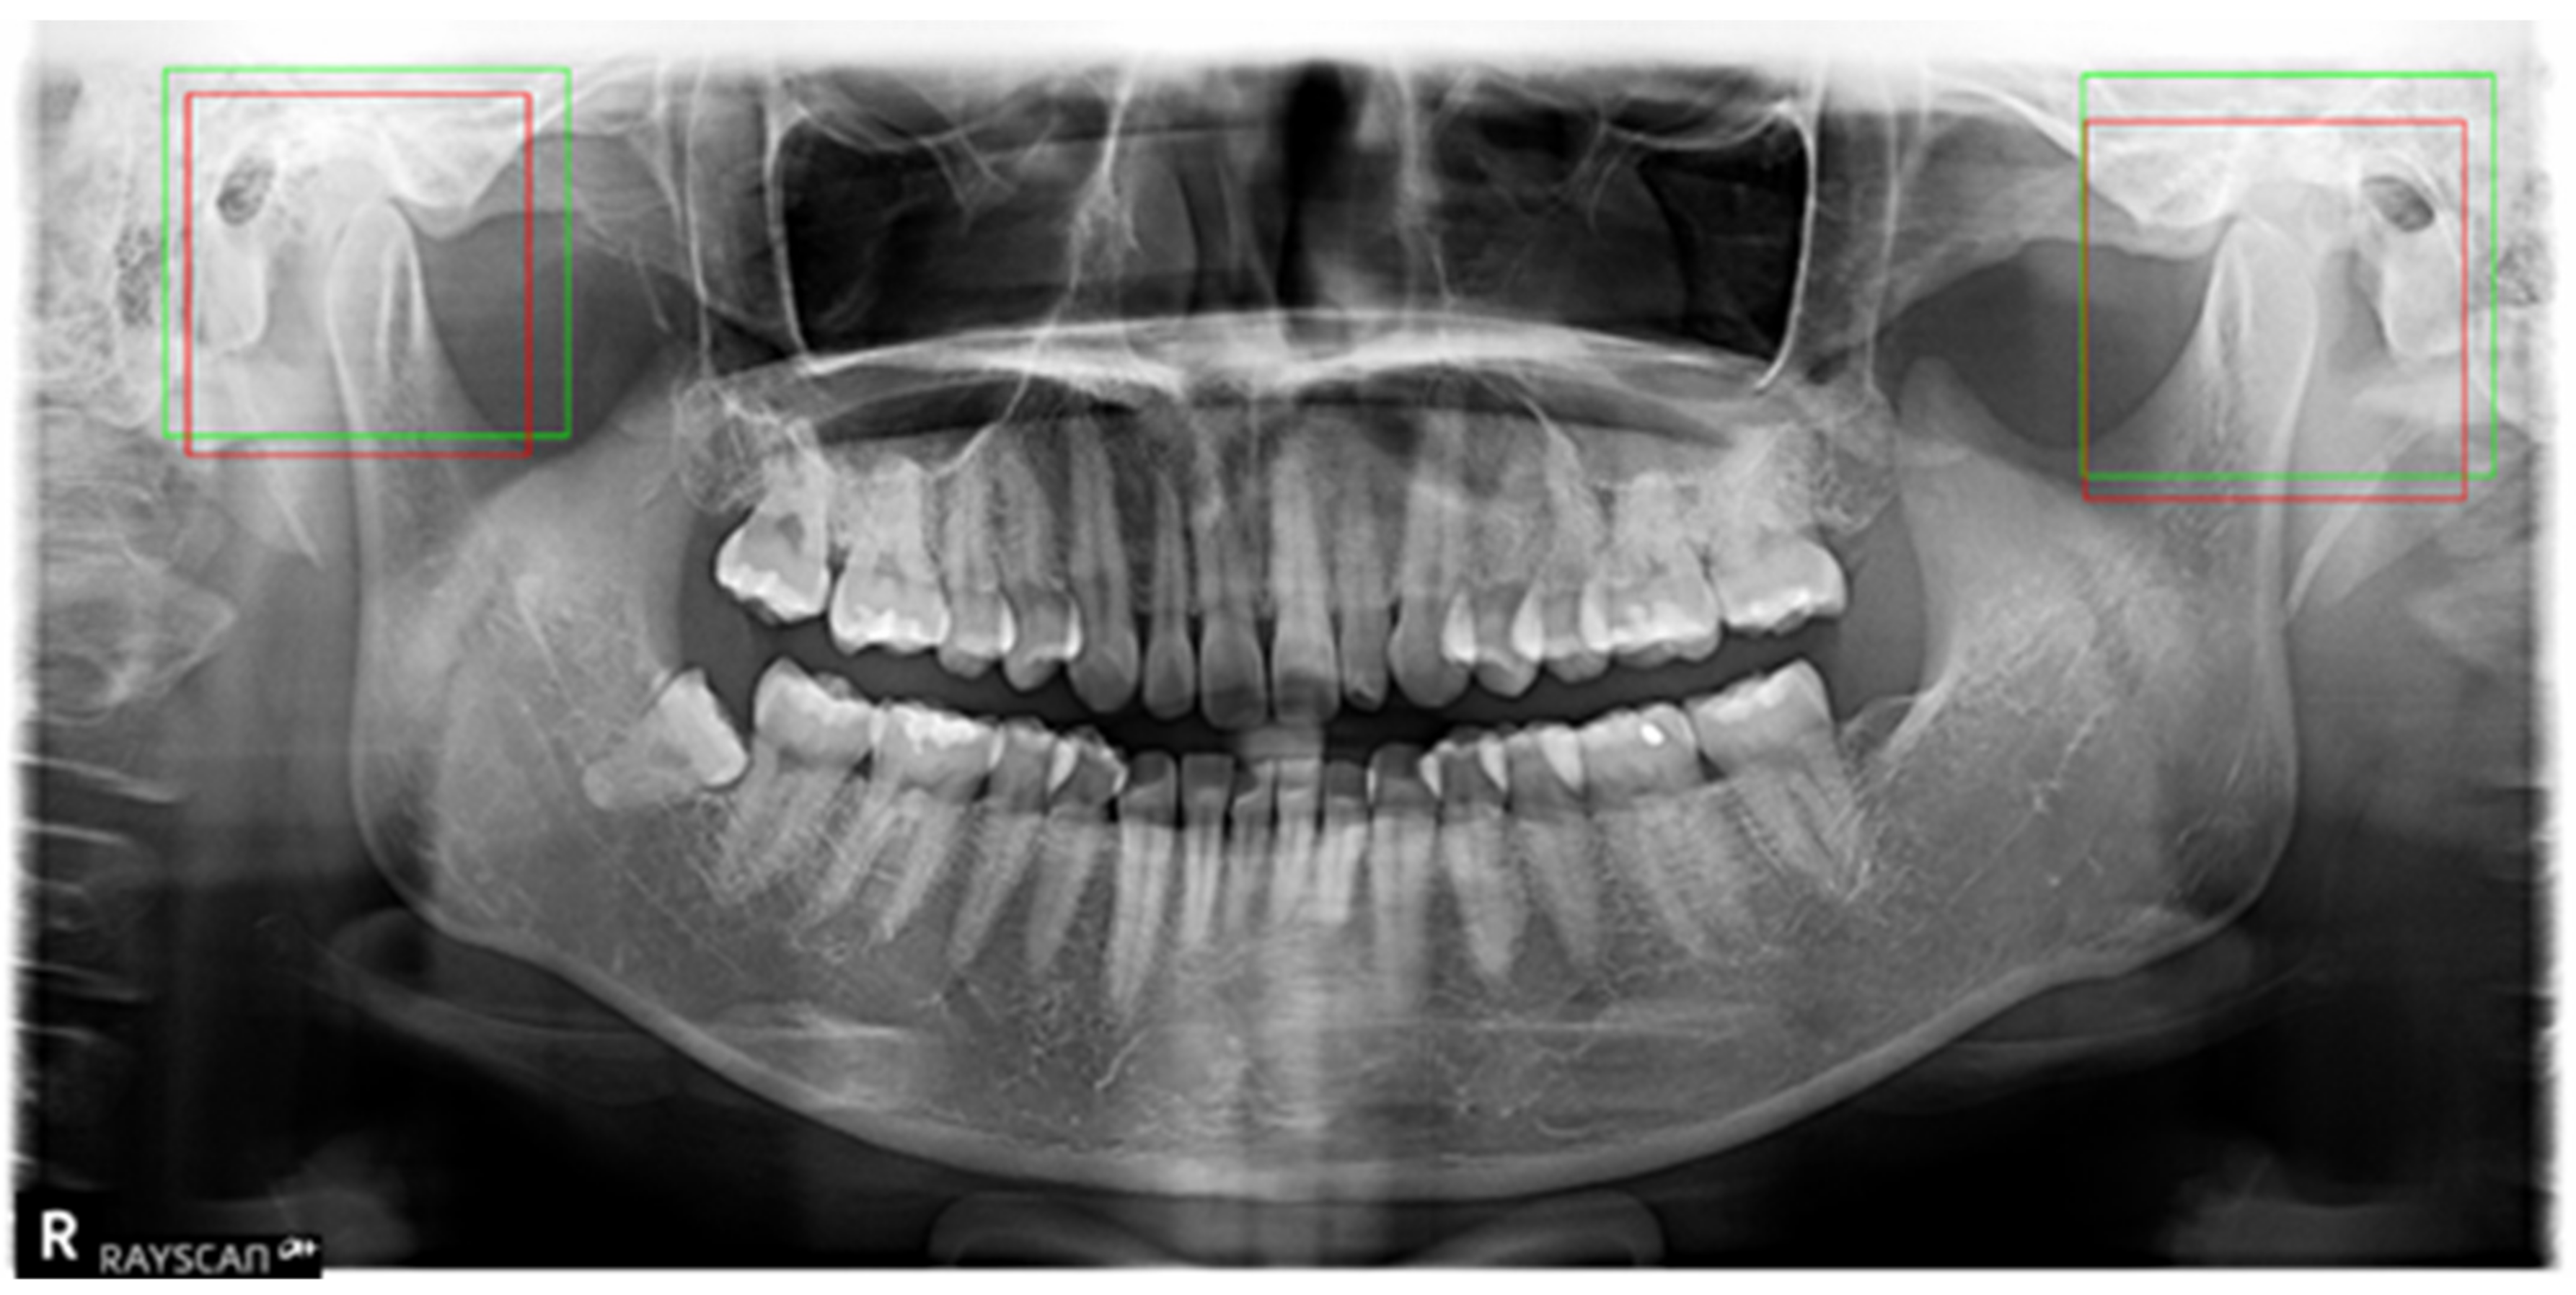
The experimental results, presented in
Table 1, indicate that Model 1 successfully identified each condylar region.
Figure 6 is an example of the results of condyle detection. We calculate the performance of the algorithm by intersection over unit(IoU). Overall, the model efficiently identified objects but showed a relatively low performance at mAP@IoU = 0.7. However, we decided that if Model 1 captured similar regions, it was sufficiently effective because the captured condylar regions significantly vary from image to image with ambiguous criteria.
4.2. Condyle Validity Classification (Model 2)
The experimental results, presented in
Table 2, indicated that Model 2 has a high precision with an average precision level of 93%. However, the recall value of the experimental results was somewhat low at 83%, as shown in
Table 3, which indicates that the algorithm often failed to properly recognize the incomprehensible condyle shapes of patients despite its presence in the image, as shown in
Figure 7.
The actual results showed that Model 2 effectively classified the images in which the condyle region was incorrectly photographed.
4.3. Condyle Abnormality Classification (Model 3)
Three models were trained (VGG16, ResNet, and Inception V3) for two cases where the models were fine-tuned and not fine-tuned with pretrained ImageNet weights and further tested in terms of accuracy. As shown in the test results in
Table 4, the fine-tuned VGG16 network exhibited the highest accuracy.
The test results for VGG16 showed a comparatively high precision of 74% and a weighted precision of 82% for the disease group, as presented in
Table 4. However, VGG16 showed a relatively low discrimination power for the disease group because the recall was 58%, which is attributed to the ambiguity of the diseases in the condyle region.
According to the results of the fine-tuned VGG16 network, among the 141 test set images, the number of false positive images was 26 and the number of false negative images was 22, which suggests that the accuracy of the model regarding normal images is high.
4.4. Development of Expert System for Condyle Disease Discrimination
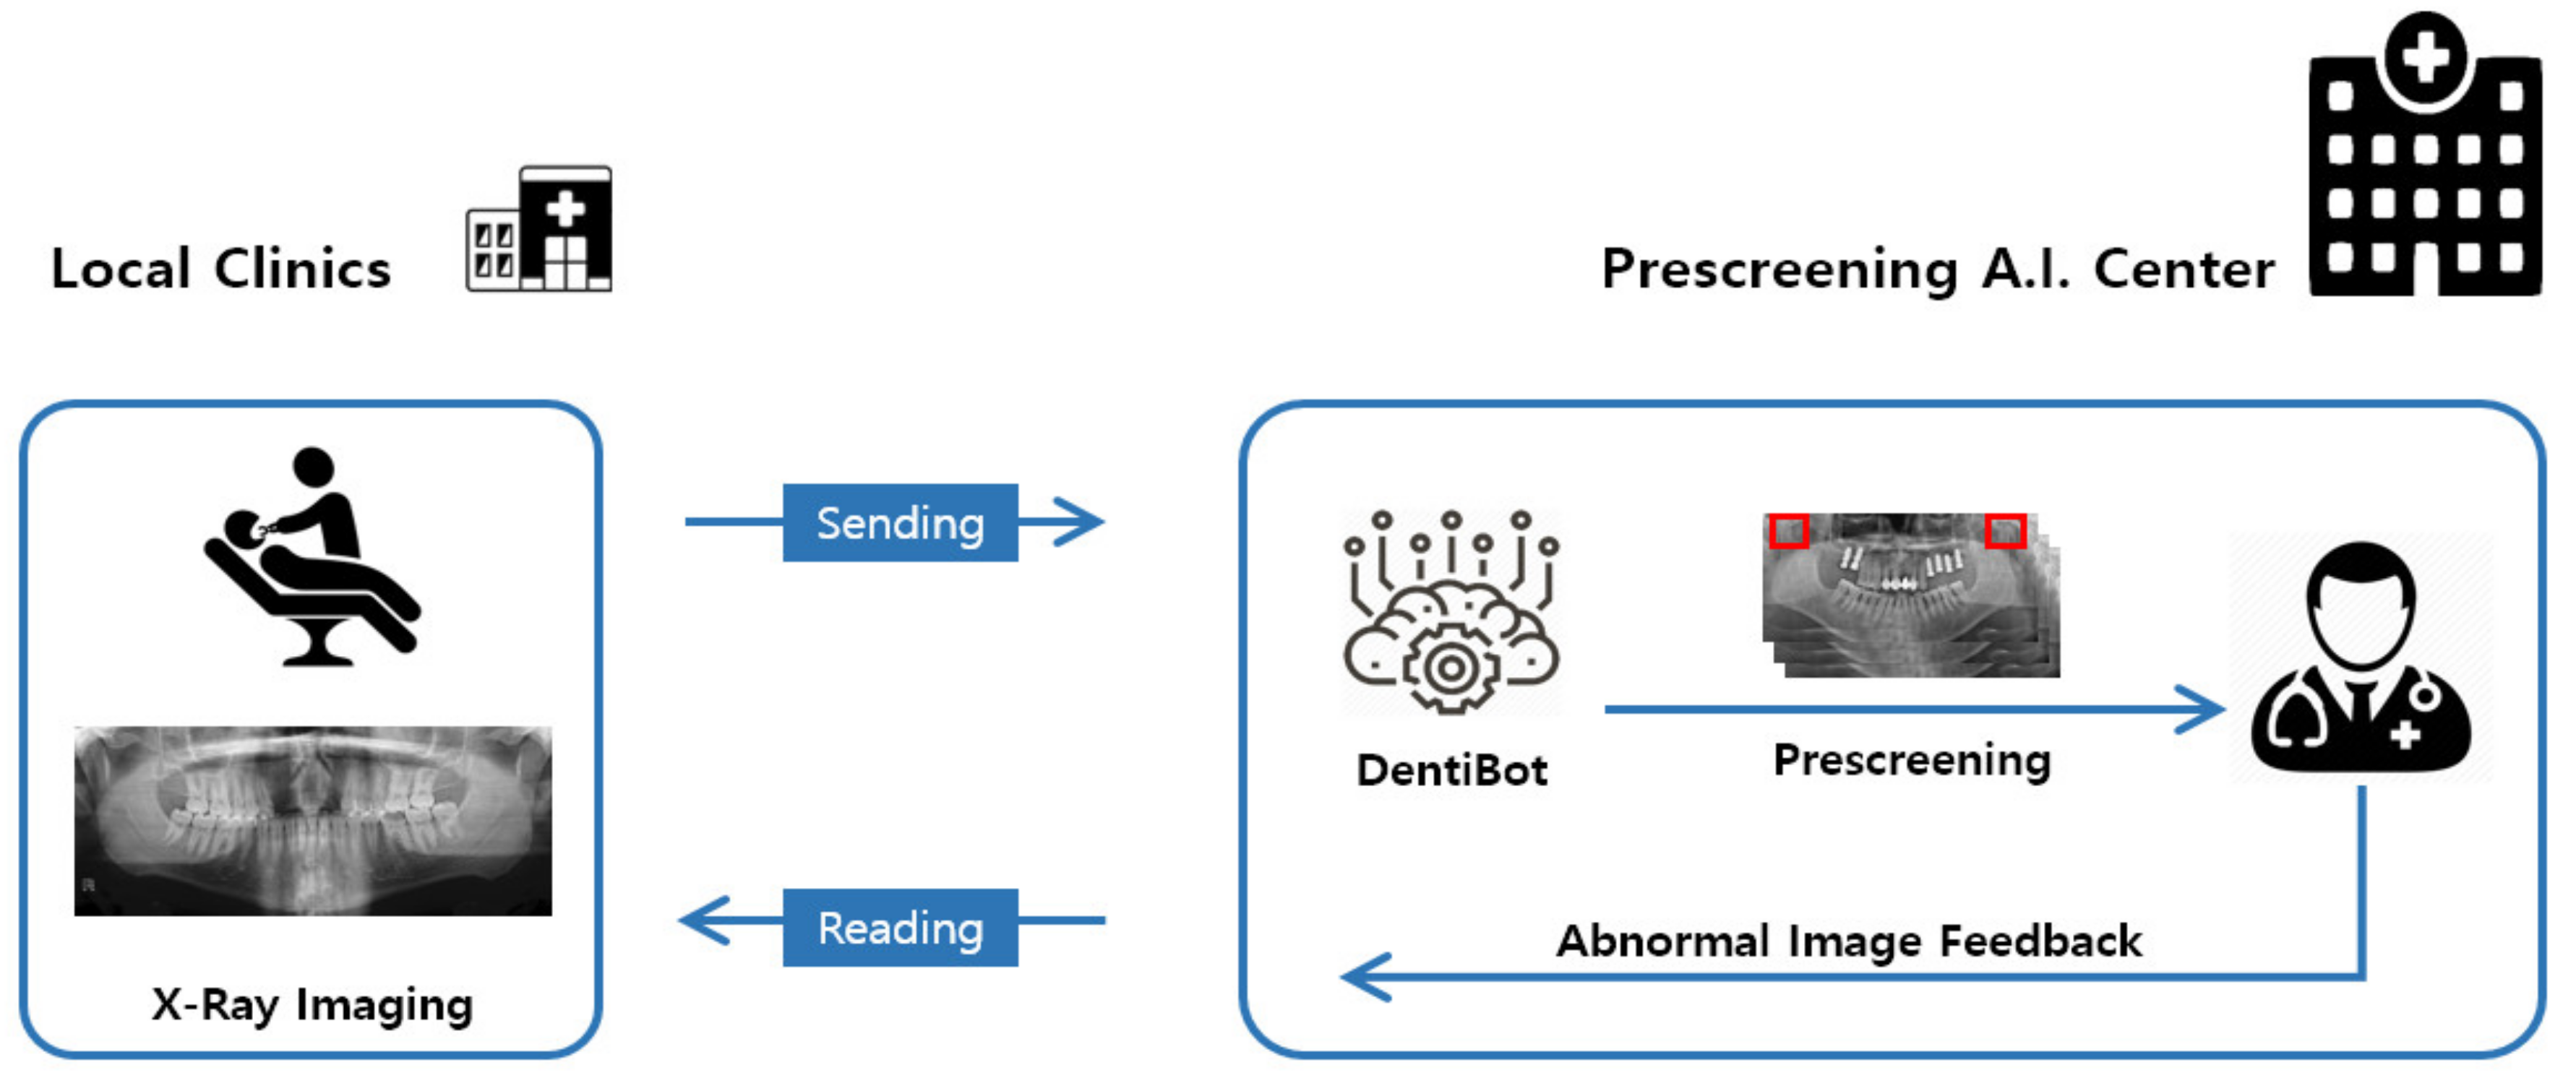
Based on the abovementioned results of algorithm development, we developed an expert system—an automated program and system—for local dental clinics. It was implemented to pre-screen dental panoramic images at a remote reading center for local dental clinics in South Korea.
This system was used in the AIQUB A.I. Center to receive and pre-screen reading images from 20 local dental clinics in South Korea and then to inform the incidence of condyle disease in advance. As shown in
Figure 8, this system was implemented to mark any problematic condyle part in red. This system determines whether images have condyle issues, and then transmits the corresponding detail to the PACS (Picture Archiving and Communication System), thereby briefly showing the pre-screening detail, as shown in
Figure 9.
5. Discussion and Conclusions
In this study, a novel algorithm to find the mandibular condyle was developed by classifying dental panoramic X-ray images through image detection techniques. Detection algorithms were compared using various learning models and the algorithm achieved an 82% weighted precision. This study therefore confirms the possibility of developing an algorithm to find a condylar region and identify abnormal diseases. The study also provides evidence of the possibility of learning by sufficiently extracting features with a small amount of data.
Using the developed algorithm, the expert system could provide additional information that allows clinical experts and local doctors to more quickly filter through dental panoramic images. The system developed in this study will help clinical doctors make decisions regarding diagnosis and further help patients and doctors save time spent in repetitive imaging and diagnostic processes to ensure smooth treatment.
It is important to detect osteoarthritis as early as possible and begin treatment. However, making a diagnosis only by clinical symptoms or panoramic radiographs has limitations. According to previous studies, a comparison of the presence or absence of bone change between the mandibular condyles in panoramic radiography and computed tomography showed a degenerative bone change in the computed tomography of 24% of the patients who did not exhibit significant condylar bone changes in panoramic radiographic images [
19,
20]. Separation of condyle and diagnosis of only one side of condyle has another limitation. The symmetry of condyles is an import criterion of TMJ disease [
18]. We will develop a comparison algorithm and include it the expert system. In addition, the disease classification was determined only by the panoramic X-ray images, which are not the gold-standard reference. Therefore, to improve accuracy and clinical use, it is necessary to supplement the diagnostic record of computed tomography images.
In the future, we plan to develop an algorithm with a higher accuracy using larger datasets because the sensitivity of this study was not high. Furthermore, because the design of this learning algorithm was limited to the condylar region, another algorithm could be developed through expansion to other regions or diseases.
Author Contributions
D.K., responsible for the entire paper (Conceptualization, methodology, analysis and writing—original draft preparation); E.C. and H.G.J., data collection and analysis; J.C., methodology review; S.Y., methodology review, editing, and supervision. All authors have read and agreed to the published version of the manuscript.
Funding
This research was supported by the Dongguk University Research Fund of 2016 and Gerontechnology research center.
Acknowledgments
This work was supported by the Dongguk University Research Fund 2020 (S-2020-G0001-00050).
Conflicts of Interest
The authors declare no conflict of interest.
References
- Stegenga, B.; De Bont, L.G.; Boering, G.; Van Willigen, J.D. Tissue responses to degenerative changes in the temporomandibular joint: A review. J. Oral Maxillofac. Surg. 1991, 49, 1079–1088. [Google Scholar] [CrossRef]
- Okeson, J.P. Management of Temporomandibular Disorders and Occlusion, 7th ed.; Elsevier: St. Louis, MO, USA, 2012. [Google Scholar]
- Piancino, M.G.; Cannavale, R.; Dalmasso, P.; Tonni, I.; Filipello, F.; Perillo, L.; Cattalini, M.; Meini, A.; Grazia, P.M.; Rosangela, C.; et al. Condylar asymmetry in patients with juvenile idiopathic arthritis: Could it be a sign of a possible temporomandibular joints involvement? Semin. Arthritis Rheum. 2015, 45, 208–213. [Google Scholar] [CrossRef]
- White, S.C.; Pharoah, M.J. Oral Radiology: Principles and Interpretation, 4th ed.; Mosby: St. Louis, MO, USA, 2000; pp. 493–498. [Google Scholar]
- SBrooks, S.L.; Brand, J.W.; Gibbs, S.; Hollender, L.; Lurie, A.G.; Omnell, K.-Å.; Westesson, P.-L.; White, S.C. Imaging of the temporomandibular joint. Oral Surg. Oral Med. Oral Pathol. Oral Radiol. 1997, 83, 609–618. [Google Scholar] [CrossRef]
- Hwang, J.-J.; Jung, Y.-H.; Cho, B.-H.; Heo, M.-S. An overview of deep learning in the field of dentistry. Imaging Sci. Dent. 2019, 49, 1–7. [Google Scholar] [CrossRef] [PubMed]
- De Tobel, J.; Radesh, P.; Vandermeulen, D.; Thevissen, P.W. An automated technique to stage lower third molar development on panoramic radiographs for age estimation: A pilot study. J. Forensic Odontostomatol. 2017, 35, 42–54. [Google Scholar] [PubMed]
- Wirtz, A.; Mirashi, S.G.; Wesarg, S. Automatic Teeth Segmentation in Panoramic X-ray Images Using a Coupled Shape Model in Combination with a Neural Network. In Proceedings of the 21st International Conference on Medical Image Computing and Computer Assisted Intervention, Granada, Spain, 16–20 September 2018; pp. 712–719. [Google Scholar]
- Oktay, A.B. Tooth detection with Convolutional Neural Networks. In Proceedings of the 2017 Medical Technologies National Congress, TIPTEKNO 2017, Trabzon, Turkey, 12–14 October 2017; pp. 1–4. [Google Scholar]
- Mahoor, M.H.; Abdel-Mottaleb, M. Classification and numbering of teeth in dental bitewing images. Pattern Recognit. 2005, 38, 577–586. [Google Scholar] [CrossRef]
- Poedjiastoeti, W.; Suebnukarn, S. Application of Convolutional Neural Network in the Diagnosis of Jaw Tumors. Heal. Inform. Res. 2018, 24, 236–241. [Google Scholar] [CrossRef] [PubMed]
- Ariji, Y.; Yanashita, Y.; Kutsuna, S.; Muramatsu, C.; Fukuda, M.; Kise, Y.; Nozawa, M.; Kuwada, C.; Fujita, H.; Katsumata, A.; et al. Automatic detection and classification of radiolucent lesions in the mandible on panoramic radiographs using a deep learning object detection technique. Oral Surg. Oral Med. Oral Pathol. Oral Radiol. 2019, 128, 424–430. [Google Scholar] [CrossRef] [PubMed]
- Guo, Y.; Liu, Y.; Oerlemans, A.; Lao, S.; Wu, S.; Lew, M.S. Deep learning for visual understanding: A review. Neurocomputing 2016, 187, 27–48. [Google Scholar] [CrossRef]
- Mwiti, D. “A 2019 Guide to Object Detection,” HeartBeat (Medium). Available online: https://heartbeat.fritz.ai/a-2019-guide-to-object-detection-9509987954c3 (accessed on 15 May 2020).
- Huang, J.; Rathod, V.; Sun, C.; Zhu, M.; Korattikara, A.; Fathi, A.; Fischer, I.; Wojna, Z.; Song, Y.; Guadarrama, S.; et al. Speed/Accuracy Trade-Offs for Modern Convolutional Object Detectors. In Proceedings of the 2017 IEEE Conference on Computer Vision and Pattern Recognition (CVPR), Honolulu, HI, USA, 21–26 July 2017. [Google Scholar]
- A Gupta, A.; Puri, R.; Verma, M.; Gunjyal, S.; Kumar, A. Performance Comparison of Object Detection Algorithms with different Feature Extractors. In Proceedings of the 6th International Conference on Signal Processing and Integrated Networks (SPIN), Noida, India, 7–8 March 2019; pp. 472–477. [Google Scholar]
- Redmon, J.; Divvala, S.; Girshick, R.; Farhadi, A. You Only Look Once: Unified, Real-Time Object Detection, In Proceedings of the 2016 Conference on Computer Vision and Pattern Recognition, Las Vegas, NV, USA, 27–30 June 2016.
- Piancino, M.G.; Cannavale, R.; Dalmasso, P.; Tonni, I.; Garagiola, U.; Perillo, L.; Olivieri, A.N. Cranial structure and condylar asymmetry of patients with juvenile idiopathic arthritis: A risky growth pattern. Clin. Rheumatol. 2018, 37, 2667–2673. [Google Scholar] [CrossRef] [PubMed]
- Kim, J.-H.; Jeon, H.-M.; Ok, S.-M.; Heo, J.-Y.; Jeong, J.-H.; Ahn, Y.-W.; Ko, M.-Y. Effect of Occlusal Stabilizing Splint for Osteoarthritis of Temporomandibular Joint. J. Oral Med. Pain 2012, 37, 113–123. [Google Scholar] [CrossRef]
- Das, S.K. TMJ osteoarthritis and early diagnosis. J. Oral Biol. Craniofacial Res. 2013, 3, 109–110. [Google Scholar] [CrossRef] [PubMed]
| Publisher’s Note: MDPI stays neutral with regard to jurisdictional claims in published maps and institutional affiliations. |
© 2020 by the authors. Licensee MDPI, Basel, Switzerland. This article is an open access article distributed under the terms and conditions of the Creative Commons Attribution (CC BY) license (http://creativecommons.org/licenses/by/4.0/).


