Article

Numerical Study on the Power Efficiency and Flow Characteristics of a New Type of Wind Energy Collection Device

1
National Environmental Protection Research Institute for Electric Power, Nanjing 210031, China
2
Key Laboratory of Unsteady Aerodynamics and Flow Control, Ministry of Industry and Information Technology, Nanjing University of Aeronautics and Astronautics, Nanjing 210016, China
*
Author to whom correspondence should be addressed.
Appl. Sci. 2020, 10(21), 7438; https://doi.org/10.3390/app10217438
Submission received: 23 September 2020 / Revised: 11 October 2020 / Accepted: 20 October 2020 / Published: 23 October 2020
(This article belongs to the Section Energy Science and Technology)

Abstract

:
The increased velocity (Invelox) wind turbine system is a novel wind energy collection device. This system can collect and accelerate the air flow through a funnel and a Venturi tube. However, the efficiency of this system is relatively low under some wind directions. To improve the aerodynamic performance of Invelox, a straight-through layout with a windshield was proposed. The flow field of the improved design was studied by applying Computational Fluid Dynamics (CFD) and was compared with that in the original configuration. Numerical results show that when the Invelox exit is facing the incoming wind, the ratio of the average velocity inside the Venturi tube to the incoming wind speed, i.e., the speed ratio, will drop sharply, and even the airflow will push back. The improved layout can eliminate the sensitivity of incoming wind direction to aerodynamic characteristics. The windshield can effectively reduce the interference of incoming air to the outlet air, making the speed ratio increase by about 42%. Different wind profiles in the atmospheric boundary layer are used in the boundary of the flow domain as the incoming flow wind. With the increase in the wind profile index, the speed ratio of the Invelox system will gradually decrease.

1. Introduction

With the development of human society, energy shortage and environment pollution are very critical and need to be solved urgently in some regions of the world. With the increasing demand for energy, traditional non-renewable energy is becoming more and more urgent [1,2,3,4]. In recent years, with the rapid development of global economy and the increasingly serious environmental problems, the contradiction between the power structure dominated by thermal power and fossil energy consumption has become more and more prominent [5,6,7,8]. The traditional energy mainly consists of coal, oil, and natural gas, which not only have limited resource reserves, but also cause serious environmental pollution. Therefore, the development and utilization of renewable energy, especially wind energy, has been highly valued by all countries in the world. Wind power is a renewable, pollution-free, and promising energy. In order to curb the trend of environmental degradation and realize the sustainable development of energy, the development of wind energy has become the strategic choice [9,10,11,12,13].
The wind turbine is a device that converts wind energy into mechanical energy and then into electrical energy. According to the relative position between the rotating spindle of wind turbine and the ground, it can be divided into a horizontal axis wind turbine [14,15,16] and a vertical axis wind turbine [17,18,19]. The rotating axis of the horizontal axis wind turbine is parallel to the ground, and the wind energy utilization coefficient can reach 0.4, but the wind wheel needs to be adjusted with the change of wind direction. In contrast, the rotating axis of the vertical axis wind turbine is perpendicular to the ground, and the wind wheel does not need to adjust the direction with the change of wind direction, but the wind energy utilization coefficient is relatively low. Compared with the vertical axis wind turbine, the horizontal axis wind turbine has a larger capacity and a higher wind energy utilization coefficient, so it is widely used. However, due to the characteristics of its own structure, the horizontal axis wind turbine has many inevitable issues to be resolved. First, the horizontal axis wind turbine needs a yaw device to ensure that the wind turbine plane is directly opposite to the flow. Secondly, the horizontal axis wind turbine starts with high wind speed, which is not particularly suitable for areas with low wind density. What is more, high-speed blades can produce very strong low-frequency noise, which can cause great harm to people and wildlife. In order to overcome the defects in traditional horizontal axis wind turbines, a wind turbine system called Invelox [20,21] has been developed by SheerWind, as shown in Figure 1.
The wind collector at the top can collect wind energy from all directions. The collected wind moves through the funnel to the Venturi section at the downstream to realize acceleration. The wind turbine arranged in the Venturi section converts the wind energy into electric energy under the optimal wind speed. Compared with the traditional horizontal axis wind turbine, the Invelox wind turbine system does not need a yaw device. SheerWind claims in its announcement that the system can produce electricity with wind speeds as low as 0.45 m/s.
As inventors of the patent, Allaei et al. [20,21] conducted numerical and field studies of the Invelox system. They found that the Invelox system could deliver far more power than a conventional wind turbine of the same size. Moreover, the Invelox system does not require any wind regulation, and all rotating parts of the Invelox are located on the ground, making it easy to operate and maintain. Sotoudeh et al. [22] studied the performance of the Invelox wind turbine system in low-wind areas of the Sistan plain through numerical simulations and field tests. They examined the energy output and noise characteristics of wind turbines at different heights. The results show that the output power of the Invelox system at 40 m is 87.5% higher than at 10 m, but the noise level is also 39.3% higher. In addition, to further increase the output power of the Invelox system, they added a funnel to the existing system. This increases the output power of the whole machine by 44%.
While the Invelox system has many advantages, it also has some drawbacks. For example, if a portion of the air entering the funnel escapes from the leeward side, efficiency of this system is reduced. One of the most important parameters of the Invelox wind turbine system is Speed Ratio (SR), which is the ratio of the average wind speed in the Venturi tube to the speed of the incoming flow. Anbarsooz et al. [23] proposed the improvement measures of installing baffles. The results show that at ambient wind speeds of 3–12 m/s, the installation of a leak-proof baffle can increase the average wind speed in Venturi tubes by about 25%. Although the Invelox system is claimed to accept wind from all directions, it is only effective in the range of −90°–90°.
In most of the existing studies on the aerodynamic characteristics of the Invelox wind turbine system, the ambient wind speed is considered uniformly. In fact, the wind turbine system as a power generation device must be placed in the atmosphere in order to have practical significance. The wind in the atmospheric environment is not uniformly distributed but exponentially or logarithmically distributed, which is the atmospheric boundary layer (ABL) wind profile. Sotoudeh et al. [22] considered the ABL wind profile in their study. However, they did not consider the effect of the angle between the ambient wind and the axis of the Venturi on the velocity distribution of the system.
In this paper, a straight-through layout with a windshield was proposed to improve the efficiency of Invelox. The aerodynamic characteristics and velocity ratios of the original Invelox wind energy collection device is studied in detail under different incoming wind directions. Numerical simulations of the flow in the improved Invelox with a straight-through layout were then carried out. Numerical results are compared with those in the original configuration. Finally, the differences of flow field characteristics between the atmospheric boundary layer wind profile and the uniform flow wind are compared.

2. Original Model and Improved Design
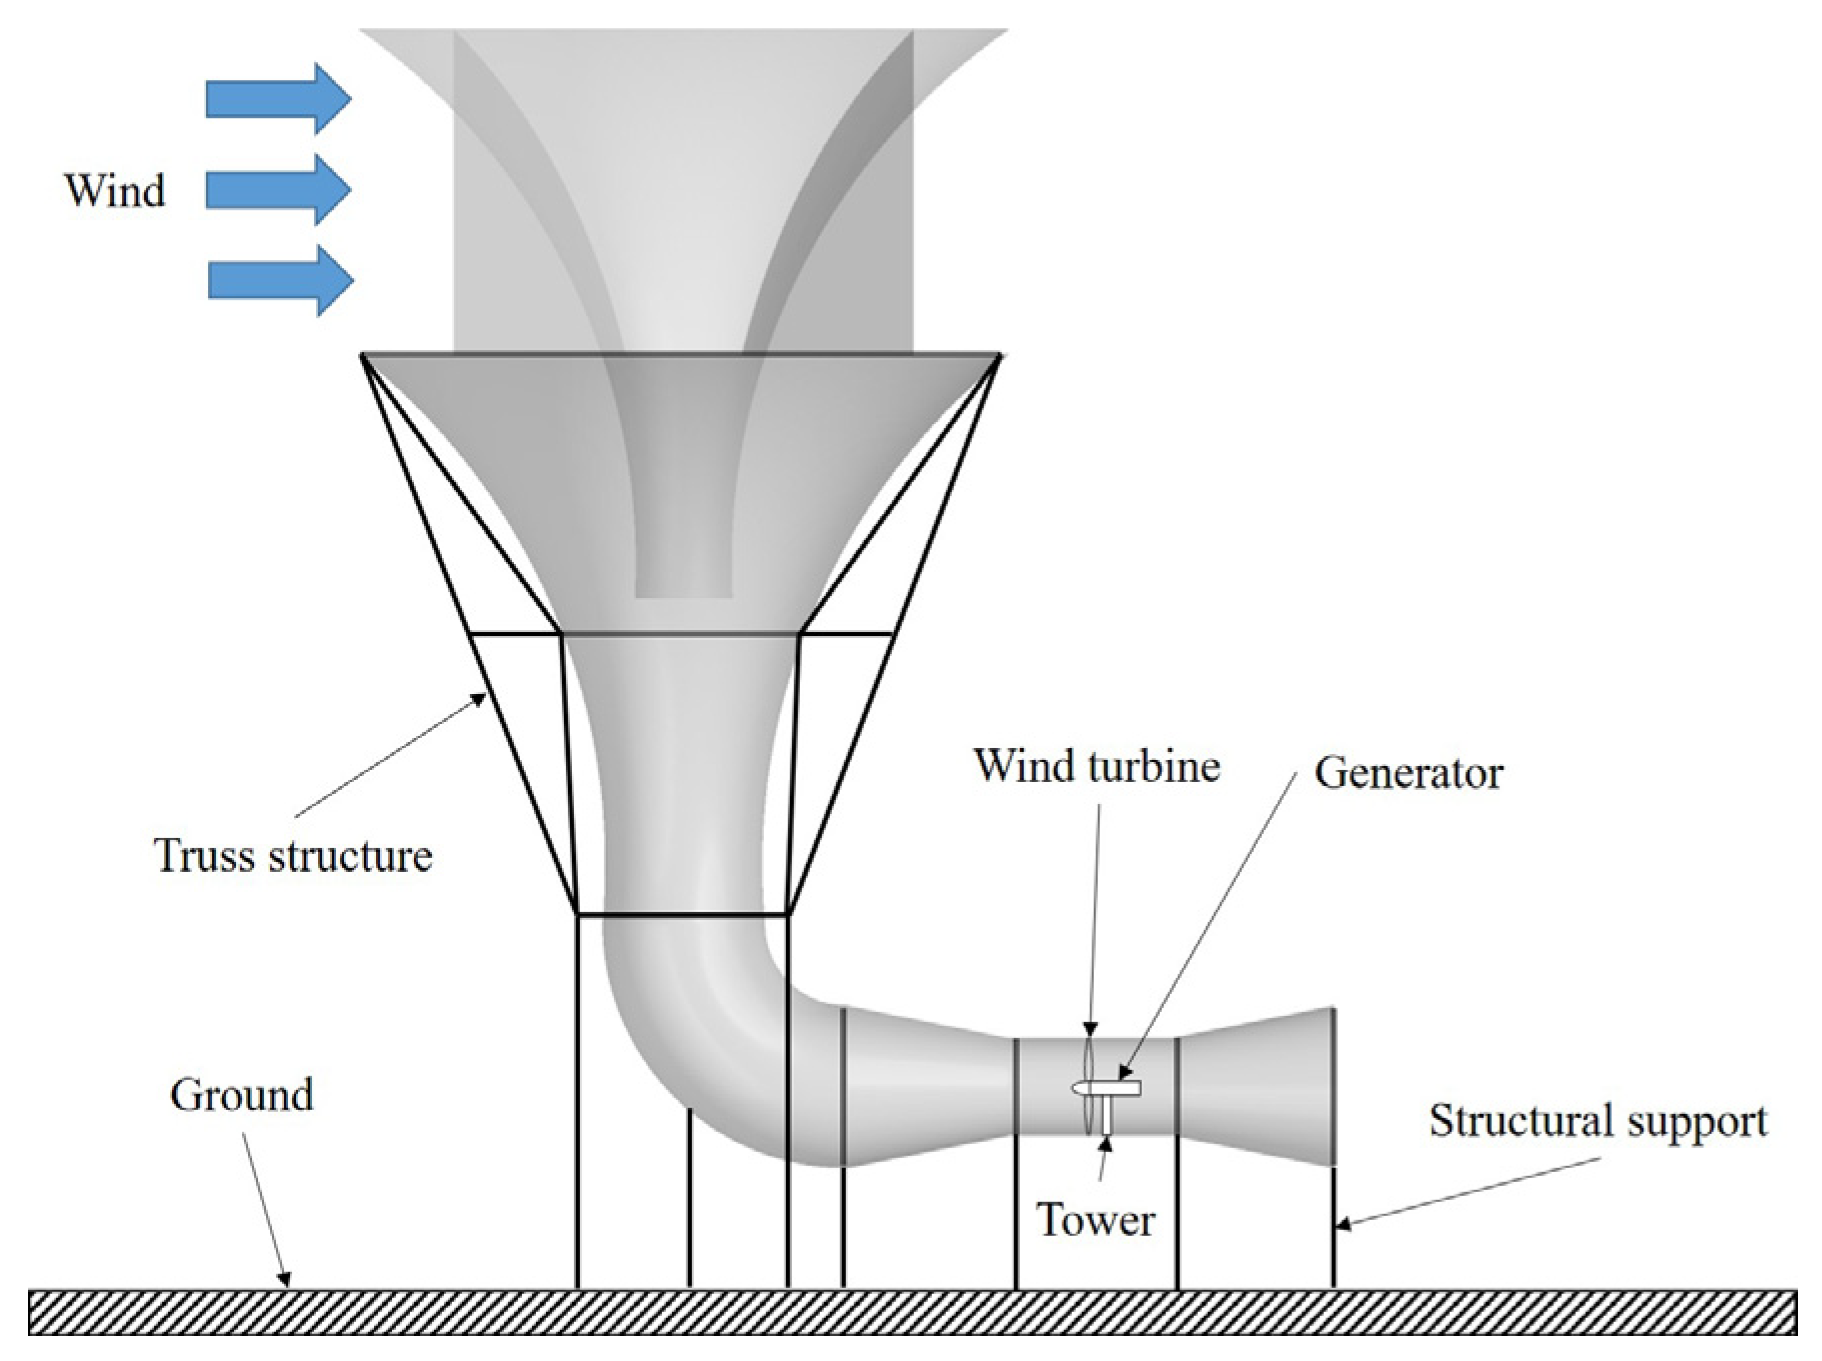
2.1. Original Model

Figure 2 shows the dimensions and design of the original Invelox system. The funnel and baffle above the system collect the wind from all directions, and the funnel below collects the wind and transmits it to the Venturi tube at the bottom. According to Bernoulli’s equation, the area goes down and the velocity goes up. After accelerating through the contraction section, the airflow blows the wind turbine in the Venturi tube to generate electricity, and then pressurizes through the diffusion section, and finally flows to the atmospheric environment.

2.2. Improved Design

There was a serious problem with the original Invelox system, where the Venturi tube was horizontally positioned so that the system’s exit could be facing the incoming wind, which would cause a significant reduction in the aerodynamic performance of the system. In order to improve the performance of the Invelox system, we provide a new design idea, which is to remove the bending part of the system and vertically arrange the Venturi tube of the wind turbine under the funnel, as shown in Figure 3. For the convenience of description, the leftmost model in Figure 3, namely the original configuration, is denoted as Model 0, the middle model is denoted as Model 1, and the last model is denoted as Model 2.
Model 1 removes the red curve from Model 0, so that there is no system exit facing the incoming flow. However, under any wind direction, the outlet plane of Model 1 is parallel to the incoming flow, which is like the encounter of Model 0 at the wind direction angle of 90°, so the maximum speed ratio may be affected. Therefore, based on Model 1, we added a windshield around the exit. The windshield can avoid the interference of the ambient airflow to the system outlet airflow, and then improve the performance of the system. The windshield is a cylinder, coaxial with the Venturi tube, and arranged symmetrically along the system exit. The radius and height of the windshield are both 3.05 m.

3. Numerical Method

3.1. Governing Equations

With the improvement of computer hardware, it is possible to use Direct Numerical Simulation (DNS) to study fluid motion characteristics [24]. However, DNS could not be widely used in industrial fluid numerical simulations up to now due to its high requirements on mesh. In this study, the three-dimensional incompressible Reynolds-Averaged Navier-Stokes (RANS) equation is used to solve the flow field. Since no heat transfer is involved, there is no need to solve the energy equation. In RANS, the solution variables represent time-averaged values. The mass and momentum conservation equations for the steady RANS system in Cartesian coordinates can be written as follows [1]:
u i ¯ x i = 0
ρ u j ¯ x j ( u i ¯ ) = p ¯ x i + x j ( μ u i ¯ x j ρ u i u j ¯ ) + S i
where ρ is the air density, u i is the air velocity, p is the a pressure, μ is the air viscosity, u i is the fluctuating velocity component in the i direction, Si is the source term. ρ u i u j ¯ is the Reynolds stress term which needs to be modeled via an appropriate turbulence model. The turbulence models commonly used in the Reynolds mean N-S equation include the k-ε model and the k-ω model. Anbarsooz et al. [23] have discussed the influence of the turbulence model on the flow field results of the Invelox wind turbine in their research, so the Realizable k-ε model is applied in this study.

3.2. Solution Methodology

In this study, the commercial software ANSYS Fluent version 15.0 (Canonsburg, PA, USA) [25] is used as the simulation tool to investigate the flow field characteristics of the Invelox wind turbine system. The pressure-based segregated solver is adopted, the pressure-velocity coupling method is a Semi-Implicit Method for Pressure Linked Equations (SIMPLE) algorithm, and the pressure and momentum equations are discretized by the second-order upwind scheme. The enhanced wall function is adopted in the turbulence model. The calculation results were obtained with the scaled residuals dropped to the order of 10−5 and the monitored variable (average velocity at cross section of Venturi tube) was stable.

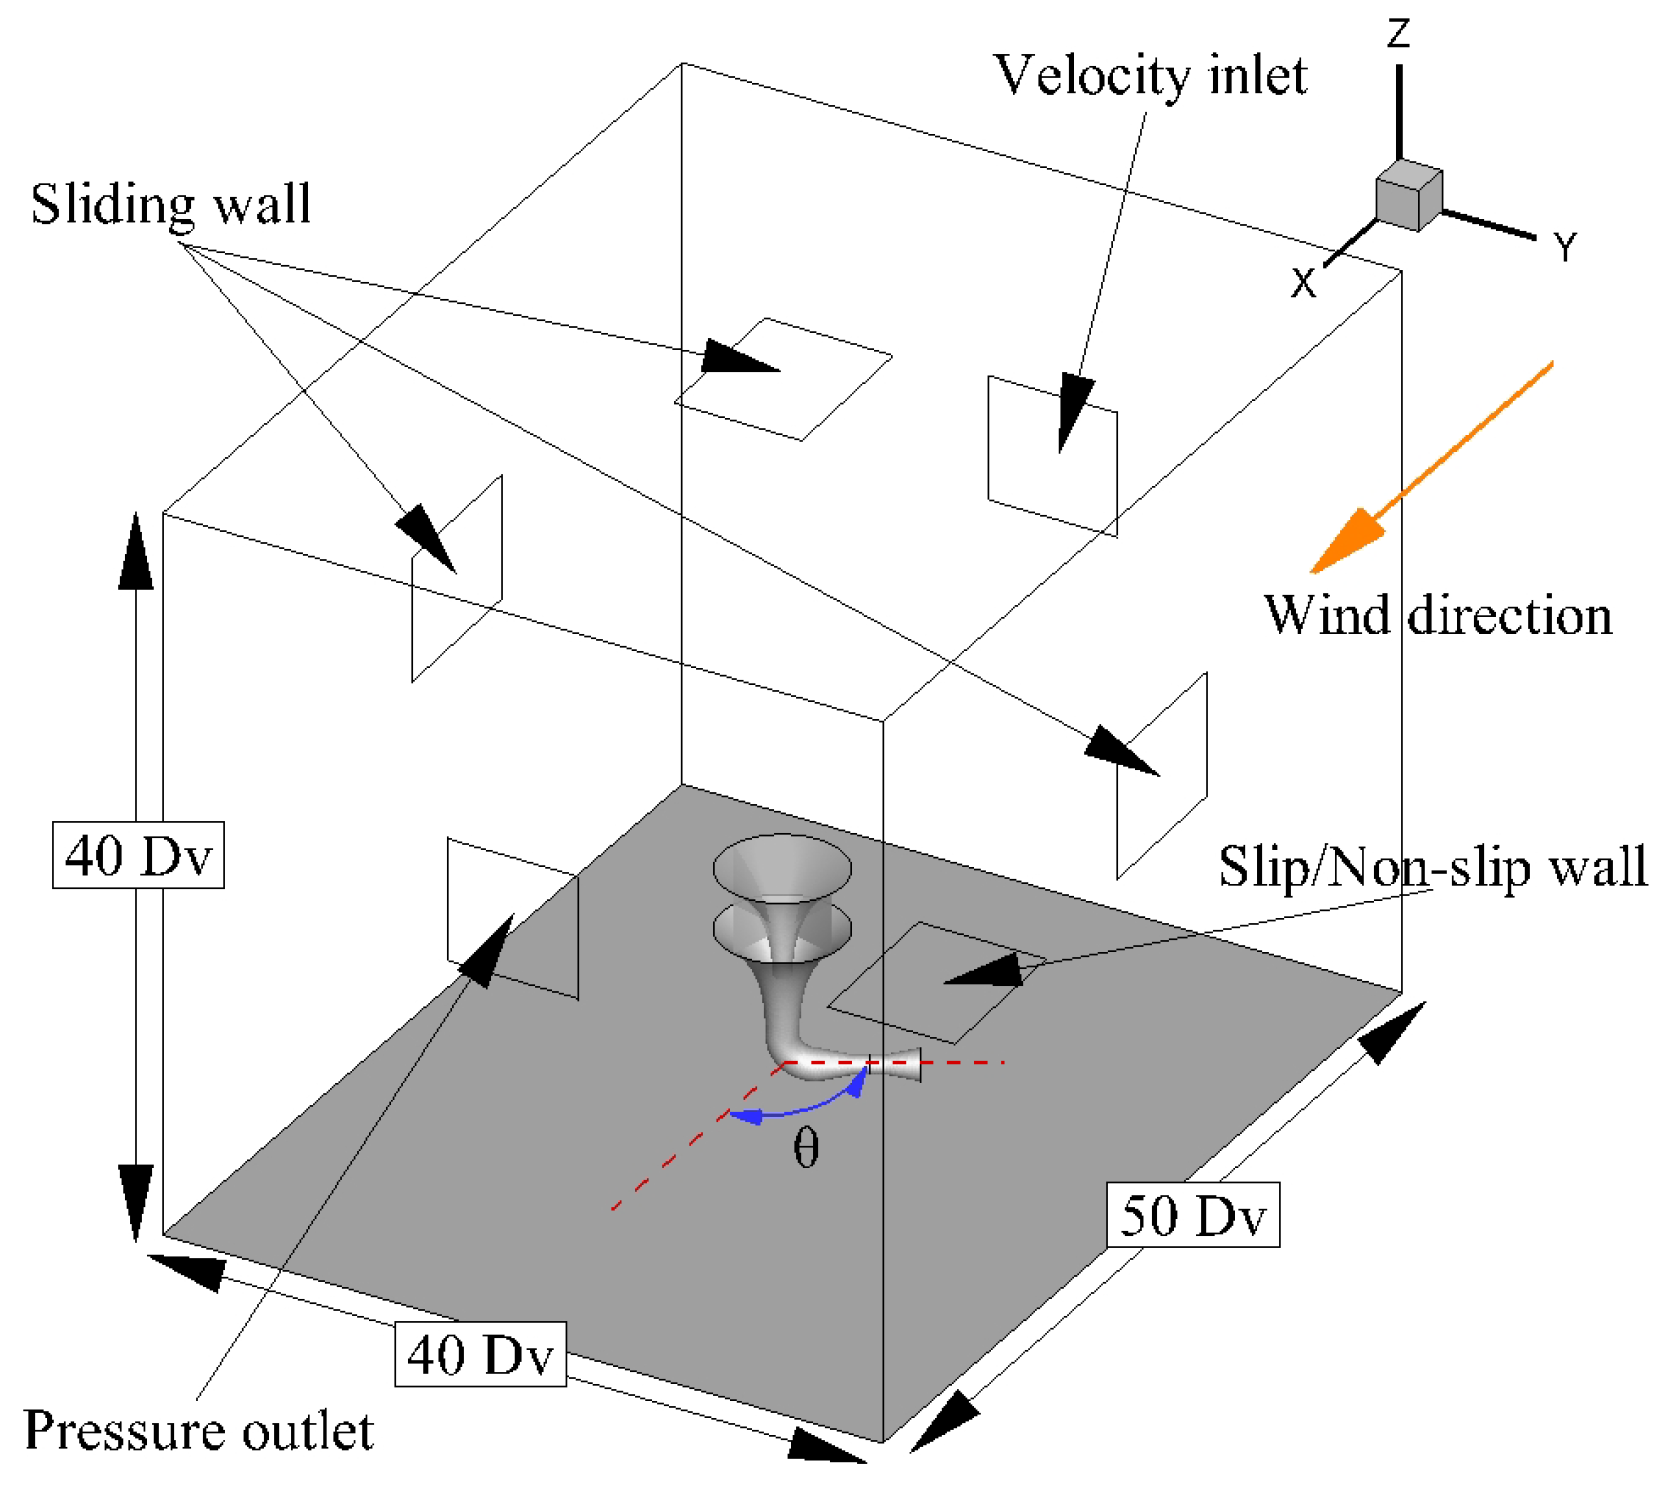
3.3. Mesh and Boundary Conditions

The quality of the mesh plays a significant role in the accuracy and stability of the numerical computation. The computational mesh composed of tetrahedral cells is shown in Figure 4. To increase the simulation accuracy, grid refining is used at the elbow and Venturi tube. Since the difficulty and calculation amount of numerical simulation will be greatly increased with the addition of a wind turbine, and because this paper focuses on the aerodynamic performance of the wind gathering device itself, the simulation in this paper does not involve a wind turbine.
The computational domain and boundary conditions are shown in Figure 5. The length, width and height of the computational domain are 40, 40 and 50 Dv respectively, where Dv is the diameter of the Venturi tube. The angle θ is defined as the angle between the incoming flow direction and the axis of the Venturi tube. θ is equal to 0° when the outlet of the Invelox system has its back to the incoming wind, and 180° when the outlet is facing the incoming wind. The inlet of the computational domain is the velocity inlet boundary condition, the outlet is the pressure outlet, and the two sides and the top are the slip boundary.
There are two kinds of boundary conditions at the ground. When the incoming velocity is uniform, the turbulence intensity and length scales were set as 5% and 1 m respectively, and the ground boundary condition is the slip boundary. When the inlet velocity is the ABL wind profile, the ground boundary condition is a non-slip boundary.
For the ABL wind profile, we applied the power-law equation to describe the wind profile [26].
u = u ref ( z z ref ) a
where zref is the reference height and uref is the wind speed at reference height, and α is the wind profile index. In this study, we set the reference height as 30 m (center of Invelox system entry) and specified the reference wind speed as 6.7 m/s. The profile of turbulent kinetic energy k imposed at the inlet boundary is calculated as follows:
k = 3 2 ( I · u ) 2
I = 0.1 ( z z G ) ( α 0.5 )
where z G is the gradient wind height set as 450 m. The turbulent dissipation rate ε at the inlet boundary is suggested as follows:
ε = C μ 1 / 2 k u ref z ref α ( z z ref ) ( α 1 )
where C μ is a constant with the value of 0.09.
The user-defined function is compiled according to the above formulas and is imported into the fluent to realize the non-uniform velocity inlet boundary. In addition, the other software settings are consistent with that in the uniform incoming flow.

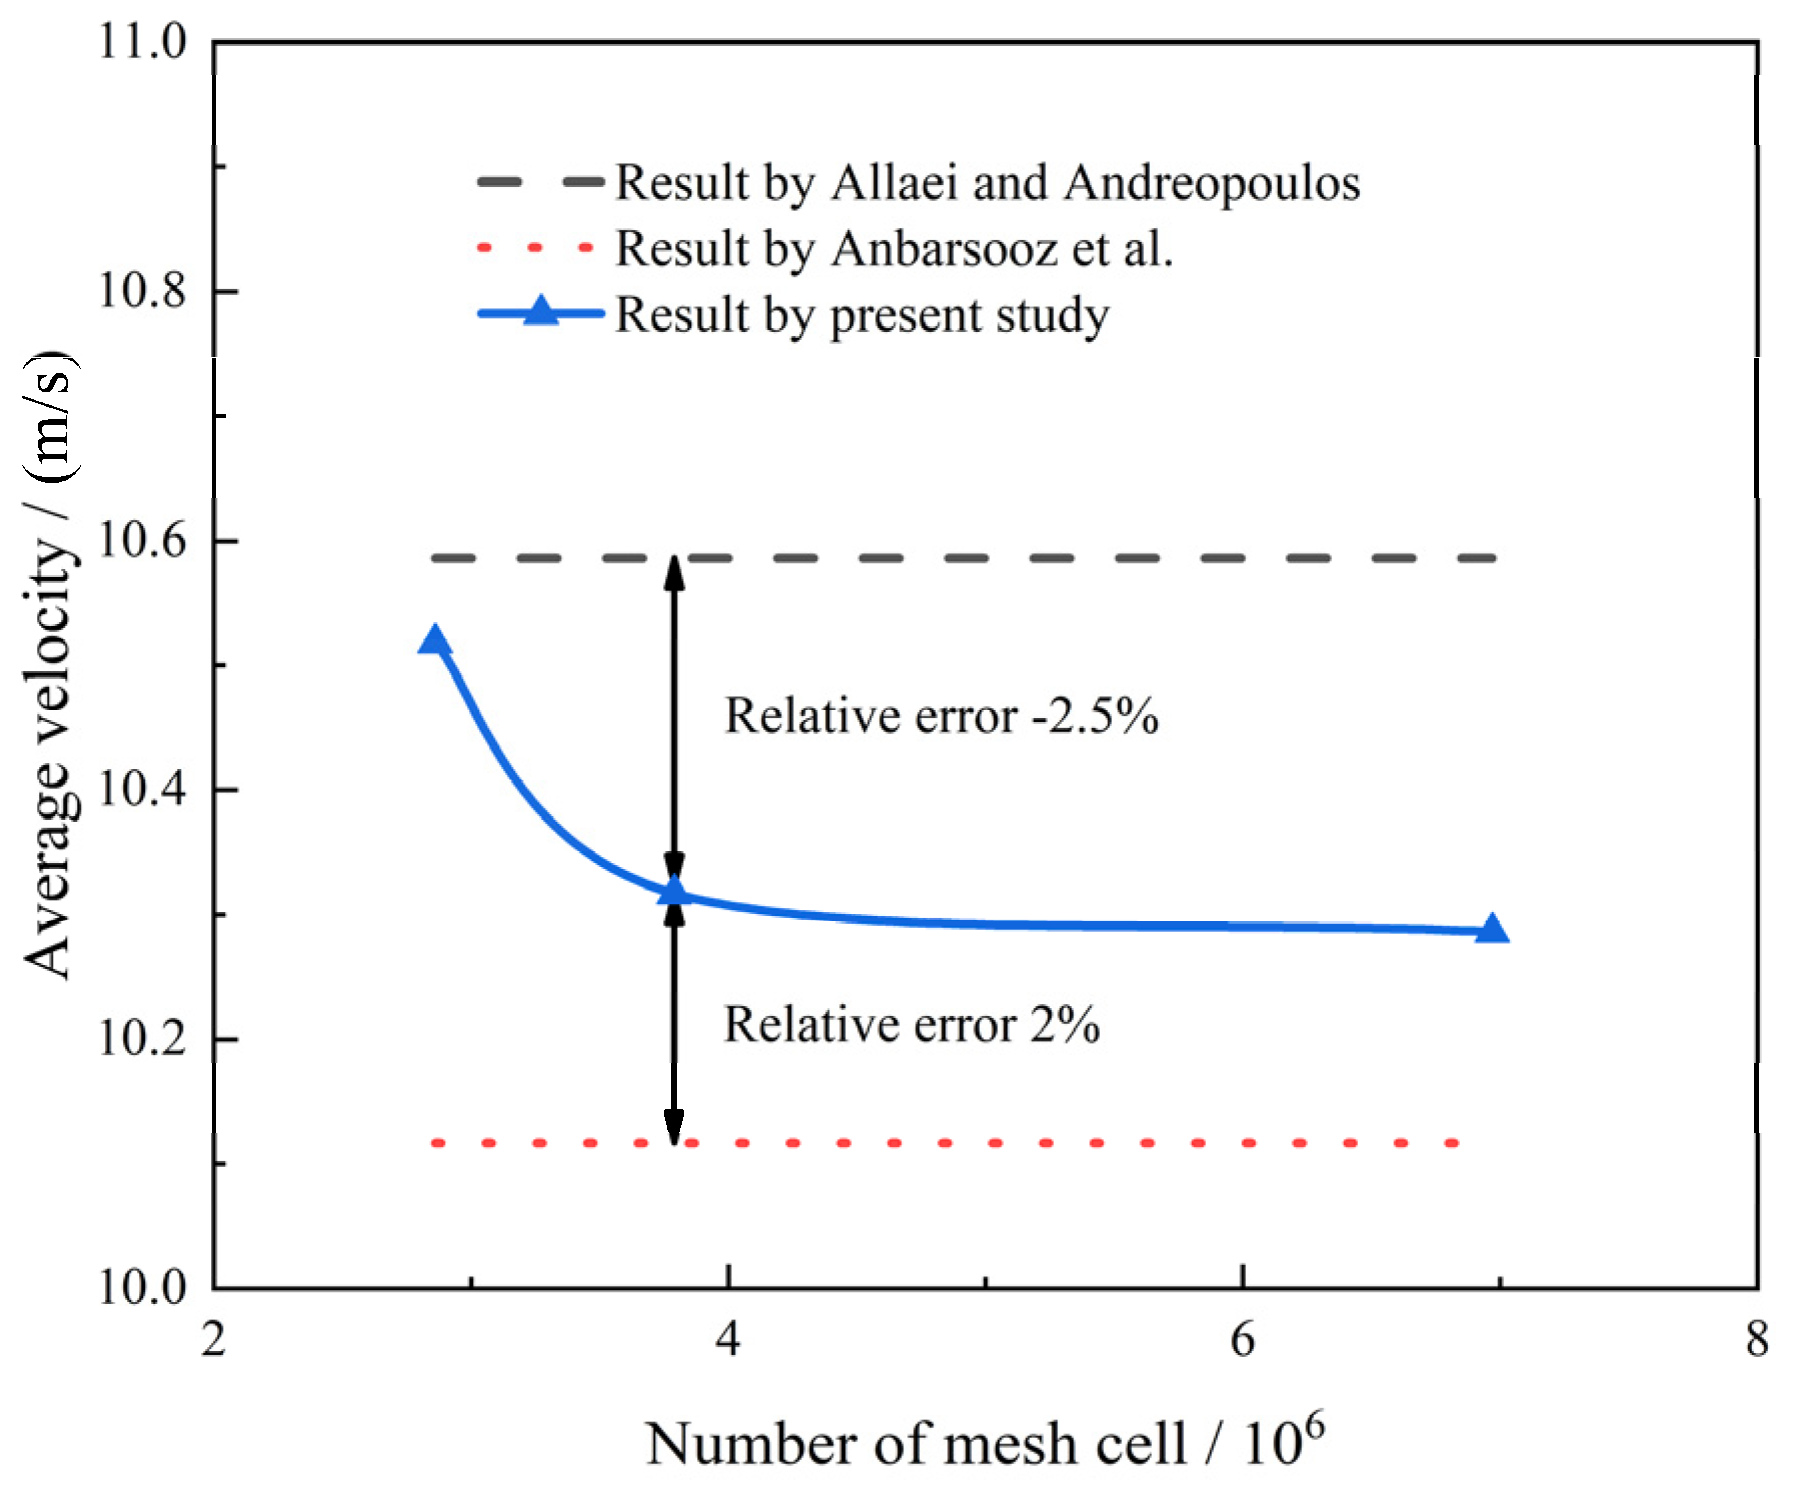
3.4. Mesh Sensitivity Study and Validation

To reduce computational cost and guarantee precision, we conducted a mesh sensitivity study at the incident wind velocity of 6.7 m/s. By refining the mesh on the surfaces of the model and the far field, three different meshes were obtained, including coarse, medium and fine meshes with the cell number of 2.86, 3.79 and 6.97 million, respectively. The results of the average velocity in the Venturi tube for different grids are shown in Figure 6. When the mesh number exceeded 3.79 million, the results remained basically unchanged. At the same time, it can be seen that the calculation results of this paper are in good agreement with those of the references [20,23], and the maximum relative error is only 2.5%. Furthermore, the velocity variations on a line, which is at the Venturi section, is plotted in Figure 7. As the figure shows, the medium mesh can be selected as the best mesh resolution because further increasing the cell count has no considerable changes in the numerical results and it only increases the computational cost.
In order to evaluate the convergence of the mesh sensitivity study, the grid convergence index (GCI) [27] is used. The GCI can be determined by
GCI = δ r e 1
where
δ = | φ f i n e φ m e d i u m φ f i n e |
r = ( N f i n e N m e d i u m ) 1 / 3
e = ln [ φ m e d i u m φ c o a r s e φ f i n e φ m e d i u m ] ln ( r )
where φ and N are the average flow velocity in the Venturi tube and the grid number, respectively. The GCI values for this study are given in Table 1. The values of the GCI are less than 0.4% for medium and fine meshes, which confirms that the numerical results are independent of the grid. Therefore, the mesh with 3.79 million grid cells was selected as the computational mesh for the subsequent simulation.

4. Results and Discussion

4.1. Performance of the Original Model

The Invelox system is essentially a wind gathering–accelerating device, and the dimensionless coefficient Speed ratio (SR) is usually used to evaluate its aerodynamic performance, which is defined as
SR = Average   air velocity   in   the   Venturi   tube Incoming   wind   velocity
Figure 8 shows the variation of the average SR in the wind direction at the Venturi tube. Considering the symmetry of the model, only the range of 0–180° is calculated. When the angle between the wind direction and the axis of the Venturi tube axis θ exceeds 90°, the SR decreases rapidly. When θ is larger than 120°, the SR becomes negative, which means that the airflow is pouring back into the Venturi tube from the outlet. Thus, the Invelox system cannot really capture wind power from any wind direction. When the environmental wind direction changes, the system cannot supply effective wind energy consistently and stably. The results show that the aerodynamic performance of the system is very sensitive to wind direction, and the change in wind direction will have a great influence on the steadiness of the output power of the wind turbine.
The streamline can visually observe the movement characteristics of the flow. Figure 9 shows the streamlines near the upstream entrance of the original Invelox model under different wind conditions. When θ is less than 90°, air from the upwind direction of the Invelox enters the wind collection device and part of the air escapes from the leeward side, and the rest of the air travels through the pipe to the Venturi tube. As θ increases, the external flow forms a barrier at the Invelox exit, blocking the flow of the internal flow. When θ reaches 120°, almost all the airflow into the wind energy collection device will flow out from the leeward side. In this case, the airflow speed in the Venturi tube is very small, and the wind turbine will not be able to work normally.
Figure 10 is the velocity vector diagram at the exit of the system under different wind directions. It can be clearly seen that when the outlet normal direction is consistent with the incoming flow direction, that is, when θ = 0°, the directions of the velocity vector inside and outside the flow tube are basically consistent. As θ increases, the external flow will form a barrier to the internal flow, which will hinder the movement of the latter. When θ increases to 120°, the external air flow moves almost along the exit plane near the exit, so the internal air flow is almost zero. As θ increases further, the external flow flows into the system from the outlet, at which point the velocity ratio of the system becomes negative.
The essence of motion is the drive of pressure difference. Figure 11 shows the total pressure contours in the vertical plane of the Invelox system at 0° and 180°. Section A refers to the exit plane of the system, and section B is the section below the funnel. The diameters of both sections are 10 ft. When θ = 0°, the cross-section A is on the leeward side. The airflow enters the funnel from above, some escaping from the leeward side, the other into the Venturi, and then exits through the outlet. At this point, section B is upstream of section A, so the average total pressure of section B is greater than that of section A. When θ = 180°, the cross-section A is on the windward side. The airflow enters the system from both the upper and the cross-section A, and then exits from the upper leeward side. Since cross section A is on the windward side, the average total pressure at cross section A is high (consistent with the incoming flow). The flow at the top inlet loses some of its total pressure as it passes through the funnel, and by the time it gets to section B, the total pressure is less than section A. Therefore, the airflow entering the system from above cannot resist the impact of the airflow entering the system from below, so it is forced to exit from the leeward side of the system from above. The directions of flow in both cases are shown by the arrow in the figure.

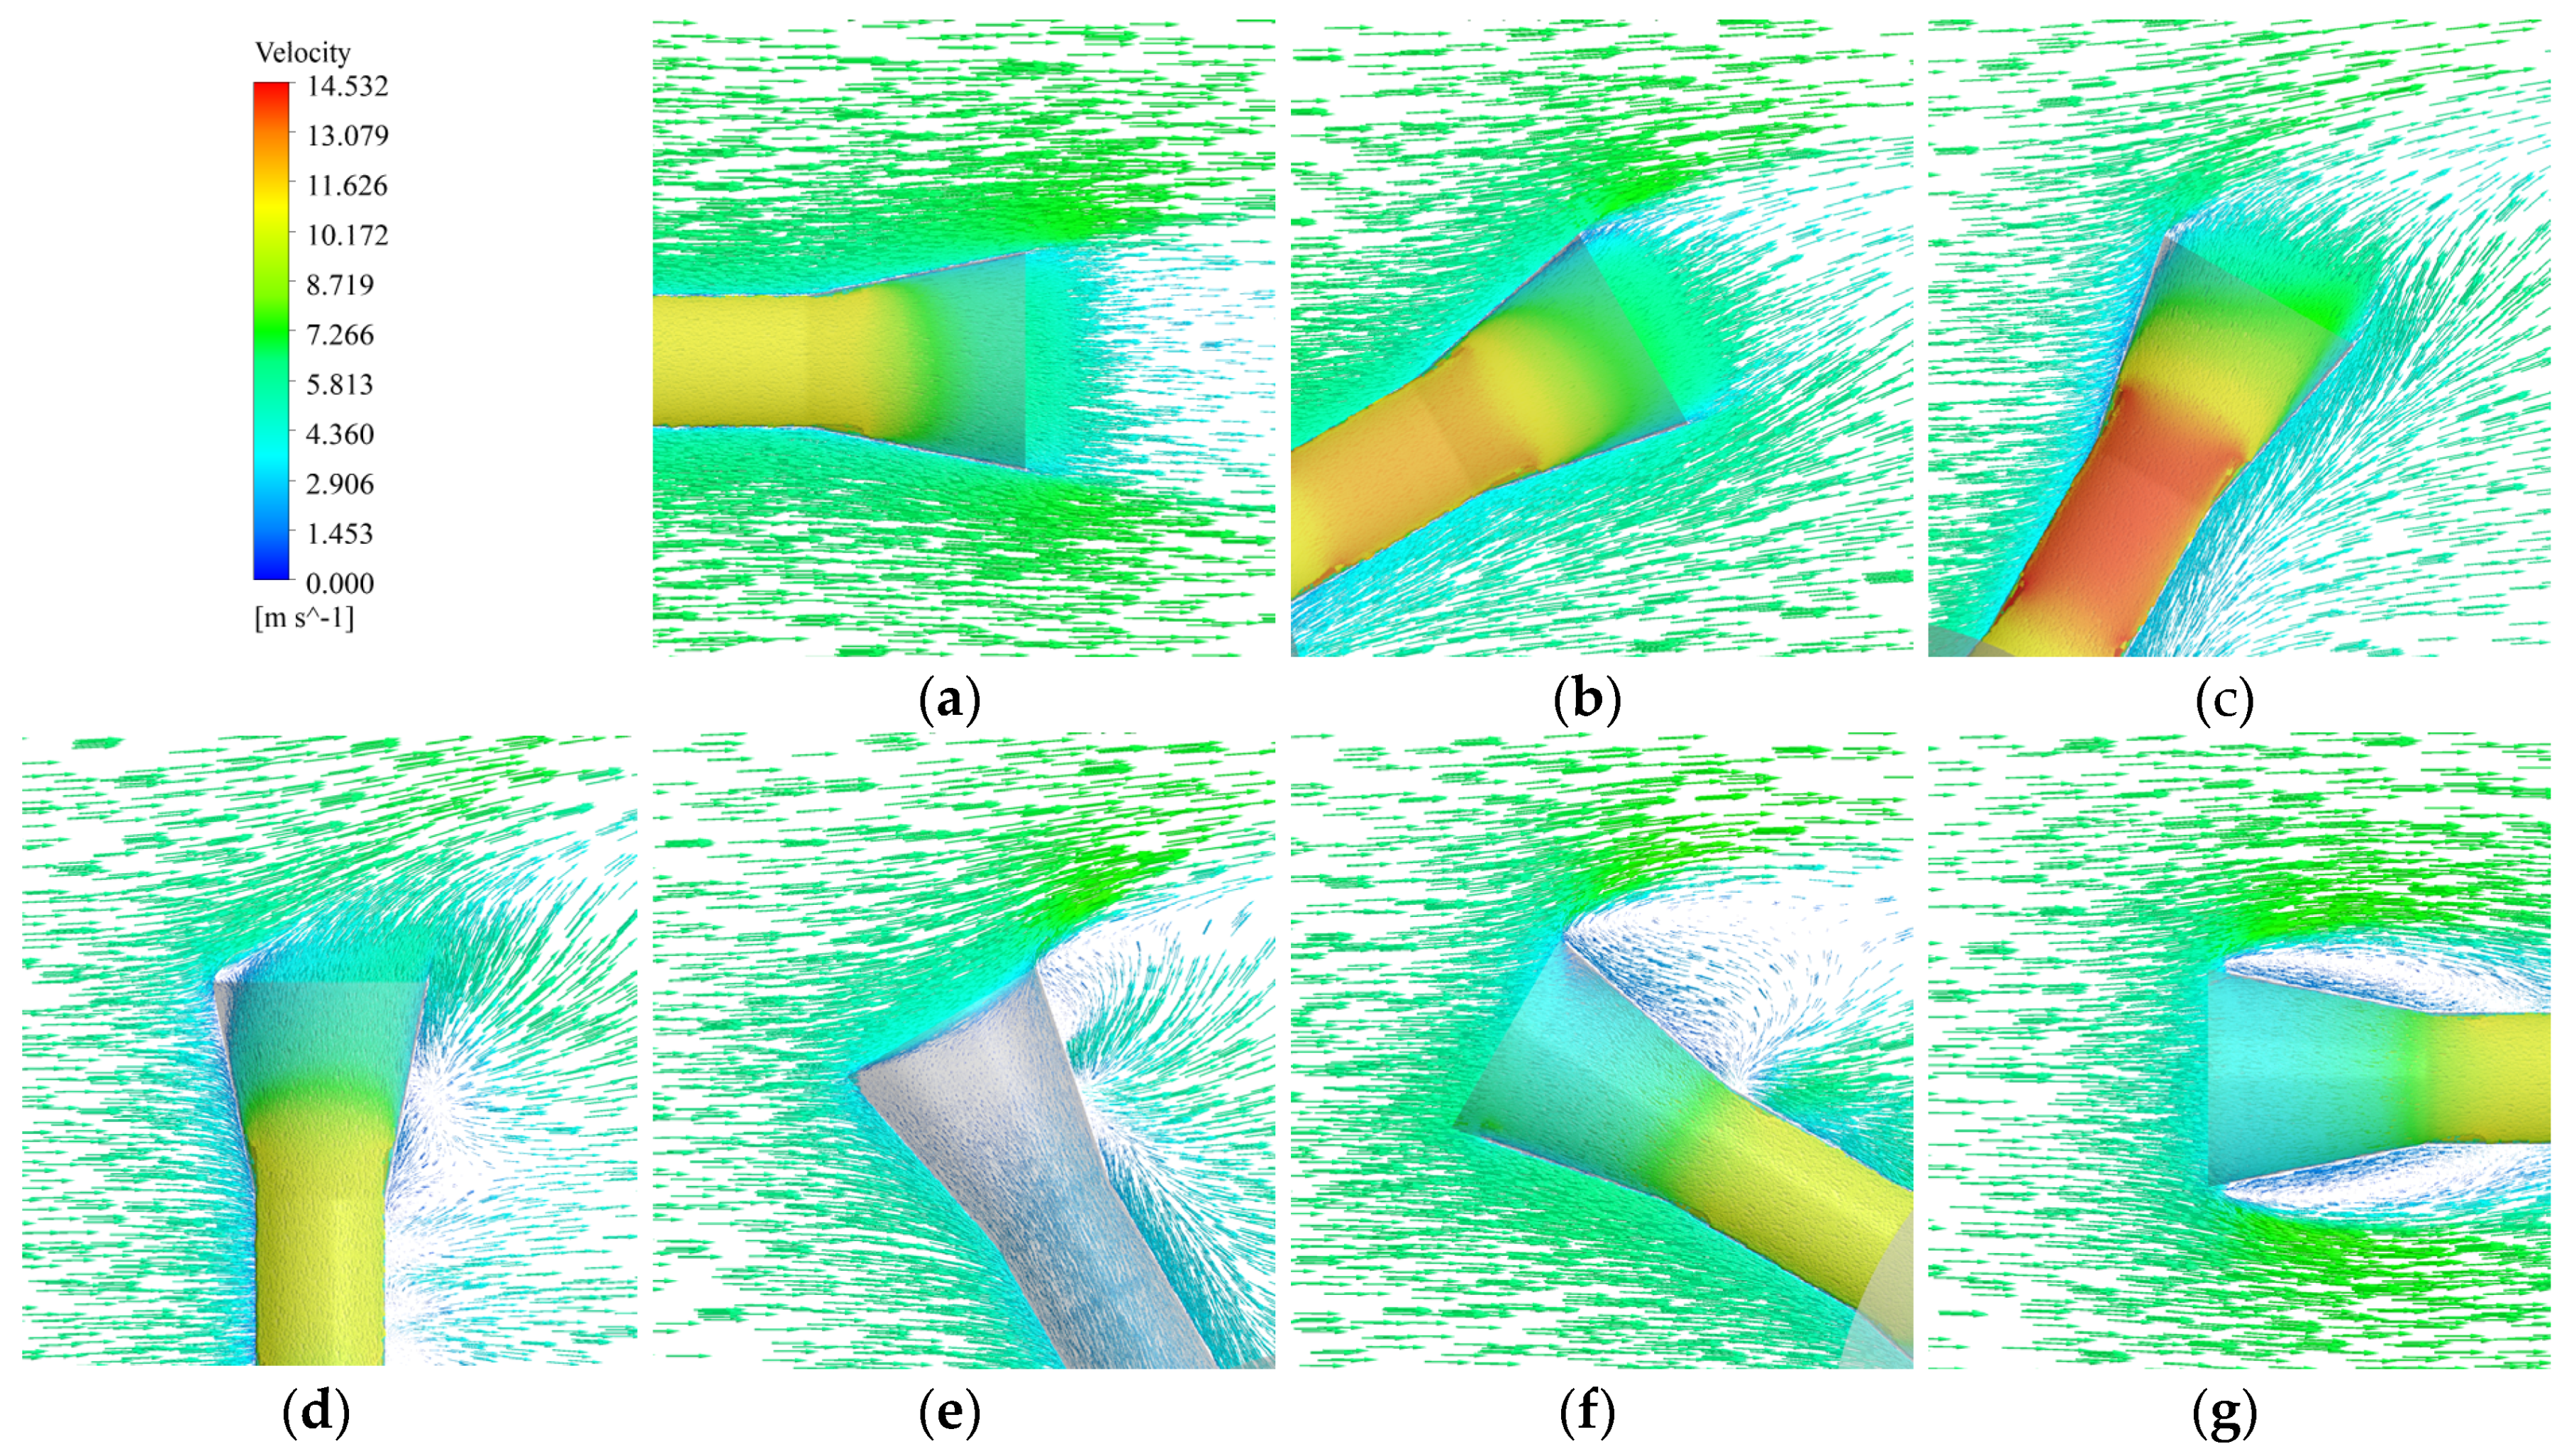
4.2. Performance of Improved Design

The improved models are analyzed and compared with the original model, the incoming flow condition is uniform flow, and the wind speed is 6.7 m/s. Considering that both Model 1 and Model 2 are symmetric models, only a range of 0–45° is needed to simulate them. The average speed ratio of Model 0, Model 1 and Model 2 with different wind directions is shown in Figure 12. As previously analyzed, since the outlet plane of Model 1 is parallel to the incoming flow, the average speed ratio of Model 1 is basically the same as that of Model 0 when θ = 90°. Figure 13 shows the streamlines of the Venturi tube when θ = 90° in Model 0 and 0° in Model 1. At this point, the positions of the baffles at the inlet of the system and the exits relative to the airflow in the two models are the same. The streamlines are almost identical in both cases at the Invelox system exit and in the Venturi tube, so the average SR of the two cases are basically the same.
Model 1 greatly improves the performance of the Invelox system when θ is greater than 90°, because the system exit never faces the incoming flow. However, although the overall performance of the system has improved, Model 1 is not as good as Model 0 in the case of small included angles, and this has led to Model 2. Because the outlet normal direction of Model 1 is always perpendicular to the incoming flow, no matter how the wind direction changes, the external air flow will always form an airflow cover at the exit of the system, blocking the flow of internal air, thus reducing the aerodynamic performance of the system. Thanks to the protection of the windshield for airflow at the exit, the performance of Model 2 is significantly better than that of the Model 1. Figure 14 and Figure 15 show the comparisons of the flow field without and with the windshield.
As can be seen from Figure 14 and Figure 15, the windshield plays a good role in protecting the airflow at the outlet of the system from the interference of the airflow from the external environment. Due to the existence of the windshield, there is a flow separation vortex inside the windshield. Under the guidance of the vortex, the external airflow changes from the original horizontal movement to vertical movement, with the same movement direction as the internal airflow. The airflow from the Venturi can be mixed with the airflow inside the windshield under the protection of the windshield and then discharged into the atmosphere. At this point, the effect of the external flow on the internal flow is no longer an obstacle, but a gain. The average speed ratio increased from 1.50 to 2.13, that is an increase of about 42%. If only the range of 0–90° is considered, the improvement of Model 2 is about 19.2% compared with Model 0.

4.3. Incoming Velocity Considering Atmospheric Boundary Layer

As mentioned above, wind power systems eventually need to be placed in the atmosphere to make sense. There is almost no uniform wind in the atmosphere, so it is of practical significance to consider the atmospheric boundary layer. A total of three wind profiles were considered, and the wind profile indexes were 0.1, 0.2 and 0.3, respectively. Different wind profile indexes represent different geomorphic features, small values represent flat suburban areas, and large values represent densely urban areas. The entry heights of Model 1 and Model 2 are consistent with Model 0. Since the distribution of wind velocity along the height is non-uniform after considering the atmospheric boundary layer, the incoming wind velocity in the SR definition is set as the wind velocity at the height of the center of the Invelox system entry.
Figure 16 shows the variation of the speed ratio of Model 0, Model 1 and Model 2 to the wind direction under different incoming wind profiles. With the increase of the wind profile index, the aerodynamic performance of the original Invelox model and its improved configuration decreased to different degrees. The stronger the performance, the greater the degradation. This is mainly due to the different environmental wind velocity near the system exit. Under different working conditions, the average incoming wind velocities at the inlet of the system are similar, but the environmental wind velocities at the exit are greatly different, as shown in Figure 17.
For Model 0, when θ is equal to 0°, the external air has less interference with the flow from the Venturi tube. With the increase of θ, the external air flow is accelerated due to the expansion of the system outlet, and has a certain suction effect on the internal air flow. When θ reaches 90°, the gain effect of the external flow disappears and is replaced by the blocking effect. The external air instead forms a wall of air to prevent the internal air flow from flowing out, so that the speed ratio of the system drops significantly. When θ exceeds 120°, the initial counterflow occurs in the Venturi tube, so the stronger the external flow near the outlet, the more obvious the counterflow. Under the condition of uniform inflow, the wind speed at the outlet height of the system is 6.7 m/s, and when the wind profile index is equal to 0.1, 0.2 and 0.3, the corresponding wind speed at the outlet height of the system is 6.2, 5.7 and 5.2 m/s, respectively. Therefore, when considering the effect of the atmospheric boundary layer, the speed ratio of the system is smaller than that of the uniform inflow. With the increase in the wind profile index, the performance will be further weakened. When the wind profile index is equal to 0.1, 0.2 and 0.3, the speed ratio decreases by an average of 7.07, 9.14 and 10.73% compared with the uniform inflow if the angle is only considered within the range of 0 to 90°.
For Model 1, because its flow field characteristics are similar to that of Model 0 when θ is equal to 90°, the aerodynamic performance variation characteristics of Model 1 under different wind profiles are similar to that of Model 0 when θ is 90°. It can be seen from the figure that the speed ratio of Model 1 is less affected by the incoming wind distribution. The average speed ratio decreases by 6.74, 5.85 and 5.05% compared with the uniform inflow. Since the external air flow at the outlet of Model 1 mainly obstructs the internal air flow, the larger the wind profile index is, the lower the velocity of the external air flow at the outlet will be, the smaller the obstruction effect will be and the speed ratio will be improved.
For Model 2, the external airflow at the system exit has a good gain effect on the overall performance after installing the windshield. Therefore, when the external velocity at the exit changes, the overall performance of the system degrades significantly. The average speed ratio decreases by 13.48, 18.13 and 21.71% compared with the uniform inflow. Even so, Model 2 performs better than Model 0 and Model 1. When the wind profile index is equal to 0.3, the improvement of Model 2 is about 4.57% and 17.08% compared with Model 0 and Model 1.
By changing the outlet direction of the Invelox system and optimizing the flow field near the outlet, the aerodynamic performance of the machine has been greatly improved. Furthermore, when the Venturi tube is placed vertically, the wind turbine rotates in the direction of gravity, which will relieve the alternating stress caused by gravity during the rotation of the blade. Therefore, the improved Invelox wind turbine system has a certain application value.

5. Conclusions

The aerodynamic characteristics of the Invelox system were studied through numerical simulation. The flow passes through the Invelox system from the top to the bottom through funnels and pipes and the wind energy is extracted. When the airflow accelerates in the Venturi tube, it pushes the wind turbine to do work to generate electricity. However, because the Venturi tube is arranged horizontally, the system outlet may be affected by incoming flow. When the angle between the incoming flow and the Venturi tube axis exceeds 90°, the speed ratio of the system begins to deteriorate. When the included angle exceeds 120°, the incoming flow flows backward into the system from the outlet, and the system can no longer operate normally.
In order to improve the inverted irrigation of the Invelox system, a new design is proposed, which consists of placing the Venturi tube vertically under the funnel. This design can capture wind energy from any direction. On this basis, the annular windshield is installed near the exit to improve the aerodynamic performance. According to the results, the average speed ratio increased by about 42% after installing the windshield, which is higher than the original Invelox system. The improved design can maintain the wind direction independence, being able to provide a high-speed ratio under any wind conditions.
The influence of the atmospheric boundary layer wind profile velocity distribution on the Invelox system is also studied. The results show that the overall performance of the system is smaller than that of the uniform inflow after considering the non-uniform velocity inlet. The system outlet is greatly affected by wind speed. The flow field characteristics at the exit of the system have great influence on the system. If the external air flow at the exit dredges and accelerates the internal air flow, the lower the environmental wind speed at the exit is, the smaller the system speed ratio is. On the contrary, if the external air flow obstructs the internal air flow, the lower the environmental wind speed at the exit, the greater the system speed ratio. This presents a very interesting feature.
In addition, the original Invelox system has a horizontal rotating axis due to the Venturi being laid out horizontally. In the process of wind turbine rotation, the blades will bear alternating loads under the influence of gravity, which puts forward a test for the fatigue performance of the blades. In the improved system, since the axis of the Venturi is consistent with the direction of gravity, the blades will not bear alternating loads.

Author Contributions

Both authors carried out data analysis, discussed the results and contributed to writing the paper. Both authors have read and agreed to the published version of the manuscript.

Funding

This work was supported by the National Natural Science Foundation of China (Grant No. 11872212, 41873016), Natural Science Foundation of Jiangsu Province (Grant No. BK20190386), Science and Technology of China ENERGY (Grant No. GJNY-20-110) and is a project funded by the Priority Academic Program Development of Jiangsu Higher Education Institutions.

Conflicts of Interest

The authors declare no conflict of interest.

References

  1. Amiri, H.A.; Shafaghat, R.; Alamian, R.; Taheri, S.M.; Shadloo, M.S. Study of horizontal axis tidal turbine performance and investigation on the optimum fixed pitch angle using CFD: A case study of Iran. Int. J. Numer. Methods Heat Fluid Flow 2019, 30, 206–227. [Google Scholar] [CrossRef]
  2. Abdelmalek, Z.; Alamian, R.; Shadloo, M.S.; Maleki, A.; Karimipour, A. Numerical study on the performance of a homogeneous charge compression ignition engine fueled with different blends of biodiesel. J. Therm. Anal. Calorim. 2020, 1–11. [Google Scholar] [CrossRef]
  3. Zhang, L.; Gao, J. Exploring the effects of international tourism on China’s economic growth, energy consumption and environmental pollution: Evidence from a regional panel analysis. Renew. Sustain. Energy Rev. 2016, 53, 225–234. [Google Scholar] [CrossRef]
  4. Katircioglu, S.T. International tourism, energy consumption, and environmental pollution: The case of Turkey. Renew. Sustain. Energy Rev. 2014, 36, 180–187. [Google Scholar] [CrossRef]
  5. Henriques, R.D.S.; Saldanha, R.R.; Coelho, L.M.G. An Air Pollutant Emission Analysis of Brazilian Electricity Production Projections and Other Countries. Energies 2019, 12, 2851. [Google Scholar] [CrossRef] [Green Version]
  6. Keramydas, C.; Papadopoulos, G.; Ntziachristos, L.; Lo, T.-S.; Ng, K.-L.; Wong, H.-L.A.; Wong, C.K.-L. Real-World Measurement of Hybrid Buses’ Fuel Consumption and Pollutant Emissions in a Metropolitan Urban Road Network. Energies 2018, 11, 2569. [Google Scholar] [CrossRef] [Green Version]
  7. Blaha, U.; Sapkota, B.; Appel, E.; Stanjek, H.; Rößler, W. Micro-scale grain-size analysis and magnetic properties of coal-fired power plant fly ash and its relevance for environmental magnetic pollution studies. Atmos. Environ. 2008, 42, 8359–8370. [Google Scholar] [CrossRef]
  8. Yang, S.; Yuesi, W.; Changchun, Z. Measurement of the vertical profile of atmospheric SO2 during the heating period in Beijing on days of high air pollution. Atmos. Environ. 2009, 43, 468–472. [Google Scholar] [CrossRef]
  9. Kusiak, A.; Zhang, Z.; Verma, A. Prediction, operations, and condition monitoring in wind energy. Energy 2013, 60, 1–12. [Google Scholar] [CrossRef]
  10. Willis, D.; Niezrecki, C.; Kuchma, D.; Hines, E.; Arwade, S.; Barthelmie, R.; DiPaola, M.; Drane, P.; Hansen, C.; Inalpolat, M.; et al. Wind energy research: State-of-the-art and future research directions. Renew. Energy 2018, 125, 133–154. [Google Scholar] [CrossRef]
  11. Dai, K.; Bergot, A.; Liang, C.; Xiang, W.-N.; Huang, Z. Environmental issues associated with wind energy—A review. Renew. Energy 2015, 75, 911–921. [Google Scholar] [CrossRef]
  12. Sun, X.; Huang, D.; Wu, G. The current state of offshore wind energy technology development. Energy 2012, 41, 298–312. [Google Scholar] [CrossRef]
  13. Omer, A. Overview of renewable energy sources in the Republic of the Sudan. Energy 2002, 27, 523–547. [Google Scholar] [CrossRef]
  14. O’Brien, J.; Young, T.; O’Mahoney, D.; Griffin, P. Horizontal axis wind turbine research: A review of commercial CFD, FE codes and experimental practices. Prog. Aerosp. Sci. 2017, 92, 1–24. [Google Scholar] [CrossRef]
  15. Bai, C.-J.; Wang, W.-C. Review of computational and experimental approaches to analysis of aerodynamic performance in horizontal-axis wind turbines (HAWTs). Renew. Sustain. Energy Rev. 2016, 63, 506–519. [Google Scholar] [CrossRef]
  16. Ahmed, N.A.; Cameron, M. The challenges and possible solutions of horizontal axis wind turbines as a clean energy solution for the future. Renew. Sustain. Energy Rev. 2014, 38, 439–460. [Google Scholar] [CrossRef]
  17. Möllerström, E.; Gipe, P.; Beurskens, J.; Ottermo, F. A historical review of vertical axis wind turbines rated 100 kW and above. Renew. Sustain. Energy Rev. 2019, 105, 1–13. [Google Scholar] [CrossRef]
  18. Kumar, R.; Raahemifar, K.; Fung, A.S. A critical review of vertical axis wind turbines for urban applications. Renew. Sustain. Energy Rev. 2018, 89, 281–291. [Google Scholar] [CrossRef]
  19. Sagharichi, A.; Zamani, M.; Ghasemi, A. Effect of solidity on the performance of variable-pitch vertical axis wind turbine. Energy 2018, 161, 753–775. [Google Scholar] [CrossRef]
  20. Allaei, D.; Andreopoulos, Y. INVELOX: Description of a new concept in wind power and its performance evaluation. Energy 2014, 69, 336–344. [Google Scholar] [CrossRef] [Green Version]
  21. Allaei, D.; Tarnowski, D.; Andreopoulos, Y. INVELOX with multiple wind turbine generator systems. Energy 2015, 93, 1030–1040. [Google Scholar] [CrossRef]
  22. Sotoudeh, F.; Kamali, R.; Mousavi, S.M. Field tests and numerical modeling of INVELOX wind turbine application in low wind speed region. Energy 2019, 181, 745–759. [Google Scholar] [CrossRef]
  23. Anbarsooz, M.; Amiri, M.; Rashidi, I. A novel curtain design to enhance the aerodynamic performance of Invelox: A steady-RANS numerical simulation. Energy 2019, 168, 207–221. [Google Scholar] [CrossRef]
  24. Ducoin, A.; Shadloo, M.S.; Roy, S. Direct Numerical Simulation of flow instabilities over Savonius style wind turbine blades. Renew. Energy 2017, 105, 374–385. [Google Scholar] [CrossRef] [Green Version]
  25. ANSYS Software Corporation, ANSYS Fluent Theory Guide 15.0; ANSYS: Canonsburg, PA, USA, 2013.
  26. Tominaga, Y.; Mochida, A.; Yoshie, R.; Kataoka, H.; Nozu, T.; Yoshikawa, M.; Shirasawa, T. AIJ guidelines for practical applications of CFD to pedestrian wind environment around buildings. J. Wind Eng. Ind. Aerodyn. 2008, 96, 1749–1761. [Google Scholar] [CrossRef]
  27. Roache, P.J. Perspective: A Method for Uniform Reporting of Grid Refinement Studies. J. Fluids Eng. 1994, 116, 405–413. [Google Scholar] [CrossRef]
Figure 1. Schematic diagram of the Invelox wind turbine system.
Applsci 10 07438 g001
Figure 2. Dimensions of the Invelox wind turbine system.
Applsci 10 07438 g002
Figure 3. Improved design of the Invelox system.
Applsci 10 07438 g003
Figure 4. Computational mesh of the Invelox wind turbine system.
Applsci 10 07438 g004
Figure 5. Computational domain and boundary conditions.
Applsci 10 07438 g005
Figure 6. Grid study and validation of the numerical results.
Applsci 10 07438 g006
Figure 7. Velocity variations on a line at the Venturi section for three mesh resolutions.
Applsci 10 07438 g007
Figure 8. The effects of wind direction on the speed ratio of the original model.
Applsci 10 07438 g008
Figure 9. Streamlines of the Invelox under different incoming wind directions: (a) θ = 0°, (b) θ = 30°, (c) θ = 60°, (d) θ = 90°, (e) θ = 120°, (f) θ = 150° and (g) θ = 180°.
Applsci 10 07438 g009
Figure 10. Velocity vector at the exit of the original Invelox model under different incoming wind directions; (a) θ = 0°, (b) θ = 30°, (c) θ = 60°, (d) θ = 90°, (e) θ = 120°, (f) θ = 150° and (g) θ = 180°.
Applsci 10 07438 g010
Figure 11. The total pressure contours in the symmetric plane of original Invelox system; (a) θ = 0° and (b) θ = 180°.
Applsci 10 07438 g011
Figure 12. The speed ratio of different configurations under different wind directions.
Applsci 10 07438 g012
Figure 13. The streamlines through the Venturi tube; (a) θ = 90° in Model 0 and (b) θ = 0° in Model 1.
Applsci 10 07438 g013
Figure 14. Comparison of velocity distribution in vertical plane; (a) Model 1 and (b) Model 2.
Applsci 10 07438 g014
Figure 15. Comparison of vectors near the Invelox system exit; (a) Model 1 and (b) Model 2.
Applsci 10 07438 g015
Figure 16. The comparison of speed ratios of different models under different wind directions with different wind profile indexes.
Applsci 10 07438 g016
Figure 17. Distribution of incoming wind velocity corresponding to different wind profile indexes.
Applsci 10 07438 g017
Table 1. Independence study.
MeshCoarseMediumFine
Average velocity in the Venturi tube, φ, m/s10.51810.31710.286
Cell number, N, million2.863.796.97
Relative error, δ-0.0190.003
Grid refinement ratio, r-1.101.23
Order of convergence, e-20-
GCI, %-0.36%0.01%
Publisher’s Note: MDPI stays neutral with regard to jurisdictional claims in published maps and institutional affiliations.

