Abstract
The appropriate acoustic insulation project of building façades is of importance for the design of highly comfortable living environments. In some countries, national regulations require maximum noise levels inside rooms, or minimum sound insulation limits, to be respected. The acoustic insulation design of a façade is usually performed according to the ISO 12354-3 standard, which presents a calculation method based on the geometry of the room, the shape of the façade, the areas and the acoustic performances of the individual elements. The prescribed limits must be experimentally verified according to methods derived from international standards. However, the current versions of such standards do not provide details on how to perform the measurements and the calculation of the sound insulation for corner rooms. An important remark is that, depending on the position of the sound source used for the measurements, different results of the standardized sound insulation are obtained. This article proposes a new method for calculating the façade insulation of corner rooms by introducing the acoustic attenuation due to the diffraction of the corner and the distance of the sound source from the façades, estimated through simulations and experimentally validated.
1. Introduction
The ability of a building façade to ensure appropriate sound insulation is of paramount importance when a high level of comfort is required in environments that are supposed to be as quiet as possible. This demands an accurate design, especially for buildings located in the close vicinity of transport infrastructure, industrial sites or commercial activities [1,2].
To protect people’s health, some national regulations, such as the Italian DPCM 05/12/97 [3], require a minimum acoustic insulation performance to be achieved for façades. Such performances must be experimentally verified according to ISO 16283-3 [4]. In other countries such as, for example, Denmark, Finland, Iceland, Norway and Sweden, a maximum indoor noise level must not be exceeded [5]. In this case, the prediction of the indoor sound pressure level depends on the acoustic insulation of the façade and on the characteristics of the noise source.
Several studies have been published in the last few years on the correlation between indoor comfort and façade sound insulation. In [6], Casini et al. showed a method based on a statistical approach to define the sound insulation of façades required to achieve indoor comfort. In the same paper, a ranking of the most common acoustic insulations attainable for the façades of existing buildings is specified. Ryu et al. [7] proved that the sound insulation of a building façade influenced indoor annoyance due to transportation noise and the frequency content of intrusive noise. In [8] Chetoni et al. reported information about the acoustic environment in schools considering the façade acoustic insulation as a key element for reaching a good level of indoor comfort.
Sound insulation performances of façades are influenced not only by the characteristics of their elements, but also by their shape, as pointed out by Busa et al. [9], who showed a significant effect of façade shape on the propagation of outdoor sound pressure levels. Calleri et al. [10] studied the influence of the façade layout on the acoustic characteristics of an urban space and on the subjective spatial perception of the users. Barbaro et al. [11] studied the influence of the façade architecture on indoor acoustic quality. Yu et al. [12] investigated the effect of sound scattering due to the façade shape on the sound propagation in urban canyons. Regarding other possible elements influencing the sound insulation properties of the façade, Fausti et al. [13] used a bi-dimensional pressure acoustics finite element model of a shading device to analyze the effects on indoor and outdoor acoustic environments.
The performances of walls are usually determined by laboratory tests. When the sound insulation performances are not known, it is always possible to apply prediction methods (see, for instance, Caniato [14], who proposed a combined simulation approach using the Transfer Matrix Method and a 3D acoustic model to find the sound insulation of curtain walls). However, the acoustic performance of a façade is also determined by the junctions between the elements. Secchi et al. [15] analyzed the structural direct and flanking transmissions with reference to the joints connecting the mullion of the curtain wall with the surrounding lightweight plasterboard partitions.
As concerns the experimental methods, Leung et al. [16] tested different combinations of noise reduction methods as a function of the noise angles of incidence on an experimental setup featuring a window, in order to simulate the contribution due to different sections of a road. Berardi [17] found some low-frequency range limitations in the methods proposed by different standards to assess the sound insulation of a façade.
In terms of measurement uncertainty, Scrosati et al. [18] observed that the in situ reproducibility standard deviation of façade measurements is not adequately reflected in the ISO 12999-1 standard [19]. In particular, the values given by the standard underestimate the uncertainty of in situ measurements. In a second study, Scrosati et al. [20] showed that, at high frequency, the high uncertainties found, which influence the weighted indices, depend on the sound source directivity and position.
The design of the sound insulation performances of a building is usually carried out according to the ISO 12354-3 standard [21]. This standard describes a calculation model to estimate the acoustic performances of buildings starting from the performances of single elements (airborne sound insulation against outdoor sound). A problem that is often encountered during the acoustic design stage of façades is correctly evaluating corner rooms. The difficulty originates from the fact that this specific case is not considered in the ISO 12354-3 calculation procedures.
This work aims to study the façade acoustic insulation of corner rooms. A method for the calculation of the acoustic insulation of the entire façade of a corner room exposed to noise is proposed. The evaluation is made considering the attenuation due to the corner of the building and the attenuation due to the different distances between the sound source and the centers of the individual walls composing the façade. This type of attenuation is indicated with the here introduced symbol ΔDFL (where F indicates the façade side and L the loudspeaker position). ΔDFL is the difference between the average sound pressure level on the side of the facade exposed directly to noise and the average sound pressure level on the side indirectly exposed to noise.
The article is organized as follows. Section 2 summarizes the existing measurement methods for the acoustic design of faҫades. In Section 3, new formulas for determining façade insulation performances of corner rooms for the different possible source arrangements are presented. In Section 4, the results of simulations performed with different positions of the source, also considering the attenuation due to the building corner, are reported. Experimental measurements and a comparison with the predictions, carried out using the proposed method, are reported in Section 5. Conclusions are drawn in Section 6.
2. Methods
2.1. Experimental Evaluation of the Façade Sound Insulation According to ISO 16283-3
Façade sound insulation measurements are usually carried out according to the ISO 16283-3 standard. The evaluation can be performed either on individual façade elements or on the entire façade. Depending on the purpose of the measurement, different types of noise sources can be used (road/railway/aircraft traffic or loudspeaker).
To have better control of the sound source position, this article focuses on the estimation of the façade global acoustic insulation with the loudspeaker method. The use of the loudspeaker method is necessary when façades with high acoustic performances are to be evaluated, when the real source (traffic, railway and aircraft) does not have sufficient energy for a correct evaluation or when higher repeatability of the results is required. When applied to the global façade, this method makes it possible to assess the sound reduction relative to a position that is 2 m away from the façade. In situ loudspeaker measurements according to ISO 16283-3 are carried out by positioning the noise source outdoors, the sound wave being then directed towards the center of the façade. The angle between the normal to the façade and the impinging sound wave must be 45° ± 5°. The minimum distance, D, between the façade and the loudspeaker must be at least 5 m. The loudspeaker should preferably be placed on the ground. The directivity of the loudspeakers must be approximately uniform, meaning that omnidirectional radiation is needed (Annex C—ISO 16283-3).
The standardized level difference Dls,2m,nT is computed as the difference between the outdoor sound pressure level measured at 2 m in front of the center of the façade (L1,2m) and the space average of the sound pressure level in the receiving room (L2), corrected by a factor accounting for the reverberation time of the room (T):
where T0 = 0.5 s is the reference reverberation time for dwellings. The outside microphone must be placed 1.5 m above the floor of the receiving room. The weighted standardized level difference, Dls,2m,nT,w, is then calculated according to the ISO 717-1 standard [22].
When different positions of the sound source are used, for example when assessing the acoustic insulation of a corner room, the combined result must be calculated according to the following formula:
where n is the number of source positions and Di is the level difference for each source-receiver combination.
In the case of façades with two or more sides exposed to noise, the ISO 16283-3 standard does not detail in which positions the loudspeaker should be placed. However, in this case, two different measurements on the façade are required. Figure 1 shows four possible positioning combinations of the source for a corner room placed on the ground floor of a building.
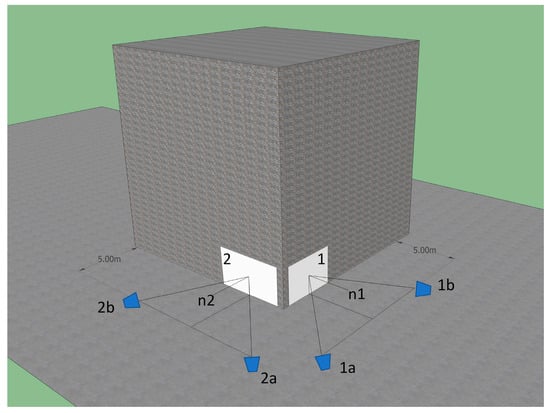
Figure 1.
Example of a corner room with two walls. Different combinations of loudspeaker positions: (a) 1a–2a; (b) 1a–2b; (c) 1b–2a; (d) 1b–2b.
Considering the example in Figure 1, the following four combinations of a source positioned on the ground at a distance of 5 m from the façade can be considered: (a) 1a–2a; (b) 1a–2b; (c) 1b–2a; (d) 1b–2b. Case “a” is expected to lead to the lowest measured value of Dls,2m,nT,w as in the considered positions the source is in direct view of both sides of the façade. On the other hand, case “d” will presumably lead to the highest measured value of the façade acoustic insulation because of the shielding effect of the building corner. Of course, if the final goal is the acoustic protection of the occupants, it is necessary to quantify the above-mentioned differences and, if possible, to provide the most representative value of the façade sound insulation. For a correct interpretation of the façade sound insulation performances, the test report must state which source positions has been chosen during the measurements.
2.2. Design of the Façade Acoustic Insulation According to ISO 12354-3
The standardized level difference of a façade depends on the apparent sound reduction index as seen from inside the room, on the influence of the outside shape of the façade due to the presence of balconies and on the room dimensions. The standardized level difference can be predicted according to the Formula (3).
where R′ is the apparent sound reduction index of the façade for diffuse incident sound, ΔLfs is the level difference due to façade shape, Csab = 0.16 is the Sabine constant, V is the volume of the receiving room, T0 is the reference reverberation time (0.5 s) and S is the total area of the façade as seen from the inside. The apparent sound reduction index R′ can be calculated as:
where τe,i is the transmission coefficient of the façade element i due to the direct transmission of the incident sound on this element, relative to the sound power incident on the total façade, τf is the transmission coefficient of a façade or flanking element f due to flanking transmission, relative to the sound power incident on the total façade, n is the number of façade elements for direct transmission, and m is the number of flanking façade elements.
For small technical elements (e.g., air intakes, shutter boxes) the transmission coefficient can be computed as:
where Dn,e,i is the normalized sound pressure level difference for the i-th small element.
For other elements (e.g., walls, roof, windows) the transmission coefficient can be computed according to:
where Ri is the sound reduction index of the i-th element and, Si is its area.
The ISO 12354-3 standard specifies that, in cases of rigid elements, flanking transmission can be incorporated reducing the sound reduction index by 2 dB. The standard points out that, if the façade is not flat, the total area must be obtained as the sum of the areas of all the elements composing the façade as seen from the inside, provided that the sound impinges homogeneously on all of its portions. If this requirement cannot be fulfilled, each part of the façade subject to a homogeneous incident sound field should be considered separately in the computations. If the different parts of the total façade are subject to different sound pressure levels, as in the case of a corner room, it is possible to consider these parts separately. The model can also be used to directly calculate the weighted standardized level difference, D2m,nT,w, based on the single number ratings of the elements involved.
If separate calculations for the two sides of the façade and the logarithmic average (2) are carried out without considering the contribution of noise from other parts of the façade, some evaluation errors can be expected. On the other hand it should be noted that, in the case of in situ measurements, it is correct to use the logarithmic average given by (2) because such measurements are already taking into account the amount of noise coming from the portion of the façade which is not directly hit by the sound wave.
3. Evaluation Method of the Façade Acoustic Insulation for a Corner Room
3.1. Calculation of the Façade Acoustic Insulation of a Corner Room with Two Walls
As previously mentioned, a “direct” logarithmic average can lead to evaluation errors. To prove this statement, let us consider the façade of a corner room having two sides exposed to the sound field. Assuming that the insulation characteristics of the two sides are identical, a direct logarithmic average would return an overall insulation equal to each side’s insulation. This result is misleading, since the increase in the façade surface should lead to a lower sound insulation value. To obtain a more accurate evaluation, it is proposed here that the logarithmic average be performed after calculating the façade insulation of the single portions so as to take into account the contribution of the noise through the façade that is not directly hit by the sound wave.
In the case of a corner room having two walls exposed to the sound field (Figure 1), the overall standardized level difference D2m,nT can therefore be evaluated with the following formulas:
where:
- -
- D2m,nT1 is the façade acoustic insulation with the loudspeaker in position 1;
- -
- D2m,nT11 is the façade acoustic insulation of side 1 with the loudspeaker in position 1;
- -
- D2m,nT22 is the façade acoustic insulation of side 2 with the loudspeaker in position 2;
- -
- ΔD21 is the attenuation due to the corner diffraction for side 2 when the loudspeaker is in position 1 (taking also into account the difference in source-façade distance);
- -
- D2m,nT2 is the façade acoustic insulation with the loudspeaker in position 2;
- -
- ΔD12 is the attenuation due to the diffraction of the corner for side 1 when the loudspeaker is in position 2 (taking also into account the difference in source-façade distance);
- -
- D2m,nT is the overall standardized level difference.
It is worth noting that the same formulas can also be applied to weighted standardized level differences.
3.2. Calculation of the Façade Acoustic Insulation of a Corner Room with a Roof
A particular case is presented by the façade of a room featuring a roof. The façade insulation design of rooms involving a roof is not easy to generalize due to several variables. In this case, the façade insulation depends not only on the geometry of the room and on the height of the floor, but also on the inclination and the shape of the roof. This section reports a simplified case of façade attenuation consisting of one wall and a two-pitched roof (Figure 2a) or two walls and a four-pitched square roof (Figure 2b). The loudspeaker is placed on the ground so that only the walls are directly hit by the sound wave. Another option would be to place the loudspeaker high above the ground, but this solution is not often possible and should only be chosen in the case of noise sources that are mainly acting on the roof (for example, fly by of airplanes).
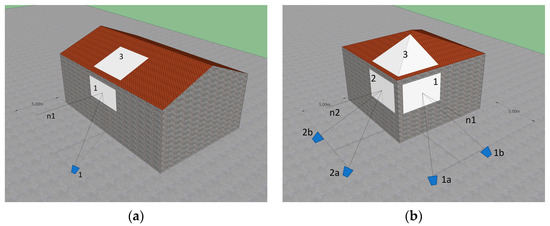
Figure 2.
Examples of a corner room located at the top floor of a building. (a) One wall and two-pitched roof; (b) two walls and four-pitched square roof.
In cases of corner rooms having one wall and a two-pitched roof (Figure 2a) or two walls and a four-pitched roof (Figure 2b) exposed to the noise coming from a sound source, the number of variables increases significantly. The following general formulas can be used (subscript 1 and 2 denote walls while subscript 3 is used for the roof):
where
- -
- D2m,nT33 is the façade acoustic insulation of the roof (side 3) without attenuation;
- -
- ΔD31 is the attenuation due to the diffraction of the edge of the roof (side 3) when the loudspeaker is in position 1;
- -
- ΔD32 is the attenuation due to the diffraction of the edge of the roof (side 3) when the loudspeaker is in position 2.
In the case of a corner room with one wall and a two-pitched roof, only Equation (10) is applicable, and it must be used without considering the second term of the sum inside the argument of the logarithm.
The different composed acoustic insulations D2m,nT can be calculated using (9). Finally, the weighted, standardized level difference, D2m,nT,w, can be calculated according to the ISO 717-1 standard. It is also possible to apply a simplified method considering only the single number insulation values of the different parts of the façade.
4. Results and Discussion
To quantify the acoustic attenuation in octave frequency bands, ΔDFL, due to the corner of a building, simulations were carried out using the software Ramsete®. This software is based on a pyramid tracing algorithm, and it uses the Kurze–Anderson [23] formulation for the calculation of the attenuation due to diffraction. An omnidirectional sound source having a sound power level of 110 dB distributed in the octave bands from 63 to 4000 Hz was used in the simulations. The center of the source was placed 0.25 m above the ground. The surfaces of the building and of the ground were assumed to be completely reflective.
To evaluate the attenuation due to corner diffraction and the effect of the source distance, the sound pressure level at 5 cm from the façade surface was evaluated through a set of simulations performed in the different cases. For the calculation of the attenuation, the space average of the sound pressure levels on the wall surface using a mesh of virtual receivers spaced 50 cm apart was considered.
4.1. Façade with Two Walls
A corner room with two walls having variable plan dimensions was considered in the simulations. The dimensions ranged from 3 m × 3 m to 6 m × 6 m in steps of one meter for both the sizes. The height of the rooms was the same for all the cases and was equal to 2.7 m. Other geometrical data include the thickness of the floor (0.30 m) and the thickness of the perimeter wall (0.50 m). The overall height of the building was 15 m.
Different elevations of the target points from the ground were considered. These elevations depend on the floor on which the simulations are carried out: ground (F0), first (F1), second (F2) and third (F3). The centers of the façades were placed at 1.35 m, 4.35 m, 7.35 m and 10.35 m from the ground. In the case of the second and third floor, the centers of the façades were more than 5 m above the ground and then, according to the standard ISO 16283-3, the sound source can be positioned in front of the façade center. In these cases, therefore, unshielded positions were not considered. As concerns the calculation of the attenuation due the building corners or due to the different source–façade distances, an overall number of 96 size/source position combinations were considered, as summarized in Table 1.

Table 1.
Position of the sound source and geometry of the analyzed rooms.
As an application of the adopted procedure, let us consider a ground floor room having dimensions X = 4 m and Y = 6 m (Figure 3). The first number indicates the size of the façade opposite to the sound source, the second number is the length of the façade closer to the sound source. For the case shown in Figure 3, the position of the loudspeaker is denoted by the letter A, which means it is placed 5 m away from the normal to the center of the façade.
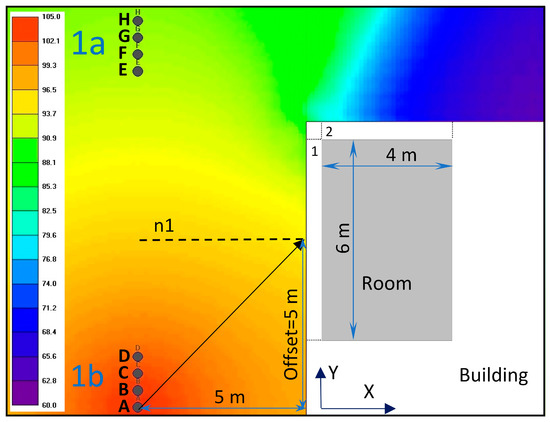
Figure 3.
Example of sound pressure levels map. Ground floor F0, source position A, room dimensions 4 m × 6 m—Plan view.
For the first floor, the offset with respect to the center of the façade is 2.8 m, while for the other floors the offset is zero.
Figure 4 shows the sound pressure level maps for the analyzed cases. It can be noted that, for the lower floors, the level difference between the two sides of the room is higher than in the case of the higher floors. It can be also observed that the sound pressure level decreases for higher floor due to the increasing distance between the loudspeaker and the façade. The effect due to the shielding of the corner and the not negligible attenuation due to the difference in distance between the source and the façade when the source is “in view” of both sides of the façade is clearly visible (see for example F0, position A and E in the sound pressure levels maps of Figure 4).
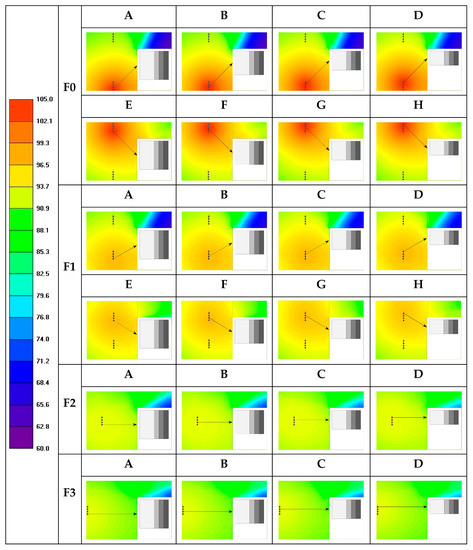
Figure 4.
Sound pressure level for different source positions: A–B–C–D (F0: ground floor; F1: floor 1; F2: floor 2; F3: floor 3); Source positions E–F–G–H (F0: ground floor; F1: floor 1).
The attenuation of the sound pressure levels of side 1 with loudspeakers at “2b” and “2a” can be obtained by symmetry.
Since in real cases it is uncommon to find a building completely isolated and far from other buildings, the presence of another building placed at 10 m from the façade was simulated with loudspeaker positions “1a” and “1b” (Figure 5). In this case, the simulations show a lower attenuation of the building corner due to the reflections of the additional building.
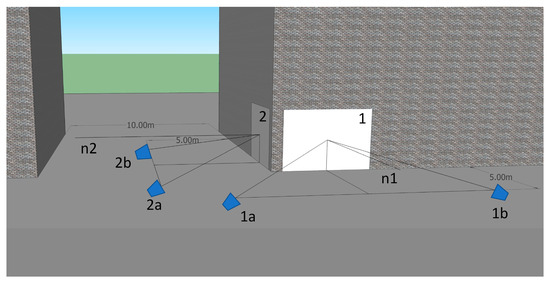
Figure 5.
Configuration of the sources in case of a building placed at 10 m from the building featuring the corner room. Example of the ground floor.
The values of the unweighted global attenuations ΔDFL for an isolated building and for a building with a reflecting surface placed at 10 m from the corner room are shown in Table 2.
Table 2.
Unweighted global attenuation range ΔDFL [dB] with isolated building (italic font) and with a reflecting surface at 10 m from a near building (bold font).
To obtain the attenuations ΔDFL relative to a certain configuration from Table 2, it is necessary to select the column corresponding to the dimension of the room. Such dimensions are expressed by a double pair of numbers. The first number indicates the dimension of the room in the plan, opposite to the loudspeaker position. The second number indicates the dimension of the room in the direction of the loudspeaker. For example, for an isolated building, the attenuation ΔDFL for a ground floor room having dimensions 6 m × 5 m is 22.4 dB when the loudspeaker is placed in position B and 1.9 dB when the loudspeaker is placed in position F. The attenuation values related to the intermediate dimensions of the room can be obtained by linear interpolation.
It can be observed that the maximum variation of the attenuation as a function of the width of the room is 2.0 dB. The contribution of a building located 10 m away can lead to a decrease in the attenuation of up to 7 dB in the case of a 6 m × 6 m room at the ground floor when it is opposite the edge of the building (position of the loudspeaker “1b” in Figure 5).
The minimum attenuations for positions A–B–C–D for floors F0, F1, F2 and F3 are 20.4 dB, 18.0 dB, 13.2 dB and 12.7 dB, respectively. In the case of a building placed 10 m from the façade, the minimum attenuations become 15.7 dB, 12.4 dB, 12.5 dB and 11.5 dB, respectively. The biggest differences can be observed for the ground and the first floors.
For positions “2a” and “2b” of Figure 5 it was verified, through simulations, that the attenuation is comparable to that of the case without a reflecting building at 10 m.
4.2. Façades with One Wall and a Roof
In case of rooms featuring a roof portion, the simulations were performed considering a room with a minimum internal height of 2 m, 40% roof slope and a flat façade without balconies. The center of the façade was considered at the center of the vertical wall and the loudspeaker was placed on the ground. In such conditions the walls are the only elements directly hit by the sound wave. The centers of the façades were considered at a height of 1, 4, 7 and 10 m. The overall average results for the room are summarized in Table 3.
Table 3.
Unweighted global attenuation range ΔD31 [dB].
It can be concluded that the width of the room does not substantially affect the attenuation values. Indeed, throughout the simulated cases the maximum variation in attenuation due to room size change has been found to be just 1.7 dB (F0, 3 × 3–6 × 3). The minimum attenuations relative to the roof for floors F0, F1, F2 and F3 are 10.5 dB, 16.7 dB, 16.3 dB and 15.4 dB, respectively.
4.3. Façades with Two Walls and a Roof
The façade attenuation for a room having two vertical walls and a four-pitched roof was also investigated. Rooms with plan dimensions ranging from 3 m × 3 m to 6 m × 6 m were considered. The center of the façades was considered at heights of 1, 4, 7 and 10 m. The overall average results are summarized in Table 4.
Table 4.
Unweighted global attenuation range ΔDFL [dB] of walls (italic font) and roof (bold font).
It is worth noting that the attenuations computed for the roof are similar in the different cases if the loudspeaker is positioned in such a way that it is “in view” of one or of two walls (only floor F0 and F1). The attenuations related to the walls are similar to the case with two walls for the ground and the first floor (see Table 2). The maximum variation of the attenuation due to the diffraction as a function of the width of the room is 1.7 dB for the walls and 2.3 for the roof. The minimum attenuations for positions A–B–C–D are 20.3 dB, 18.5 dB, 15.8 dB and 14.5 dB for floors F0, F1, F2 and F3 respectively. The minimum attenuations of the roof are 11.0 dB, 16.9 dB, 18.4 dB and 15.4 dB, respectively. These attenuations are larger if compared to the ones reported for the case of a two-pitched roof because the four-pitched roof has about half of the surface subject to a double diffraction.
Some results, expressed as one octave band attenuations due to the diffractions of the different items (corner, roof edge), are reported in Appendix A in the case of corner rooms and rooms featuring a rooftop. The values reported in the graphs can be used as a reference to estimate the attenuations of real cases.
5. Validation of the Proposed Method
To verify the proposed method, different measurements were carried out on the façade of a corner room using four different loudspeaker positions. The obtained results made it possible to experimentally determine the standardized level differences and to compare them with the simulations. The measurements were performed on a room at the ground floor of the Mathematics Department—University of Brescia, having dimensions of 6 m × 4 m × 2.9 m (Figure 6). An omnidirectional source was placed in four positions outside the room (1a, 1b, 2a, 2b in Figure 7) and a Larson & Davis 831 analyzer was used to measure the sound pressure levels. The reverberation time was measured using the sound level meter and an impulsive source.
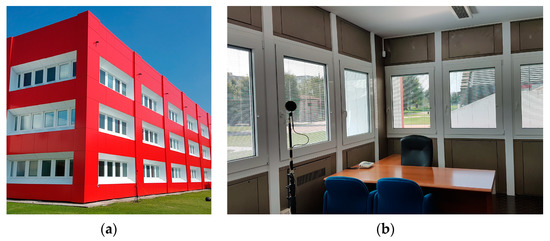
Figure 6.
Measurements performed on a ground floor room with dimensions of 6 m × 4 m and height 2.9 m. Different combination of loudspeaker positions were employed: 1a–2a; 1a–2b; 1b–2a; 1b–2b. (a) External measurements; (b) internal measurements.
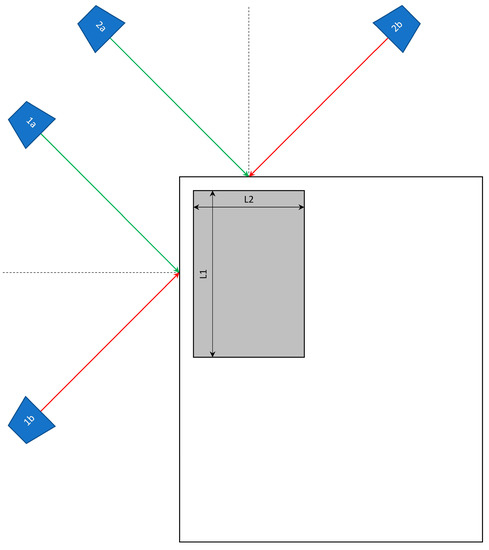
Figure 7.
Loudspeaker positions 1a–1b–2a–2b. L1 = 6 m, L2 = 4 m.
The standardized level difference Dls,2m,nT was computed for the individual loudspeaker positions and for pairs of loudspeaker positions (1a–2a; 1a–2b; 1b–2a; 1b–2b) using Equation (2). Figure 8a shows the results of the measurements for each position of the sound source, while Figure 8b shows the results for the considered pairs of sound source positions. The overall weighted values derived from the measurements in the two cases are shown in Table 5.
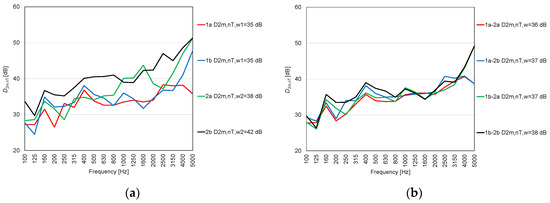
Figure 8.
(a) D2m,nT measured with different loudspeaker positions 1a, 1b, 2a, 2b; (b) Dls,2m,nT calculated with Equation (2) by combining the loudspeaker positions: 1a–2a; 1a–2b; 1b–2a; 1b–2b.
Table 5.
Measured weighted standardized level difference for the different loudspeaker positions.
It is worth noting that, as expected from the previous discussion, the results depend on the loudspeaker positions. For example, the difference between positions 1a and 2b was 7 dB while the difference between 1a–2a and 1b–2b combinations was 2 dB.
During the experimental campaign, the attenuations due to the diffraction of the building or to the different distances from the faҫade were evaluated through sound pressure level measurements at 5 cm from the facade (Figure 9). The building is surrounded by other buildings on both sides, at a distance of 12 m and 13 m from the building façades. Comparing measured and predicted attenuations in the case of an isolated building and in the case of a building placed at 10 m from the façade (Figure 10), one can observe that the measurements are better correlated with the case of a building placed at 10 m from another building than with the case of an isolated building.
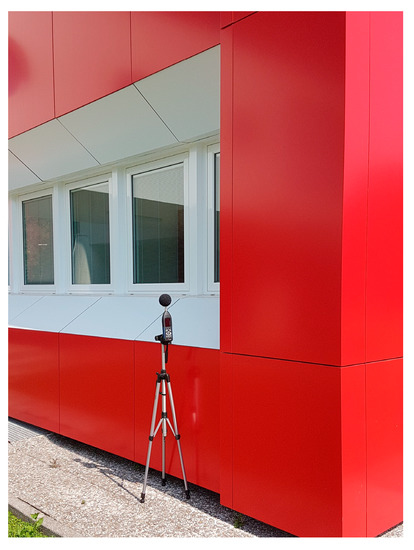
Figure 9.
Sound pressure level measurement in front of the façade.
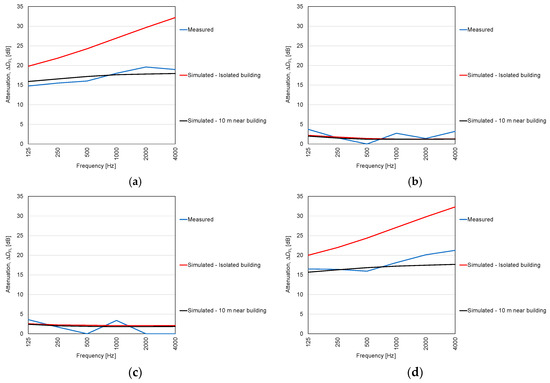
Figure 10.
Measured and predicted attenuations: (a) ΔD21b; (b) ΔD21a; (c) ΔD12a; (d) ΔD12b.
To evaluate the reliability of the method, further comparisons between predictions and measurements were carried out. Considering the previous tables and the dimensions of the measured room, calculations using the weighted indices can be performed. The same calculations can be done in octave or one-third octave frequency bands. On the basis of the datasheets of the façade elements (20-cm-thick precast panel wall and windows with 4-20-4 glasses), the following weighted sound reduction indexes can be adopted for the calculations: Rw_wall = 50 dB, Rw_window = 35 dB. As concerns the windows surfaces, the areas for the two different sides are Swindow_1 = 8.7 m2 and Swindow_2 = 4.35 m2. A level difference due to façade shape ΔLfs = 0 was also considered. The correction for flanking transmission was set to −2 dB. By applying Equation (3), the following results can be obtained:
When dealing with in situ measurements, the loudspeaker can be positioned in four possible configurations: (a) 1a–2a; (b) 1a–2b; (c) 1b–2a; (d) 1b–2b (Figure 7).
If case “a” is considered, the attenuations due to the diffraction, for a room having dimensions 4 m × 6 m, are given in Table 6 (ΔD21a is obtained by linear interpolation).
Table 6.
Attenuation ΔDFL (case “a”).
Adopting these results, it is possible to compute the weighted standardized level difference for the two cases as:
The overall weighted standardized level difference can be computed as:
If case “d” is considered, the attenuations due to diffraction, for a room having dimensions 4 m × 6 m is obtained from Table 7 (ΔD21b is obtained by linear interpolation):
Table 7.
Attenuation ΔDFL (case “d”).
Adopting these results, it is possible to compute the weighted standardized level difference for the two cases as:
Finally, the weighted standardized level difference can be computed using the following equation:
The calculations of cases 1b–2a and 1a–2b can be obtained in a similar way. Table 8 shows a comparison between the D2m,nT,w indices, measured and predicted (with simulated and measured attenuations) according to the proposed procedure. Measurements and calculations are in good agreement.
Table 8.
Weighted standardized level differences as a function of the loudspeaker positions.
6. Conclusions
A method for the evaluation of the façade acoustic insulation of a corner room was proposed, filling a gap in the current version of the ISO 12354-3 standard. The method includes the contribution of the noise diffracted by the façade corner, which cannot be neglected, as this sound component is still able to reach the wall even though it is not directly exposed to the sound wave. To consider this contribution, the attenuations ΔDFL due to the shielding of the corner were calculated. Rooms ranging from 3 m × 3 m to 6 m × 6 m with different floors were investigated. The results are summarized as follows:
Corner room with two walls:
- -
- for the lower floors the sound pressure level difference between the two sides of the room is bigger than for the higher floors, where the sound pressure level is more evenly distributed along the façade; moreover, there is a significant attenuation due to the difference in distance between the source and the façade when the source is “in view” of both sides;
- -
- a greater attenuation can be observed for larger rooms because the difference between the diffracted path and the direct path increases;
- -
- the minimum attenuations for an isolated building vary from 20.4 dB for the ground floor to 12.7 dB for the third floor;
- -
- in the case of a building placed at 10 m from the façade, the minimum attenuations vary from 15.7 dB for the ground floor to 11.5 dB for the third floor. The larger differences can be noted for the ground and first floors.
One wall and a roof room:
- -
- the width of the room does not substantially affect the attenuation values;
- -
- the minimum attenuations relative to the roof for floors F0, F1, F2 and F3 are 10.5 dB, 16.7 dB, 16.3 dB and 15.4 dB.
Two walls and a roof corner room:
- -
- the minimum attenuations relative to the wall for positions A-B-C-D for floors F0, F1, F2 and F3 are 20.3 dB, 18.5 dB, 15.8 dB and 14.5 dB, respectively;
- -
- the minimum attenuations relative to the roof are 11.0 dB, 16.9 dB, 18.4 dB and 15.4 dB, respectively. Such attenuations are slightly higher if compared to the case of a two-pitch roof because a four-pitch roof has about half of the surface subject to a double diffraction.
Finally, a first validation of the proposed method has been performed by experimental measurements on a real building. The agreement is good, especially when considering that the attenuations are strongly influenced by the reflections of a nearby building.
Author Contributions
N.G. conceived the work, managed the simulation, provided the theoretical support for the interpretation of the results and wrote the paper. E.A.P. supervised the work, revised and edited the paper. The authors contributed equally to the experimental measurements. All authors have read and agreed to the published version of the manuscript.
Funding
This research received no external funding.
Conflicts of Interest
The authors declare no conflict of interest. The funding sponsors had no role in the design of the study; in the collection, analyses, or interpretation of data; in the writing of the manuscript, and in the decision to publish the results.
Appendix A
The following graphs show the attenuations for rooms with a depth of 3 m and 6 m and a width from 3 to 6 m. These graphs are useful for the acoustic design of a façade in frequency bands. Intermediate values can be obtained by linear interpolation.
The computed attenuations ΔDFL of the average sound pressure levels, in octave bands, for the wall 2 respect to wall 1 are shown in Figure A1, Figure A2, Figure A3 and Figure A4.

Figure A1.
One octave band attenuation ΔDFL—Corner room with two walls—Floor 0. (a) Source position, isolated building; (b) Source position, 10 m reflective building.
Figure A1.
One octave band attenuation ΔDFL—Corner room with two walls—Floor 0. (a) Source position, isolated building; (b) Source position, 10 m reflective building.


Figure A2.
One octave band attenuation ΔDFL—Corner room with two walls—Floor 1. (a) Source position, isolated building; (b) Source position, 10 m reflective building.
Figure A2.
One octave band attenuation ΔDFL—Corner room with two walls—Floor 1. (a) Source position, isolated building; (b) Source position, 10 m reflective building.


Figure A3.
One octave band attenuation ΔDFL—Corner room with two walls—Floor 2. (a) Source position, isolated building; (b) Source position, 10 m reflective building.
Figure A3.
One octave band attenuation ΔDFL—Corner room with two walls—Floor 2. (a) Source position, isolated building; (b) Source position, 10 m reflective building.


Figure A4.
One octave band attenuation ΔDFL—Corner room with two walls—Floor 3. (a) Source position, isolated building; (b) Source position, 10 m reflective building.
Figure A4.
One octave band attenuation ΔDFL—Corner room with two walls—Floor 3. (a) Source position, isolated building; (b) Source position, 10 m reflective building.

Given that the attenuations are mainly provided by corner diffraction, they are larger for increasing frequencies in the case of shielded façades. Note also that for the first floor and a 6 m wide room the façade opposite to the source is shielded (case F1 source in E). Generally, a larger attenuation is obtained for bigger rooms because the difference between the diffracted path and direct path increases as a consequence of the room dimensions.
The computed attenuations ΔD31 of the average sound pressure levels in octave bands of the roof 3 with respect to respect wall 1 are shown in Figure A5.

Figure A5.
One octave band attenuation ΔD31—(a) Floor 0 and Floor 1; (b) Floor 2 and Floor 3.
Figure A5.
One octave band attenuation ΔD31—(a) Floor 0 and Floor 1; (b) Floor 2 and Floor 3.

The computed attenuations ΔDFL of the average sound pressure levels, in octave bands, for the wall 2 and the roof 3 with respect to wall 1 are shown in Figure A6, Figure A7, Figure A8 and Figure A9.

Figure A6.
One octave band attenuation ΔDFL—Corner room with two walls and a roof. Floor 0—(a) wall; (b) roof.
Figure A6.
One octave band attenuation ΔDFL—Corner room with two walls and a roof. Floor 0—(a) wall; (b) roof.


Figure A7.
One octave band attenuation ΔDFL—Corner room with two walls and a roof. Floor 1—(a) wall; (b) roof.
Figure A7.
One octave band attenuation ΔDFL—Corner room with two walls and a roof. Floor 1—(a) wall; (b) roof.


Figure A8.
One octave band attenuation ΔDFL—Corner room with two walls and a roof. Floor 2—(a) wall; (b) roof.
Figure A8.
One octave band attenuation ΔDFL—Corner room with two walls and a roof. Floor 2—(a) wall; (b) roof.


Figure A9.
One octave band attenuation ΔDFL—Corner room with two walls and a roof. Floor 3—(a) wall; (b) roof.
Figure A9.
One octave band attenuation ΔDFL—Corner room with two walls and a roof. Floor 3—(a) wall; (b) roof.

References
- WHO. Burden of Disease from Environmental Noise Quantification of Healthy Life Years Lost in Europe; World Health Organization: Copenhagen, Denmark, 2011. [Google Scholar]
- Rasmussen, B. Sound insulation between dwellings—Requirements in building regulations in Europe. Appl. Acoust. 2010, 71, 373–385. [Google Scholar] [CrossRef]
- Italian Presidency of the Council of Ministers. D.P.C.M 05/12/97—Determinazione dei Requisiti Acustici Passivi degli Edifici (Decree by the Prime Minister of Italy 05/12/1997—Determination of the Passive Acoustic Requirements of Buildings); Italian Official Gazette General Series n. 297 of 22/12/1997; Istituto Poligrafico e Zecca dello Stato: Rome, Italy, 1997. (In Italian)
- ISO 16283-3:2016. Acoustics. Field Measurement of Sound Insulation in Buildings and of Building Elements Façade Sound Insulation; International Organization for Standardization: Geneva, Switzerland, 2016. [Google Scholar]
- Rasmussen, B.; Guigou-Carter, C. A Pilot Study on Acoustic Regulations for Schools—Comparison between Selected Countries in Europe. In Proceedings of the Internoise 2016, Hamburg, Germany, 21–24 August 2016. [Google Scholar]
- Casini, D.; Cellai, G.; Fogola, J.; Scamoni, F.; Secchi, S. Correlation between façade sound insulation and urban noise: A contribution to the acoustic classification of existing buildings. Build. Acoust. 2016, 23, 145–158. [Google Scholar] [CrossRef]
- Ryu, J.; Song, H. Effect of building façade on indoor transportation noise annoyance in terms of frequency spectrum and expectation for sound insulation. Appl. Acoust. 2019, 152, 21–30. [Google Scholar] [CrossRef]
- Chetoni, M.; Ascari, E.; Bianco, F.; Fredianelli, L.; Licitra, G.; Cori, L. Global noise score indicator for classroom evaluation of acoustic performance in LIFE GIACONDA project. Noise Mapp. 2016, 3, 157–171. [Google Scholar]
- Busa, L.; Secchi, S.; Baldini, S. Effect of Façade Shape for the Acoustic Protection of Buildings. Build. Acoust. 2010, 17, 317–338. [Google Scholar] [CrossRef]
- Calleri, C.; Shtrepi, L.; Armando, A.; Astolfi, A. Evaluation of the influence of building façade design on the acoustic characteristics and auditory perception of urban spaces. Build. Acoust. 2018, 25, 77–95. [Google Scholar] [CrossRef]
- Barbaro, S.; Caracausi, R.; Rapin, J.M. Control of Acoustical Quality of Indoor Spaces: Thorough Analysis of the Influence of Façade Typologies. Build. Acoust. 2001, 8, 161–177. [Google Scholar] [CrossRef]
- Yu, B.; Ma, H.; Kang, J. A Hybrid Model for Investigating the Effect of Scattering from Building Façade on Sound Propagation in Street Canyons. Appl. Sci. 2019, 9, 2803. [Google Scholar] [CrossRef]
- Fausti, P.; Secchi, S.; Zuccherini Martello, N. The use of façade sun shading systems for the reduction of indoor and outdoor sound pressure levels. Build. Acoust. 2019, 26, 181–206. [Google Scholar] [CrossRef]
- Caniato, M. Sound insulation of complex façades: A complete study combining different numerical approaches. Appl. Acoust. 2020, 169, 107484. [Google Scholar] [CrossRef]
- Secchi, S.; Cellai, G.; Fausti, P.; Santoni, A.; Zuccherini Martello, N. Sound Transmission between Rooms with Curtain Wall Façades: A Case Study. Build. Acoust. 2015, 22, 193–208. [Google Scholar] [CrossRef]
- Leung, M.; Tang, S.K.; Fung, M.L. Effects of sound incidence angle on the effectiveness of noise reduction measures applied to acoustic windows. In Proceedings of the Internoise 2019, Madrid, Spain, 16–19 June 2019. [Google Scholar]
- Berardi, U. A Comparison of Measurement Standard Methods for the Sound Insulation of Building Façades. Build. Acoust. 2012, 19, 267–282. [Google Scholar] [CrossRef]
- Scrosati, C.; Scamoni, F.; Zambon, G. Uncertainty of façade sound insulation in buildings by a Round Robin test. Appl. Acoust. 2015, 96, 27–38. [Google Scholar] [CrossRef]
- ISO 12999-1:2020. Acoustics. Determination and Application of Measurement Uncertainties in Building Acoustics. Part 1: Sound Insulation; International Organization for Standardization: Geneva, Switzerland, 2020. [Google Scholar]
- Scrosati, C.; Scamoni, F.; Prato, A.; Secchi, S.; Fausti, P.; Astolfi, A.; Barbaresi, L.; D’Alessandro, F.; Di Bella, A.; Schenone, C.; et al. Uncertainty of facade sound insulation by a Round Robin Test. Evaluations of low-frequency procedure and single numbers. Build. Environ. 2016, 105, 253–266. [Google Scholar] [CrossRef]
- ISO 12354-3:2017. Building Acoustics. Estimation of Acoustic Performance of Buildings from the Performance of Elements—Part 3: Airborne Sound Insulation against Outdoor Sound; International Organization for Standardization: Geneva, Switzerland, 2017. [Google Scholar]
- ISO 717-1:2013. Acoustics. Rating of Sound Insulation in Buildings and of Building Elements. Part 1: Airborne Sound Insulation; International Organization for Standardization: Geneva, Switzerland, 2013. [Google Scholar]
- Kurze, U.; Anderson, G. Sound attenuation by barriers. Appl. Acoust. 1971, 4, 35–53. [Google Scholar] [CrossRef]


Publisher’s Note: MDPI stays neutral with regard to jurisdictional claims in published maps and institutional affiliations. |
© 2020 by the authors. Licensee MDPI, Basel, Switzerland. This article is an open access article distributed under the terms and conditions of the Creative Commons Attribution (CC BY) license (http://creativecommons.org/licenses/by/4.0/).