Communication

Optimization of Management Processes in Assessing the Quality of Stored Grain Using Vision Techniques and Artificial Neural Networks

1
Opole University of Technology, Faculty of Production Engineering and Logistic 45-758 Opole, Poland
2
Opole University of Technology, Faculty of Economics and Management 45-758 Opole, Poland
3
Agropol Spółka Jawna [General Partnership], 49-330 Łosiów, Poland
*
Author to whom correspondence should be addressed.
Appl. Sci. 2020, 10(16), 5721; https://doi.org/10.3390/app10165721
Submission received: 18 July 2020 / Revised: 13 August 2020 / Accepted: 14 August 2020 / Published: 18 August 2020
(This article belongs to the Section Computing and Artificial Intelligence)

Abstract

:
The paper presents the method of using vision techniques and artificial neural networks to assess the degree of contamination of cereal during grain reception. The aim of the work is to optimize the management of the contaminant evaluation process of grain mass in warehouse and during purchase using vision techniques based on computer image analysis in order to expedite laboratory work. The obtained photographs of wheat seed samples were analyzed using the “Agropol V06” computer application and neural analysis of the obtained empirical results was performed. The application of computer image analysis reduced the time necessary for the quality assessment of the examined material compared to traditional methods. The generated models were characterized by good parameters and high quality, obtaining a high R2 coefficient at the level of 0.999. As part of the investment project, savings resulting from the time of goods receipt and further production process were made. Profitability was estimated at 191.43% per day. The analysis was made without taking into account other costs related to the business activity. The straight payback period is 3 years.

1. Introduction

Cereals are grown on half of the farms in the European Union (EU), which occupy one third of the EU’s utilized agricultural area and account for one quarter of its area. Globally, Europe accounts for 20% of the total cereal production, of which about 63% comes from the European Union countries [1]. Cereals are mainly used for animal feed (61%), human consumption (24%), production of alcoholic beverages (5%), bioenergy production (4%), and seed (3%) [2]. In recent years, Europe has been the exporter of about 15% of its cereal production [1]. In the coming decades, global demand for agricultural products, including cereals, will be characterized by significant growth, which will be driven by the population growth and the increase in the income of the society [3,4]. Globally, wheat, barley, corn, and rice play the biggest role. In Poland, the most popular cereal species are wheat, rye, triticale, barley, oats, corn, millet, amaranth, and buckwheat. Raw materials of agricultural origin, due to their content of protein, fat, sugars, minerals, vitamins, and others, are a valuable source of food for people and animals and are widely used in various branches of economy. The usefulness of agricultural goods is determined not only by their characteristics and varied chemical composition, but also by their quality and related industrial suitability. To extend the industrial applicability and quality values, it is necessary to ensure appropriate storage conditions for products and goods of agricultural origin after harvesting [5]. Cereal grains and seeds are usually stored in bulk because of the better use of storage facility capacity. The storage techniques used are designed to create optimal physical and chemical conditions during the storage process, i.e., limiting the life processes of the grain and the development of microorganisms. The main factors influencing the development of life processes are: high humidity, temperature, access to oxygen, and the operation of pests. Keeping in mind the condition of the seeds prior to the storage process, an appropriate method should be chosen. There are three basic ways to store seeds: dry, cooled, and airtight storage. These can be combined with one another depending on the needs [6]. Dry storage consists in reducing the water content of the material to such a level that its life processes are kept to a minimum. For wheat, barley, rye, and oats, the safe humidity content is up to about 14%, for rapeseed, due to its high fat con-tent 7%, and for pulses 14–15%. Cooled storage is used due to the inhibitory effect of low temperatures on the development of life processes taking place in the grain bed. Cooling the bed below 10–12 °C inhibits the development of pests in the intergranular spaces. At the temperature of about 5 °C, the growth of bacteria and molds is inhibited while maintaining all the important biological properties of the grain. The degree of grain cooling depends on the expected storage length, grain humidity, and the presence of foreign organisms. Storing seeds without access to air in hermetic tanks consists in bringing to a state of maximum inhibition of life processes in seeds and living organisms as a result of cutting off the supply of oxygen to the bed. Over time, as oxygen is consumed, the proportion of carbon dioxide in relation to oxygen content increases. The maintenance of the quality of material stored without air is possible only with low water content in the grain (7% and less), its high level results in deterioration of feed and nutritive properties and production of specific acid and alcoholic scents [5]. Storage of agricultural crops is a key stage in the agrifood production chain. Improper storage conditions of cereals promote the development of microorganisms, including fungi, commonly known as molds [7]. Their excessive development may generate economic loss and lead to a decrease in quality parameters of the stored raw material, such as: weakened germination capacity of the seed, weight loss, grain infestation and change in organoleptic and chemical parameters [8]. In view of increasing consumer demands and regulations concerning the agrifood sector, more and more research on engineering and production technology issues is concentrated on the possibility of applying fully automated and error-free continuous quality control and evaluation. In particular, the area of control related to the measurement of qualitative characteristics, including on-line or at-line physical properties is the most desirable direction of future development [7,9]. The last decade has seen a dynamic increase in the use of application techniques to assess the quality of food and agricultural produce on the basis of objective instrumental measurements, especially techniques based on image analysis. With the use of such techniques, it is possible not only to analyze, evaluate, but also to classify individual product features, such as color, texture, shape, size, and to determine the relations between these parameters [10]. Computer image analysis as a nondestructive method, allowing for quick, repeatable and objective quality assessment, is increasingly used to measure and predict the quality of agrifood raw materials, sometimes overcoming the limitations of traditional methods used so far [11], especially the subjective ones [12]. In order to promote the prospect of process industry with efficient, ecological and intelligent production, modern information technologies should be used in the process of production optimization, management and marketing [13]. More and more often in the cereal industry vision techniques based on computer image analysis and analysis by means of artificial neural networks are used [14,15]. On the basis of the analysis of the different characteristics of the processing industry, as well as the different objectives of smart production, optimal manufacturing for a highly efficienct and green-oriented processing industry is proposed. The direction of the development of industrial process control systems is intelligent optimal control systems [16,17].
The development and optimization of control methods at every stage of the production process, from raw materials to finished products, is becoming increasingly important in food processing technology. There is a growing interest in food safety and food quality assessment issues, which have become one of the main priorities in food analysis. This is evidenced by innovative monitoring and quality control methods for both raw and processed product samples. Apart from classical instrumental techniques (mainly chromatographic), methods based on electronic sensors are increasingly used in food analysis [18]. In particular, electronic noses are used to analyze the aromatic profiles of samples without prior separation of volatile substances into individual components. These devices consist of a number of non-selective or partially selective gas sensors which are connected with a data processing system and a standard recognition system capable of identifying even complex aromatic profiles [19]. The application of this technique enables a quick analysis and may be an alternative to relatively expensive and time-consuming techniques such as gas chromatography combined with mass spectrometry (GC–MS) and/or olfactometry (GC–O), infrared (IR) spectroscopy, and classical sensory analysis [20]. Food control is, in particular, one of the main areas of application of electronic noses in quality assessment and process operations in the food industry [19,20].

2. Aim and Scope of Work

The aim of the work is to optimize the management of the process of evaluation of contaminants in grain mass in the warehouse and during purchase using vision techniques based on computer image analysis in order to expedite laboratory work. Artificial neural networks were also used to model the results. It was therefore assumed that on the basis of the prepared application for processing and analyzing the acquired digital images, based on the RGB color recognition model, a quick and good method of assessing the quality of products will be obtained. There is a great practical demand for such solutions, e.g., during the purchase of cereals for storage. Determining the initial quality of the incoming seed in terms of impurities gives an immediate basis for determining the price of the purchased material. The second aspect of using this method is the quality control of the grain stored in the warehouses. The development of such a method will allow to quickly obtain results without time-consuming laboratory work. For this purpose the samples of wheat seeds were prepared. The computer application was prepared and developed to assess the degree of contamination of grain mass based on the RGB model. Also a measurement stand was made to enable taking digital photographs of appropriate quality and digital photographs of the collected wheat seed samples were taken. The obtained photographs of wheat seed samples were analyzed using the “Ag-ropol V06” computer application and the neural analysis of the obtained empirical results was performed.

3. Materials and Methods

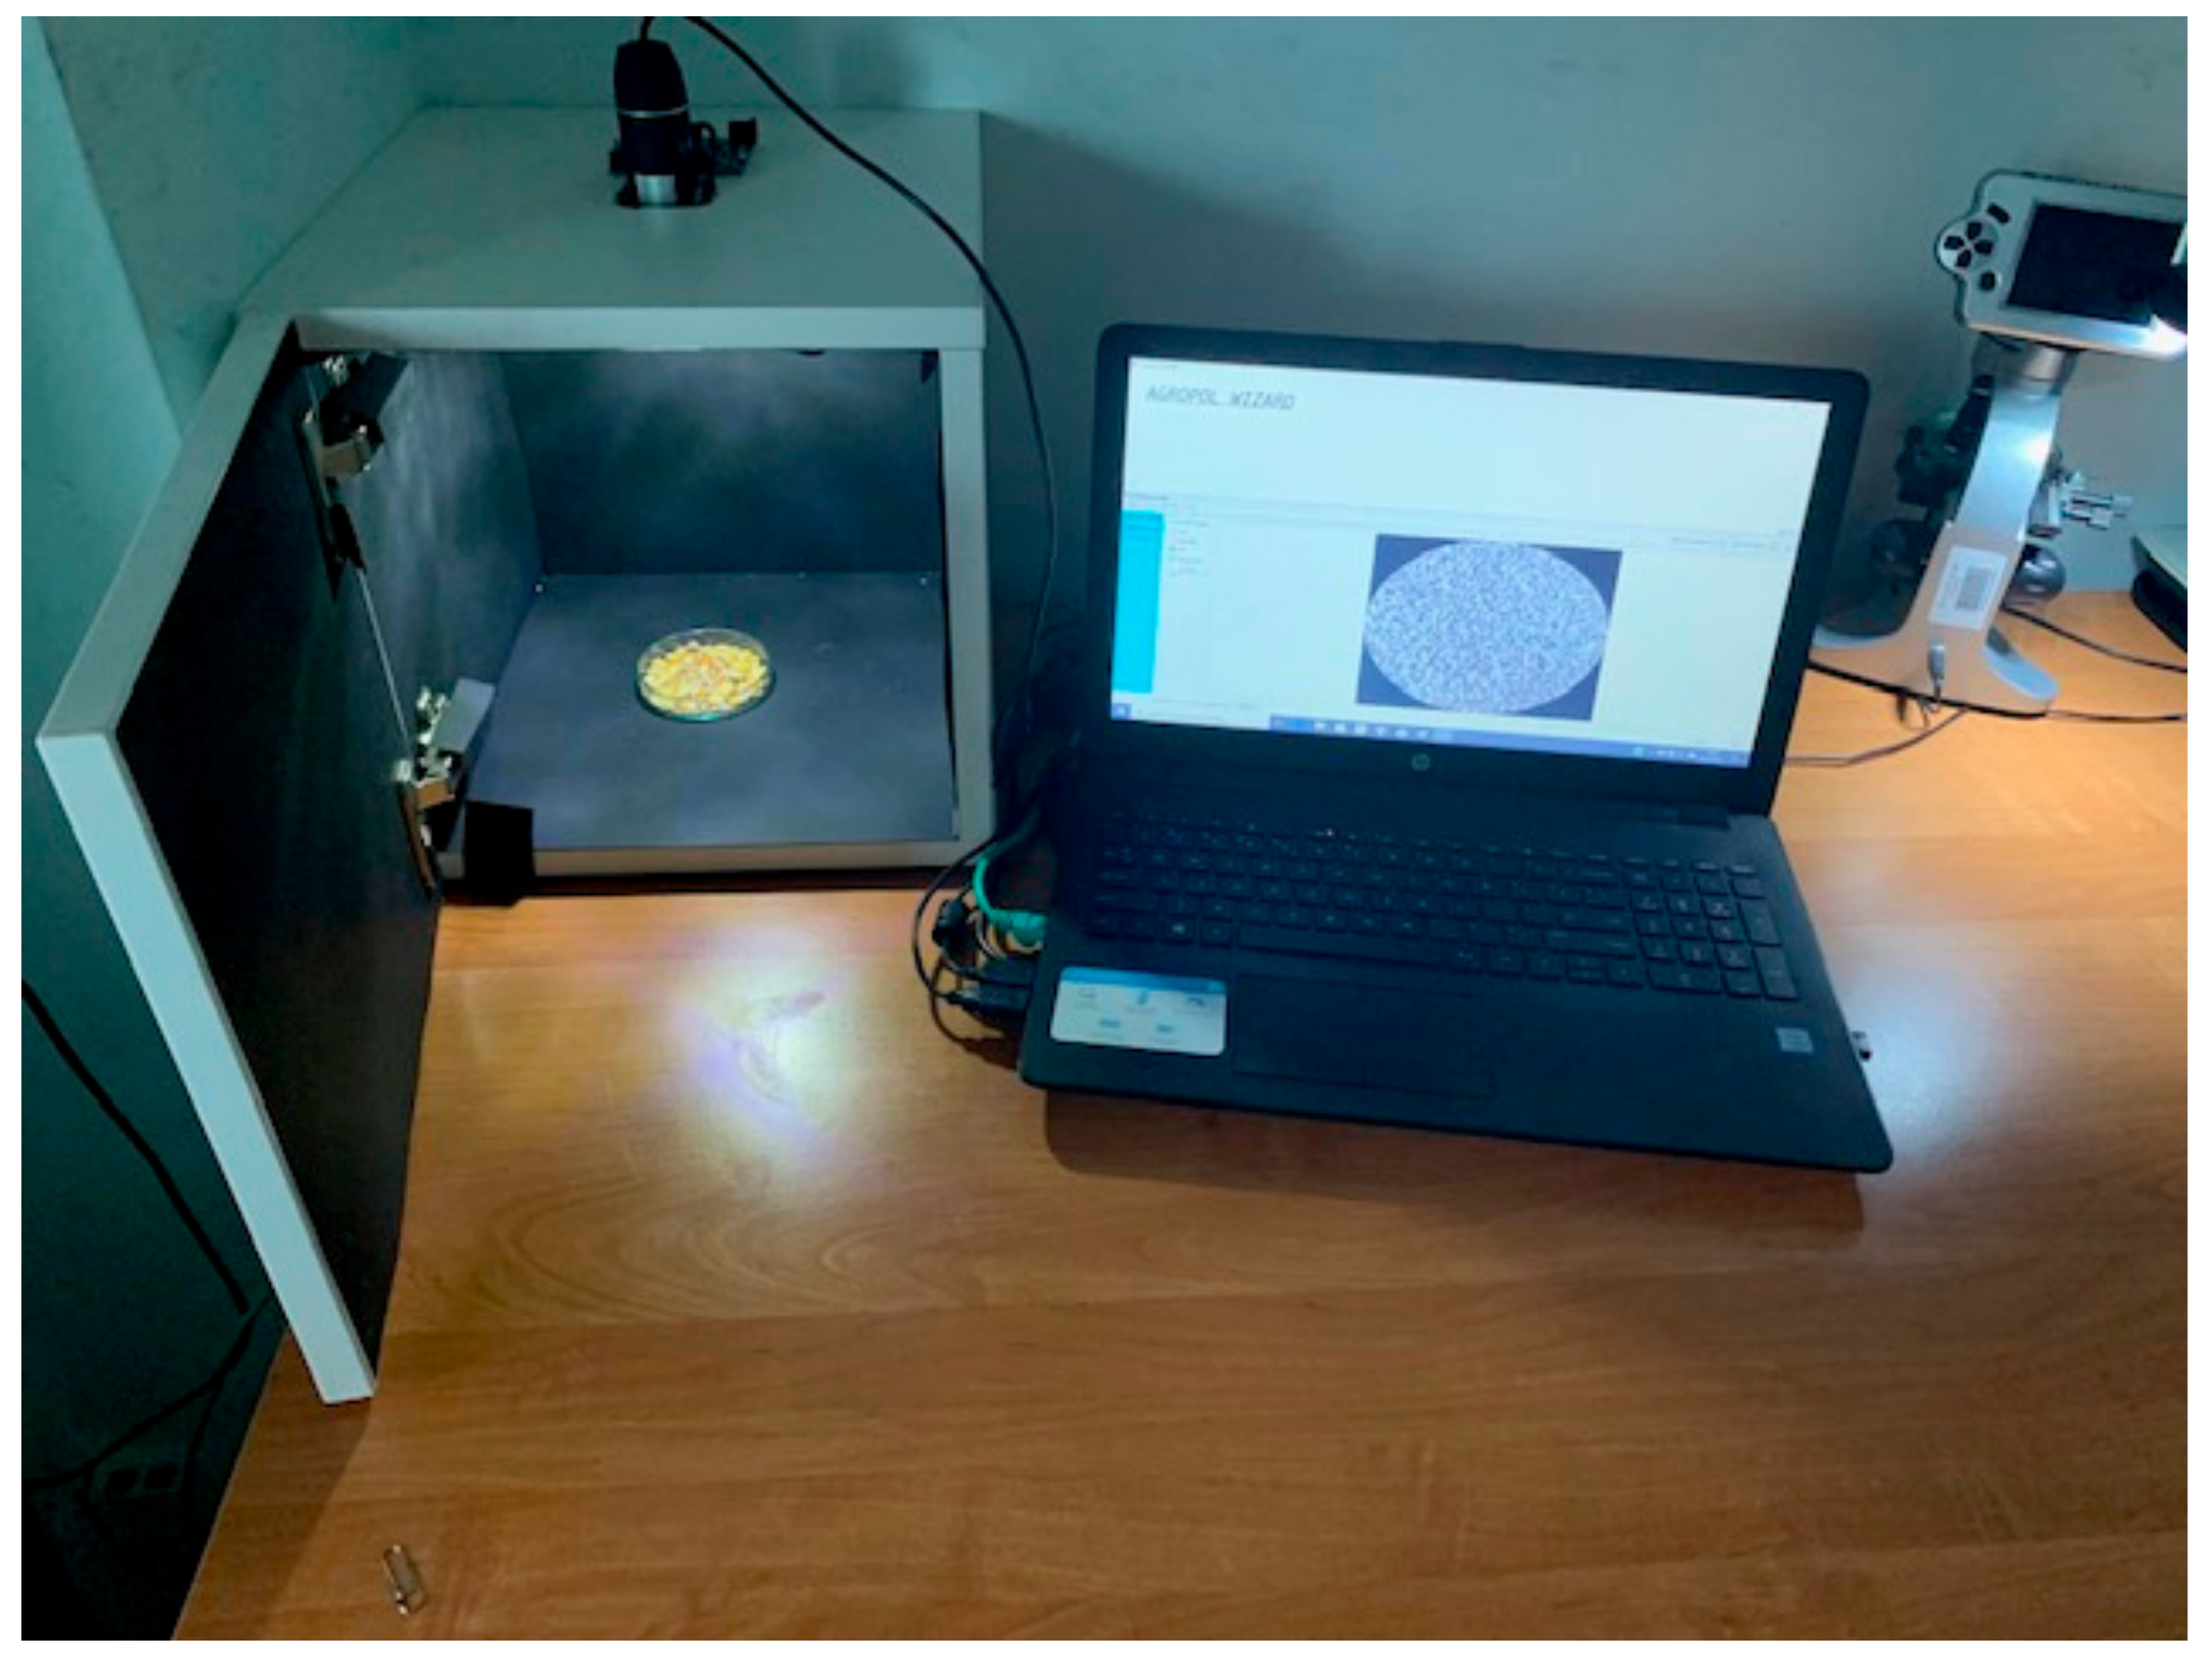
The research was conducted storage period of 7 months from the loading date. Samples were taken every 4 days (8 samples per month). Five samples were taken each time from a randomly selected batch of wheat pile. Approximately 0.5 kg of grain was collected for testing. Samples were taken using a prototype multichamber probe with an overall length of 150 cm, which was equipped with a humidity and temperature sensor type AM2302. The probe allowed the acquisition of a representative cross-sectional sample at the depth of up to 120 cm and for the study of temperature and humidity of the intergranular space at a depth of about 100 cm. Then the sample was taken to the laboratory, where the contaminants were determined by means of the weight-sieve and microscopic methods. In parallel, the same sample was evaluated using computer image analysis. For this purpose, a special test stand, equipped with a camera for image acquisition (sampling) and connected with a computer application for grain evaluation was used. After the acquisition of the image, the analysis was carried out using the computer application “Agropol V06”. Figure 1 shows the multichamber probe. Figure 2 shows the test stand.
To carry out research based on computer image analysis, the “Agropol V06” application was developed, which is used to analyze, process, and recognize images. Its basic feature is the ability to build image processing scripts. For this purpose, a scripting language was built in which allows for a number of graphic operations. The program is adapted to read and write images in standard graphic formats (BMP, JPEG). The results obtained were compared with those from the laboratory. The task of “Agropol V06” computer application based on the RGB color description model and the application of the color recognition model was to extract the measured objects from the background and average the RGB components within the object outline:
R , G , B = R 0 255 K K
where: R—acquisition resolution (0–255) and K—number of pixels of a given resolution.
With the average values of the R, G, B components, you can calculate the average brightness of the image according to the formula:
I = ( R + G + B ) / 3
Neural modelling was used for comparative assessment. The models were generated with the Automatic Designer using the following settings:
-
input variable: binding quantity in percentage using the traditional (weight-sieve) method for 22 samples,
-
output variable: binding quantity in percentage by computer image analysis, for 22 trials,
-
designed models: three-line network, four-layer perceptron, four-layer perceptron,
-
activation function: linear.
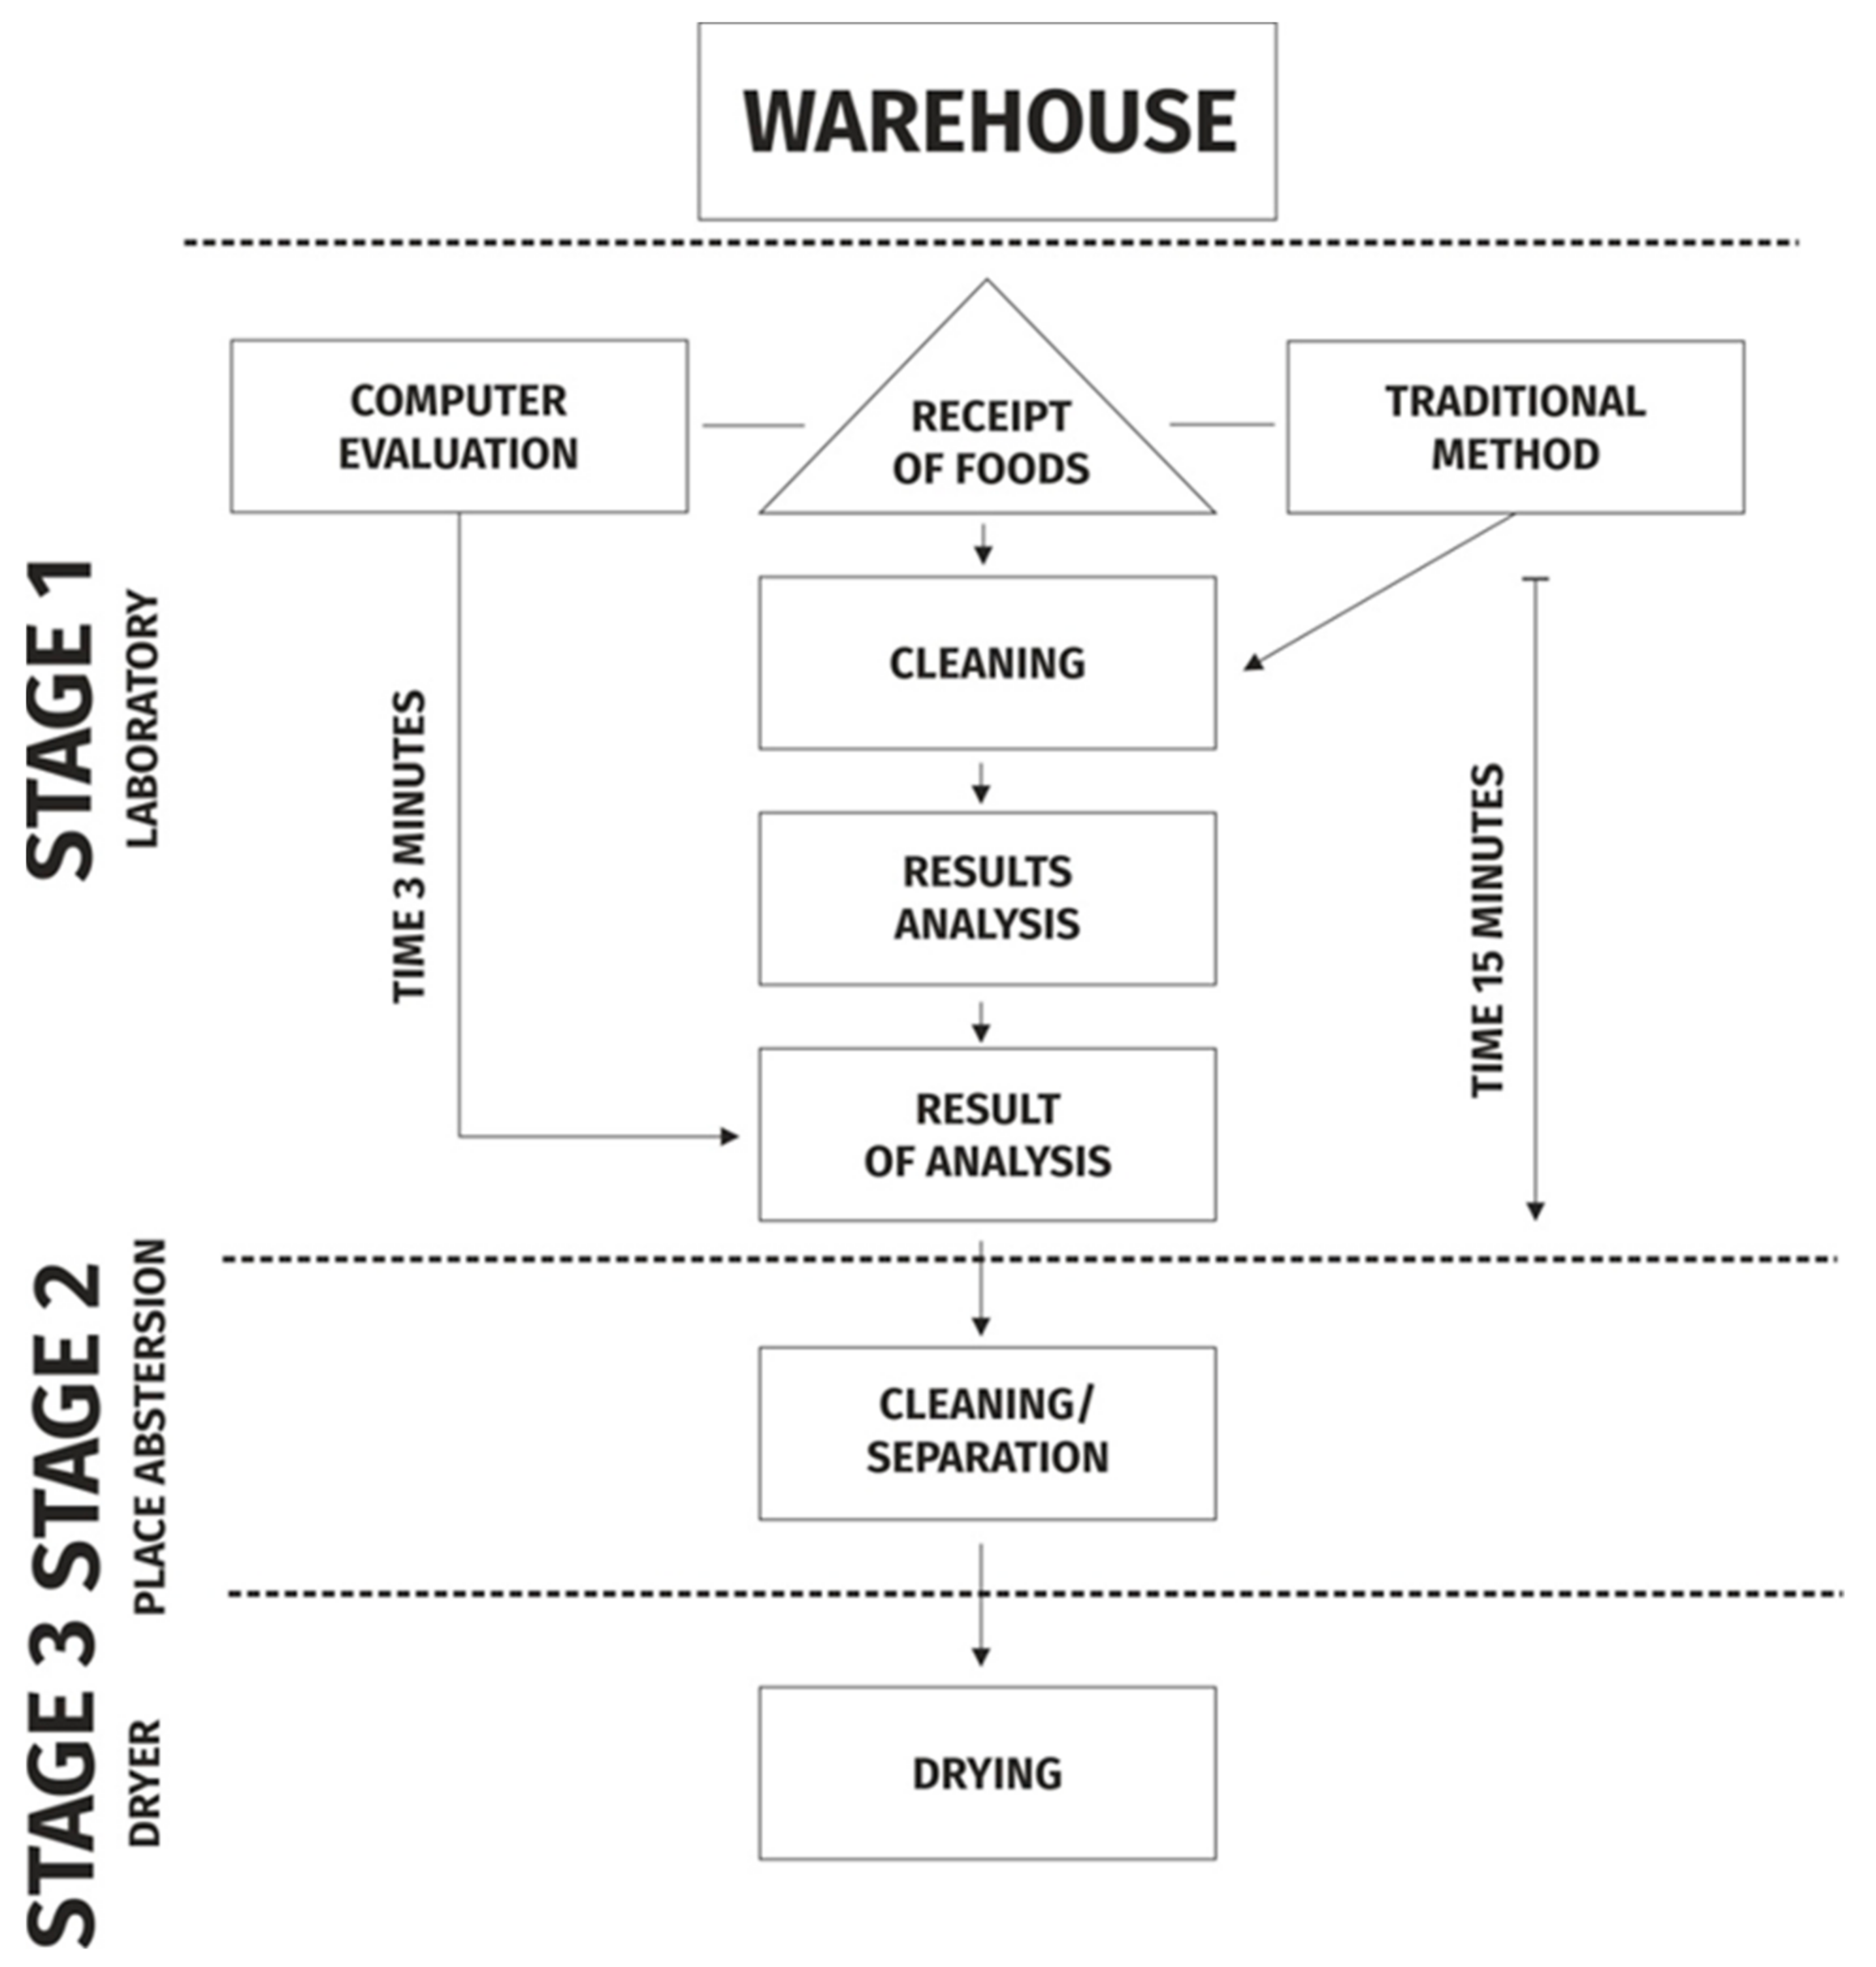
Out of 10 network models, 5 models meeting the best selection criteria were generated. One linear network model, 2 RBF network models, and 2 MLP (multilayer perceptron) network models were selected. In Table 1 features of selected models of neural networks are presented. In addition, as part of the research, the management of the entire technological process was implemented in parallel with the currently operating system. Thanks to such an approach it was possible to work out an optimal scheme for the implementation of the new solution. It was also possible to compare the time of conducted research, determine the costs incurred by both operating systems and calculate the operating profit related to the implementation of the new solution. As part of the research, only the cleaning process was analyzed for profitability. The whole technological process was divided into the following stages: weighing, sampling, evaluation of the composition and quality of contaminants, unloading, intra-elevator transport, cleaning (separation), drying, storage, and transport. The implementation of the innovative method will improve the organization of the technological process at the stage of weighing, sampling, assessment of the composition and quality of pollutants, cleaning and drying. The analysis assumes a comparison of the current method of sampling and evaluation in the technological process and the implemented method carried out during the research. Figure 3 shows a block diagram of granular material evaluation technology.
As part of the project, the profitability of the project was assessed using the EBIT (earnings before deducting interest and taxes) operating profit ratio. The key element was the time of receiving the produce into the warehouse and thus the lost profit when using the traditional method. Figure 3 shows a diagram of the entire process.
The assumption for the analysis was that the company is able to work 17 h a day in the working season. On average, based on experience and the analysis of the company’s records, it follows that the receipt department accepts around 70 transports (2019 data) with 20 t of grain. The time to perform the task by traditional method is about 15 min. In the case of implementation of the new method, the time is reduced to 3/5 min per transport. The laboratory is able to handle 204 shipments of 20-tons each using the new vision method within the same time.
The financial analysis was based on generating income only from the cleaning and separation stage. Shipment of wheat with the contamination of 1.10% of grain value was accepted for analysis. After the analysis at this technological stage, it was found that the traditional method generates the income of 16,324. PLN/day (operating profit), and the vision method 31,248.80. PLN/day (operating profit). (PLN is the official currency and legal tender of Poland). The profitability analysis of the project it is show in Table 2.
The value was calculated using the following formula:
  • (+) direct revenue—taxable revenue,
  • (−) tax-deductible costs, and
  • (=) profit (+)/loss (−)—operating profit
The financial data include purchase and sale prices in 2019. Subsequently, a financial analysis was made based on income generated only from the technological stage of cleaning and separation. Shipment of wheat with the contamination of 1.20% of grain value was accepted for analysis. After analysis at this technological stage, it was found that the traditional method generates the income of PLN 17,808.00. per day (operating profit) and the vision method PLN 51,897.60. per day (operating profit).
Based on the operating profit ratio only, the percentage of growth ranges from 91.4% to 191.4%. The entire technological process has also been modernized to avoid bottlenecks:
-
material cleaning,
-
drying
-
handling inside the warehouse.
As part of the project, fixed assets were purchased to improve the whole process.

4. Straight Payback Period

Based on the above assumptions, the analysis of the socalled straight payback on investment was also made. The payback payback period is understood as the time necessary to recover the initial expenditure on the project. This factor allows choosing under an option which enables the fastest payback of initial expenditure from investment projects under consideration. In the case of a single project, it may be carried out if it’s payback period is shorter or equal to the period accepted by the investor as acceptable.
In applying this criterion, the annual nominal amounts of income should be summed up and the resulting sum should be compared with the value of the expenditure.
O Z N = C N P I P R N F
where: OZN—payback period, CNPI—total investment project expenditure, PRNF—planned annual financial surpluses resulting from a given undertaking. In this case, the OZN value—the payback period is about 3 years.

5. Analysis and Discussion of Results

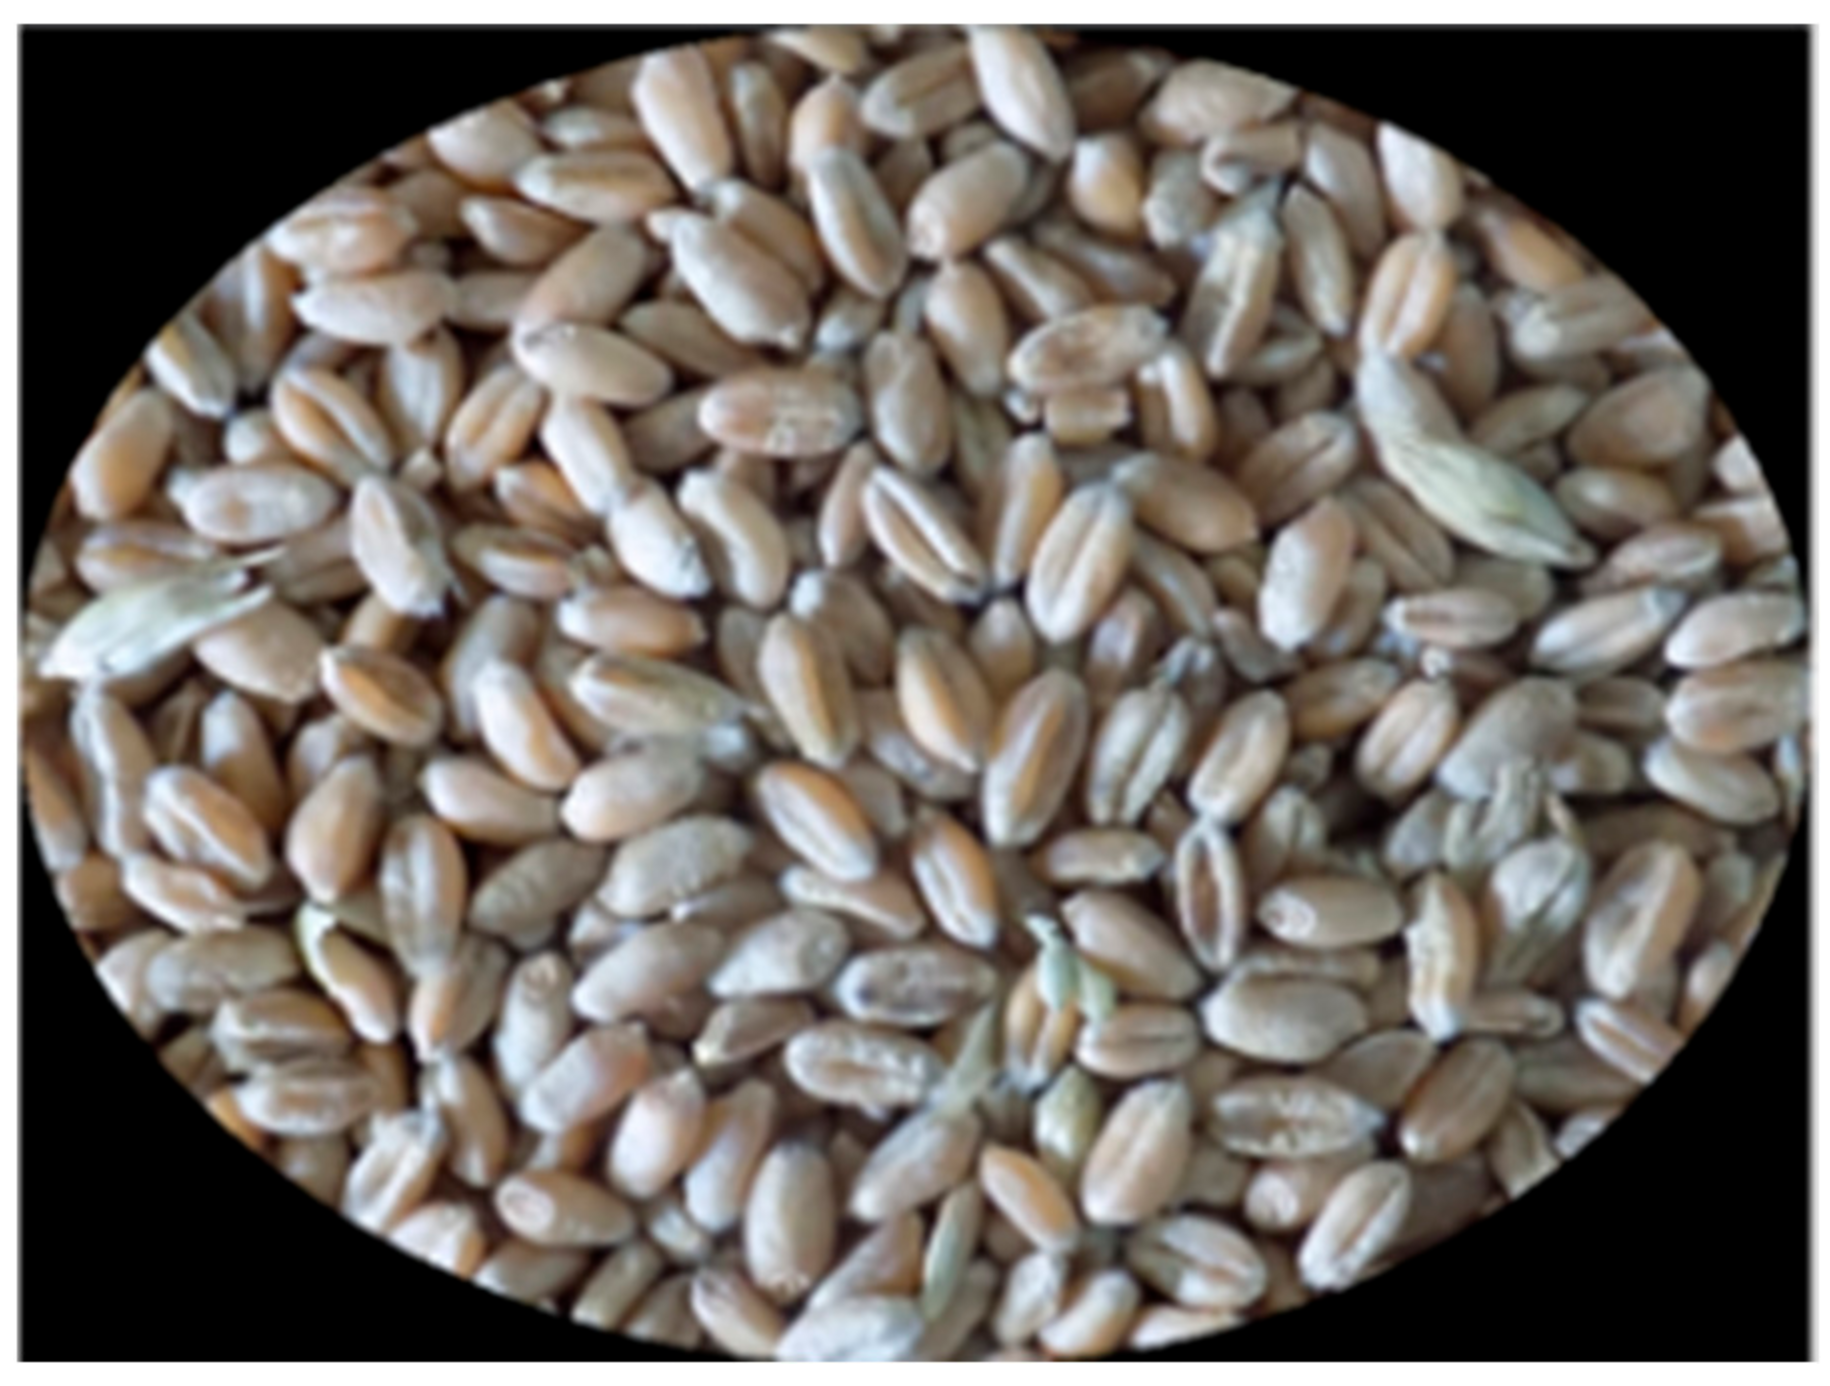
On the basis of the experiment carried out concerning the state of contamination of wheat grain during storage in a company dealing in the purchase of cereals, the percentage of contaminants in the grain mass was obtained from a computer image analysis using the RGB color analysis model “Agropol V06”. The obtained data were compared with the experimental empirical data obtained in the company’s laboratory prepared by a laboratory specialist. Figure 4 and Figure 5 show a randomly selected sample and its results. The image acquisition application “Agropol V06” was used to show the recognition of colors corresponding to con-taminants in the wheat mass.
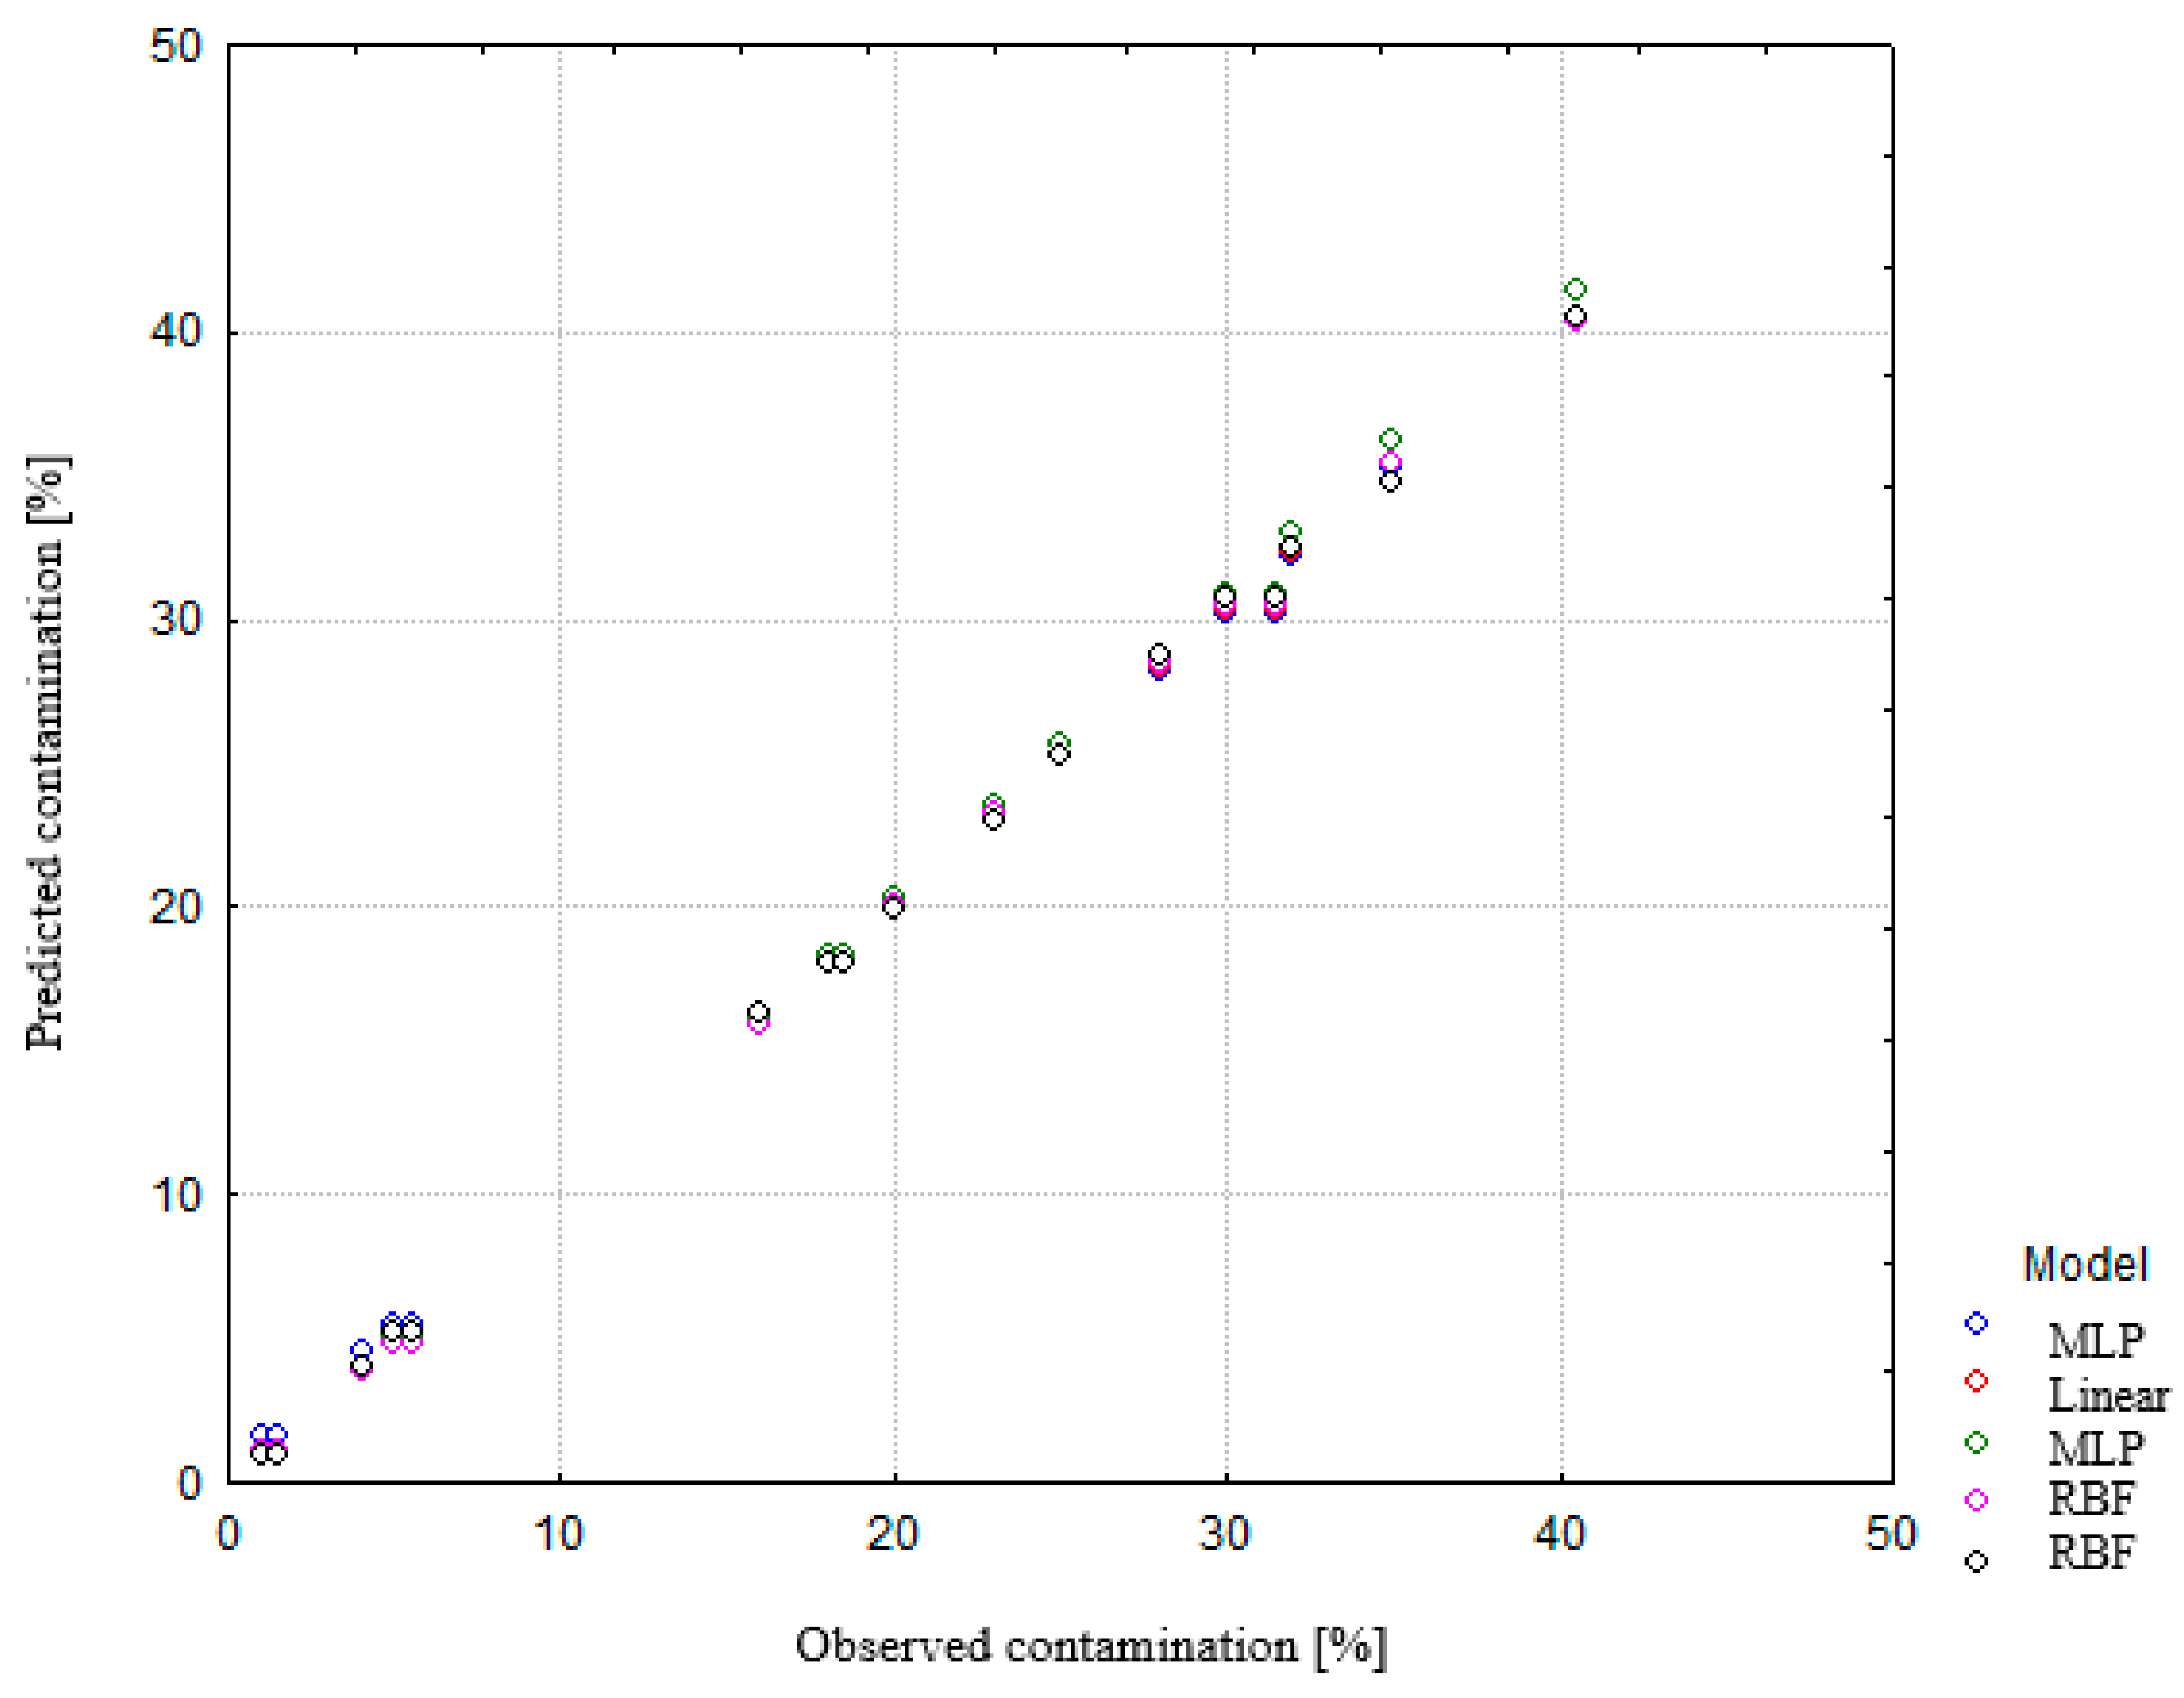
On the basis of the obtained empirical results, neural modelling was analyzed using Automatic Designer. Out of 10 network models, five models meeting the best selection criteria were generated Figure 6. Two MLP network models, two RBF network models and one linear model were selected. Table 2 shows the characteristics of selected neural network models.
On the basis of the characteristics of neural network models, a model fitting chart was generated, taking into account the predicted average values.
On the basis of the obtained statistical data, it can be said that not all analyzed types of neural network models are well suited for the analysis of the percentage of contaminants in wheat grain weight. Not all cases gave a high correlation coefficient (Table 3) All tables should be mentioned in the article before they appear All tables should be mentioned in the article before they appear). Some differences can be seen, especially with regard to the MLP and MLP* models, which obtained the highest difference in correlation coefficient at the level 0.98 for MLP—And 0.45 for MLP*. However, despite the high correlation coefficient, the RBF model seems to be the least fit, as the graph is sharply curved. This conclusion is supported by the fitting error charts. Analyzing the model fitting diagrams and correlation coefficients one can say that the problem of contamination analysis in wheat grain mass is best illustrated by the linear model and the MLP.
Additionally, on the basis of the obtained empirical data for both methods, the percentage of contaminants was determined in the graph of fitting (Figure 7). This graph was made using a function in a general form: y = a + bx, R2 was 0.9999.
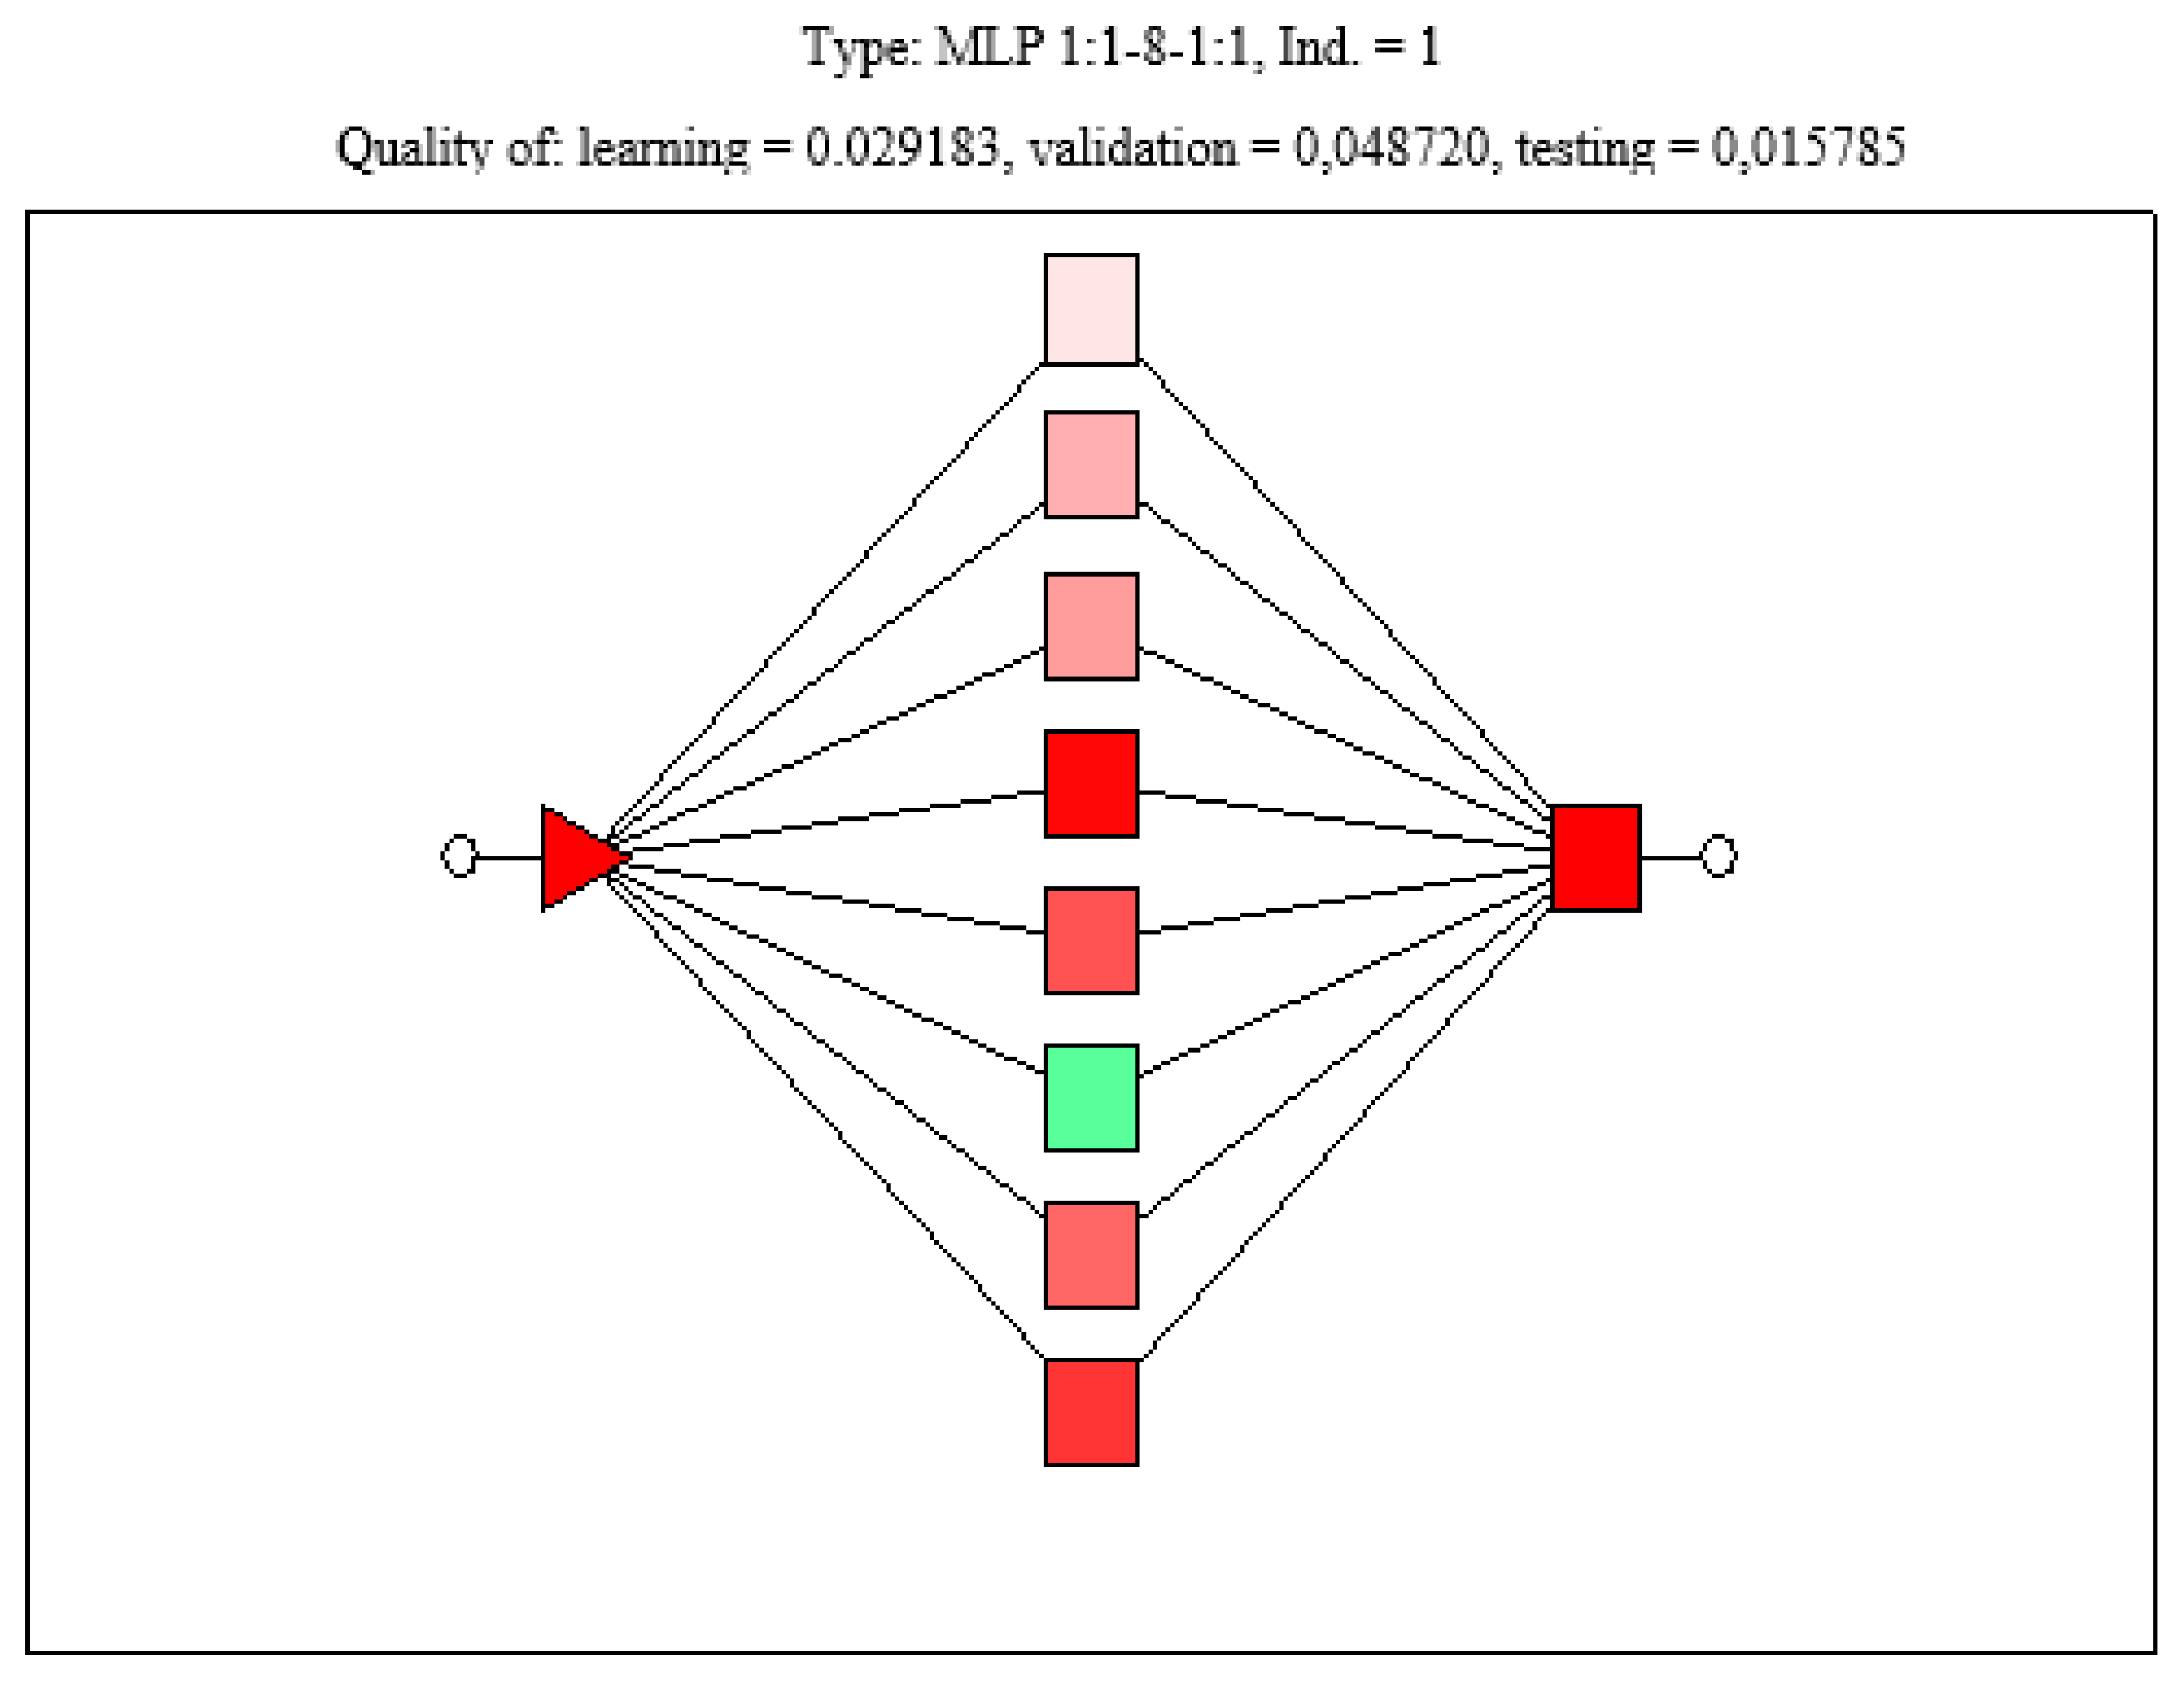
On the basis of the statistical data obtained, it can be said that all the analyzed types of neural networks are well suited to the analysis of the percentage of contaminants in the mass of wheat grain. All cases have a high correlation coefficient. Figure 8 shows the architecture of a sample neural network model.
Mladenov, M; Dejanov, M. 2004 focused their attention on using image analysis to evaluate the germinating seeds. As in this study they used the RGB color description model in their research [21]. Manickavasagab, A.; Sathya, G.; et al. 2008 in their work on the comparison of wheat identification classes through monochromatic images by means of illumination used a vision machine to record images of wheat samples by analyzing their color and texture. Wheat grains with different humidity content (11%, 14%, 17%, and 20%) were examined. There were 9600 pictures taken. For the evaluation, 32 shades of grey recorded on wheat samples were used. Mean grey values were significantly different within each lighting and with different illumination. The mean value of gray level also depended on grain humidity content [22]. Visen, N.S.; Paliwal, J.; et al. (2004) employed image analysis using a digital camera to recognize different grain species. The research was conducted on five types of grain: barley, oats, rye, wheat, and durum wheat. The images obtained from the digital camera were processed by a computer program that analyzed the data based on color and texture. The results showed the correct classification of over 90% for all types of grain [18]. Li, J.; Liao, G.; Ou, Z.; Jin, J. (2007) used image analysis to classify rapeseed. The color, which was determined using the HSV model, and the shape of seeds were used for evaluation [13]. Majumdar, S.; Jayas, D.S.; Symons, S.J. (1999) used digital image analysis based on the RGB model to evaluate and classify samples of wheat, barley, oats, and rye. The accuracy of the applied method was 98.6% [23]. Mohan, A.L.; Jayas, D.S.; White, N.D.G.; Karunakaran, C. used digital image analysis for volumetric classification of oil and pulses seeds [24]. Gonzales-Barron, U.; Butler, F. (2006) used image analysis to assess the texture of breadcrumbs. The research showed that the texture of breadcrumbs varies according to the type of flour from which the bread was baked. The results were 93% correct [25]. Liu, Z.; Cheng, F.; Ying, Y.; Rao X. (2005) used image analysis and neural networks to classify rice varieties based on morphological characteristics and color [26]. Białobrzewski, I. (2005) and Białobrzewski, I.; Markowski, M.; Bowszys, J. (2005) used neural networks to estimate the relative humidity of atmospheric air based on its temperature. In earlier studies Szwedziak, K. (2019) conducted the evaluation of selected parameters of pea quality using computer image analysis and the obtained results were verified by artificial neural networks using the geostatic function. The obtained results enabled the creation of logically and experimentally developed and tested neural models for the evaluation of pea contamination distribution and confirmed that it is advisable to use them on the basis of color characteristics obtained from the created image analysis software. The application of K function allowed the observation and statistical identification of regularity of contaminant distribution in pea seed mass. The results of grain quality computer analysis indicate that the adopted direction of research is promising. Similar tests were carried out for maize grain but the biggest problem in examining the contaminated fraction was the relatively low quality of the photos resulting from the adopted methodology according to which the photos for this examination concerned a collective sample placed on a Petri dish. In developing the method another solution should be adopted, in particular one in which the sample to be acquired contains at most one layer of grain placed on a contrasting background (preferably blue R0G0B255). Irrespective of these difficulties, a relatively small scatter of the measured values could be observed for each of the grain types, i.e., maize [14,15].K.Swedziak, Ż.Grzywacz et al. (2020) basis of the collected data, a model artificial neural network (ANN) MLP 52-6-3 was created, which, with the use of four independent features, allows us to determine changes in the content of water, protein and gluten in stored wheat. The chosen network returned good error values: learning, below 0.001; testing, 0.015; and validation, 0.008. The obtained results and their interpretation are an important element in the warehouse industry [27]. The research allowed improving the research methodology used in the grain warehouse and optimize management, achieving savings resulting from the time necessary for goods receipt and further production process. On the basis of the performed research, the author concluded that the model values obtained ina unidirectional neural network of multilayer perceptron topology with the time delay, using the backward error propagation algorithm, reflect the nature of empirical changes in relative atmospheric humidity. In the further part of the study, the author demonstrated that the learning algorithm, Bayesian regularization, proved to be one of the best in terms of all analyzed parameters for the assessment of predicted temperature values [28,29].
The implementation of the new innovation process was possible due to the following factors, which had an impact on the economic success of the undertaking:
  • The ability to identify current and prospective innovation needs in terms of process and product innovation [30].
  • The ability to implement innovative projects and technical means of production and innovative products into the systems of innovative end users—customers.
  • Joint R&D work in cooperation with external entities.
  • Ordering R&D work fromexternal entities, employing third-party workers.
  • Exchange of technical knowledge with other scientific centers.
  • Construction of complete prototypes in the company [31].

6. Conclusions

On the basis of the analyses carried out, it was found that neural models for quality assessment of wheat grain contaminants, which were developed and verified logically and experimentally, confirmed that it is advisable to use them on the basis of color characteristics obtained from the image analysis software developed. The application of computer image analysis allowed expediting the assessment of the quality of the examined material compared to traditional methods. This method was of particular importance in the case of the examination of the condition of the seed coat of wheat from the cereal warehouse. The generated models were characterized by good parameters and high quality, obtaining a high R2 coefficient, at the level of 0.999. As part of the investment project savings were made resulting from the receipt time reduction and further production process. Profitability was estimated at 191.43% per day. The analysis was made without taking into account other costs related to the business activity. The straight payback period is 3 years, in the next stages of the research, it is planned to use the convolutional neural networks (CNNs) to identify the type of contaminants, including microorganisms, which appear during cereal storage. Convolutional networks in this case will be able to learn the special characteristics of the image to help in its classification. Their superiority over standard deep networks is greater effectiveness in detecting intricate relationships in images.

Author Contributions

K.S. conceived, designed and performer the experiments; E.P. and M.O. done literature review. M.O. shared the laboratory, materials and analysys tools; P.B. done economic analysis; Ż.G. wrote the discussion of the results and edited an article. All authors contributed equally to this work. All authors have read and agreed to the published version of the manuscript.

Funding

This research received no external funding.

Conflicts of Interest

The authors declare no conflict of interest.

References

  1. FAO. FAO Food Outlook; FAO: Rome, Italy, 2016; p. 139. [Google Scholar]
  2. EU. EU Cereals Balance Sheet 2016/17 and Forecast 2017/18; European Union: Brussels, Belgium, 2016; p. 17. [Google Scholar]
  3. Alexandratos, N.; Bruinsma, J. World agriculture towards 2030/2050: The 2012 revision. In ESA Working Paper Rome; FAO: Rome, Italy, 2012. [Google Scholar]
  4. Godfray, H.C.J.; Garnett, T. Food security and sustainable intensification. Philos. Trans. Biol. Sci. 2014, 369, 273. [Google Scholar] [CrossRef] [PubMed]
  5. Rusinek, R.; Tys, J.; Wroniak, M.; Anders, A. Przechowywanie nasion rzepaku zagrożenia. Autobusy Technika Eksploatacja Systemy Transportowe 2011, 12, 369–374. [Google Scholar]
  6. Nellist, M.E. Bulk storage drying in theory and practice. J. R. Agric. Soc. Engl. 1998, 159. [Google Scholar]
  7. Kręcidło, Ł.; Krzyśko-Łupicka, T. Sensitivity of molds isolated from warehouses of food production facility on selected essential oils. Inżynieria Ekol. 2015, 43, 100–108. [Google Scholar] [CrossRef]
  8. Broda, M.; Grajek, W. Mikroflora ziaren zbóż i metody redukcji skażenia mikrobiologicznego. Zesz. Probl. Post. Nauk Roln. 2009, 2, 19–30. [Google Scholar]
  9. Abdullah, M.Z.; Guan, L.C.; Lim, K.C.; Karim, A.A. The applications of computer vision system and tomographic radar imaging for assessing physical properties of food. J. Food Eng. 2004, 61, 125–135. [Google Scholar] [CrossRef]
  10. Sànchez, A.J.; Albarracin, W.; Grau, R.; Ricolfe, C.; Barat, J.M. Control of ham salting by using image segmentation. Food Control 2008, 19, 135–142. [Google Scholar] [CrossRef]
  11. Du, C.J.; Sun, D.-W. Correlating shrinkage with yield, water content and texture of pork ham by computer vision. J. Food Process. Eng. 2005, 28, 219–232. [Google Scholar] [CrossRef]
  12. Iqbal, A.; Valous, N.A.; Mendoza, F.; Sun, D.-W.; Allen, P. Classification of presliced pork and Turkey ham qualities based on image color and textural features and their relationships with consumer responses. Meat Sci. 2010, 84, 455–465. [Google Scholar] [CrossRef]
  13. Li, J.; Liao, G.; Ou, Z.; Jin, J. Rapeseed seeds classification by machine vision. In Proceedings of the Workshop on Intelligent Information Technology Application (IITA 2007), Zhang Jiajie, China, 2–3 December 2007. [Google Scholar]
  14. Szwedziak, K. Artifical neutral networks and computer image analysis of selected quality parameters of pea seeds. E3S Web Conf. 2019, 132, 1027. [Google Scholar] [CrossRef] [Green Version]
  15. Szwedziak, K. The use of vision techniques for the evaluation of selected quality parameters of maize grain during storage. E3S Web Conf. 2019, 132, 01026. [Google Scholar] [CrossRef] [Green Version]
  16. Chai, T. Industrial process control systems: Research ststus and development direction. Sci. Sin. Inf. 2016, 46. [Google Scholar] [CrossRef] [Green Version]
  17. Qian, F.; Zhong, W.; Du, W. Fundamental theories and key technologies for smart and optimal manufacturing in the process industry. Engineering 2017, 3, 154–160. [Google Scholar] [CrossRef]
  18. Visen, N.S.; Paliwal, J.; Jayas, D.S.; White, N.D.G. Image analysis of bulk grain samples using neural networks. Can. Biosyst. Eng. 2004, 46, 11–15. [Google Scholar]
  19. Wilson, A.D.; Baietto, M. Applications and Advances in Electronic-Nose Technologies. Sensors 2009, 9, 5099–5148. [Google Scholar] [CrossRef]
  20. Brattoli, M.; Cisternino, E.; Dambruoso, P.R.; de Gennaro, G.; Giungato, P.; Mazzone, A.; Palmisani, J.; Tutino, M. Gas Chromatography Analysis with Olfactometric Detection (GC-O) as a Useful Methodology for Chemical Characterization of Odorous Compounds. Sensors 2013, 13, 16759–16800. [Google Scholar] [CrossRef] [Green Version]
  21. Mladenov, M.; Dejanov, M. Analysis of the possibilities for separator color and texture features. In Proceedings of the International Conference on Computer Systems and Technologies, Rousse, Bulgaria, 17–18 June 2004. [Google Scholar]
  22. Manickavasagab, A.; Sathya, G.; Jayas, D.S.; White, N.D.G. Wheat class identification using monochrome images. J. Cereal Sci. 2008, 47, 518–527. [Google Scholar] [CrossRef]
  23. Majumdar, S.; Jayas, D.S.; Symons, S.J. Textural features for grain identification. Agric. Eng. J. 1999, 8, 213–222. [Google Scholar]
  24. Mohan, A.L.; Jayas, D.S.; White, N.D.G.; Karunakaran, C. Classification of bulk oilseeds, specialty seeds and pulses using their reflectance characteristics. In Proceedings of the International Quality Grains, Indianapolis; Purdue University: Indianapolis, IN, USA, 2004; Available online: https://books.google.de/books/about/Proceedings_of_the_2004_International_Qu.html?id=G_W2DAEACAAJ&redir_esc=y (accessed on 13 August 2020).
  25. Gonzales-Barron, U.; Butler, F. Statistical and spectral texture analysis methods for discrimination of bread crumb images. In Proceedings of the IUFoST World Congres of Food Science and Technology, Nantes, France, 17–21 September 2006. [Google Scholar]
  26. Liu, Z.; Cheng, F.; Ying, Y.; Rao, X. Identification of rice seed varieties using neural network. J. Zhejiang Univ. Sci. 2005, 6, 1095–1100. [Google Scholar] [CrossRef] [Green Version]
  27. Szwedziak, K.; Polańczyk, E.; Grzywacz, Ż.; Niedbała, G.; Wojtkiewicz, W. Neural Modeling of the Distribution of Protein, Water and Gluten in Wheat Grains during Storage. Sustainability 2020, 12, 5050. [Google Scholar] [CrossRef]
  28. Białobrzewski, I. Wykorzystanie sieci neuronowej do estymacji wartości wilgotności względnej powietrza na podstawie wartości jego temperatury. Inżynieria Rol. 2005, 1, 15–22. [Google Scholar]
  29. Białobrzewski, I.; Markowski, M.; Bowszys, J. Symulacyjny model zmian pola temperatury w silosie zbożowym. Inżynieria Rol. 2005, 8, 23–30. [Google Scholar]
  30. Dworczak, M.; Szlasa, R. Wpływ Innowacji na Wzrost Konkurencyjności Przedsię-Biorstw. Zarzadzanie Innowacjami; Oficyna Wydawnicza Politechniki Warszawskiej: Warsaw, Poland, 2001; pp. 177–180. [Google Scholar]
  31. Kolarz, M. Wpływ Zagranicznych Inwestycji Bezpośrednich na Innowacyjność Przedsiębiorstw w Polsce; Wydawnictwo Uniwersytetu Śląskiego: Katowice, Poland, 2006. [Google Scholar]
Figure 1. The multichamber probe for sampling. [Source: K. Szwedziak].
Applsci 10 05721 g001
Figure 2. The computer image analysis stand. [Source: Katarzyna Szwedziak].
Applsci 10 05721 g002
Figure 3. Block diagram of granular material evaluation technology [Source: own study].
Applsci 10 05721 g003
Figure 4. Image before segmentation [own source].
Applsci 10 05721 g004
Figure 5. The analysis of digital image of wheat grain contamination for a randomly selected sample [own source].
Applsci 10 05721 g005
Figure 6. Fitting of models to predicted data [own source].
Applsci 10 05721 g006
Figure 7. The graph of fitting of empirical data of percentage of contaminants in wheat seeds obtained by means of image analysis with empirical data obtained by traditional method (by weight—sieve) [own source].
Applsci 10 05721 g007
Figure 8. Architecture of MLP neural network model [own source].
Applsci 10 05721 g008
Table 1. Characteristics of Five Generated Neural Network Models for the Variant of Contamination in Wheat Grain Weight [Own Source].
Type of NetworkNetwork DiagramQuality of LearningQuality of ValidationQuality of TestingLearning ErrorValidation ErrorTesting ErrorNumber of Input NodesNumber of Hidden Layers
Linear1:1-1:10.9691.0071.0010.2830.1790.7081.0
MLP1:1-11-1:11.1510.990.990.3400.1420.7901.11
MLP1:1-11-1:11.2930.970.990.3780.1410.7751.11
RBF1:1-2-1:30.6780.5650.8250.1060.0470.2661.2
RBF1:1-3-1:10.6240.3250.6870.090.0290.2451.3
Table 2. The Profitability Analysis of the Project.
Time to Perform the TaskThe Laboratory Is Able to Handle Shipments of 20 t of GrainOperating Profit
PLN/Day
Traditional method15 min68 times16,324
New vision method3/5 min204 times31,248.80
Table 3. Correlation Coefficient for Individual Types of Generated Neural Networks [Own Source].
Model TypeMLPLinearRBFRBFMLP
Correlation coefficient0.980.990.980.950.45