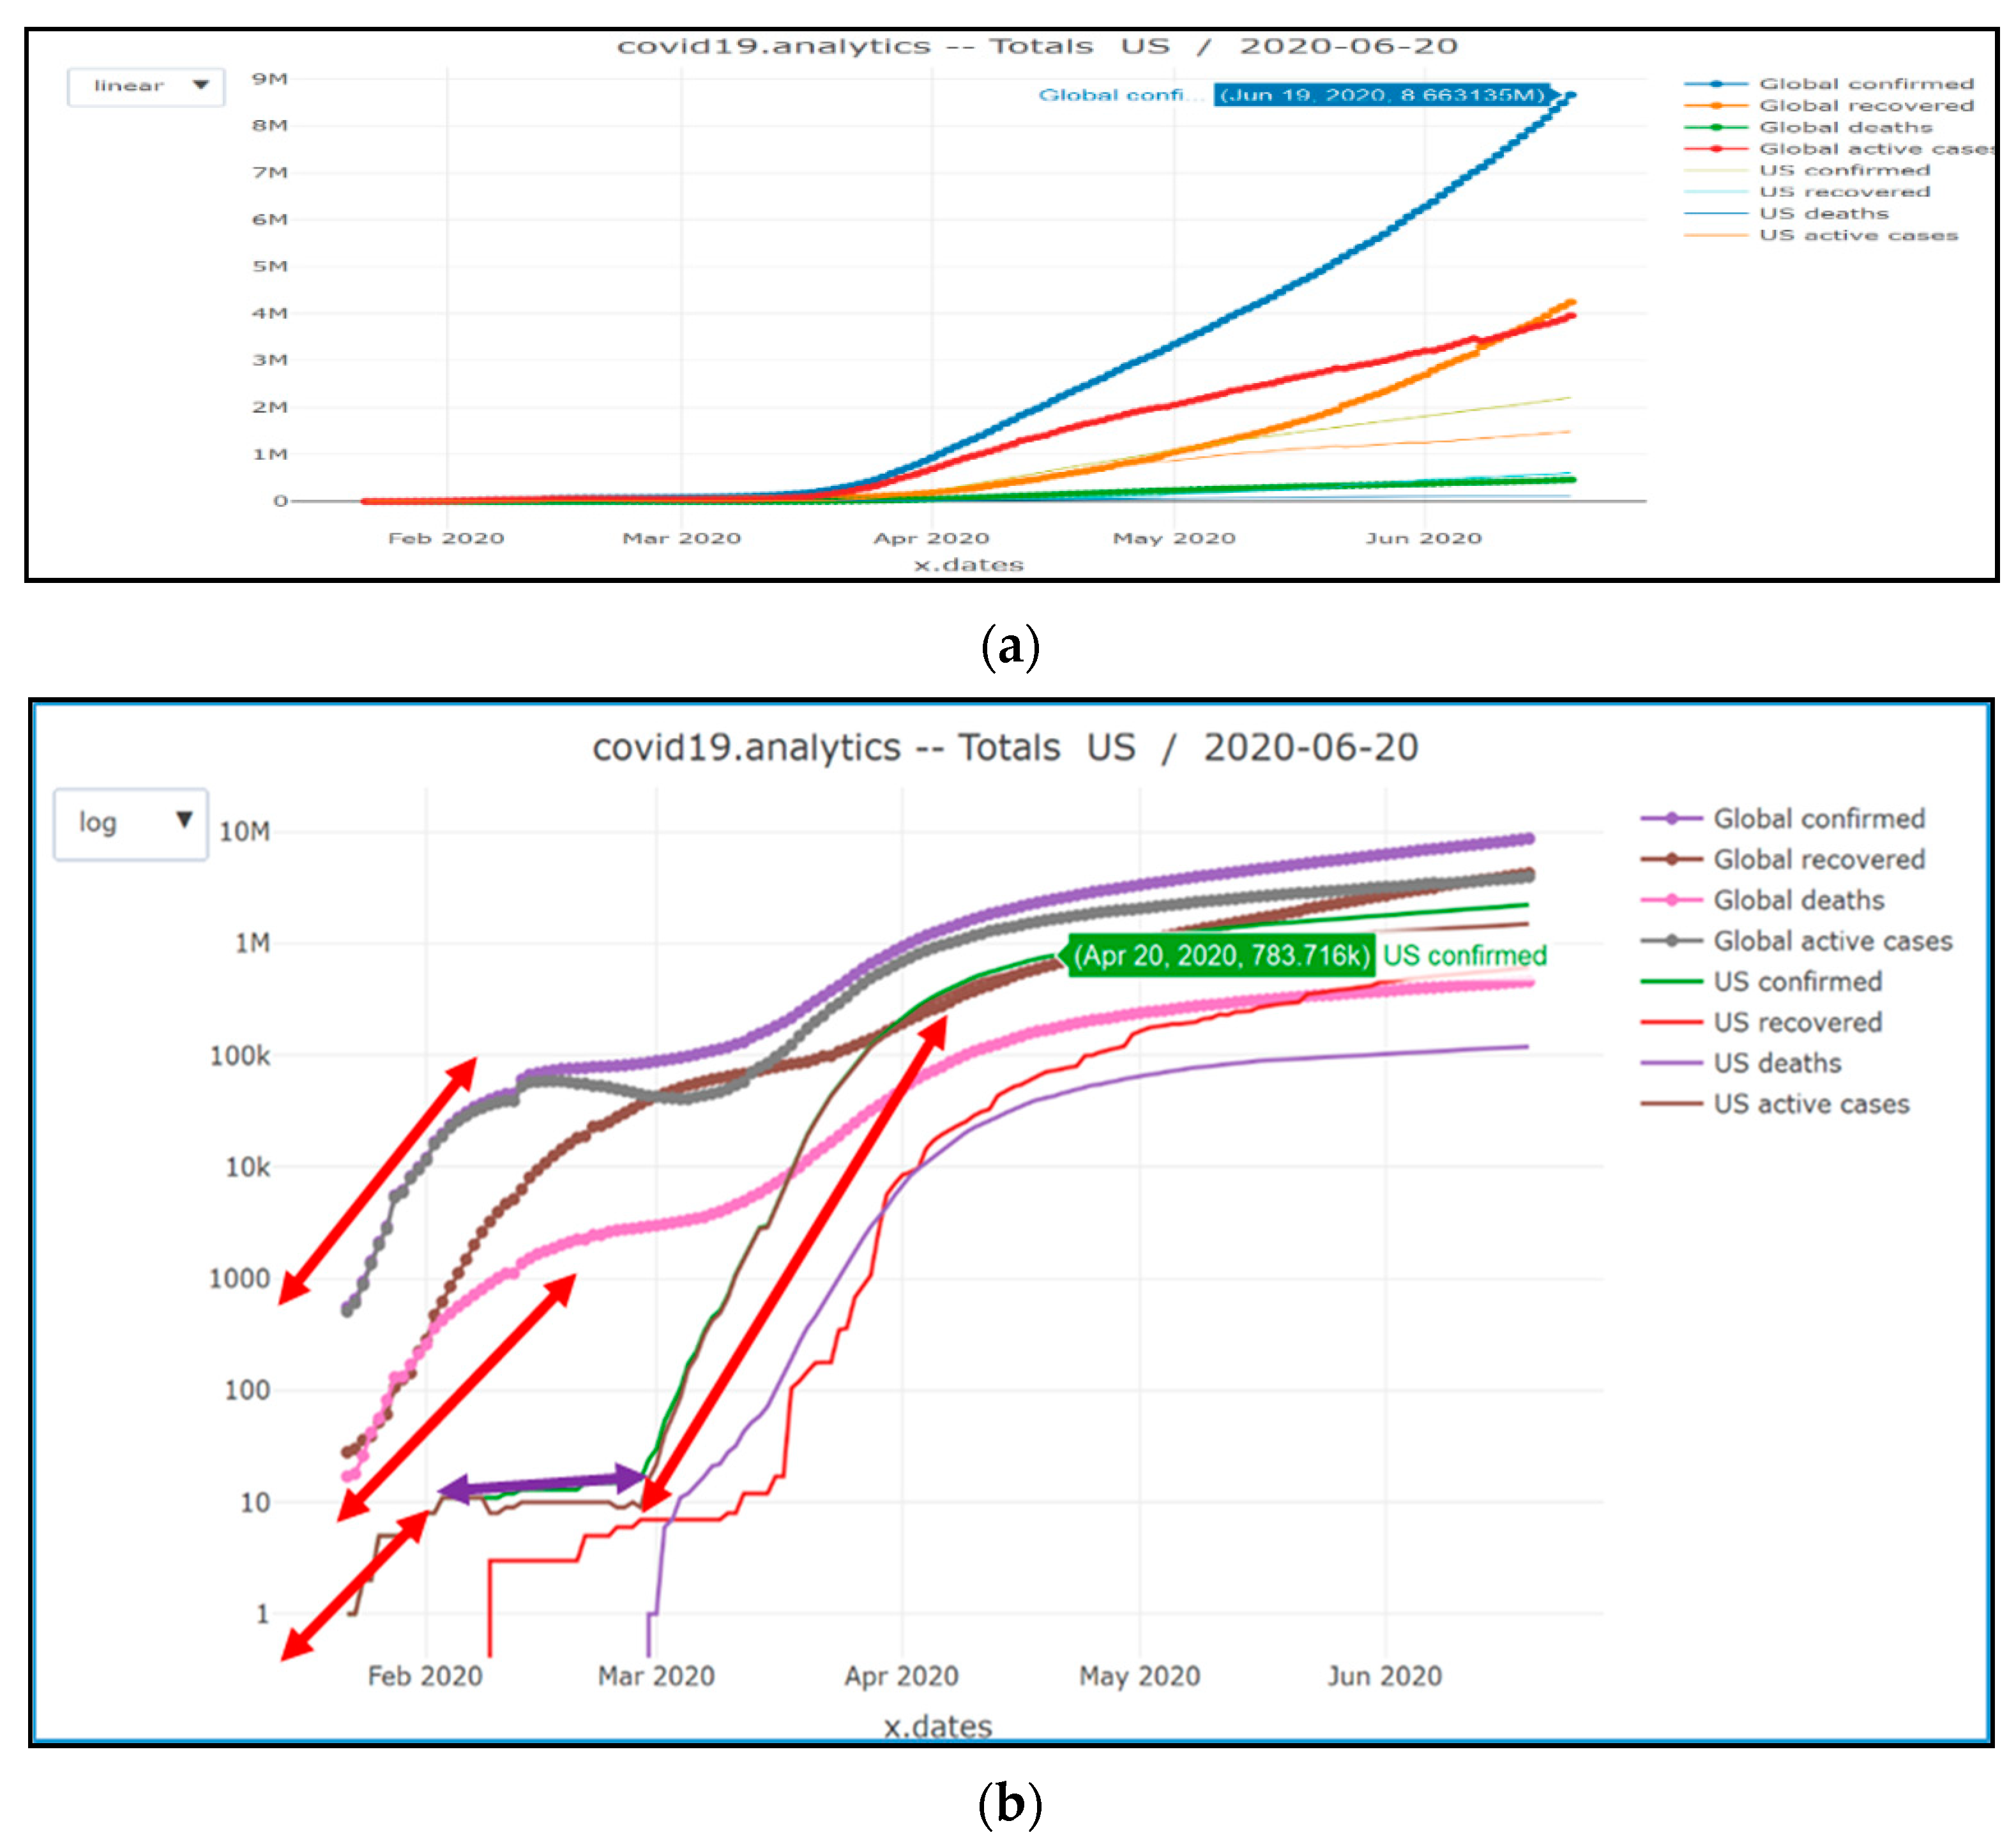
Figure 1.
Number of confirmed/recovered/active and death cases in the US compared to the global cases: (a) linear scale; (b) logarithmic scale.
Figure 1.
Number of confirmed/recovered/active and death cases in the US compared to the global cases: (a) linear scale; (b) logarithmic scale.
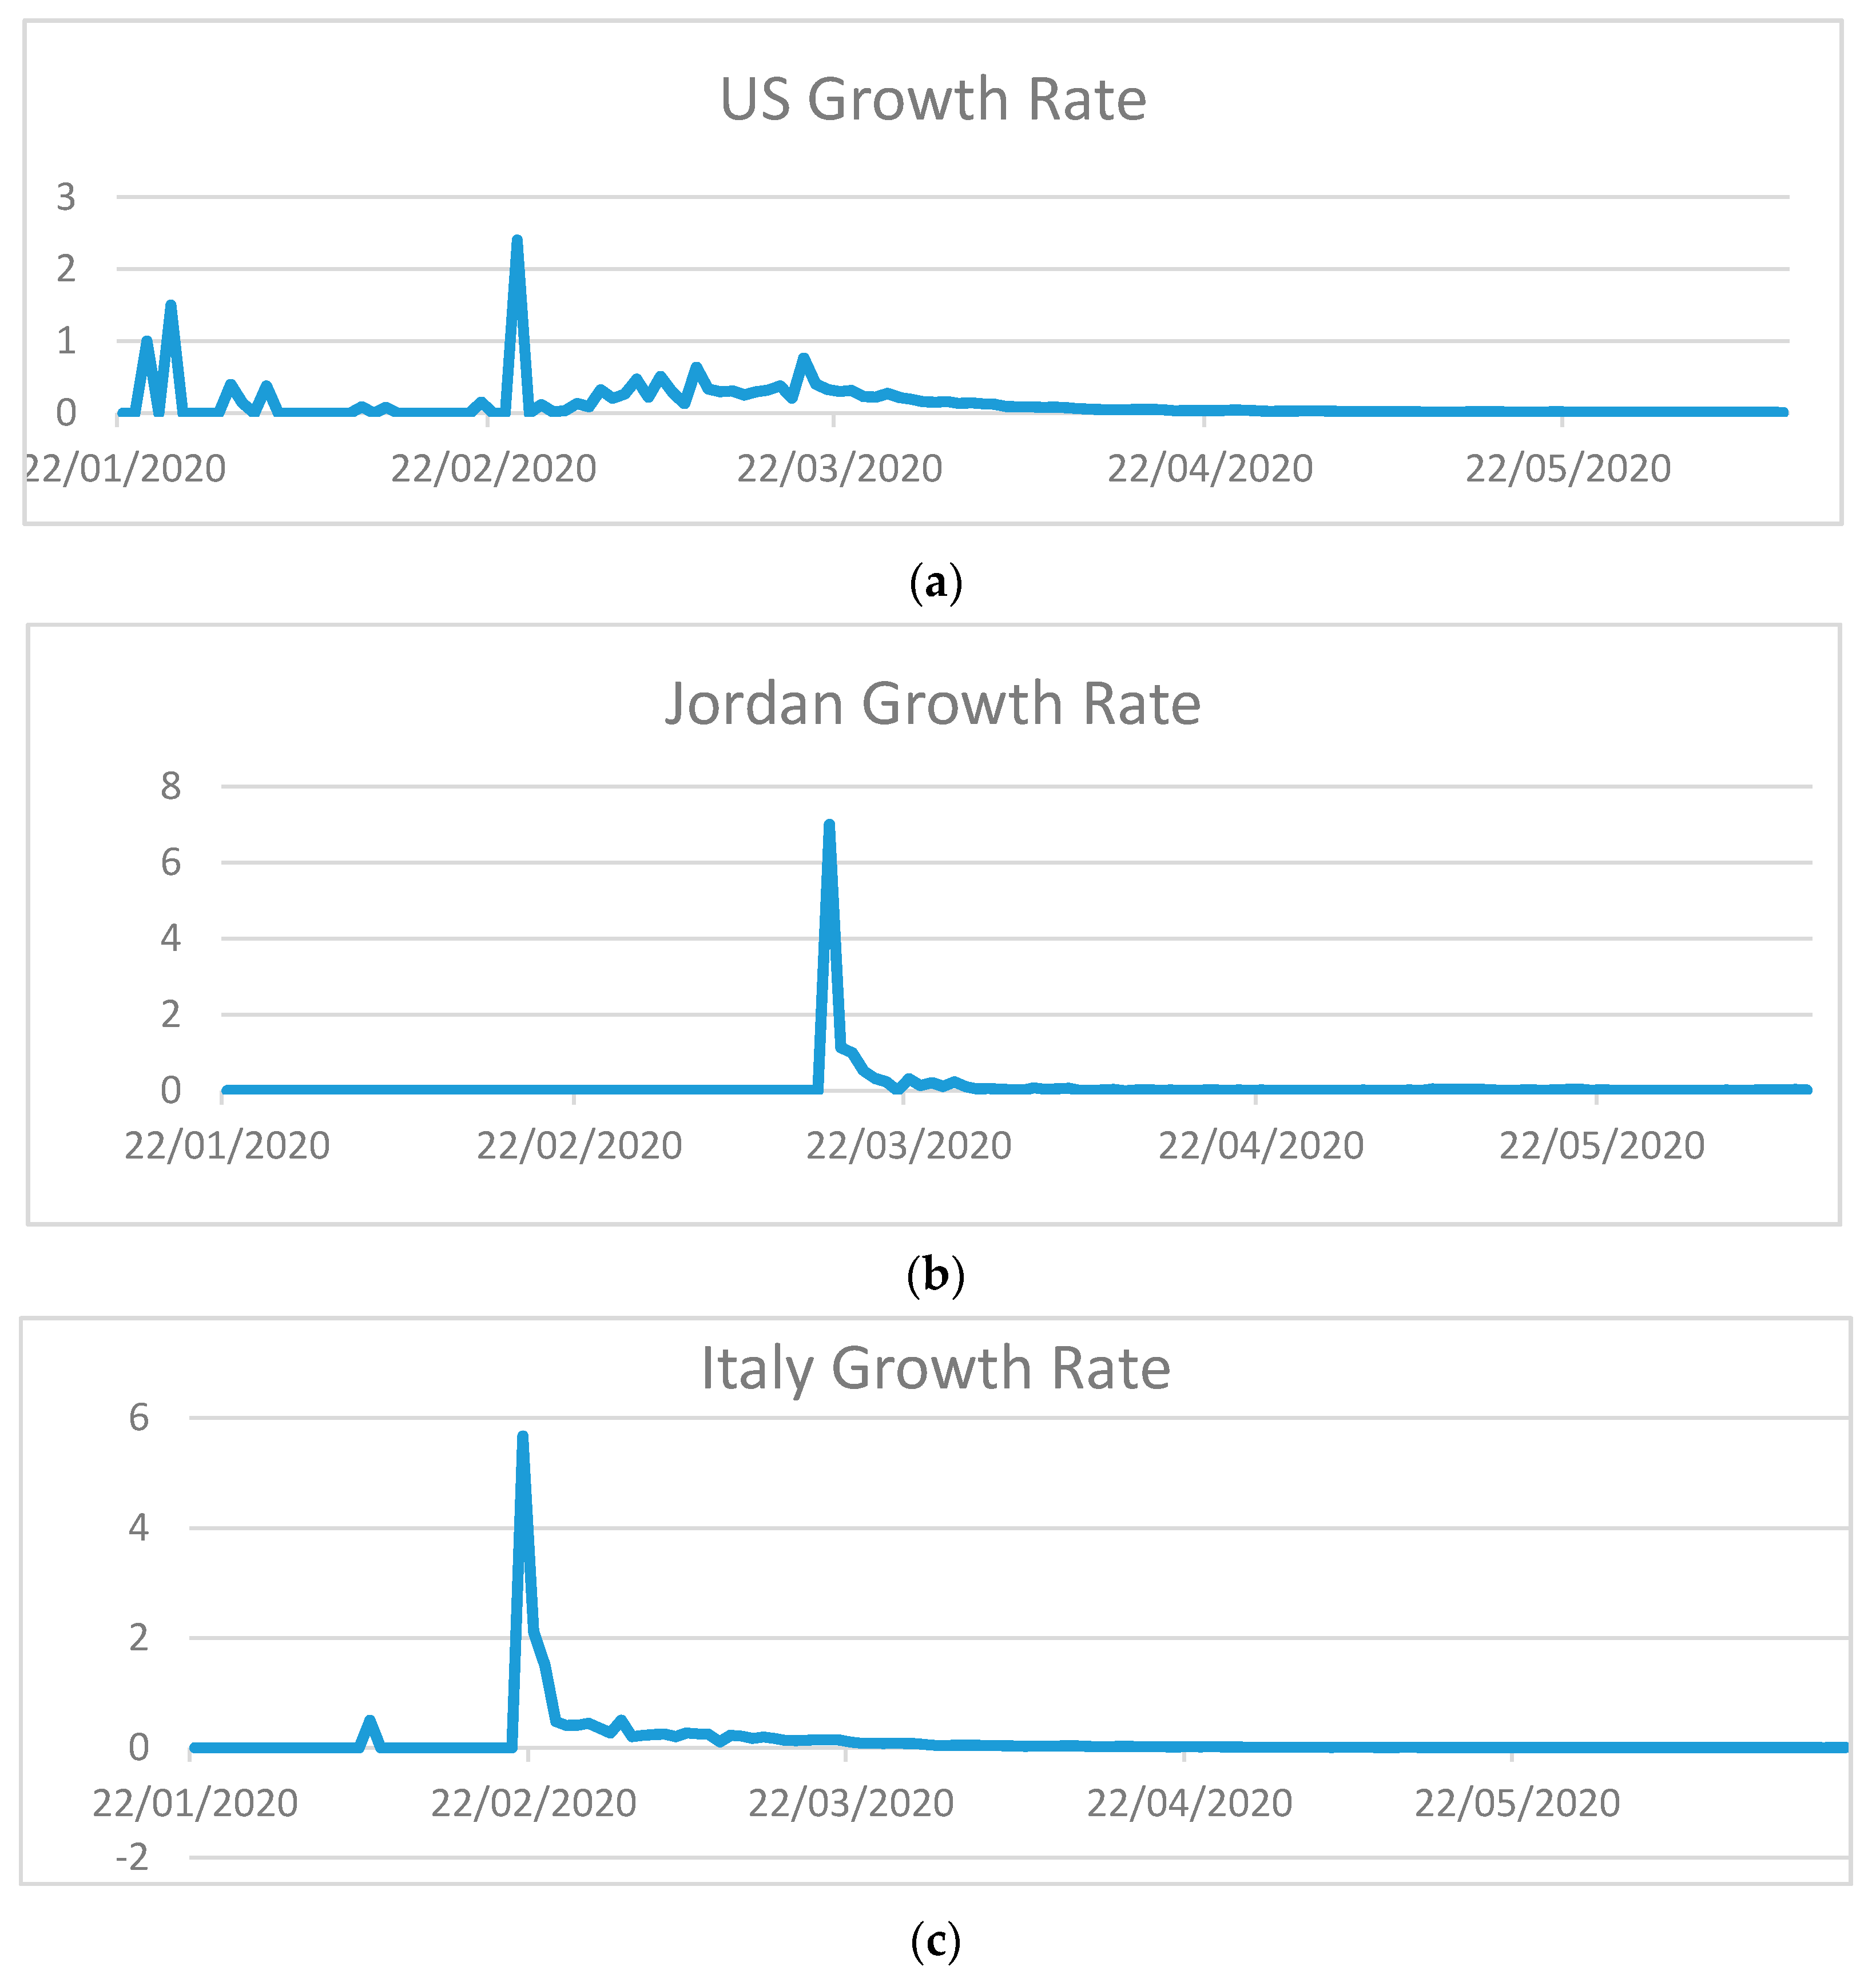
Figure 2.
Confirmed cases growth rate in (a) US; (b) Jordan; (c) Italy.
Figure 2.
Confirmed cases growth rate in (a) US; (b) Jordan; (c) Italy.
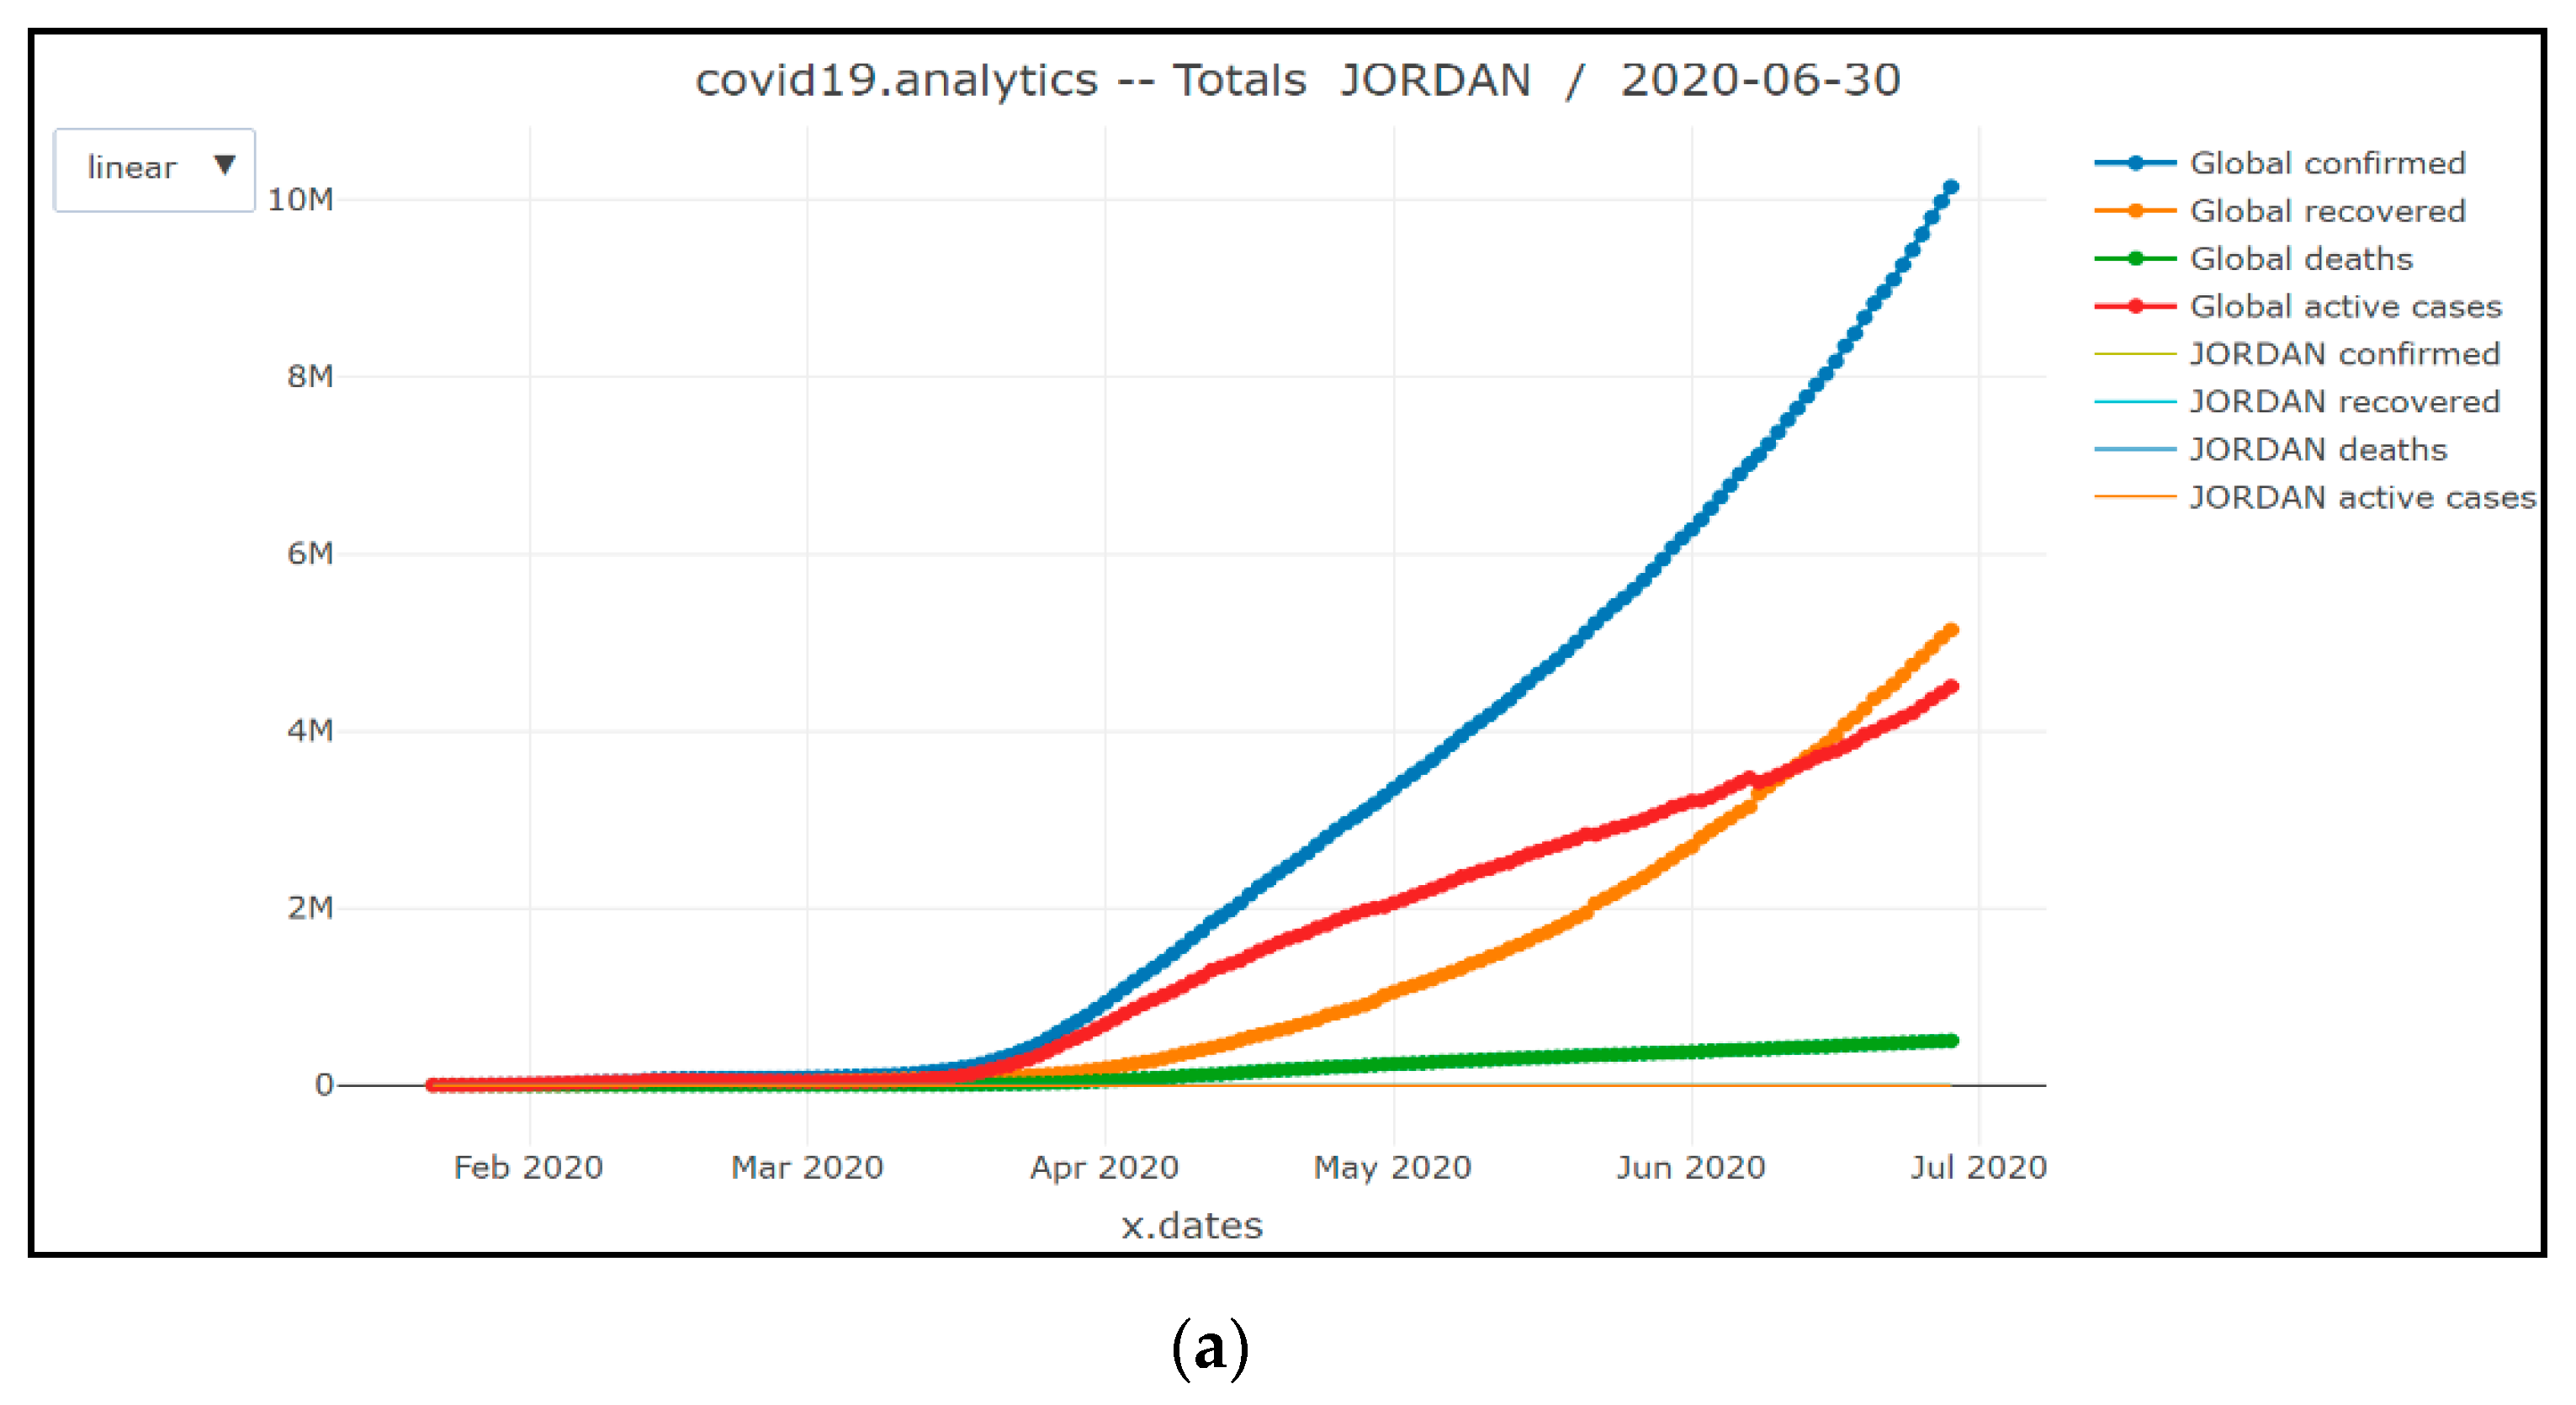
Figure 3.
Number of confirmed/recovered/active and death cases in Jordan compared to the global cases: (a) linear scale; (b) logarithmic scale.
Figure 3.
Number of confirmed/recovered/active and death cases in Jordan compared to the global cases: (a) linear scale; (b) logarithmic scale.
Figure 4.
Number of confirmed/recovered/active and death cases in Italy compared to the global cases: (a) linear scale; (b) logarithmic scale.
Figure 4.
Number of confirmed/recovered/active and death cases in Italy compared to the global cases: (a) linear scale; (b) logarithmic scale.
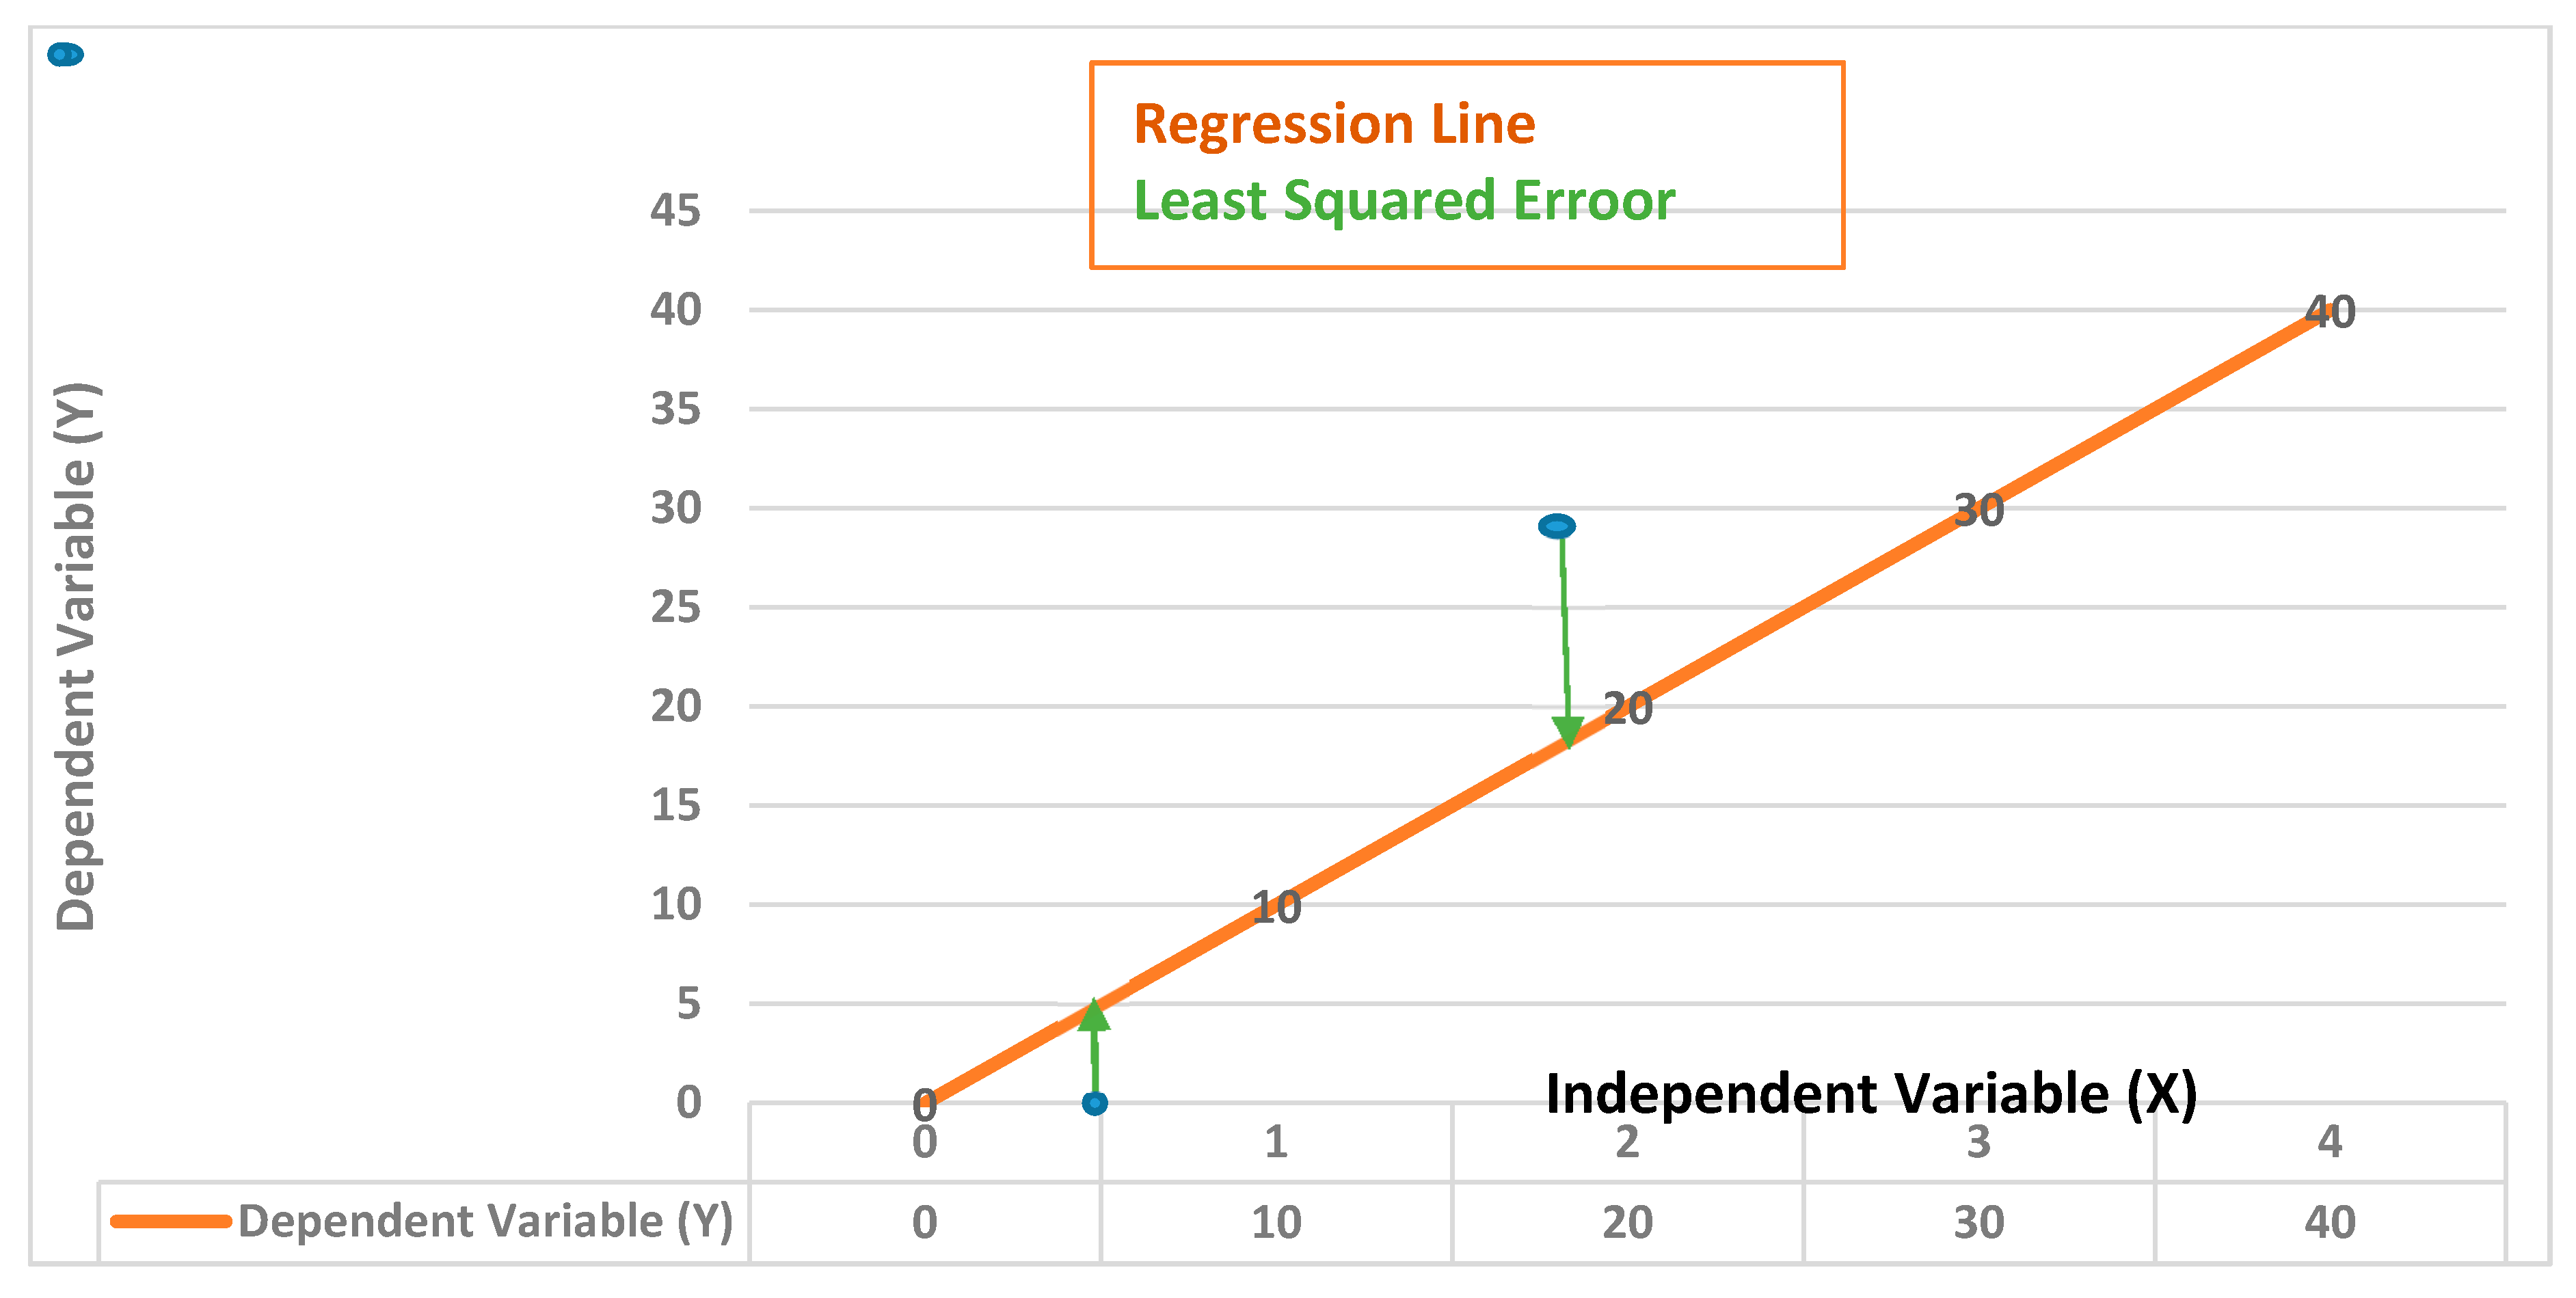
Figure 5.
Linear Regression Model.
Figure 5.
Linear Regression Model.
Figure 6.
SIR (Susceptible, Infected, and Removed) Model Components.
Figure 6.
SIR (Susceptible, Infected, and Removed) Model Components.
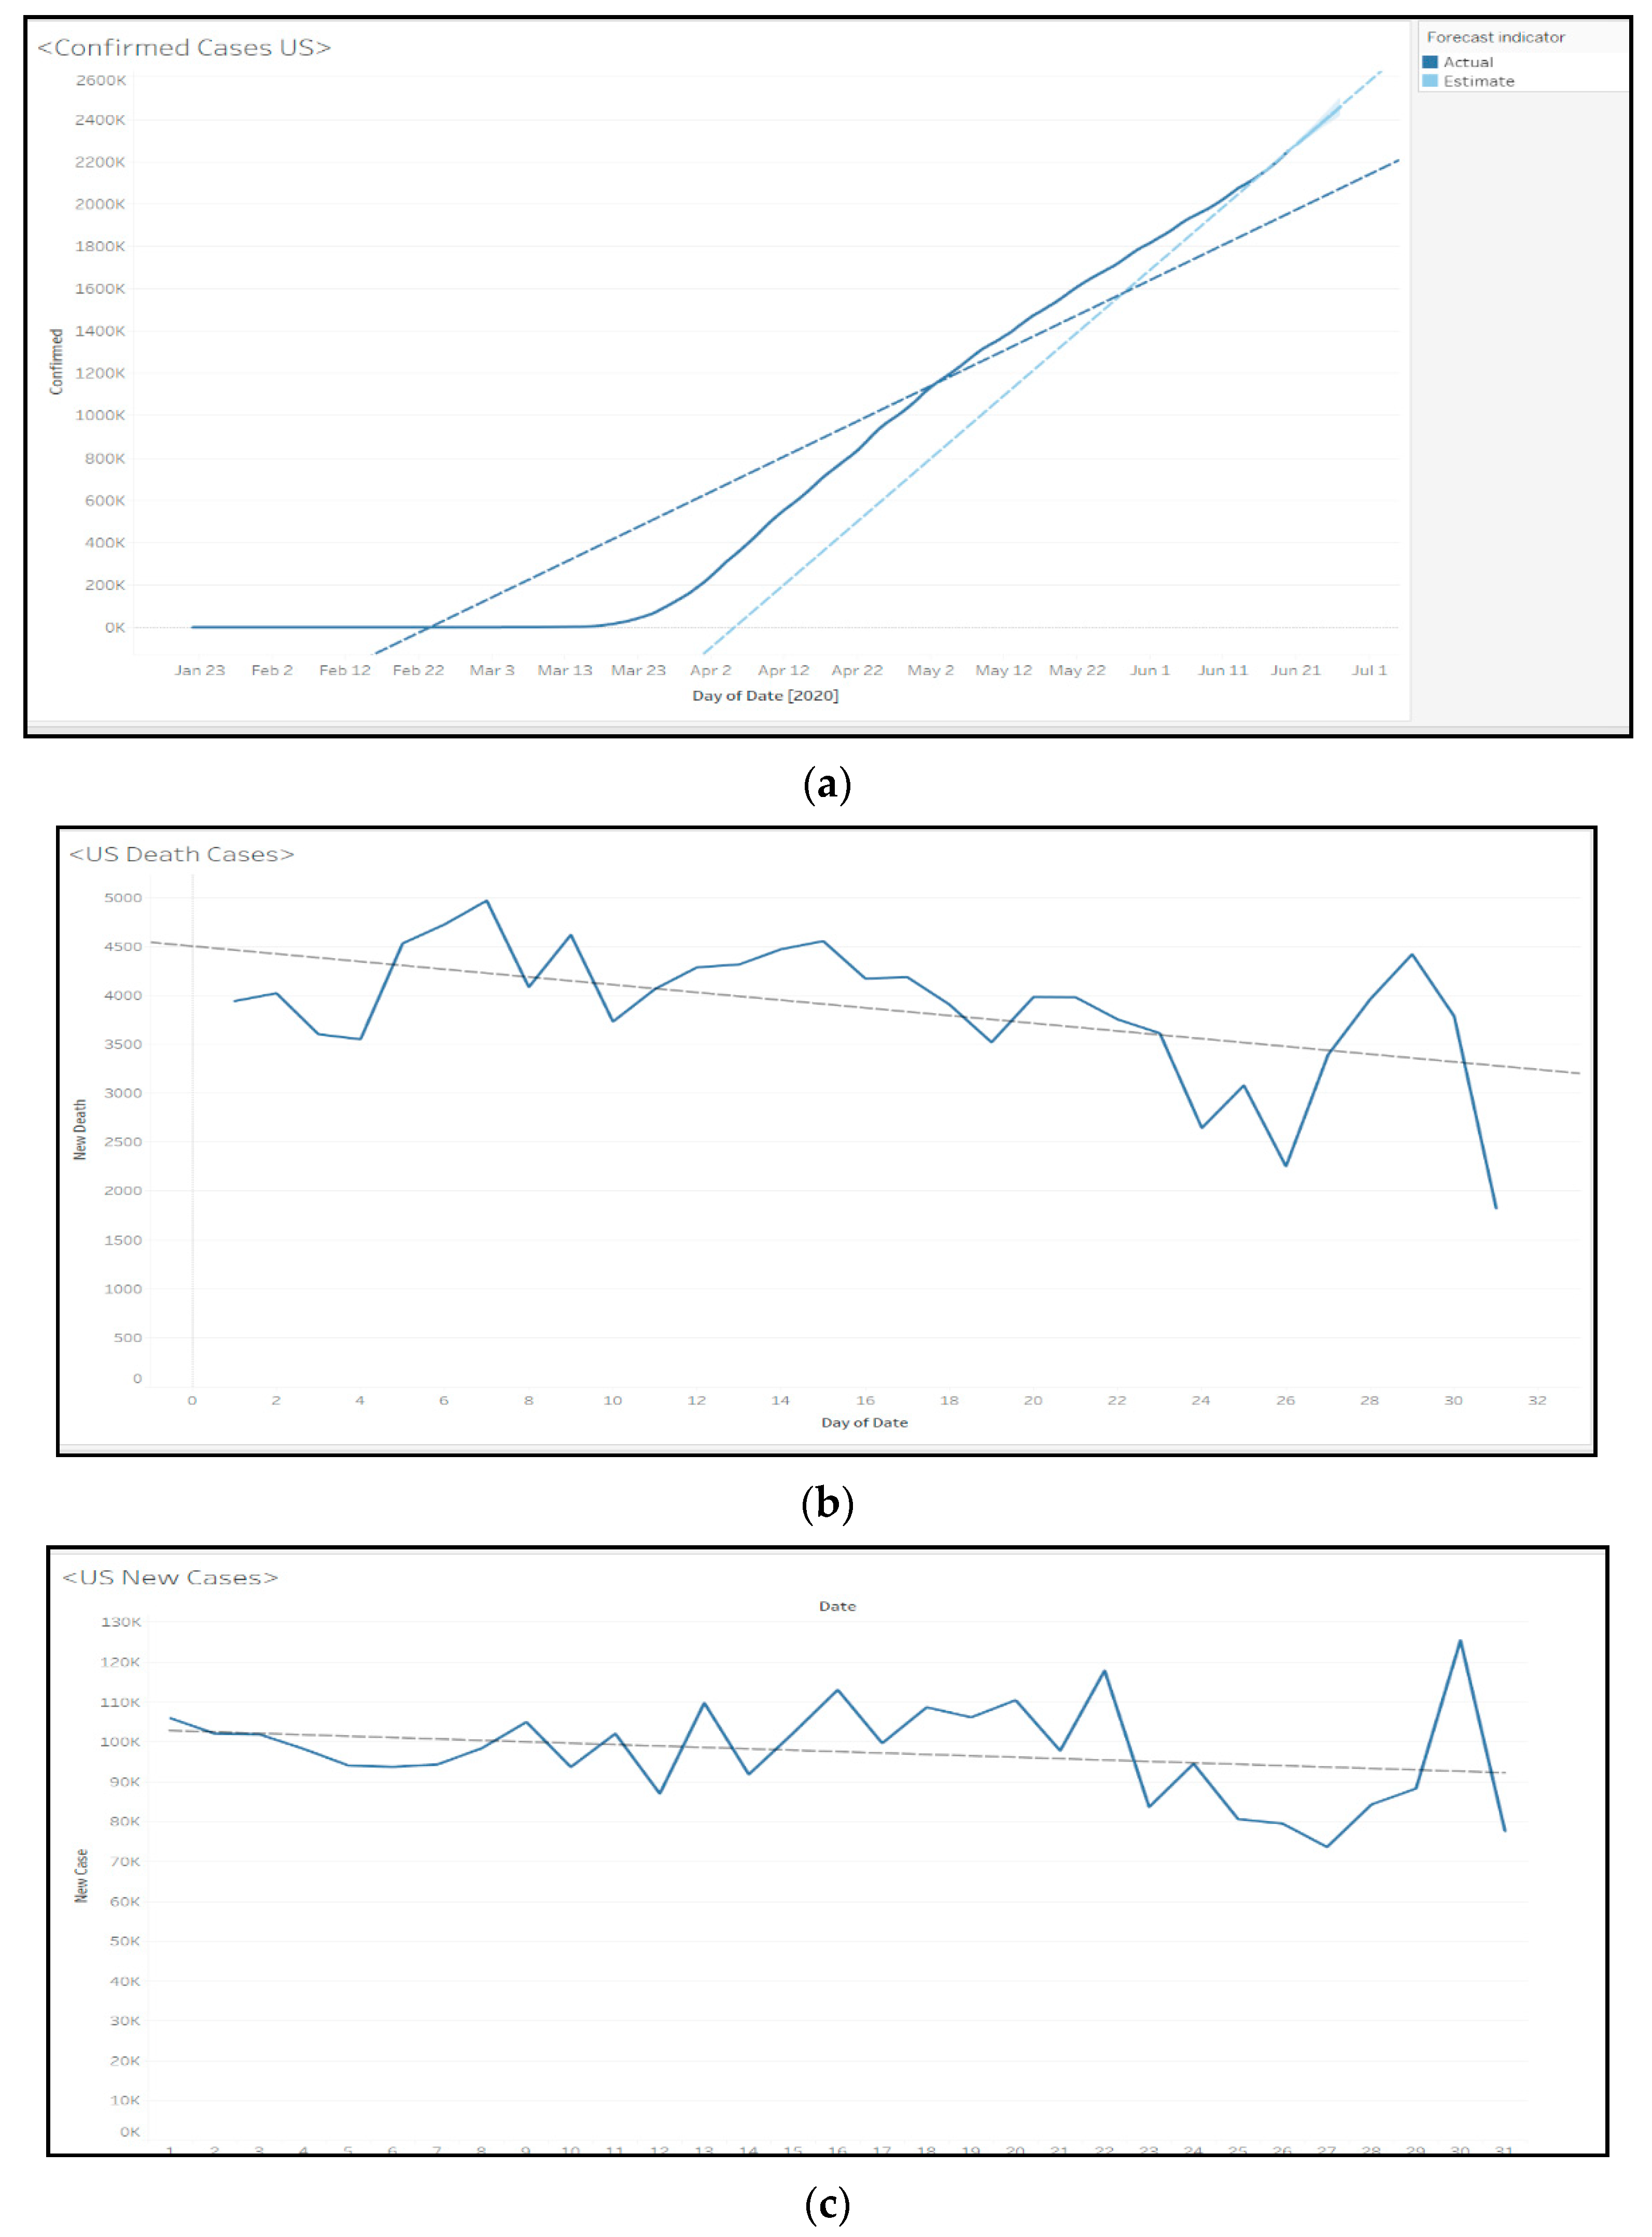
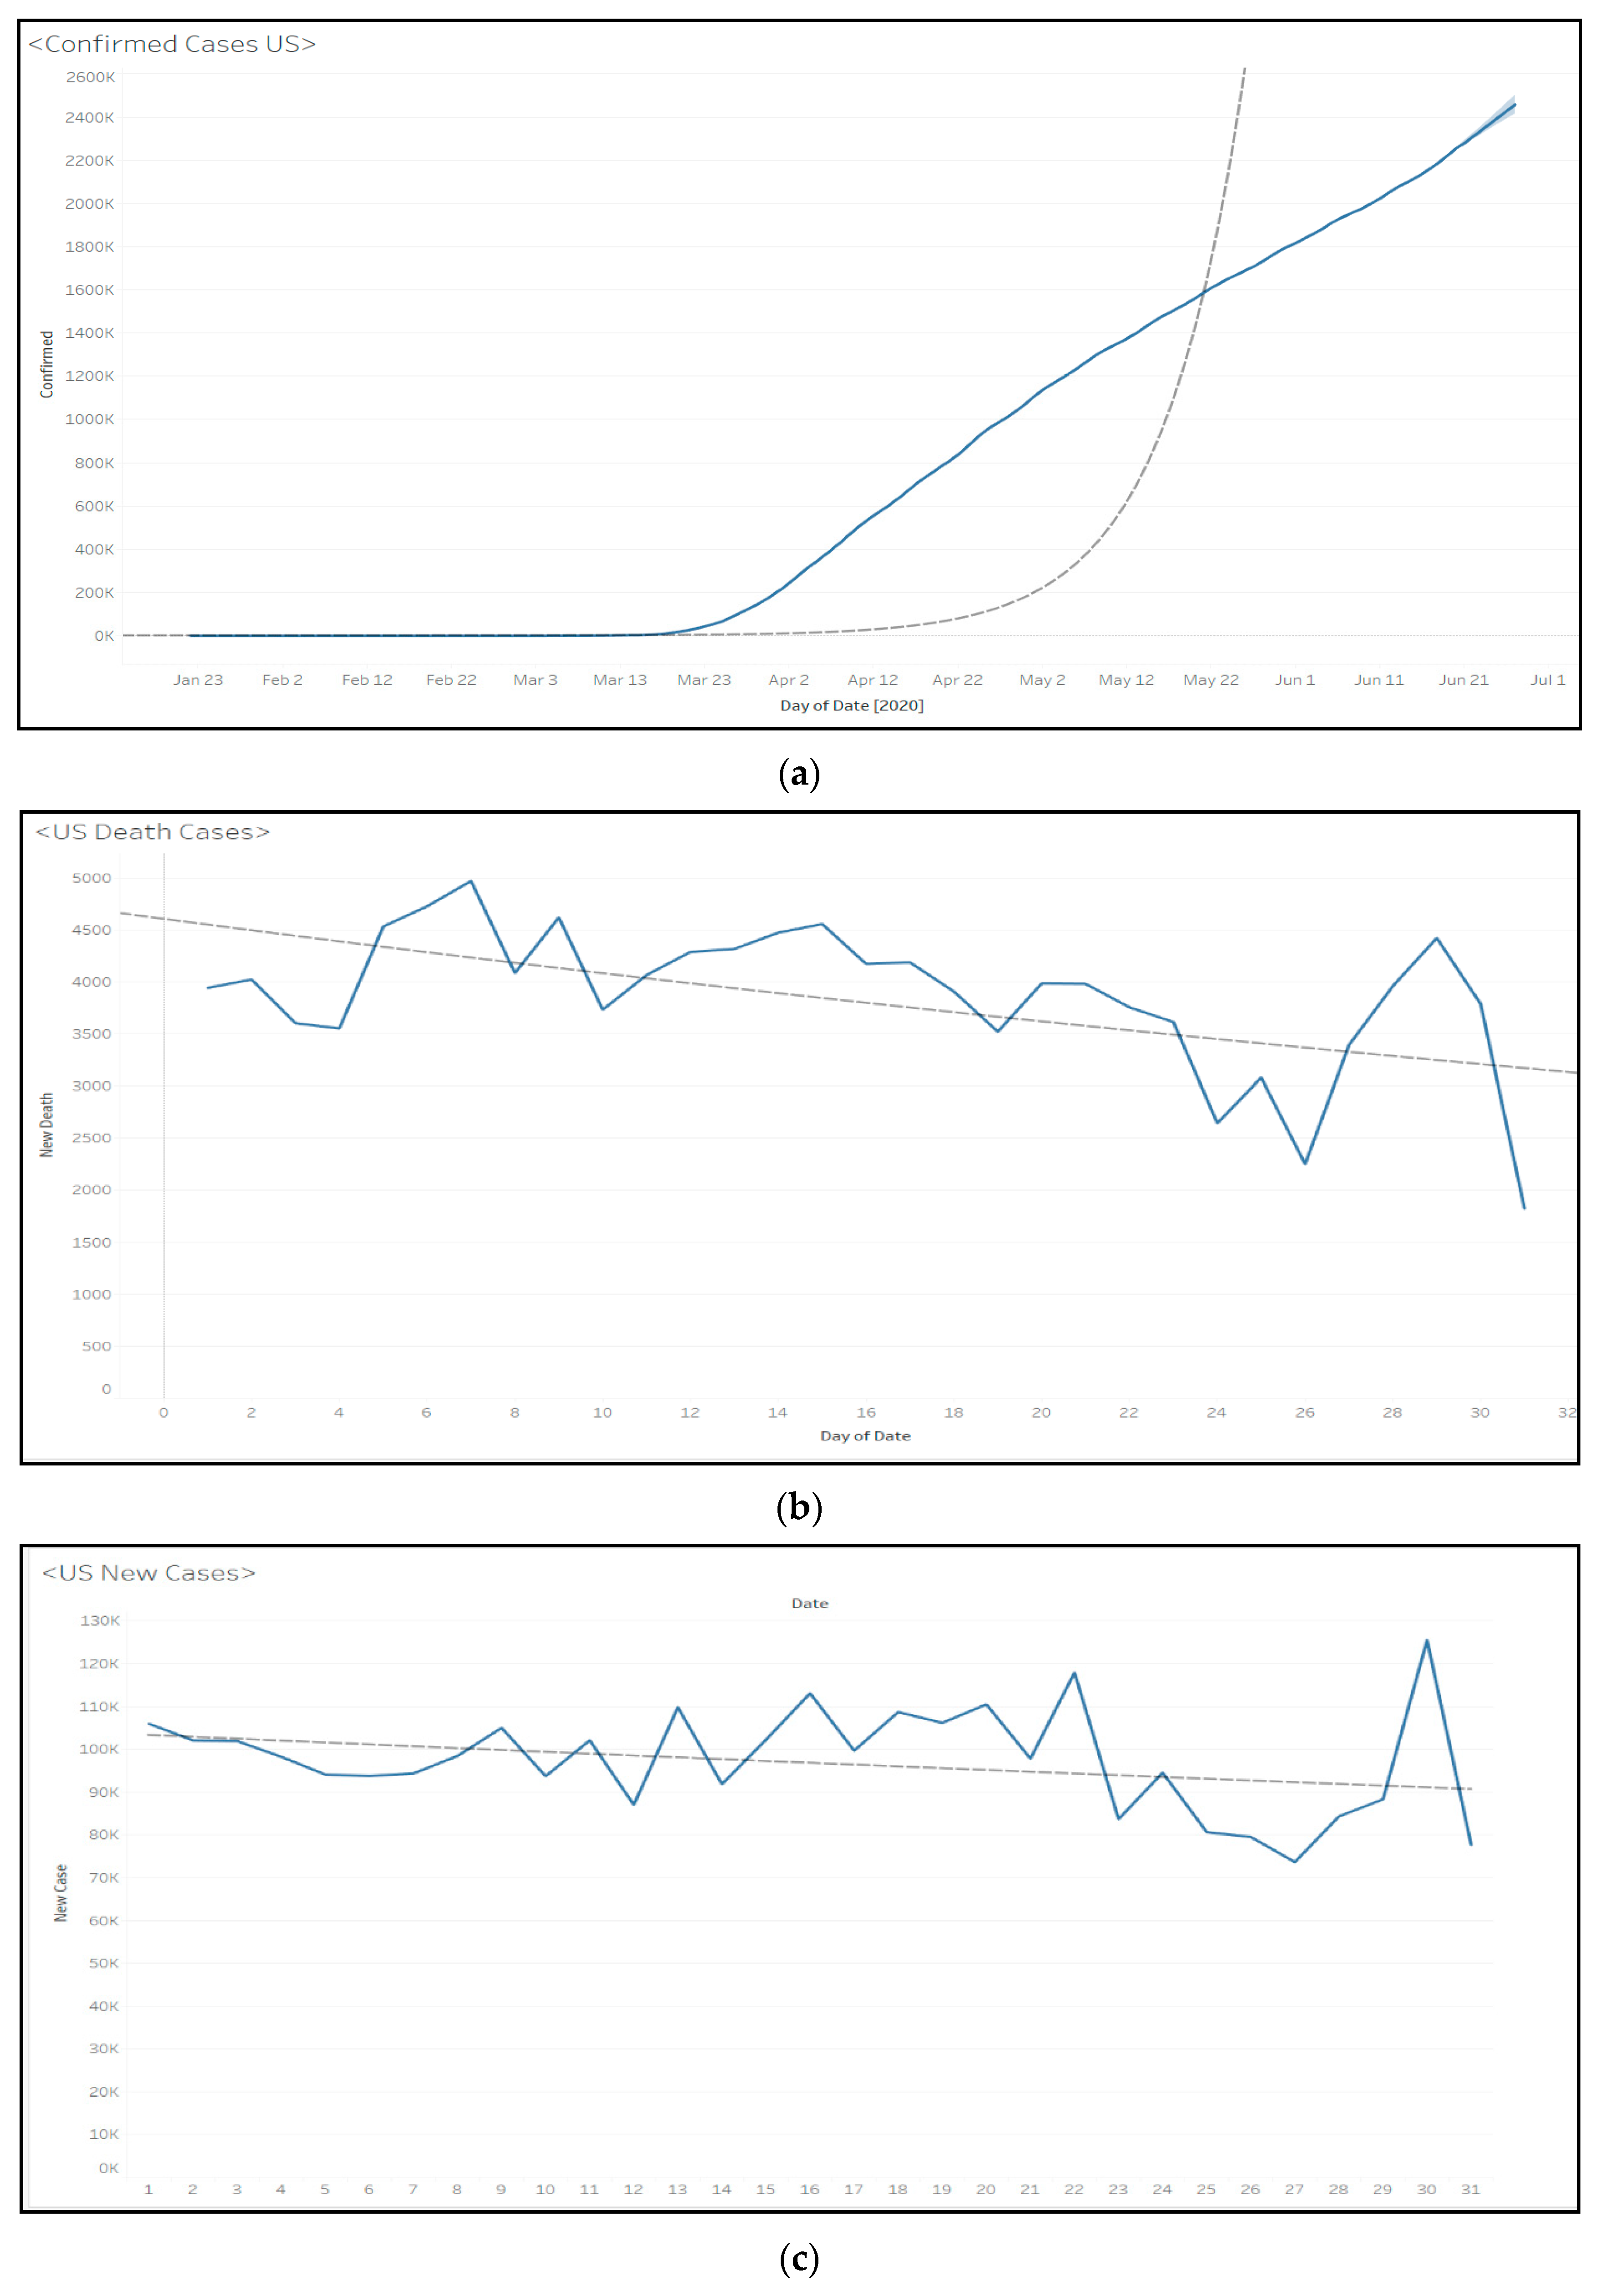
Figure 7.
Linear regression model results for (a) confirmed cases; (b) death cases, and (c) new cases in the US.
Figure 7.
Linear regression model results for (a) confirmed cases; (b) death cases, and (c) new cases in the US.
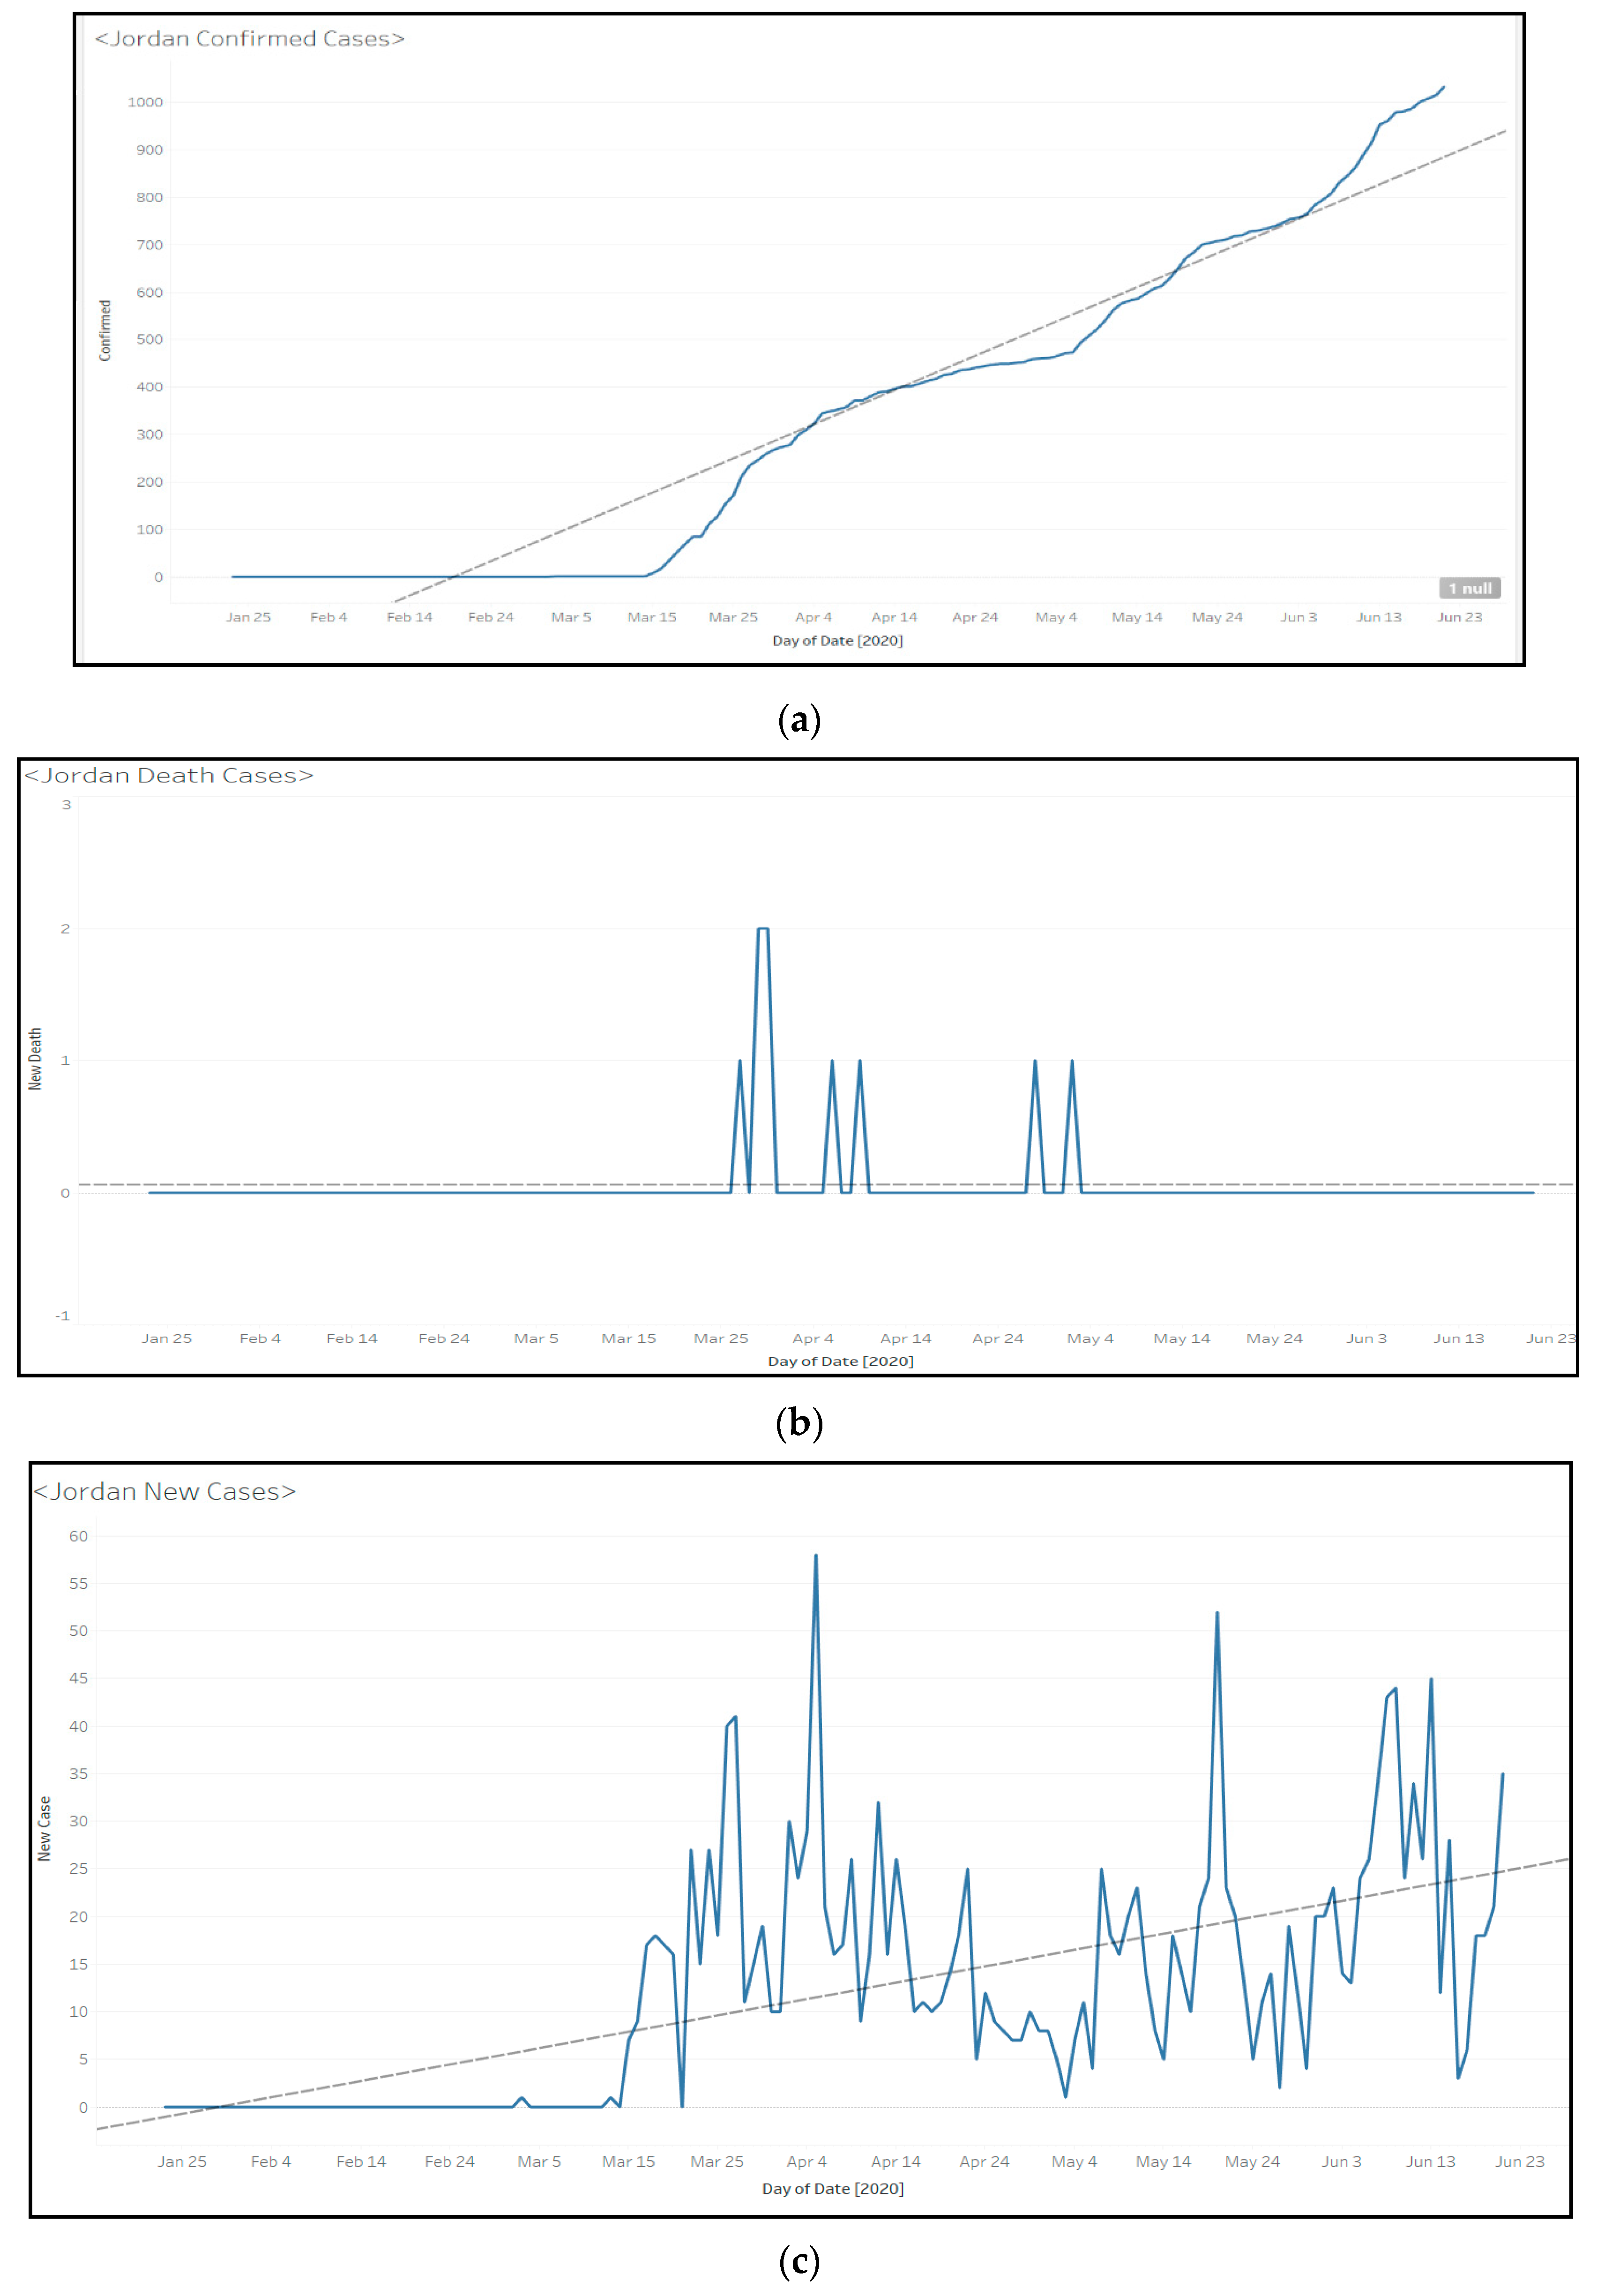
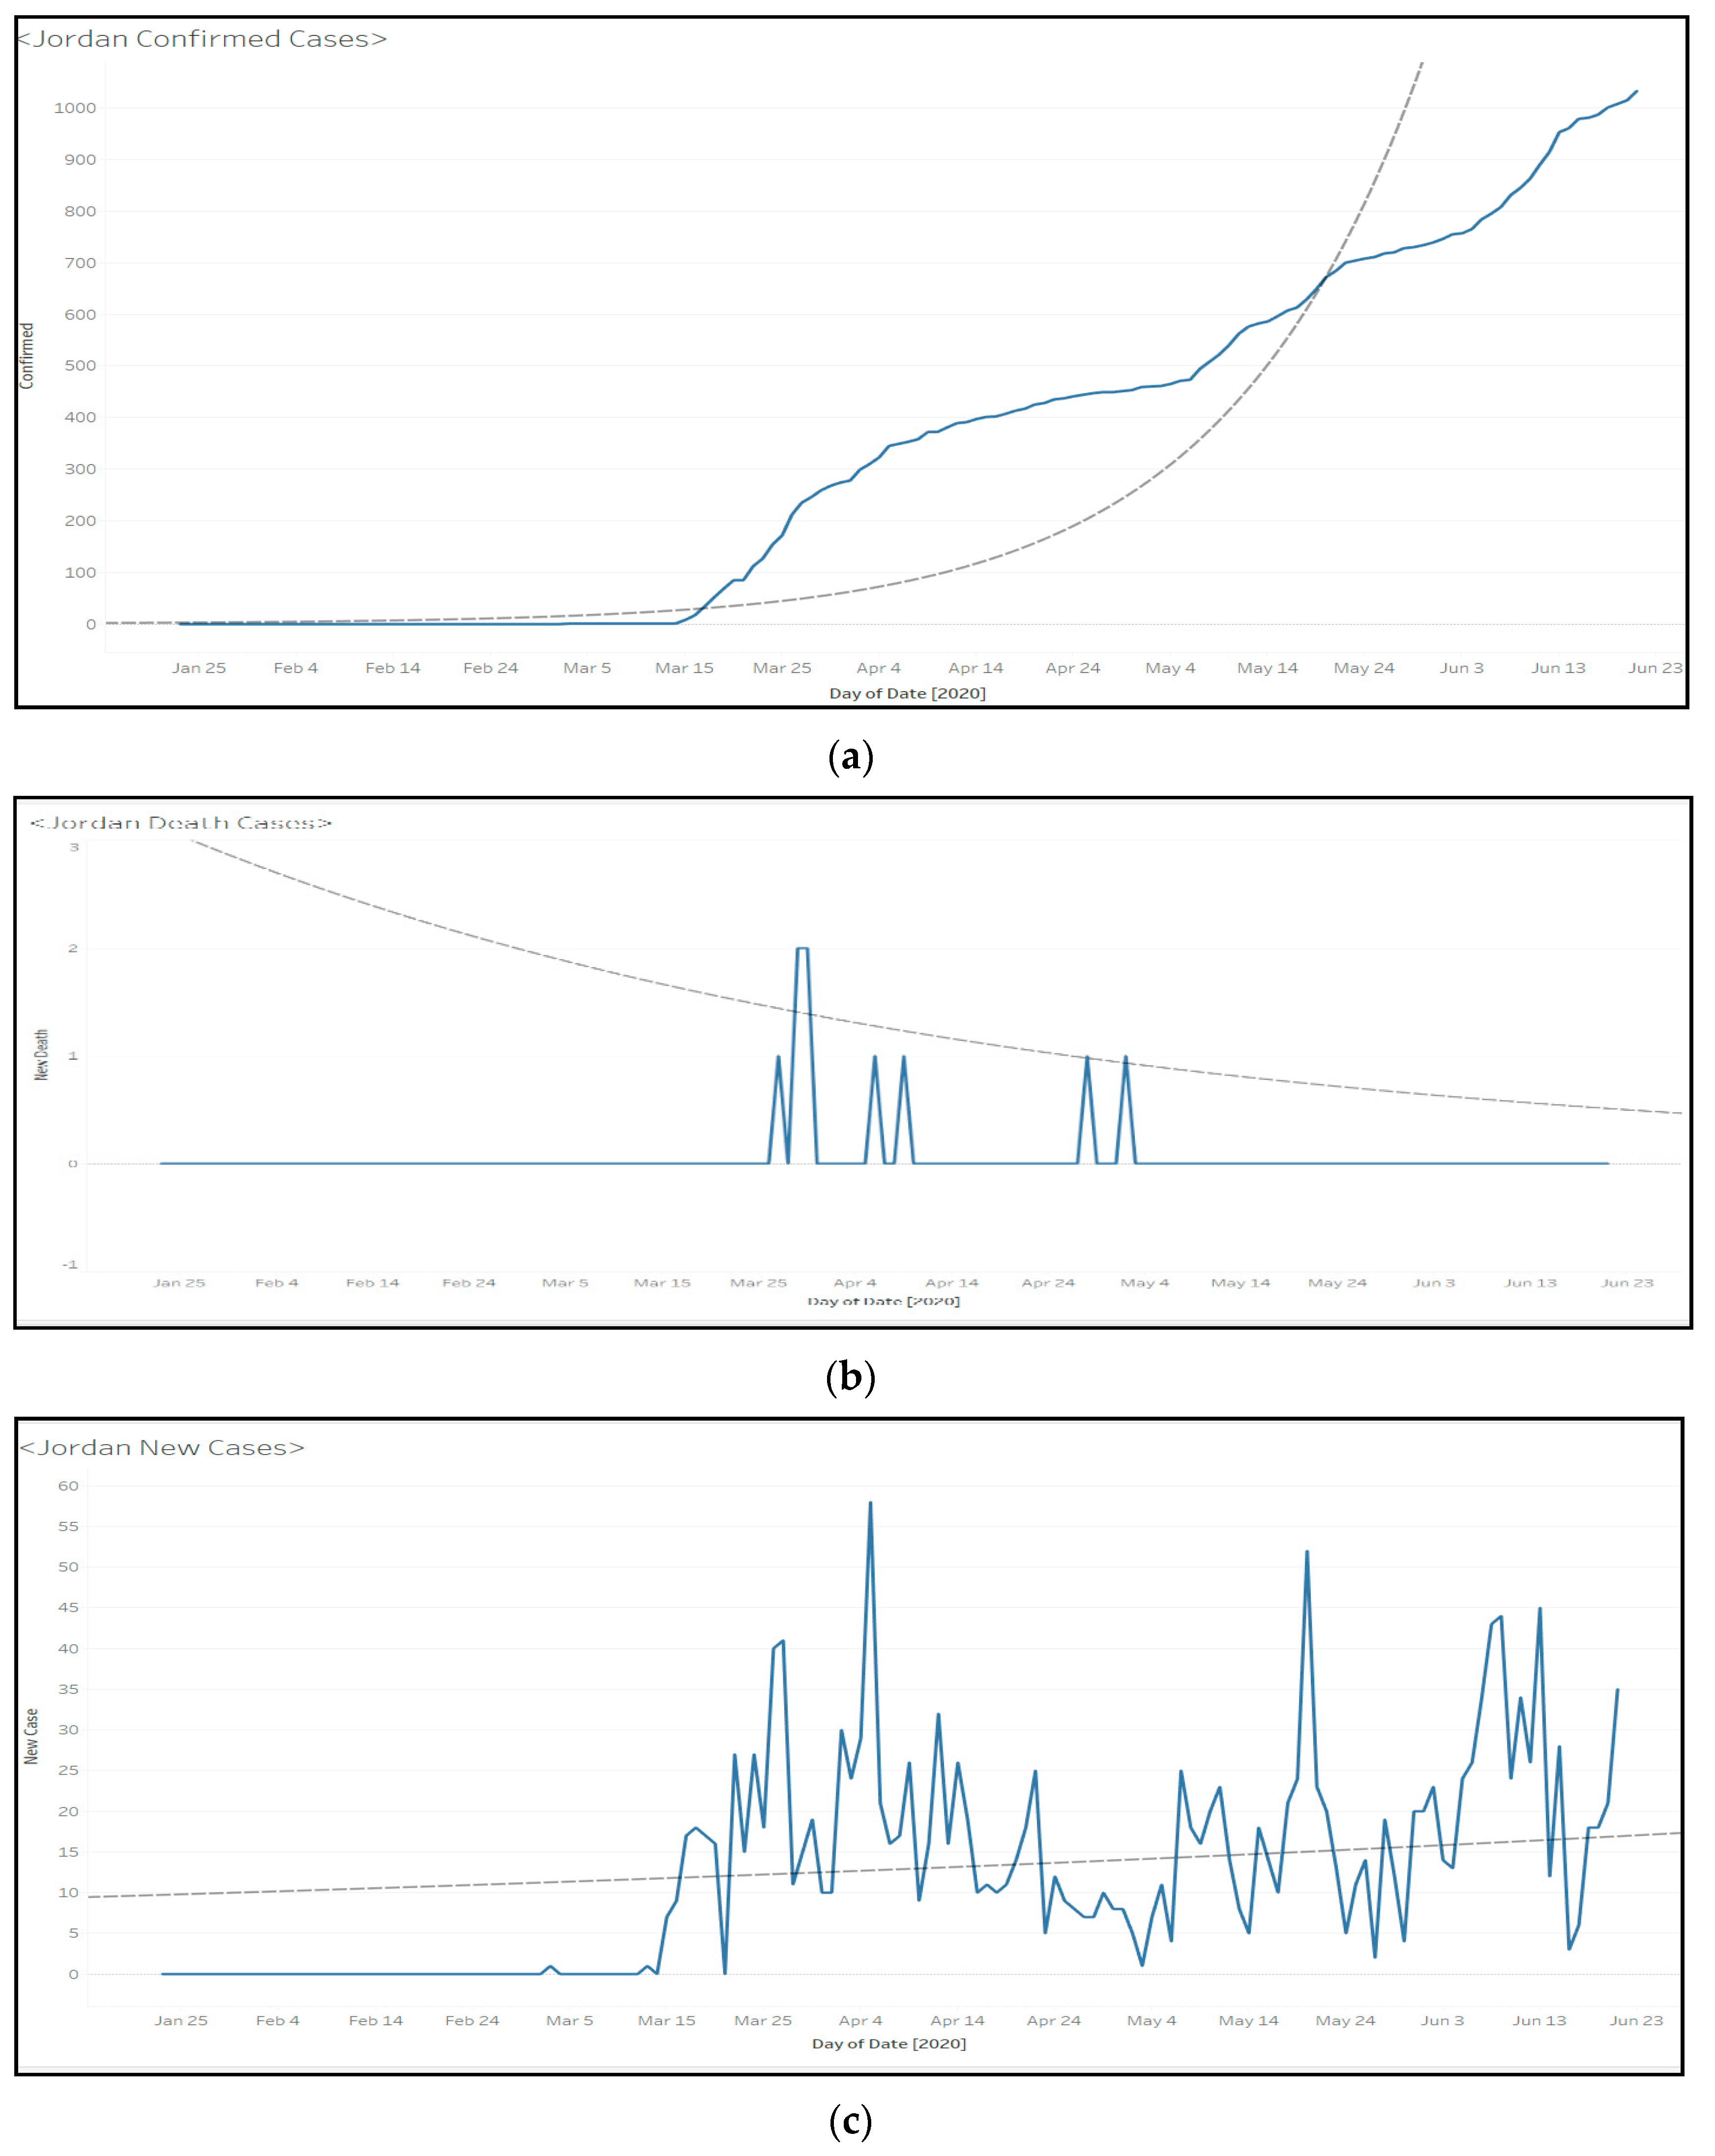
Figure 8.
Linear regression model results for (a) confirmed cases, (b) death cases; and (c) new cases in Jordan.
Figure 8.
Linear regression model results for (a) confirmed cases, (b) death cases; and (c) new cases in Jordan.
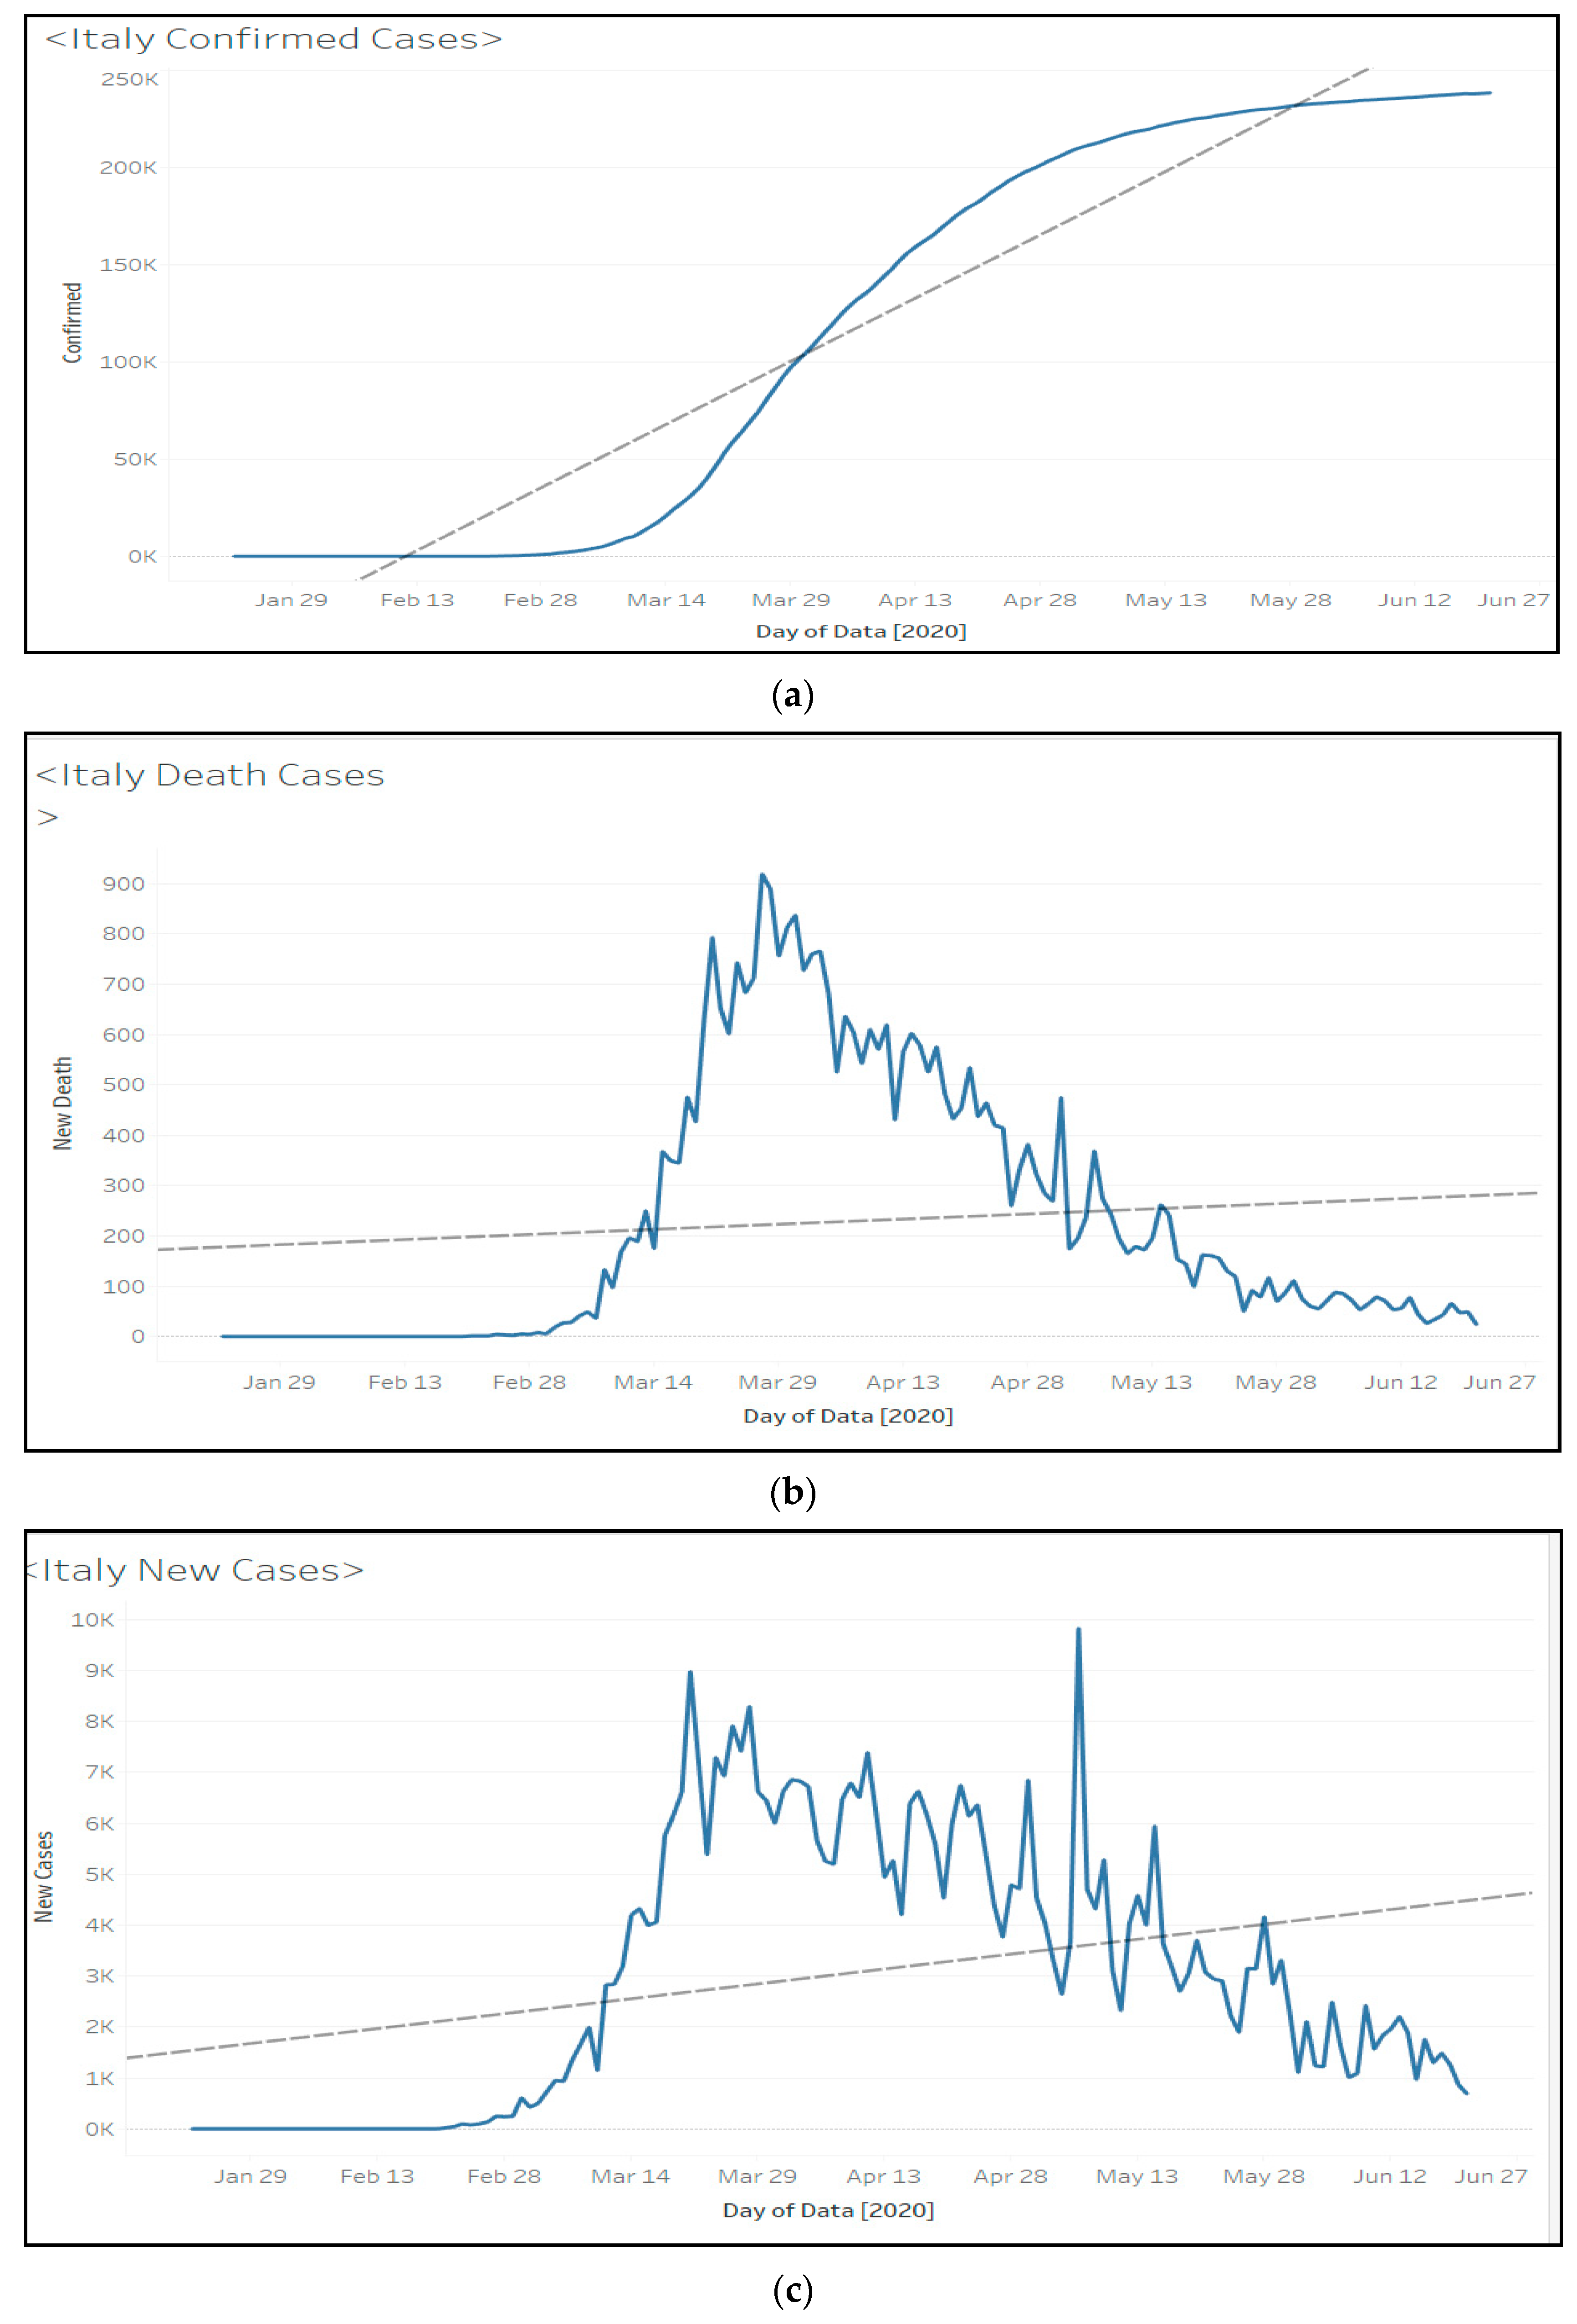
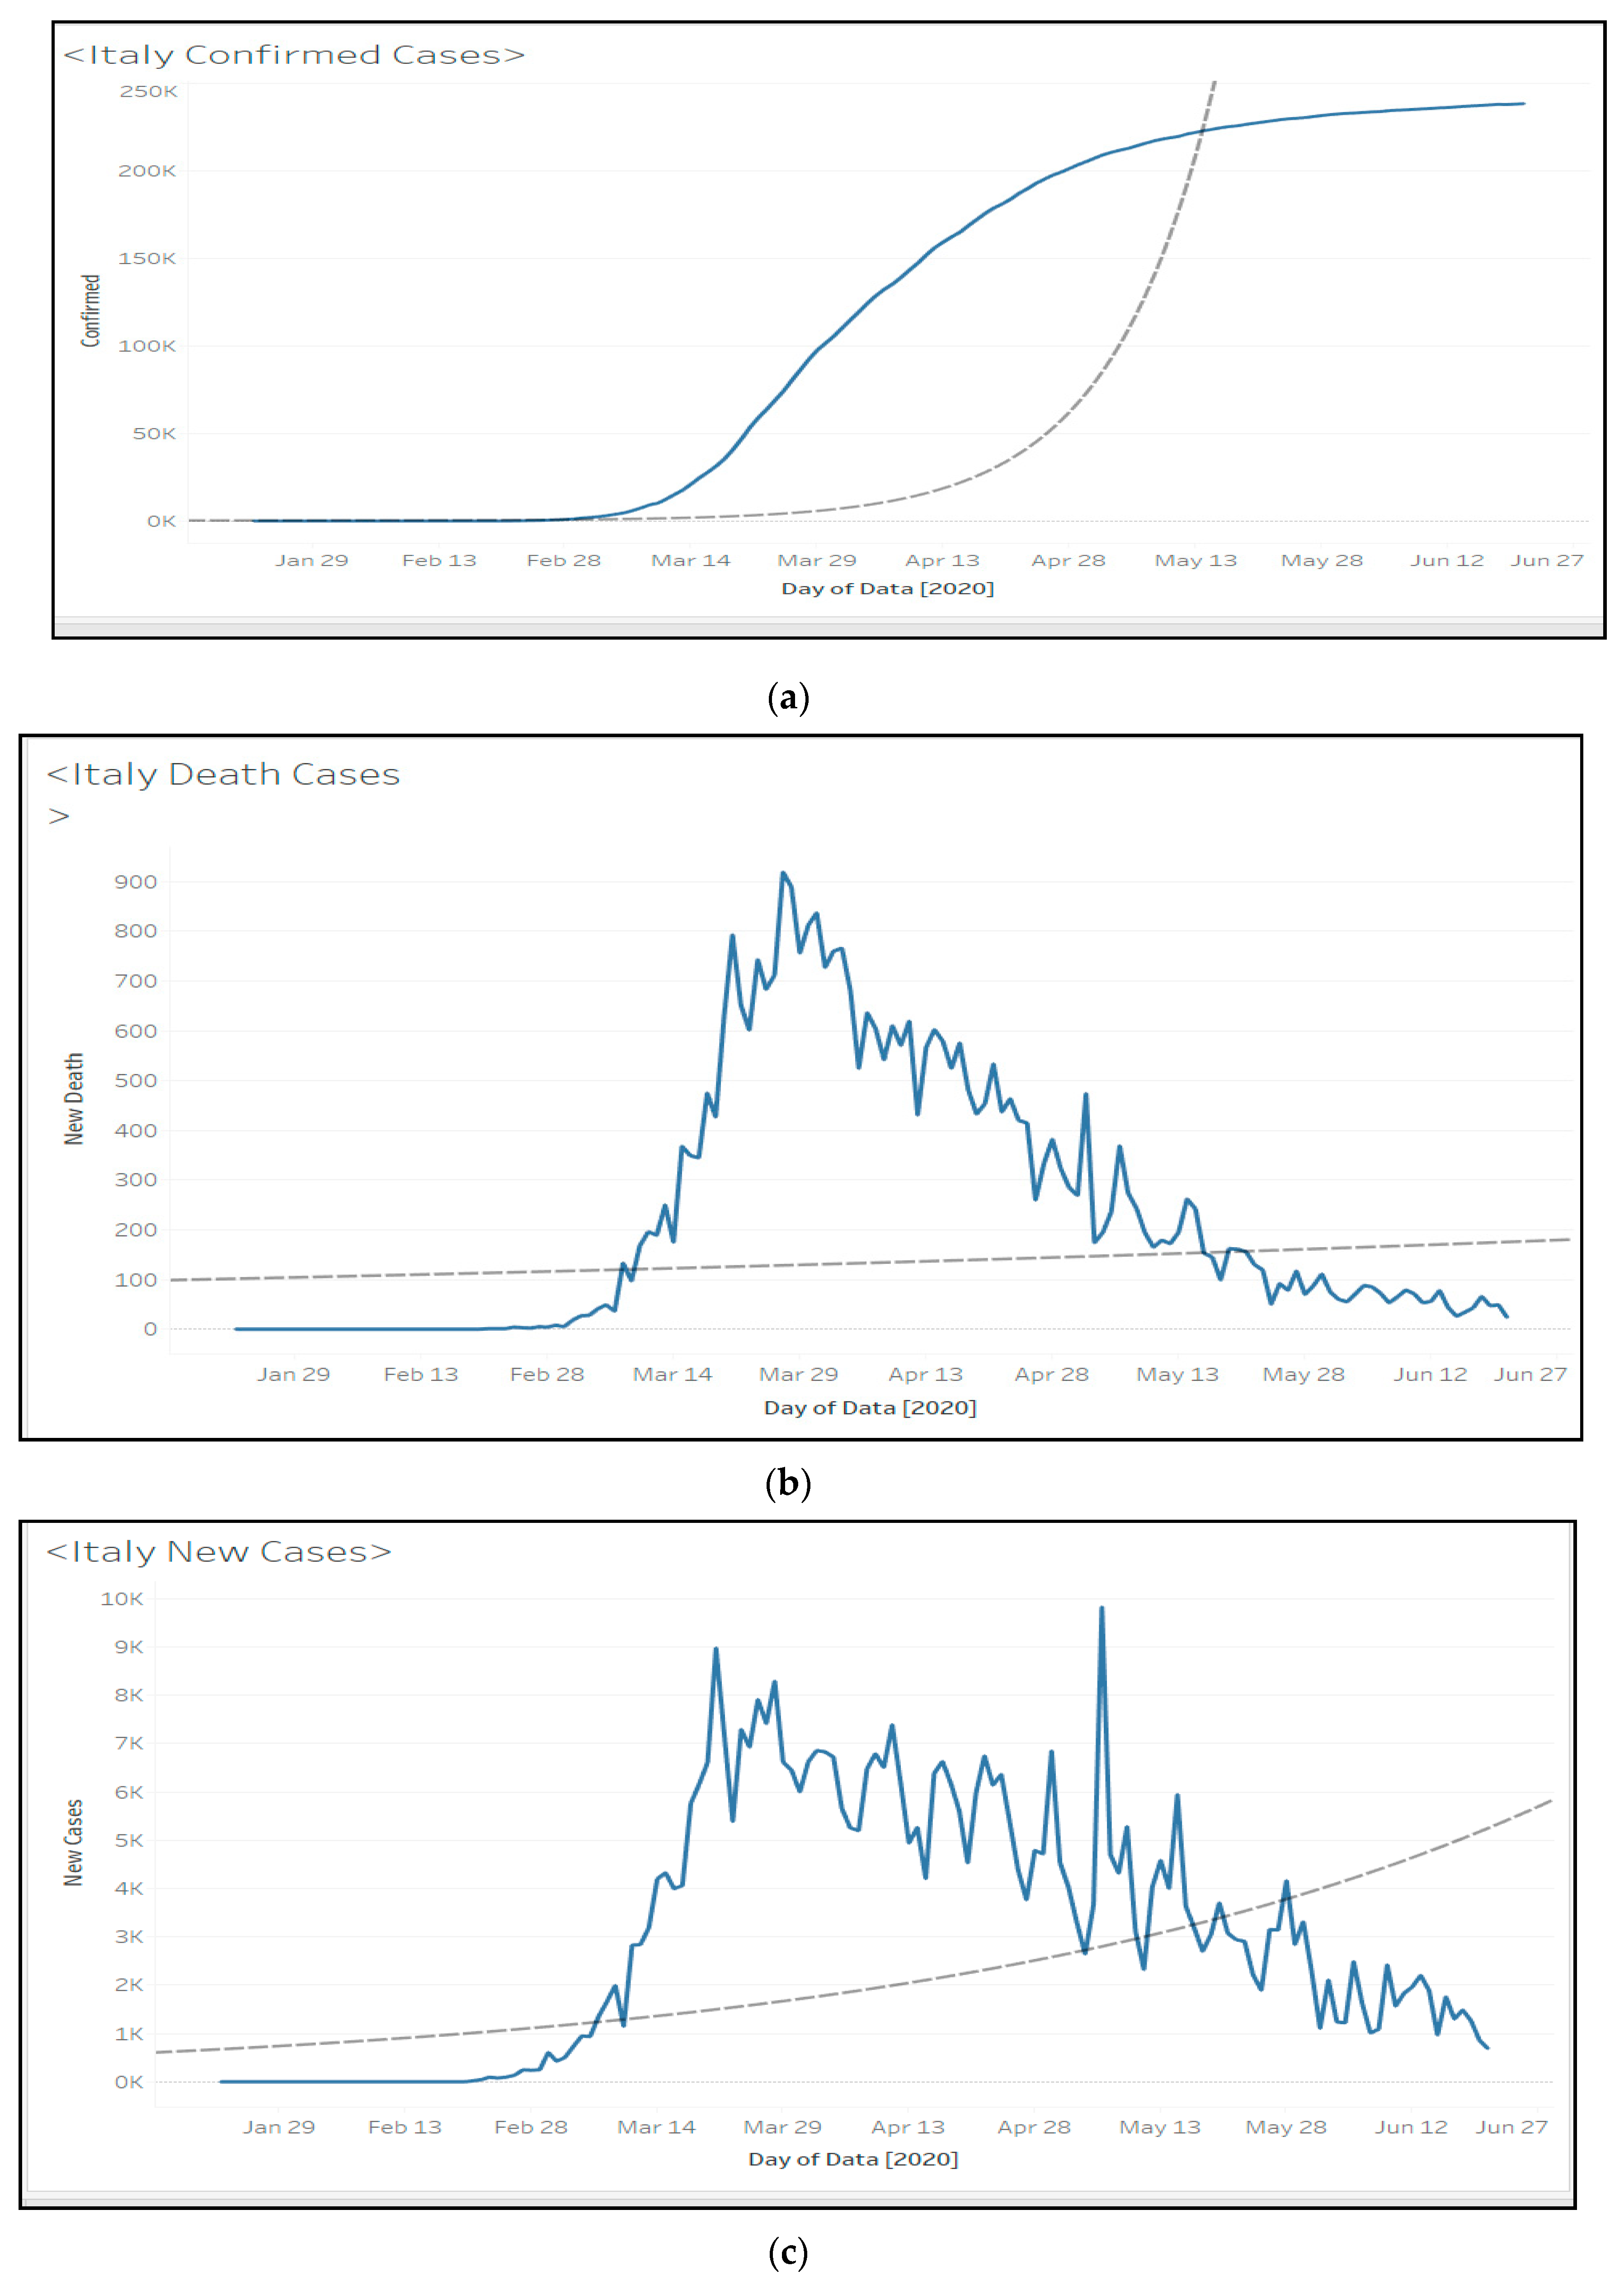
Figure 9.
Linear regression model results for (a) confirmed cases, (b) death cases, and (c) new cases in Italy.
Figure 9.
Linear regression model results for (a) confirmed cases, (b) death cases, and (c) new cases in Italy.
Figure 10.
Exponential Regression Models for (a) Confirmed Cases; (b) Death Cases; (c) New Cases in US.
Figure 10.
Exponential Regression Models for (a) Confirmed Cases; (b) Death Cases; (c) New Cases in US.
Figure 11.
Exponential Regression Models for (a) Confirmed Cases; (b) Death Cases; (c) and New Cases in Jordan.
Figure 11.
Exponential Regression Models for (a) Confirmed Cases; (b) Death Cases; (c) and New Cases in Jordan.
Figure 12.
Exponential Regression Models for (a) Confirmed Cases; (b) Death Cases; and (c) New Cases in Italy.
Figure 12.
Exponential Regression Models for (a) Confirmed Cases; (b) Death Cases; and (c) New Cases in Italy.
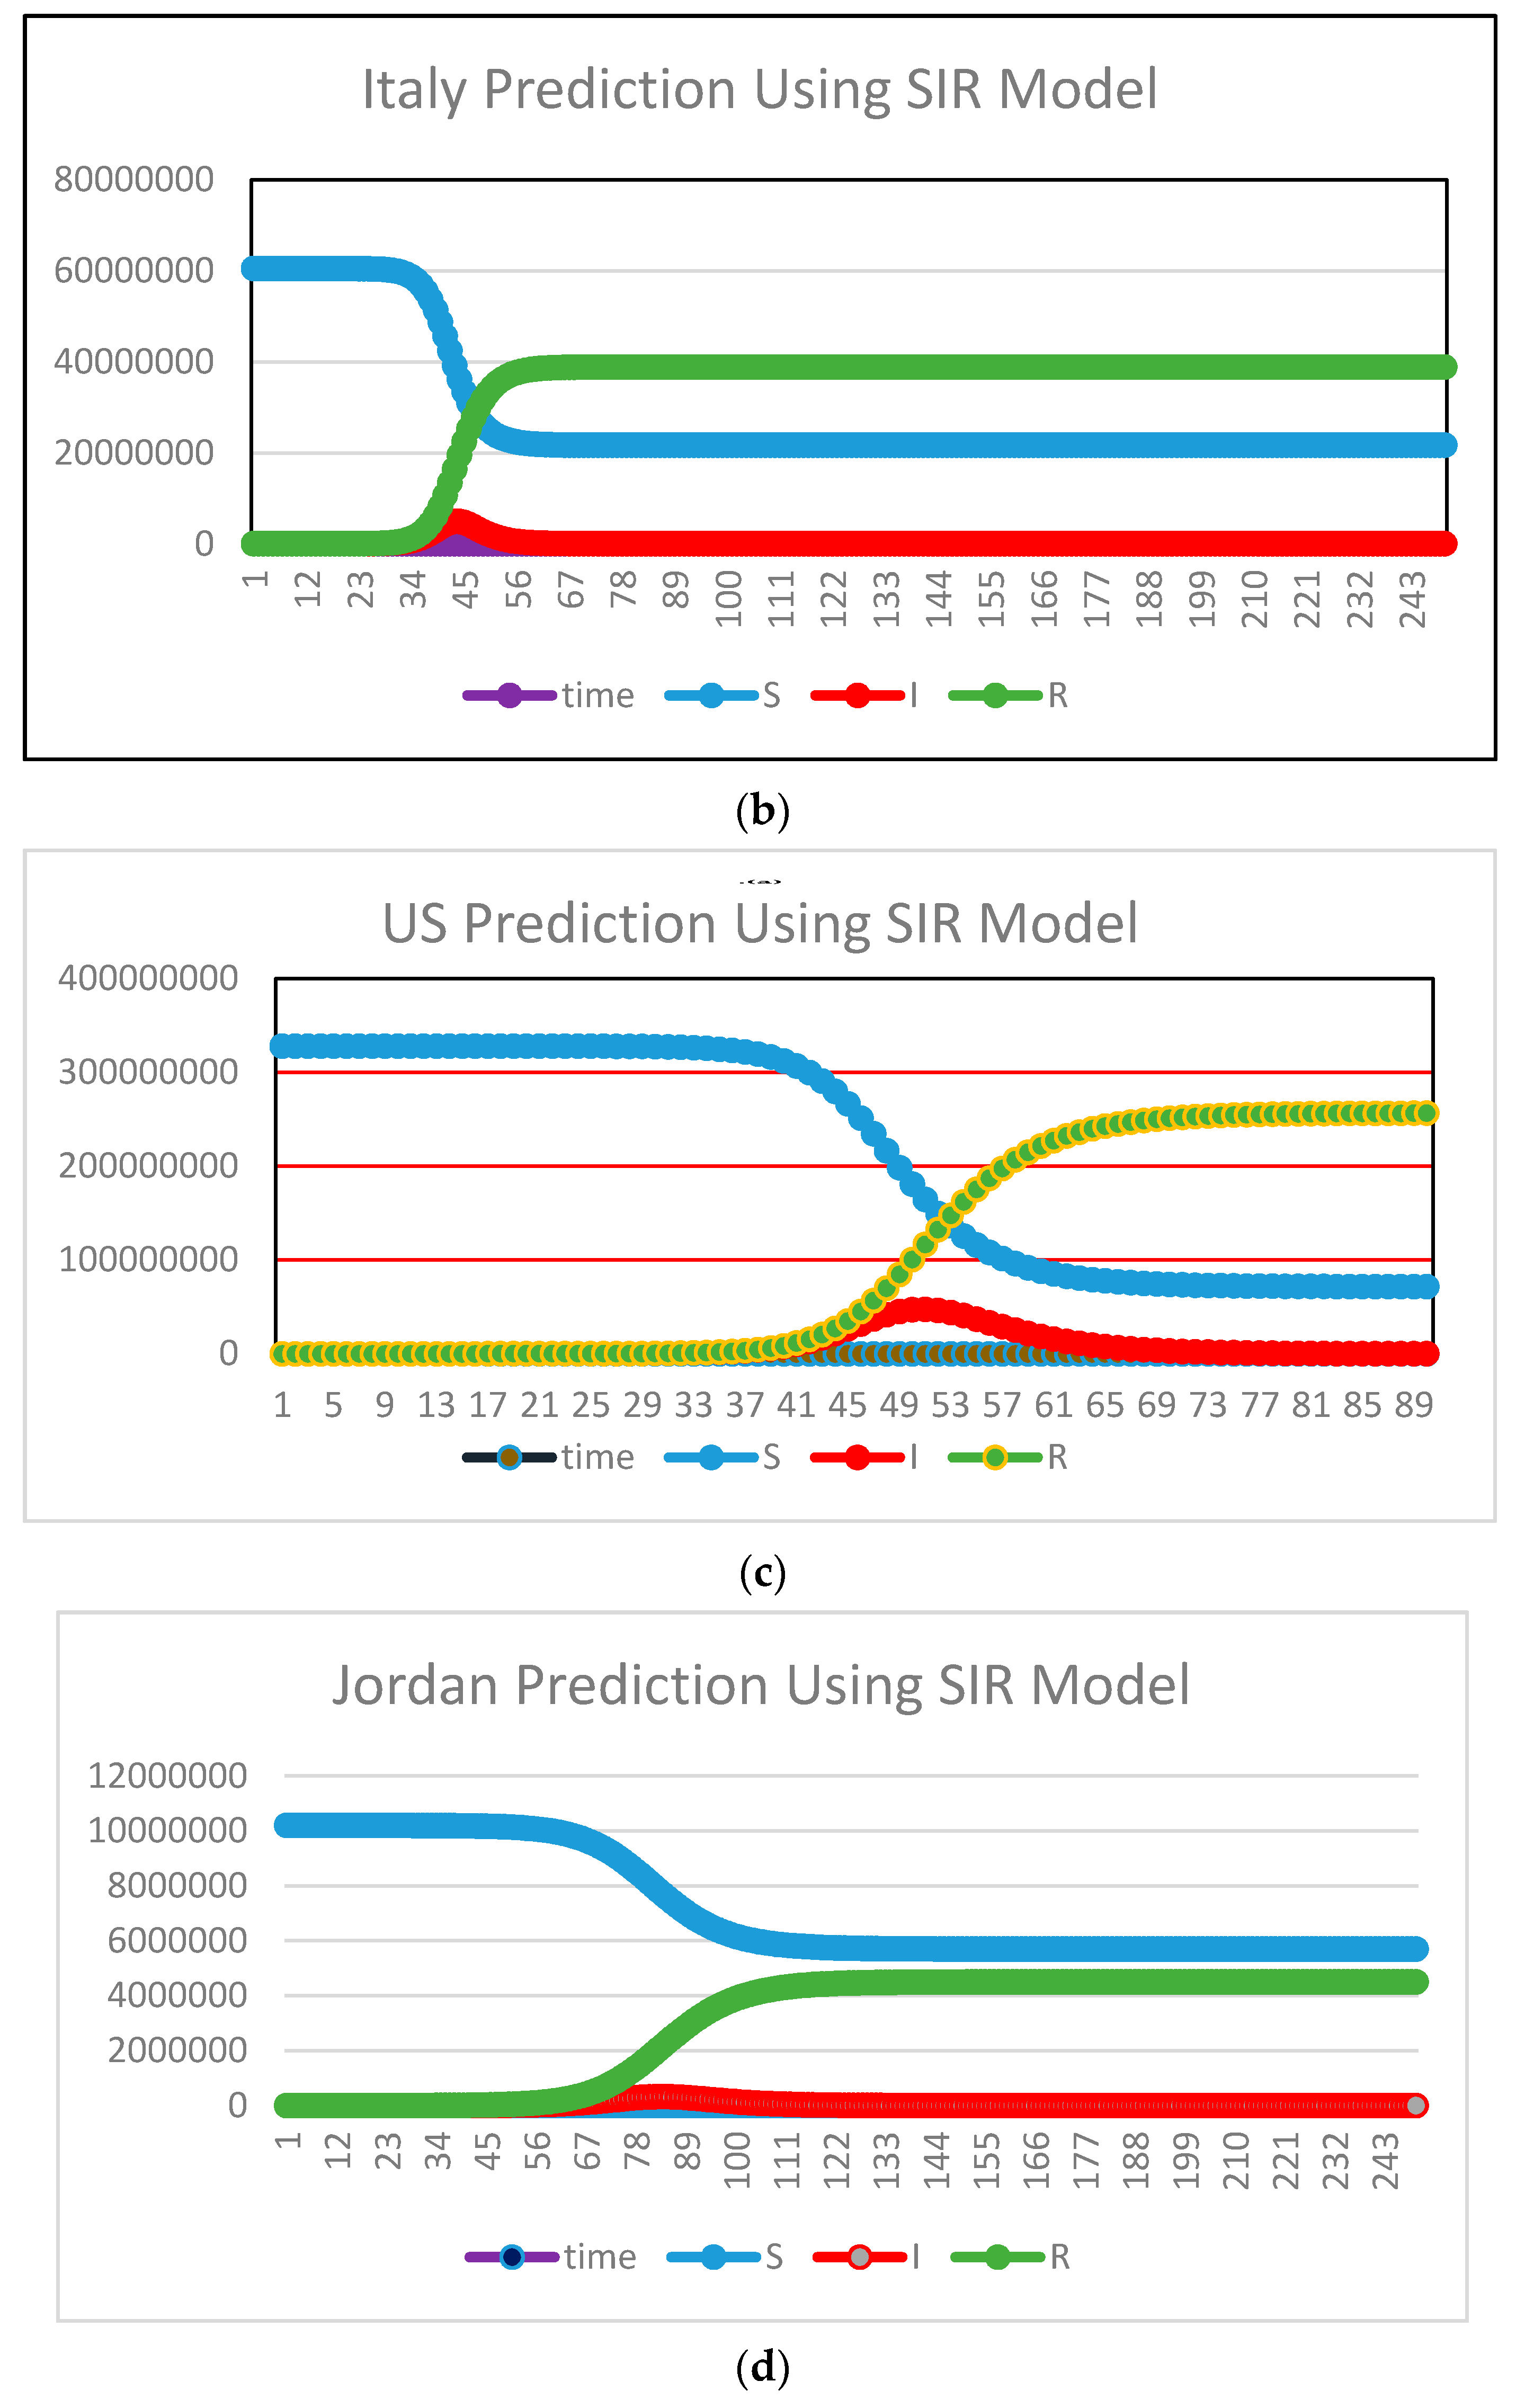
Figure 13.
SIR Models Prediction for Susceptible, Recovered, and Infected Cases: (a) Italy; (b) US; and (c) Jordan.
Figure 13.
SIR Models Prediction for Susceptible, Recovered, and Infected Cases: (a) Italy; (b) US; and (c) Jordan.
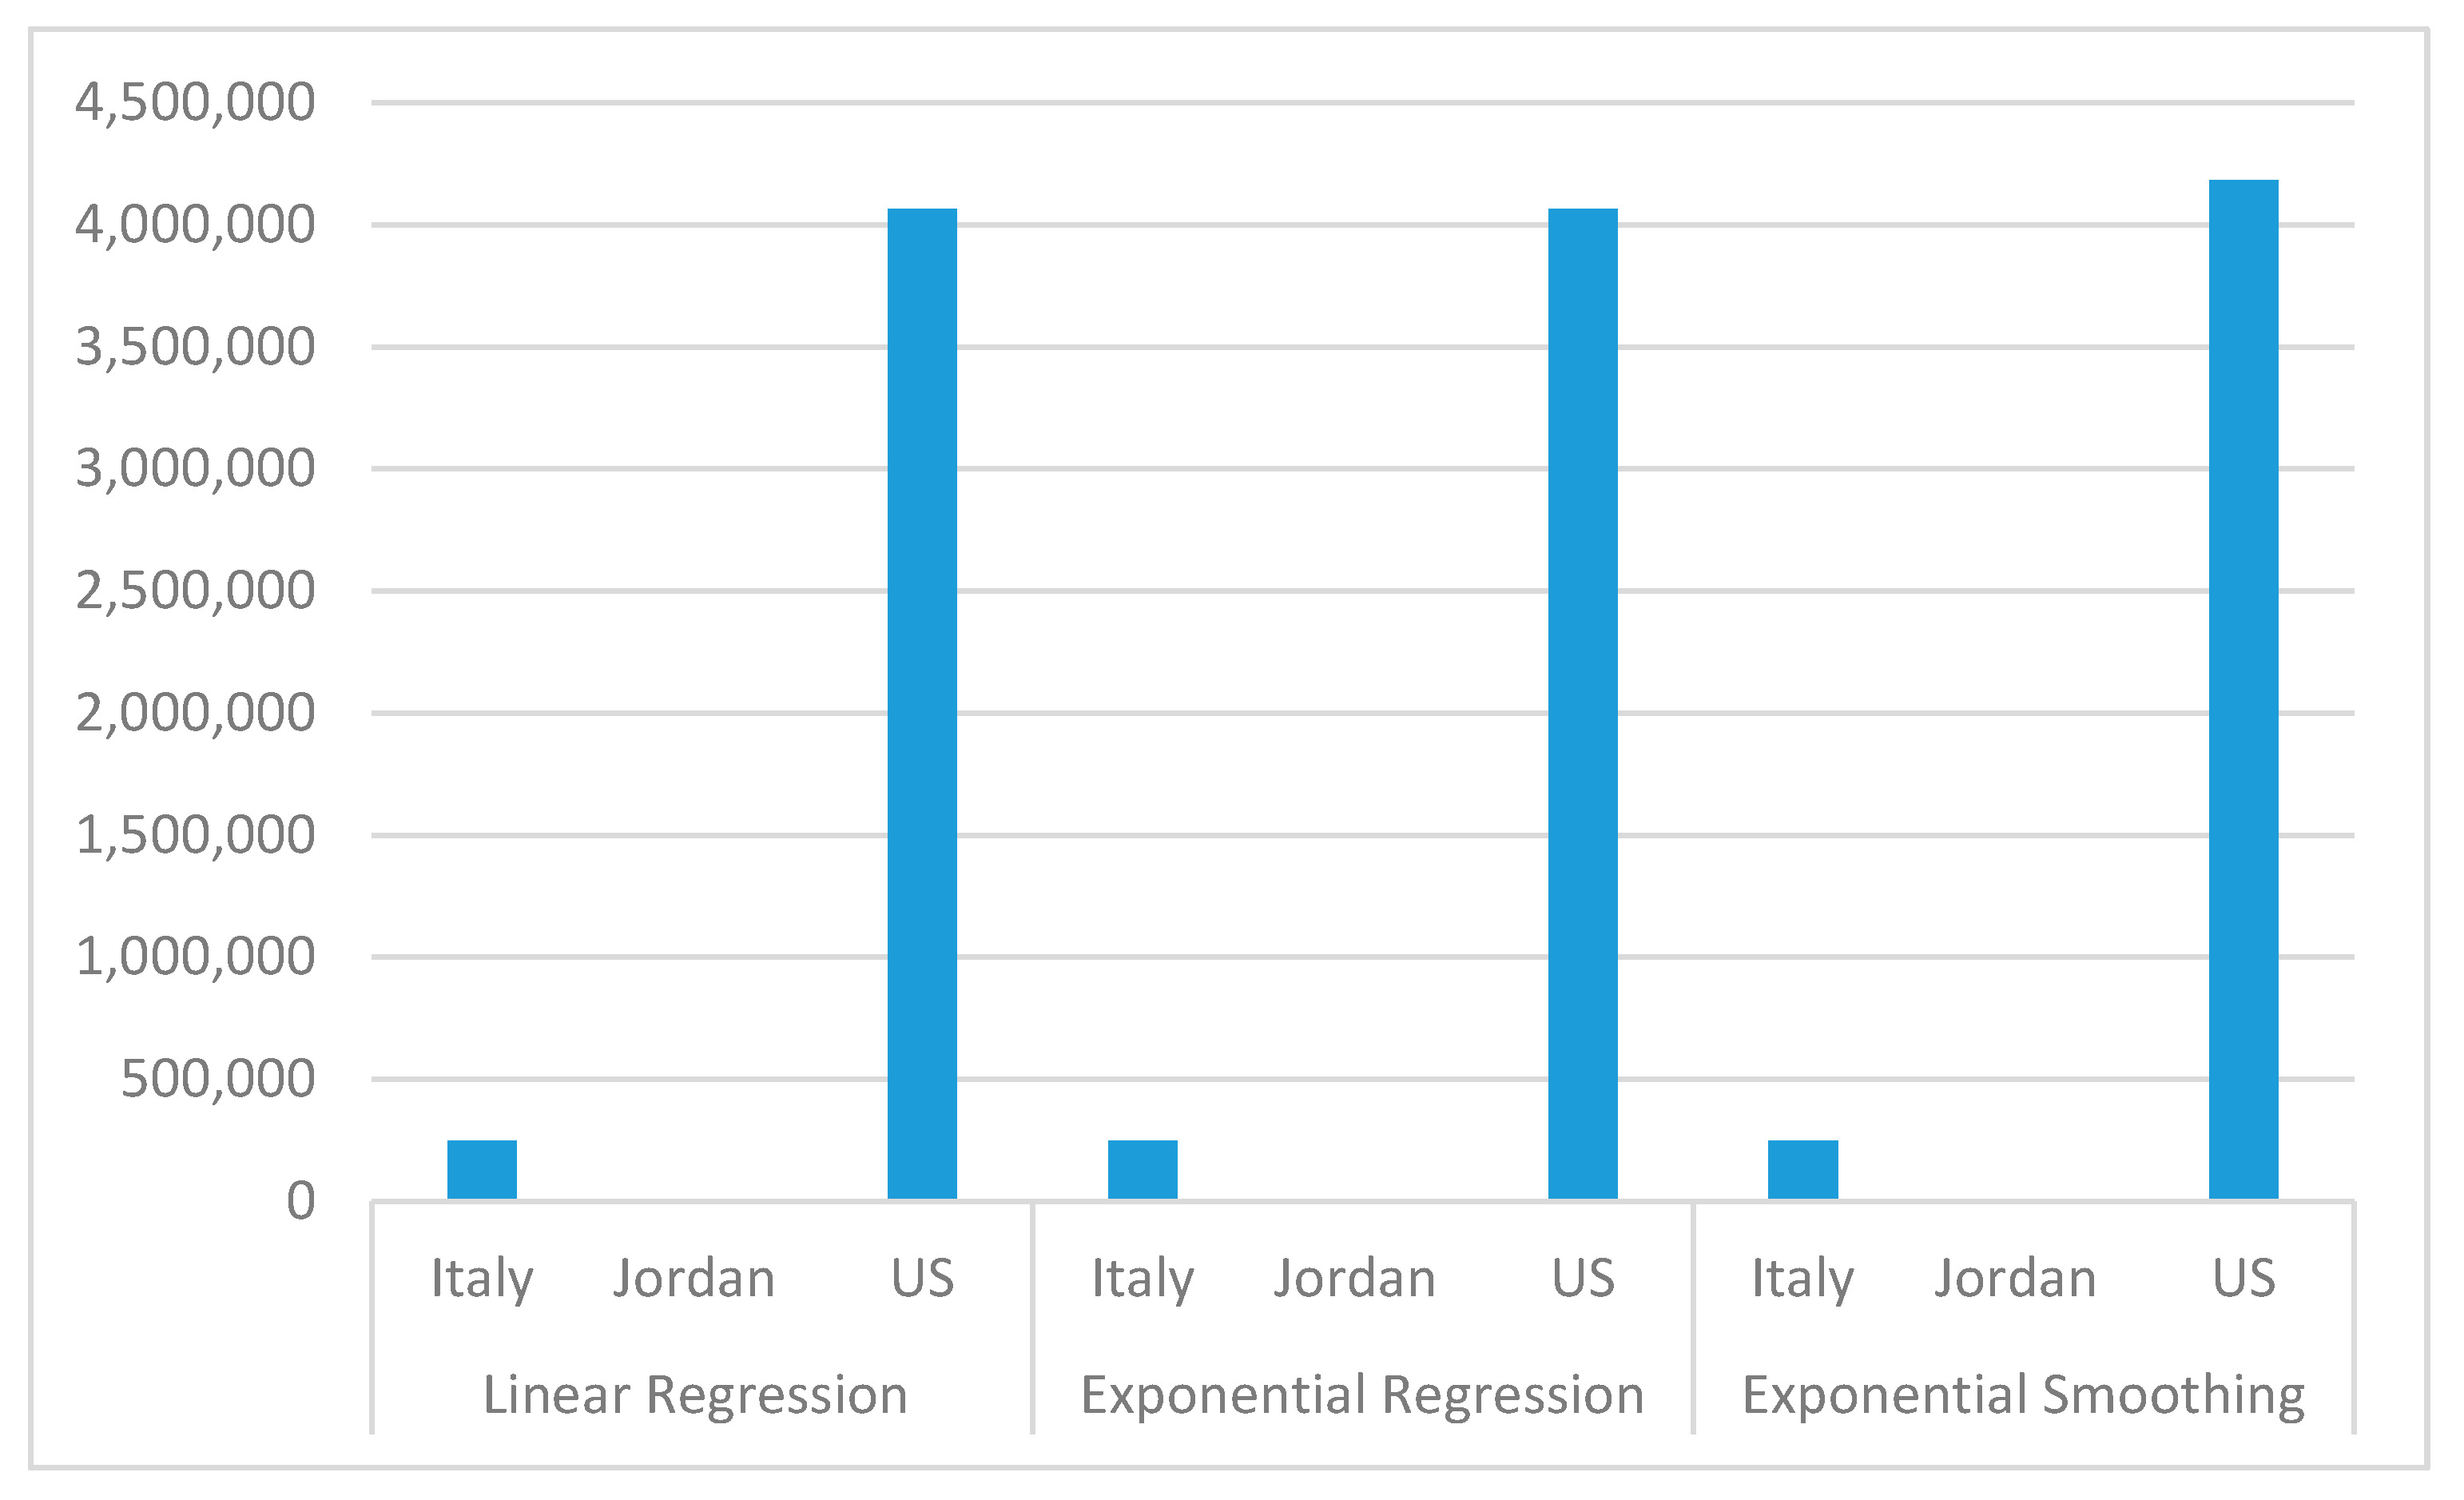
Figure 14.
Confirmed case prediction for 24th of August 2020 using the Linear, Exponential Regression, and Exponential Smoothing models in Italy, Jordan, and US.
Figure 14.
Confirmed case prediction for 24th of August 2020 using the Linear, Exponential Regression, and Exponential Smoothing models in Italy, Jordan, and US.
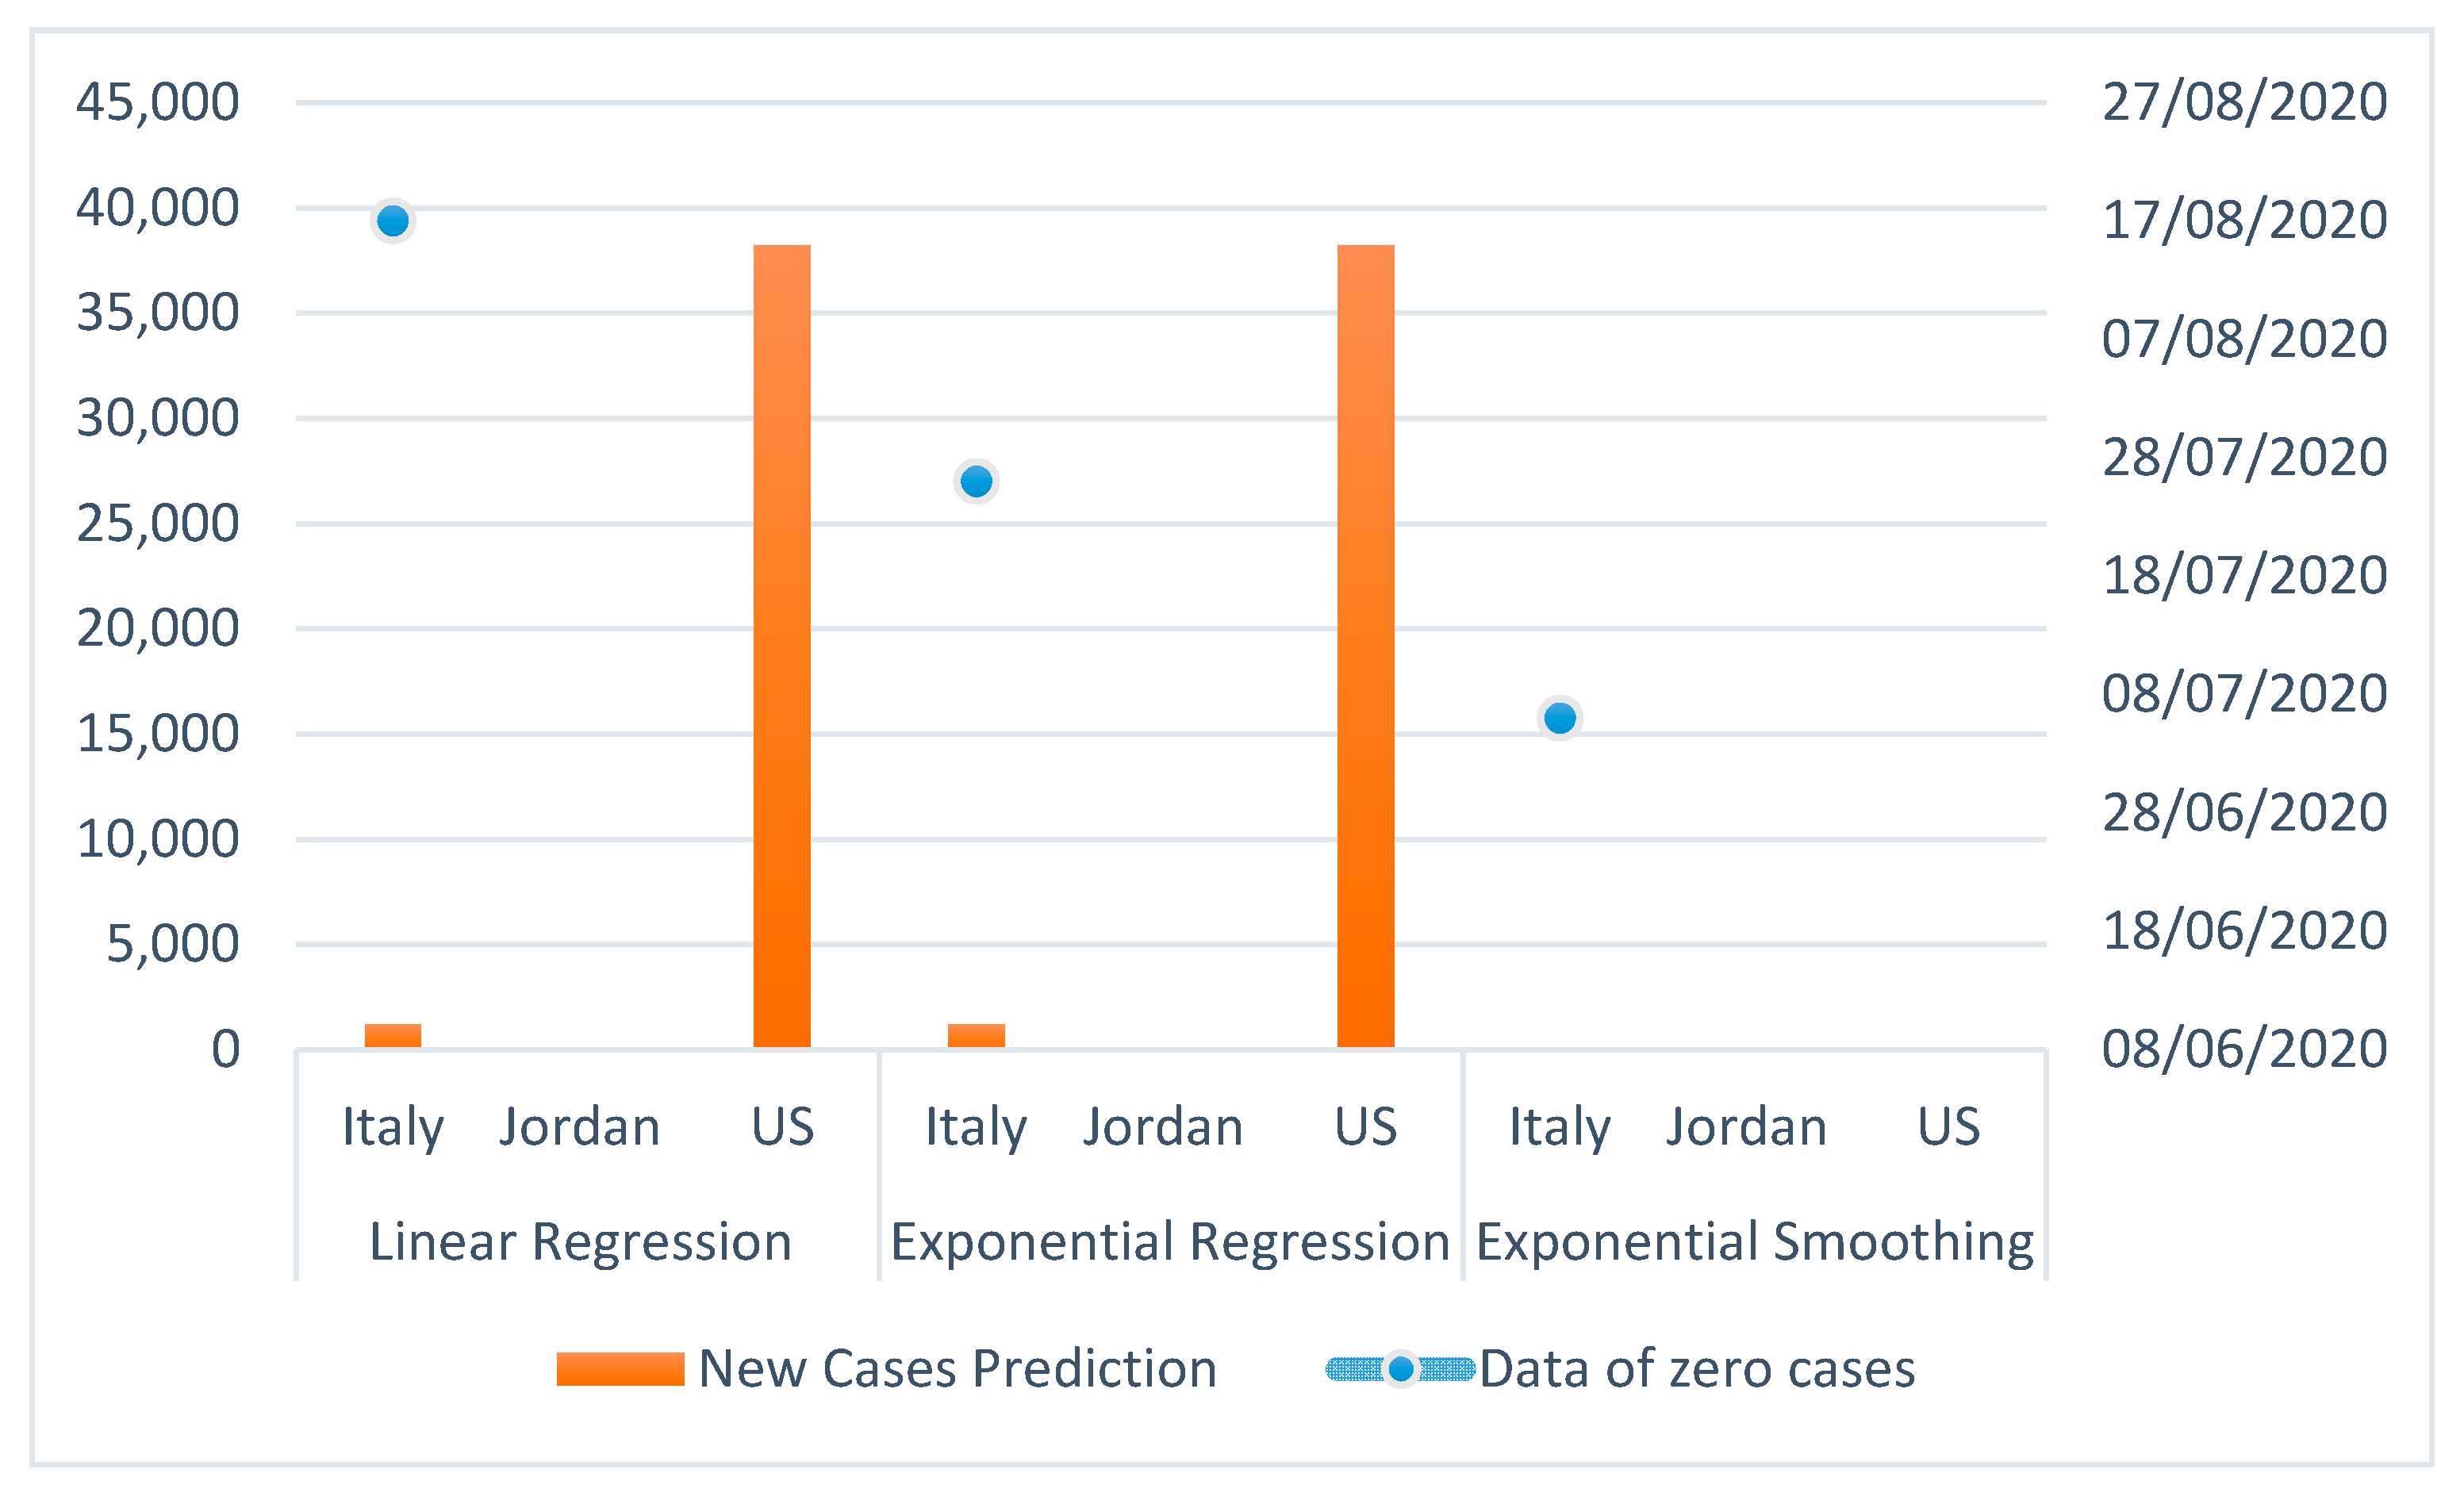
Figure 15.
New case prediction for 24th of August 2020 and zero new case prediction using the linear, exponential regression, and exponential smoothing models in Italy, Jordan, and the US.
Figure 15.
New case prediction for 24th of August 2020 and zero new case prediction using the linear, exponential regression, and exponential smoothing models in Italy, Jordan, and the US.
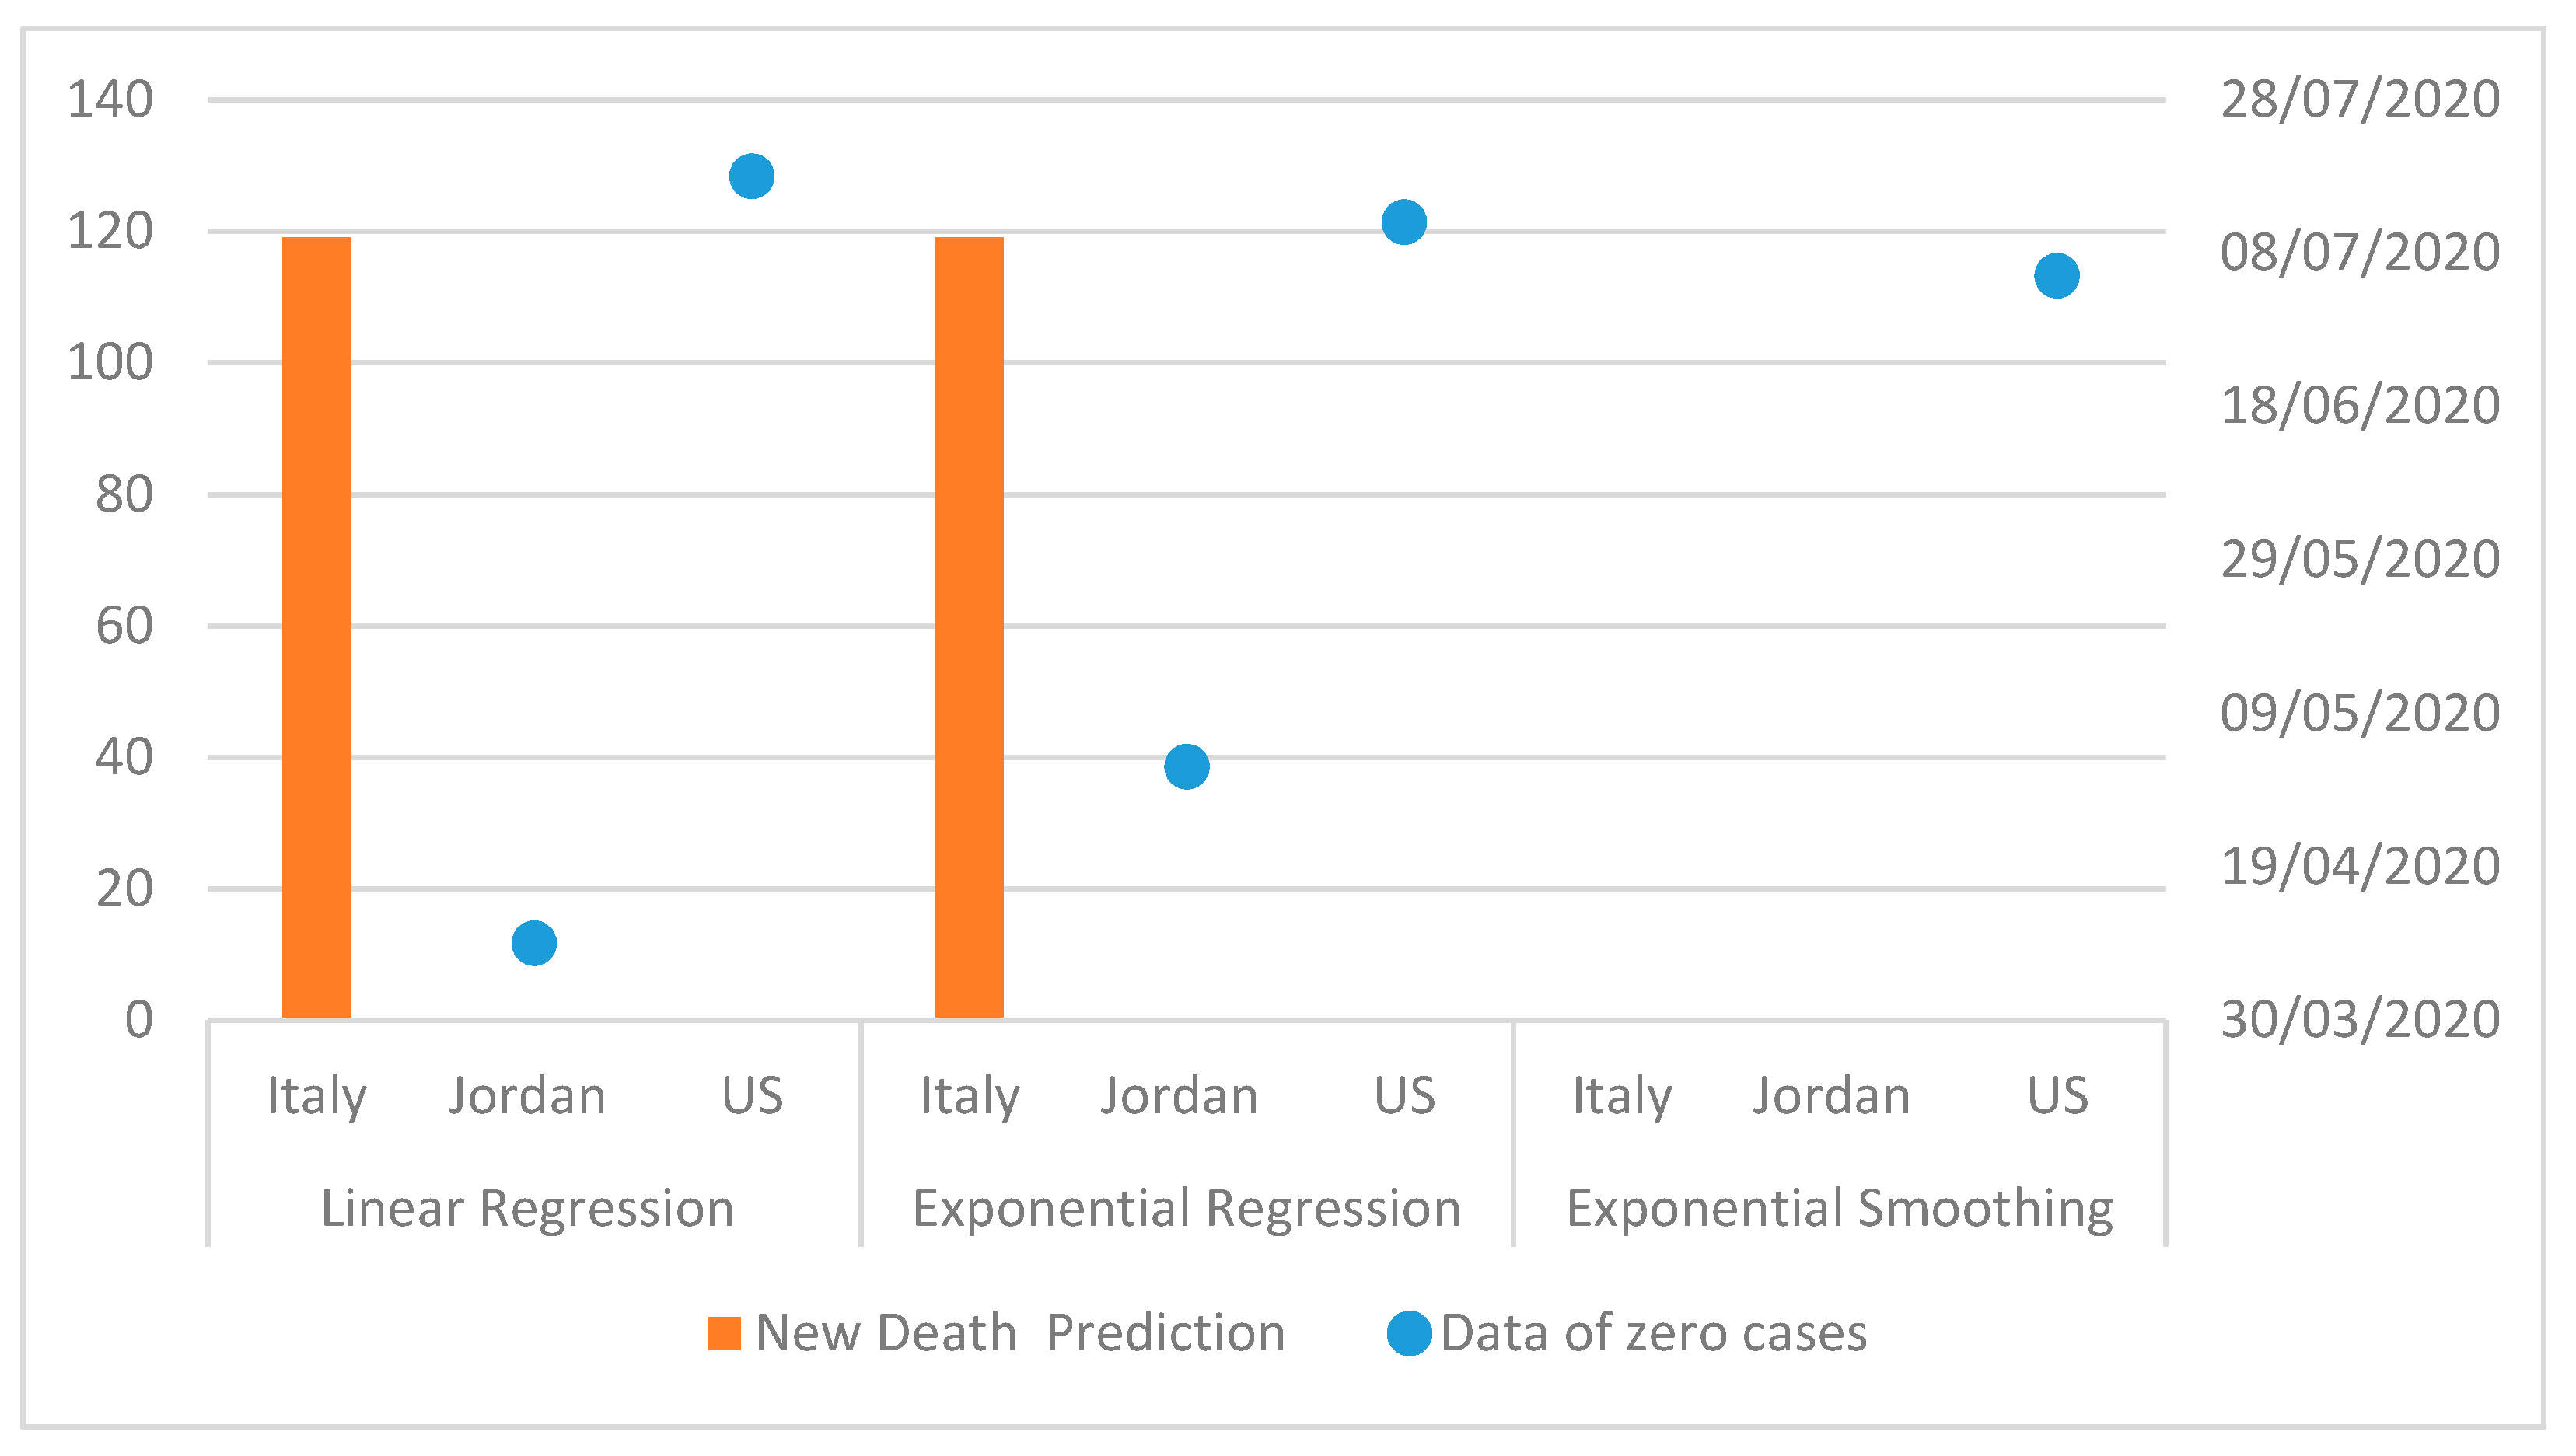
Figure 16.
Death case prediction for 24th of August 2020 and zero case prediction using the linear, exponential regression, and exponential smoothing models in Italy, Jordan, and the US.
Figure 16.
Death case prediction for 24th of August 2020 and zero case prediction using the linear, exponential regression, and exponential smoothing models in Italy, Jordan, and the US.
Table 1.
Linear Regression Results for Confirmed, New, and Death Cases for Italy, US, and Jordan.
Table 1.
Linear Regression Results for Confirmed, New, and Death Cases for Italy, US, and Jordan.
| Country | Italy | Jordan | US |
|---|
| Model Formula | Forecast Indicator * (Day of Date + Intercept) |
| Cases | Confirmed Cases | New Cases | Death Cases | Confirmed Cases | New Cases | Death Cases | Confirmed Cases | New Cases | Death Cases |
| SSE (sum squared error): | 3.3344 × 10¹¹ | 1.21758 × 10⁹ | 1.05497 × 10⁷ | 1.31218 × 10⁶ | 15846.4 | 12.5244 | 1.94177 × 10¹³ | 2.05371 × 10¹⁰ | 1.50322 × 10⁸ |
| MSE (mean squared error): | 1.58781 × 10⁹ | 5.79801 × 10⁶ | 50236.4 | 6278.39 | 89.0245 | 0.0599252 | 9.24653 × 10¹⁰ | 9.77958 × 10¹⁰ | 715821 |
| R-Squared: | 0.846173 | 0.0188468 | 0.0227448 | 0.973442 | 0.331823 | 0.0072726 | 0.947582 | 0.661348 | 0.0280926 |
| Standard error: | 39847.3 | 2407.91 | 224.135 | 79.2363 | 9.43528 | 0.244796 | 304081 | 9889.18 | 846.062 |
| p value | <0.0001 | 0.0458767 | 0.000109 | <0.0001 | <0.0001 | 0.217336 | <0.0001 | <0.0001 | 0.0145537 |
Table 2.
Future Prediction Numbers Using Linear Regression Models for Italy, Jordan, and US.
Table 2.
Future Prediction Numbers Using Linear Regression Models for Italy, Jordan, and US.
| Country | Italy | Jordan | US |
|---|
| Confirmed Cases | Prediction (the prediction is made for 24 August 2020) | 247,984 | 1401 | 4,061,952 |
| First zero | Not Available | Not Available | Not Available |
| New Cases | Prediction | 1197 | 18 | 38,220 |
| First zero | 17th of August 2020 | Not Applicable | Not Applicable |
| Death Cases | Prediction | 119 | Zero | Zero |
| First zero | Not Available | Started on 9th of April 2020 | 18th of July 2020 |
Table 3.
Exponential Regression Results for Confirmed, New, and Death Cases in Italy, US, and Jordan.
Table 3.
Exponential Regression Results for Confirmed, New, and Death Cases in Italy, US, and Jordan.
| Country | Italy | Jordan | US |
|---|
| Model Formula | Forecast Indicator Day of Date + intercept) |
| Cases | Confirmed Cases | New Cases | Death Cases | Confirmed Cases | New Cases | Death Cases | Confirmed Cases | New Cases | Death Cases |
| SSE (sum squared error): | 1240.22 | 311.656 | 308.051 | 265.67 | 59.9513 | 0.498341 | 1279.86 | 826.514 | 484.552 |
| MSE (mean squared error): | 6.17027 | 1.80148 | 1.71139 | 1.57201 | 0.379438 | 0.0996681 | 6.09456 | 4.49193 | 3.64325 |
| R-Squared: | 0.534905 | 0.0042252 | 0.0093464 | 0.537175 | 0.0507974 | 0.273939 | 0.751734 | 0.47227 | 0.114924 |
| Standard error: | 2.484 | 1.34219 | 1.3082 | 1.2538 | 0.615986 | 0.315703 | 2.46872 | 2.11942 | 1.90873 |
| p value | <0.0001 | 0.392753 | 0.194185 | <0.0001 | 0.0041635 | 0.227987 | <0.0001 | <0.0001 | <0.0001 |
Table 4.
Future Prediction Numbers using Exponential Regression Models for Italy, Jordan, and US.
Table 4.
Future Prediction Numbers using Exponential Regression Models for Italy, Jordan, and US.
| Country | Italy | Jordan | US |
|---|
| Confirmed Cases | Prediction (done on 24 August 2020) | 247,984 | 1401 | 4,061,952 |
| First zero | Not Applicable | Not Applicable | Not Applicable |
| New Cases | Prediction | 1197 | 18 | 38,221 |
| First Zero | 26 July 2020 | Not Applicable | Not Applicable |
| Death cases | Prediction | 119 | Zero | Zero |
| First Zero | Not Applicable | Zero Since 2nd May 2020 | 12th July 2020 |
Table 5.
Forecasting Results for Confirmed Cases using the Exponential Smoothing Model.
Table 5.
Forecasting Results for Confirmed Cases using the Exponential Smoothing Model.
| Forecast Forward | 65 Days (21st June 2020–24th of August 2020) |
|---|
| Forecast Based on | 22nd of February 2020–20th of June 2020 |
|---|
| | Initial | Change from Initial | Seasonal Effect | Contribution |
|---|
| Country | 21st of June 2020 | 21st of June 2020–24th of August 2020 | High | Low | Trend | Season | Quality |
|---|
| Jordan | 1022 | ± | 1.8% | 37.1% | 100.0% | 100.0% | 0.0% | OK |
| Italy | 238,505 | ± | 0.7% | 4.2% | 100.0% | 100.0% | 0.0% | Good |
| US | 2,279,626 | ± | 0.5% | 78.2% | 100.0% | 100.0% | 0.0% | Good |
Table 6.
Forecasting Results for New Cases using the Exponential Smoothing Model.
Table 6.
Forecasting Results for New Cases using the Exponential Smoothing Model.
| Forecast Forward | 65 Days (21st of June 2020–24th of August 2020) |
|---|
| Forecast Based on | 22nd February 2020–20th of June 2020 |
|---|
| | Initial | Change from Initial | Seasonal Effect | Contribution |
|---|
| Country | 21st of June 2020 | 21st of June 2020–24th of August 2020 | High | Low | Trend | Season | Quality |
|---|
| Jordan | 18 | ± | 103.8% | 0.0% | None | | 0.0% | 0.0% | Poor |
| Italy | 395 | ± | 490.7% | 202.6% | 14th August 2020 | 57.2% | 17th of August 2020 | −116.1% | 0.0% | 10.0% | Ok |
| US | 38,221 | ± | 39.1% | 0.0% | None | 0.0% | 0.0% | Poor |
Table 7.
Forecasting Results for Death Cases using the Exponential Smoothing Model.
Table 7.
Forecasting Results for Death Cases using the Exponential Smoothing Model.
| Forecast Forward | 65 days (21st of June 2020–24th of August 2020) |
|---|
| Forecast Based on | 22nd of February 2020–20th of June 2020 |
|---|
| | Initial | Change from Initial | Seasonal Effect | Contribution |
|---|
| Country | 21st of June 2020 | 21st of June 2020–24th of August 2020 | High | Low | Trend | Season | Quality |
|---|
| Jordan | 0 | ± | 156,004.5% | 0.0% | None | None | 0.0% | 0.0% | Poor |
| Italy | 45 | ± | 293.7% | 173.6% | None | None | 100% | 0.0% | Poor |
| US | 170 | ± | 266.9% | −541.6% | August 19 | −16.8% | 16th of August 2020 | 49.1% | 80.2% | 19.8% | Ok |
Table 8.
Future Forecasting using the Exponential Smoothing Model for Italy, Jordan, and US.
Table 8.
Future Forecasting using the Exponential Smoothing Model for Italy, Jordan, and US.
| Country | Italy | Jordan | US |
|---|
| Confirmed Cases | Prediction | 248,616 | 1427 | 4,180,774 |
| First zero | Not Applicable | Not Applicable | Not Applicable |
| New Cases | Prediction | Zero | Poor Model | Poor Model |
| First Zero | 6th of July 2020 | Poor Model | Poor Model |
| Death Cases | Prediction | Poor Model | Poor Model | Zero |
| First Zero | Poor Model | Poor Model | 5th of July 2020 |
Table 9.
Future Forecasting using the SIR Model for Italy, Jordan, and US.
Table 9.
Future Forecasting using the SIR Model for Italy, Jordan, and US.
| Country | Italy | Jordan | US |
|---|
| Susceptible | Prediction (done on 24th of August 2020) | 21,629,365 | 5,701,847 | 71,555,047 |
| First zero | Not Applicable | Not Applicable | Not Applicable |
| Infected | Prediction | Zero | 20 | Zero |
| First Zero | 10th of June 2020 | 20th of August 2020 | 1st of August 2020 |
| Recovered | Prediction | 38832460 | 4501872 | 256645000 |
| First Zero | 21,629,365 | 5,701,847 | 71,555,047 |
Table 10.
Future Forecasting Using Linear, Exponential, and Exponential Smoothing Models in Italy, Jordan, and US.
Table 10.
Future Forecasting Using Linear, Exponential, and Exponential Smoothing Models in Italy, Jordan, and US.
| | Linear Regression | Exponential Regression | Exponential Smoothing |
|---|
| | | Italy | Jordan | US | Italy | Jordan | US | Italy | Jordan | US |
|---|
| Confirmed Cases | Prediction (The prediction is done on 24th of August 2020 | 247,984 | 1401 | 4,061,952 | 247,984 | 1401 | 4,61,952 | 248,616 | 1427 | 4,180,774 |
| First zero | NA | NA | NA | NA | NA | NA | NA | NA | NA |
| New Cases | Prediction | 1,197 | 18 | 38,220 | 1197 | 18 | 38,221 | Zero | Poor Model | Poor Model |
| First Zero | 17th of August 2020 | NA | NA | 26th of July 2020 | NA | NA | 6 the of July 2020 | Poor Model | Poor Model |
| Death Cases | Prediction | 119 | Zero | Zero | 119 | Zero | Zero | Poor Model | Poor Model | Zero |
| First Zero | NA | 9th of April 2020 | 18th of July 2020 | NA | 2nd of May 2020 | 12th of July 2020 | Poor Model | Poor Model | 5th of July 2020 |


