Article

Historical Change and Ecological Risk of Potentially Toxic Elements in the Lake Sediments from North Aral Sea, Central Asia

1
State Key Laboratory of Desert and Oasis Ecology, Xinjiang Institute of Ecology and Geography, Chinese Academy of Sciences, Urumqi 830011, China
2
Research Center for Ecology and Environment of Central Asia, Chinese Academy of Sciences, Urumqi 830011, China
3
University of Chinese Academy of Sciences, Beijing 10049, China
*
Author to whom correspondence should be addressed.
Appl. Sci. 2020, 10(16), 5623; https://doi.org/10.3390/app10165623
Submission received: 20 July 2020 / Revised: 10 August 2020 / Accepted: 12 August 2020 / Published: 13 August 2020
(This article belongs to the Section Earth Sciences)

Abstract

:
The Aral Sea has received worldwide attention for the deterioration of its biological and chemical status. The accumulation of potentially toxic elements (PTEs) in the lake sediments reflects changes in the surrounding watershed and represents a potential hazard for the lake ecosystem. In conjunction with existing environmental records from the Aral Sea basin, sedimentary records of PTEs in North Aral Sea covering a short time scale, anno Domini (AD) 1950–2018, were used to reveal historical changes in PTE concentrations and potential risks to lake functioning. The results suggested that the levels of PTEs in lake sediments from North Aral Sea changed abruptly around 1970 AD, which is concurrent with the intensification of human activities within the basin. After 1970 AD, with the exception of As, which remained at unpolluted-to-moderately polluted levels, the geo-accumulation indices of the remaining PTEs studied (V, Cr, Zn, Co, Pb, Ni, Cu and Cd) inferred a moderately polluted status. Before 1970 AD, the total ecological risk was low, but since 1970, the total ecological risk index has exceeded 150, indicating moderate risk. Historical changes in PTE levels of lake sediments from North Aral Sea and their potential ecological risks are reported for the first time. The conclusions provide an important reference for the protection of lake ecosystems and will provide data for regional/global comparisons of environmental change during the Anthropocene.

1. Introduction

The arid region of Central Asia with sparse precipitation and very fragile ecosystems [1]. Climate change and human activities are very likely to cause changes in ecosystems, even major ecological disasters [2,3]. Environmental problems caused by excessive development and utilization of water and ecological resources have become increasingly prominent, resulting in reduced water reserves, deteriorated water quality, salt dust storms, and impacted ecosystems. They have seriously restricted the social development and stability of countries within arid regions. The “Aral Sea Crisis” is the most prominent environmental problems in Central Asia [4,5,6,7]. Excessive and unreasonable development and water uses in the Aral Sea area have resulted in a large amount of industrial and domestic wastewater, pesticides, chemical fertilizers, saline and alkaline water entering the Aral Sea, with residual irrigation water and agricultural discharges also becoming important sources of pollution [4,5,6,7,8]. The dependence of agricultural activities on chemical supplies for decades has resulted in chemical pollutions in lakes and watersheds [9], e.g., from 1980 to 1992, the pesticides used in the Karakalpakstan area reached 29,000 tons, and the usage per unit area reached 72 kg/ha, much higher than in the United States (1.6 kg/ha) and Russia (4 kg/ha) during the same period [10]. Former studies have suggested that pesticide use in Aral Sea basin is as high as 54 kg/ha, which is much higher than the average value of 3 kg/ha in the former Soviet Union [11]. In addition, wastewater containing high-concentrations of agricultural chemicals and salt generated by leaching and discharging from farmland, which eventually resulted in the enrichment of the brackish seawater and sediments in organic phosphorus compounds, dichloro-diphenyl-trichloroethane (DDT), lindane and other pesticides and fertilizers [5,7]. With an increase in lake water salinity, pollutants and salt deposit onto the lake bottom, and are swept away in frequent dust storms when dried out. Harmful chemicals such as pesticides and heavy metals thus disperse, posing a serious health hazard to residents in the local area and areas traversed by the chemical dust storms [9,12,13]. The most widely reported health effects in the area of the Aral Sea include anemia, cancer, respiratory diseases and birth defects. These conditions are directly or indirectly related to regional environmental degradation [7,9,14,15].
Lakes in arid areas provide a record of ecological responses to the interaction between humans and nature. Research examining the environmental evolution of lake sediments in the Aral Sea has mainly been focused on the systematic study of changes in the historic climate, vegetation, and other environmental components over long-term scales since the Quaternary [16,17,18,19]. In view of research findings, more remote sensing techniques were used to assess the impact of human activities on the Aral Sea and its watersheds, to explore the causes of lake shrinkage and to predict the lake’s future destiny [20,21,22]. The current environmental status of water, soil and sediment within the Aral Sea basin was determined [23]. Schettler et al. [24,25] conducted related research on the evolution of different hydrochemical types of surface water, lake water and groundwater. Törnqvist et al. [26] found the concentrations of harmful substances such as copper, arsenic, nitrite and DDT in the water system of the basin to exceed applicable health standards. Rosen et al. [27] used the characteristics of pesticides (DDT, Hexachlorocyclohexane) in the sediments of 13 shallow lakes in Uzbekistan to study the impact of human activity on lakes. Rzymski et al. [28] studied the status of pollutants of trace elements in the surface waters of the North Aral Sea and Syr Darya River. Heavy metals occurring in sediments are potentially toxic to lake functioning [29,30,31], but once the lake dries up, these elements are transferred to the atmosphere through salt dust storms, with the potential to impact the broader environment [32,33,34]. However, no research has been conducted on historical changes in the levels of potentially toxic elements (PTEs) occurring in the lake sediments. Limited water resources, destruction of ecosystems and pollution have severely affected the development of the region’s socioeconomics. A balance between the sustainable use of natural resources by humans and the protection of the ecological environment needs to be established. Coping with complex developmental challenges through innovations in technology and cooperation between the international scientific and technology communities have become common appeals of all countries in Central Asia.
How to coordinate the relationship between lake-basin resources, and sustainable environmental, social and economic development needs to be studied urgently. In this paper, sedimentary records of PTEs and magnetic susceptibility from North Aral Sea combined with the evaluation of potential ecological hazards, the process of historical change and ecological risks of PTEs were revealed over a short time scale. It will provide a scientific basis for assessing the influences of the anthropogenic factors on the lake environment of Aral Sea in Central Asia.

2. Materials and Methods

2.1. Geographic Background

Aral Sea is a closed inland lake, formerly the largest Lake in Central Asia, with the runoff of the largest rivers, Amu Darya and the Syr Darya in Central Asia (Figure 1). Total surface area of Aral Sea Basin is about 154.9 × 10⁴ km2 [35]. Before 1960, the entire Aral Sea remained at 6.8 × 10⁴ km2 with a water salinity of about 10 g/L [35]. The records show that although the irrigated area of the basin increased from 1911 to 1960, human activities did not significantly affect the lake area [7]. Before 1960, the inflow into the entire Aral Sea was about 63 km3. After the 1960s, the cultivation of crops resulted in a large increase in agricultural irrigation and domestic water consumption. During the period from 2006 to 2010, the inflow to the lake was reduced to only 4.1 km3 [7,36]. In 1988, the North Aral Sea (small Aral) became separated from the South Aral Sea; however, a channel continued to connect them. In 1988, the water level of the lake was the lowest, with an elevation of 39.7 m (above the Baltic Sea level) [37,38,39]. From the sampling position (Figure 1), it ensured that our sampling point was always within the range of the lake. Kokaral Dam was built in 1992, which prevent the outflow of water from the North Aral to the Sourh Aral [40]. The flow of the Syr Darya into the North Aral Sea induced the stability and increasement of water level of North Aral Sea [37,38,39]. Different from the North Aral Sea, the water quality of the South Aral continues to deteriorate, not only in terms of the continuous decline in lake water level [37,39]. The current maximum salinity of the South Aral Sea is estimated to be 200 g/L [41]. Field surveys in South Aral Sea conducted between 1990 and 2002 found that many species of phytoplankton (216 species), zooplankton (38 species) and benthic fauna (57 species) had disappeared, and only two of the original 20 fish species were observed [6].

2.2. Sampling and Laboratory Methods

On 9 June 2018, a sediment core (NAS-01) was collected from North Aral Sea (60.96052° E, 43.32531° N). The core was 30 cm in length and was sampled in situ in the field at 1 cm intervals for a total of 30 samples.
The specific activity of 137Cs is typically used to determine the chronological sequence of lake sediment cores. 137Cs analysis was performed by γ-spectrometry using an ORTEC HPGe GWL germanium detector (EG&G ORTEC, Oak Ridge, TN, USA).
Samples were ground to 200 mesh, digested with nitric acid (HNO3), hydrofluoric acid (HF) and perchloric acid (HClO4), and analyzed by ICP-AES (Prodigy, Teledyne Leeman Labs, Hudson NH, USA) to determine the V concentration (limit of detection: LOD = 2 mg/kg). ICP-MS (7700x, Agilent Technologies, Palo Alto, USA) was used to measure PTE concentrations Cr (LOD = 0.1 mg/kg), Co (LOD = 0.01 mg/kg), Ni (LOD = 0.05 mg/kg), Cu (LOD = 0.02 mg/kg), Zn (LOD = 0.2 mg/kg), As (LOD = 0.1 mg/kg), Cd (LOD = 0.01 mg/kg) and Pb (LOD = 0.02 mg/kg). The standard reference material GBW07311 [42] was used to ensure the reliability of the analytical data. The relative error was determined to be less than 5%.
To measure the magnetic susceptibility (MS) with low-frequency (470 Hz) and high-frequency (4700 Hz) with a Bartington MS2 fitted with a MS2B dual-frequency sensor (Bartington Instruments, UK), a freeze-dried sediment sample was loaded into a special box with a volume of 8 mm3, and the box containing the sample was weighed and measured. Each sample was measured three times and the mean value was taken.

2.3. Potential Ecological Risk Index (PERI)

The PERI [30,43,44,45,46] for PTEs was calculated as follows
C f i = ( C n i / B 0 i )
E r i = i = 1 n T r i × C f i
R I = i = 1 n E r i
where RI: total risk index; Er: individual PTE PERI; Tr: toxic-response factor, V = 2, Zn = 2, Cr = 2, Cu = 5, Co = 5, Ni = 5, Pb = 5, As = 10, Cd = 30 [47]; Cn: the content of PTEs; B0: background PTE concentration. Potential ecological risk index classification criteria are shown in Table 1 [29].

2.4. Geo-Accumulation Index (Igeo)

The index of Igeo [29,48,49] can determine the extent of PTE pollution in the natural environment of the North Aral Sea.
I g e o = log 2 [ C n 1.5 B n ]
where Cn: PTE concentration; Bn: PTE background concentration. The classification standards for Igeo are as follows: practically unpolluted (Igeo < 0); 0 < Igeo < 1, suggested unpolluted to moderately polluted; 1 < Igeo < 2, reflected moderately polluted, etc. [29].

3. Results

3.1. Summary Statistics for 12 Environmental Parameters

Summary statistics for 12 environmental parameters measured in the sediment core from the North Aral Sea was shown in Table 2. The mean value for the potentially toxic element V was 91.6 mg/kg, with maximum and minimum values of 127.5 and 29.5 mg/kg, respectively. The mean, maximum and minimum concentrations for Cr were 59.3, 80.4 and 18.2 mg/kg, respectively. The average Co concentration was 10.2 mg/kg (minimum: 3.18 mg/kg, maximum: 14.0 mg/kg). The minimum, maximum and average concentrations of Ni were 7.72, 40.9 and 33.2 mg/kg, respectively. The maximum value of Cu concentration was 37.5 mg/kg, the minimum was 5.16 mg/kg and the mean value was 22.8 mg/kg. The mean value of Zn concentration was 61.2 mg/kg, with maximum and minimum values of 90.0 and 17.4 mg/kg, respectively. The mean, maximum and minimum values for as were 11.4, 18.3 and 3.78 mg/kg, respectively. Cd levels were the lowest among the nine PTEs with an average concentration of 0.192 mg/kg. The minimum, maximum and mean Pb concentrations were 4.64, 22.8 and 15.4 mg/kg, respectively. The maximum value of low-frequency MS was 15.9 × 10⁻⁸ m3/kg, and the minimum was 1.91 × 10⁻⁸ m3/kg with average of 10.7 × 10⁻⁸ m3/kg. The mean high-frequency measured in North Aral Sea sediment was 10.3 × 10⁻⁸ m3/kg.

3.2. Vertical Distribution of Environmental Parameters

The specific activity of 137Cs in top layer of the lake sediments from North Aral Sea was 13.6 Bq/kg, corresponding to the sampling time of 2018. The main accumulation peak (29.3 Bq/kg) appeared at 18 cm, which may correspond to the Chernobyl nuclear leak that occurred in the former Soviet Union in 1986 [50,51]. The peak at 28 cm (2.29 Bq/kg) corresponds to year 1954 [52], while the peak at 24 cm (13.3 Bq/kg) may correspond to year 1963 [53,54]. The age of the sediment core was interpolated from the 137Cs time-markers. The linear fitting curve of depth (x) and age (y) was Y= −2.37X + 2022.4 (r2 = 0.98, p = 0.01).
Interestingly, the most striking result to emerge from Figure 2, showing the vertical distributions of environmental parameters, is the occurrence of three obvious discontinuities that divide the PTE profiles into four relatively obvious stages. Below 21 cm, the PTE concentration is low, and after a rapid increase to a depth of 9 cm, another spike in PTE concentration occurs. From 9 to 2 cm, the increase in PTE concentration is gradual. A significant change in PTE concentration is noted again in the surface sediments, but the trend is opposite to that of the first two mutation points, with the PTE concentration starting to decrease.

4. Discussion

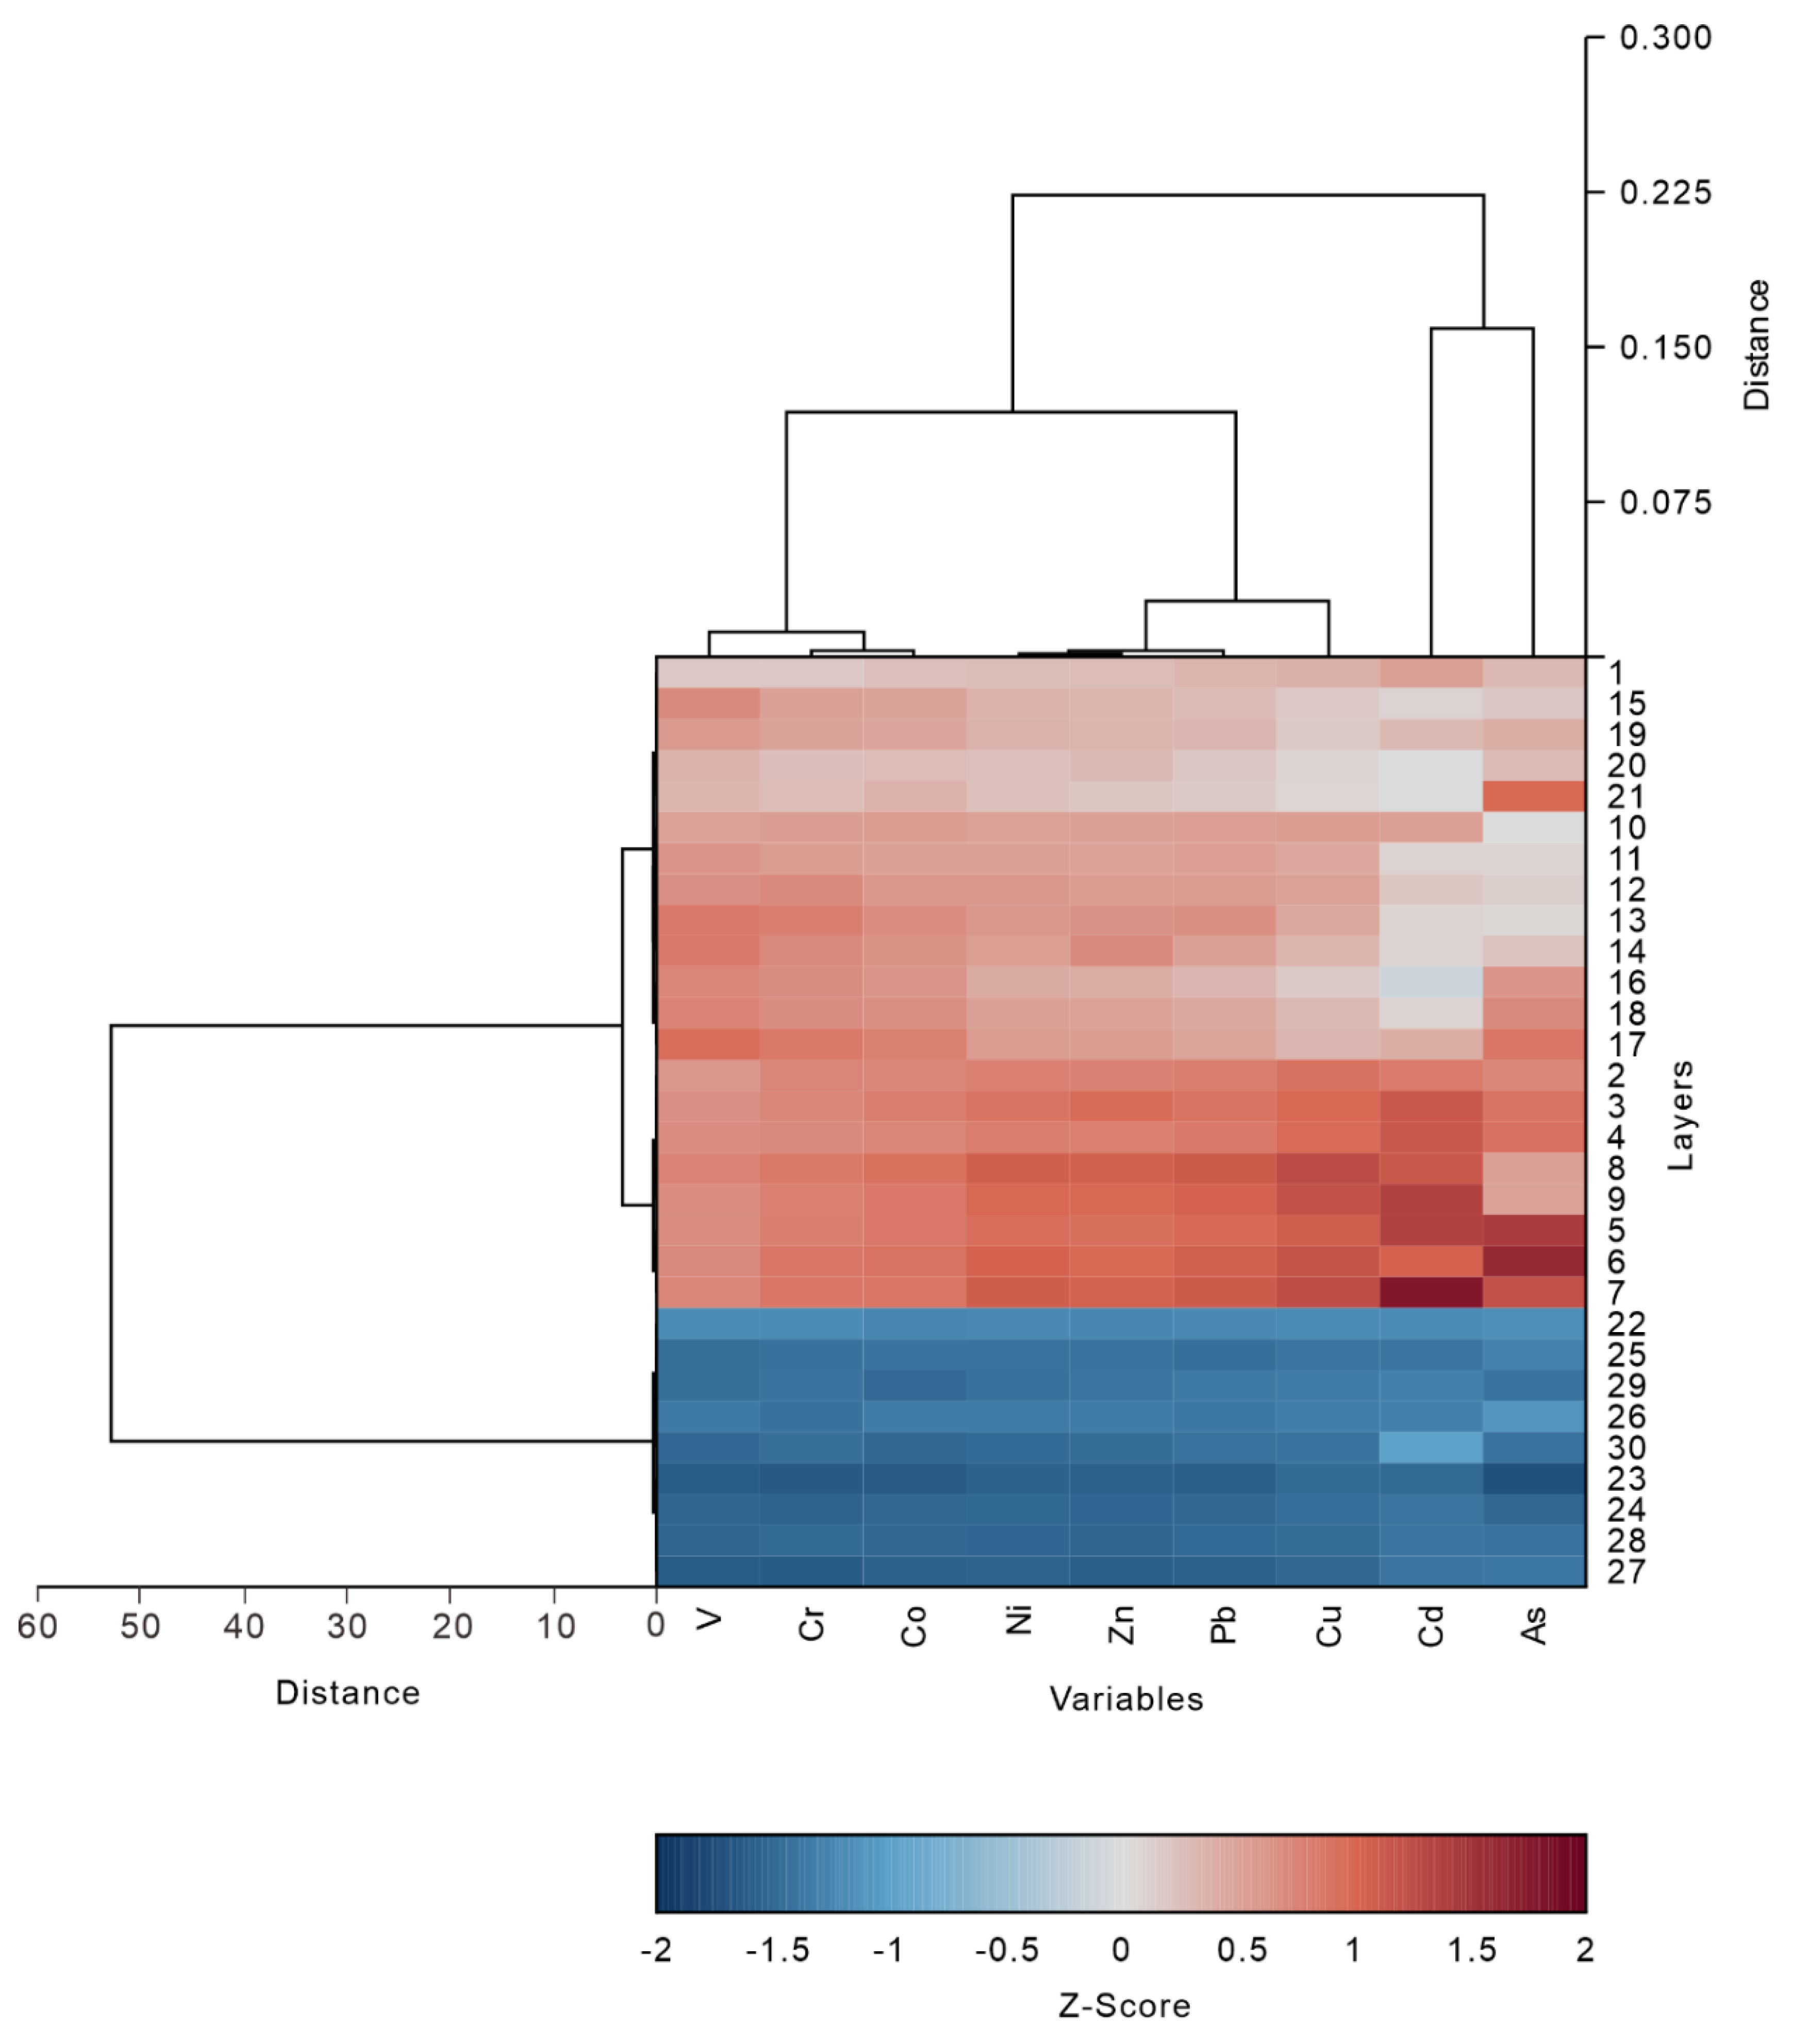
Although the statistical data (Table 2) and vertical distributions of heavy metals (Figure 2) can reflect changes in PTEs as a whole, clustering analysis can provide an objective grouping method for PTEs [55,56]. In general, most studies apply cluster analysis to PTEs examine the relationship between variables. However, Figure 3 shows the two-way dendrogram for the clustering of PTEs and sample layers generated with two-way cluster analysis.
The connection distance shown on the graph is a standardized Euclidean distance and represents the relative similarity between the sample layers and the PTEs. Differences between the clusters can be used to distinguish sample layers and PTEs. Judging from the distances between the sample horizons, there is a huge difference between the first layer (0–21 cm) and the second layer (22–30 cm). If the first layer (0–21 cm) were further divided, it could be divided into three secondary layers (0–1 cm), (2–9 cm) and (10–21 cm), which are consistent with the stages noted in the vertical distribution plots (Figure 2). The cluster analysis showed that separation of the sediment core into layers based on the characteristics of PTEs achieves good results. In addition to sample horizons, the cluster analysis also allows for easier determination of the affinity between PTEs. Clustering between PTEs indicated that the nine PTEs could be divided into three clusters. The first PTE cluster includes Cd and As, which are also the elements with the largest toxicity coefficients among the nine PTEs studied. The second group includes Ni, Zn, Pb and Cu, and the third group includes V, Cr and Co. The elements in the second and third groups are more closely related compared with the elements of the first group. The results show the usefulness of micro-geochemical features that may not be identifiable by comprehensive statistical data alone. Temporal changes in the geo-accumulation index of each PTE are depicted in Figure 4. The geo-accumulation index of all nine PTEs was less than 0 before 1970, indicating that the status of all PTEs was practically unpolluted. From 1970 to 1975, PTEs became significantly enriched. After 1975, with the exception of as (0–1), the geo-accumulation index of the PTEs was greater than 1, reflecting a moderately polluted status. What factors have caused this obvious change?
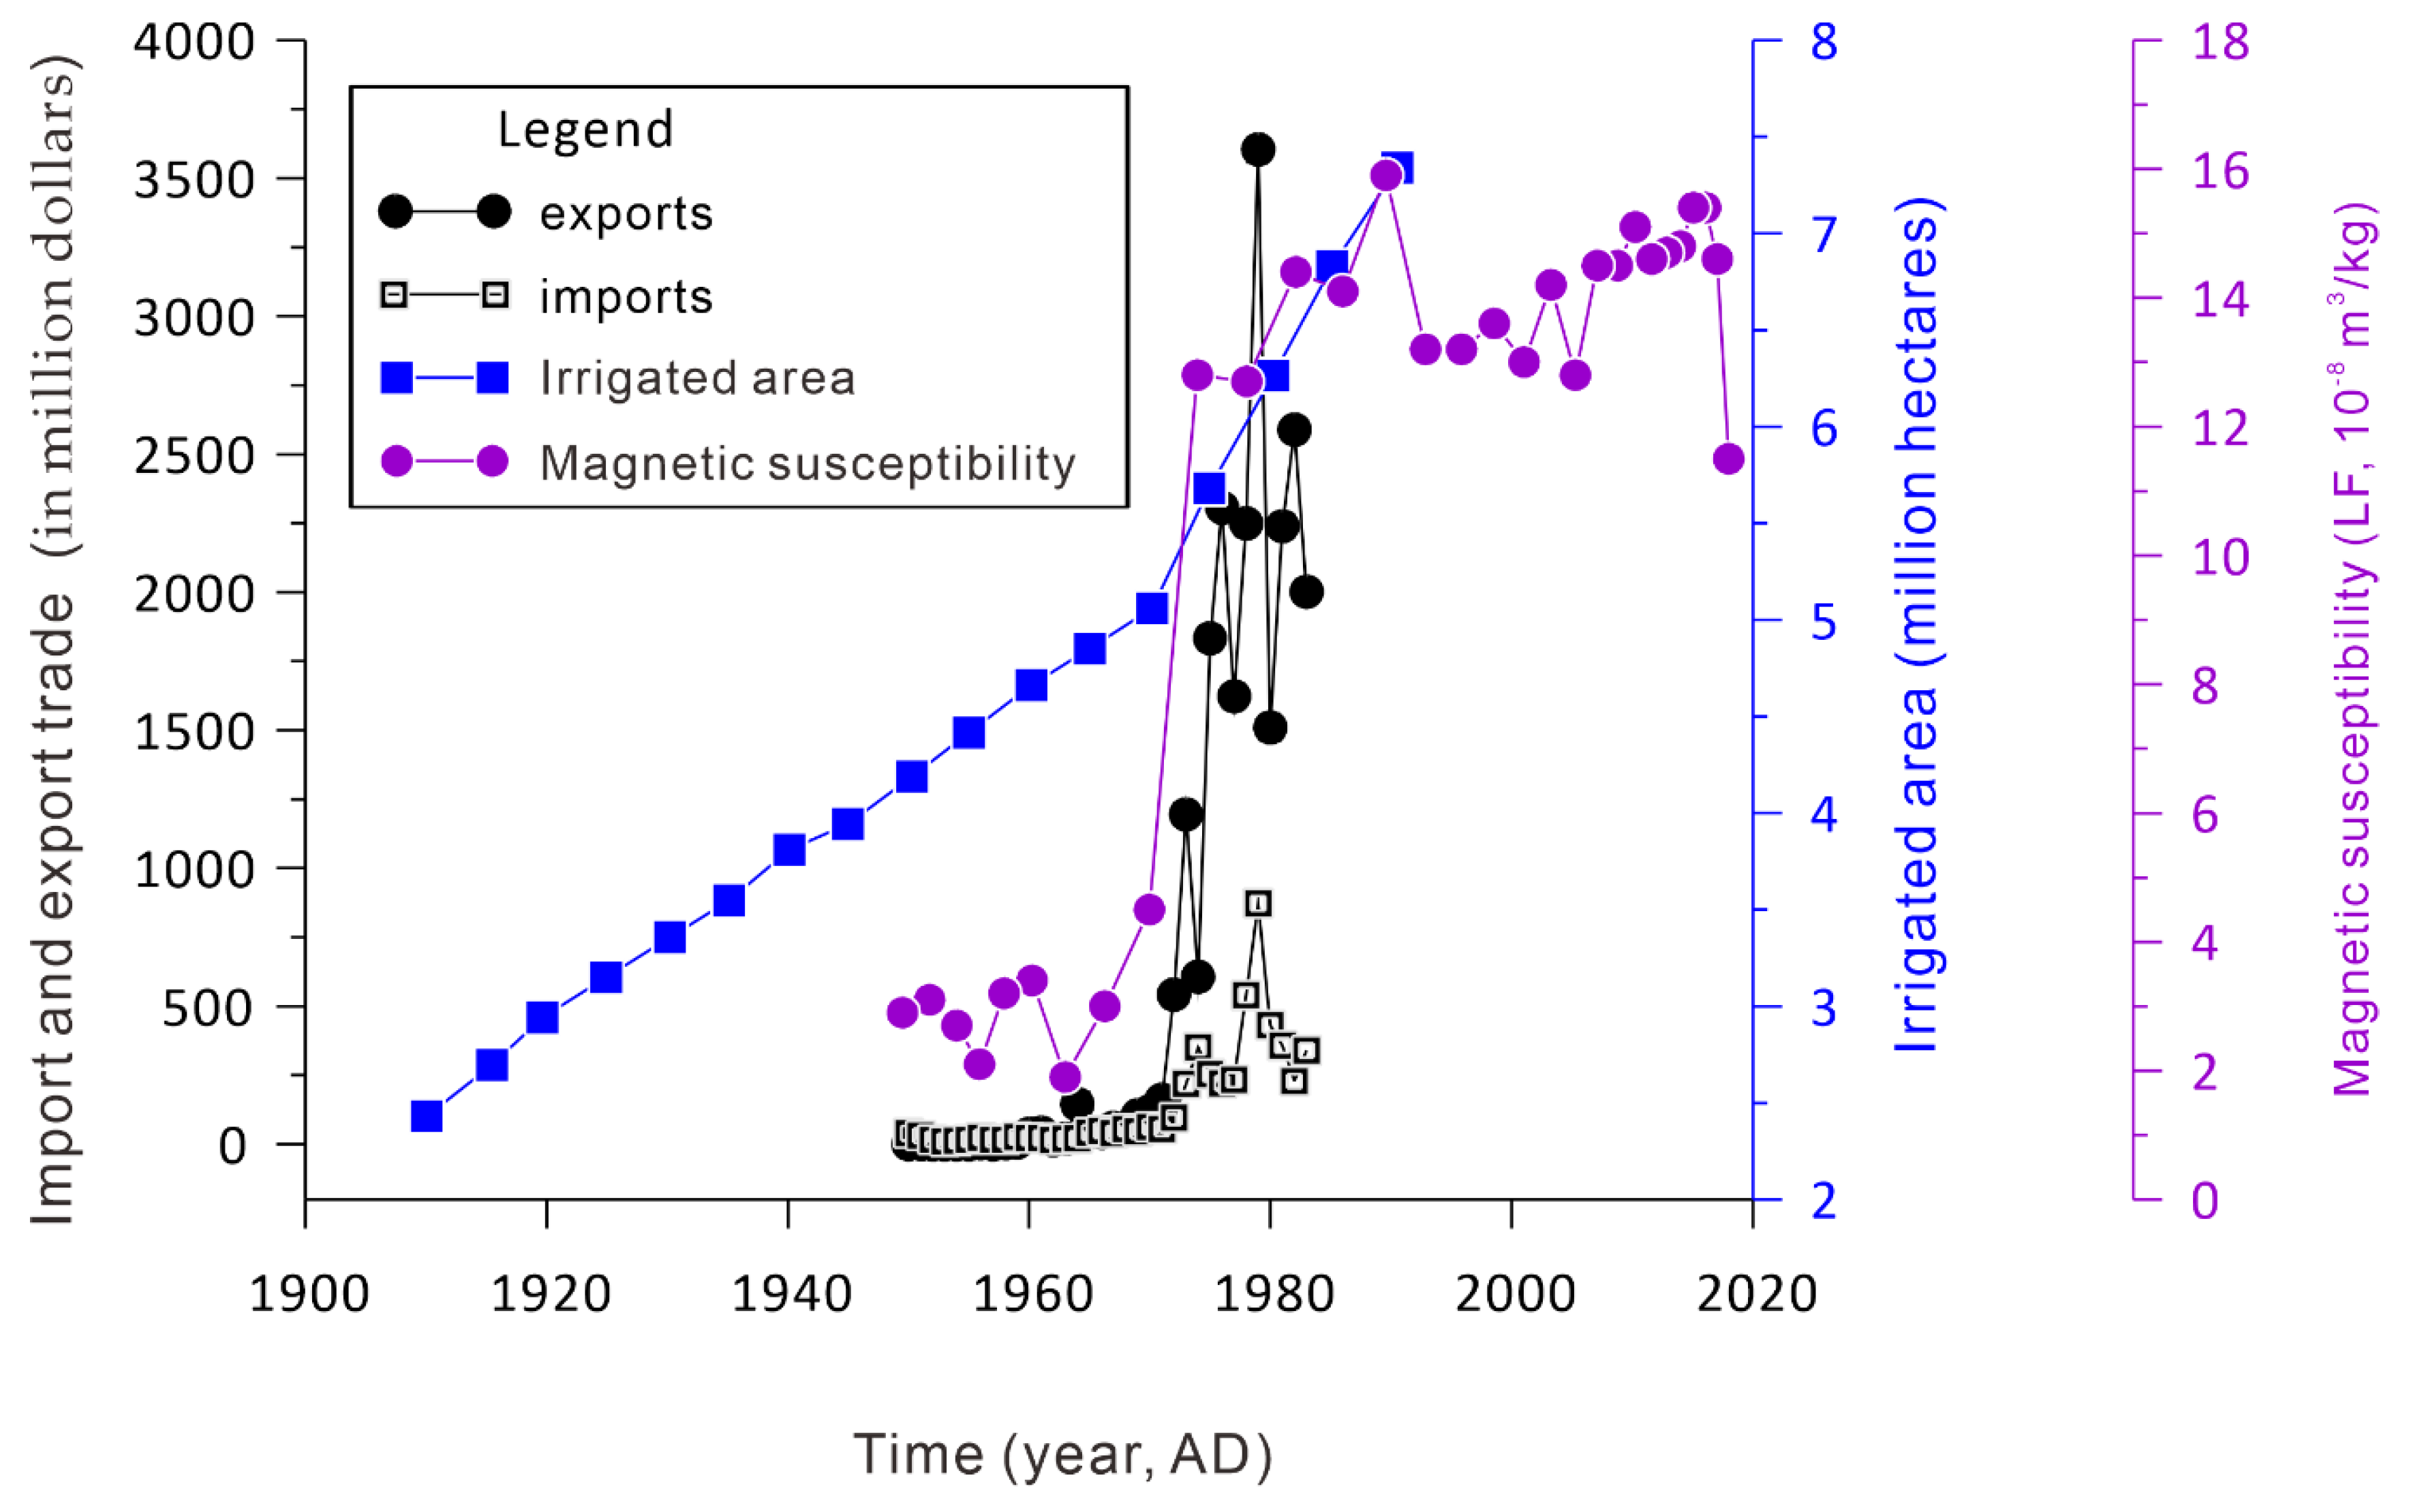
The high-frequency MS and low-frequency MS of the Aral Sea sediments are significantly correlated, which is a typical characteristic of lake sediments [57]. In lacustrine sediments, the correlation between magnetic susceptibilities measured at different frequencies is very good, and the correlation coefficient (r) can exceed 0.99 (p < 0.001), indicating that increasing magnetic susceptibility is related to an increase in the content of magnetic minerals. Previous studies have shown that MS can be used to reflect the variations in the intensity of human activities [58,59,60]. The intensification of human activities has led to the enrichment in ferromagnetic materials of surface materials entering the lake, which has led to a significant increase in magnetic susceptibility since 1970 AD. Figure 5 shows changes over time in magnetic susceptibility, temporal changes in surface area of irrigated Land in Aral Sea basin [61], and the volume of import and export trade between the former Soviet Union and the United States. Temporal changes in surface area of irrigated Land (million hectares) in the Aral Sea basin, to a certain extent, reflect changes in agricultural intensity. The area of irrigated Land in Aral Sea basin was slowly increasing before the 1970s but showed a drastic increase during the 1970s (Figure 5). A sudden change in the trade activity between the former Soviet Union and the United States was also noted in the 1970s, which reflects the development of industry in the former Soviet Union. Significant changes in industry and agriculture in the former Soviet Union during the 1970s also had a dramatic impact on the earth surface of the basin.
The correlation coefficients (Table 3) indicate that the significant enrichment in PTEs is related to the significant enhancement in human activities after the 1970s. The sedimentary record of Ebinur Lake in neighboring China suggests an enhancement in human activities since the early 1960s [60], while the sedimentary records of Bosten Lake [62] and Chaiwopu Lake [63] indicate an enhancement in human activities since the 1950s. This reflects spatial differences in background anthropogenic activities between different watersheds. Through this research, we discovered the relationship among the intensity of human activities and the accumulation of PTEs in the sediment core from North Aral Sea, but the specific source of PTEs was not determined. For this, the results of this research may need to be integrated with isotope tracing studies [64,65,66,67], as well as source apportionment models [68,69,70,71] combined with the emission inventory for PTEs in the Aral Sea basin.
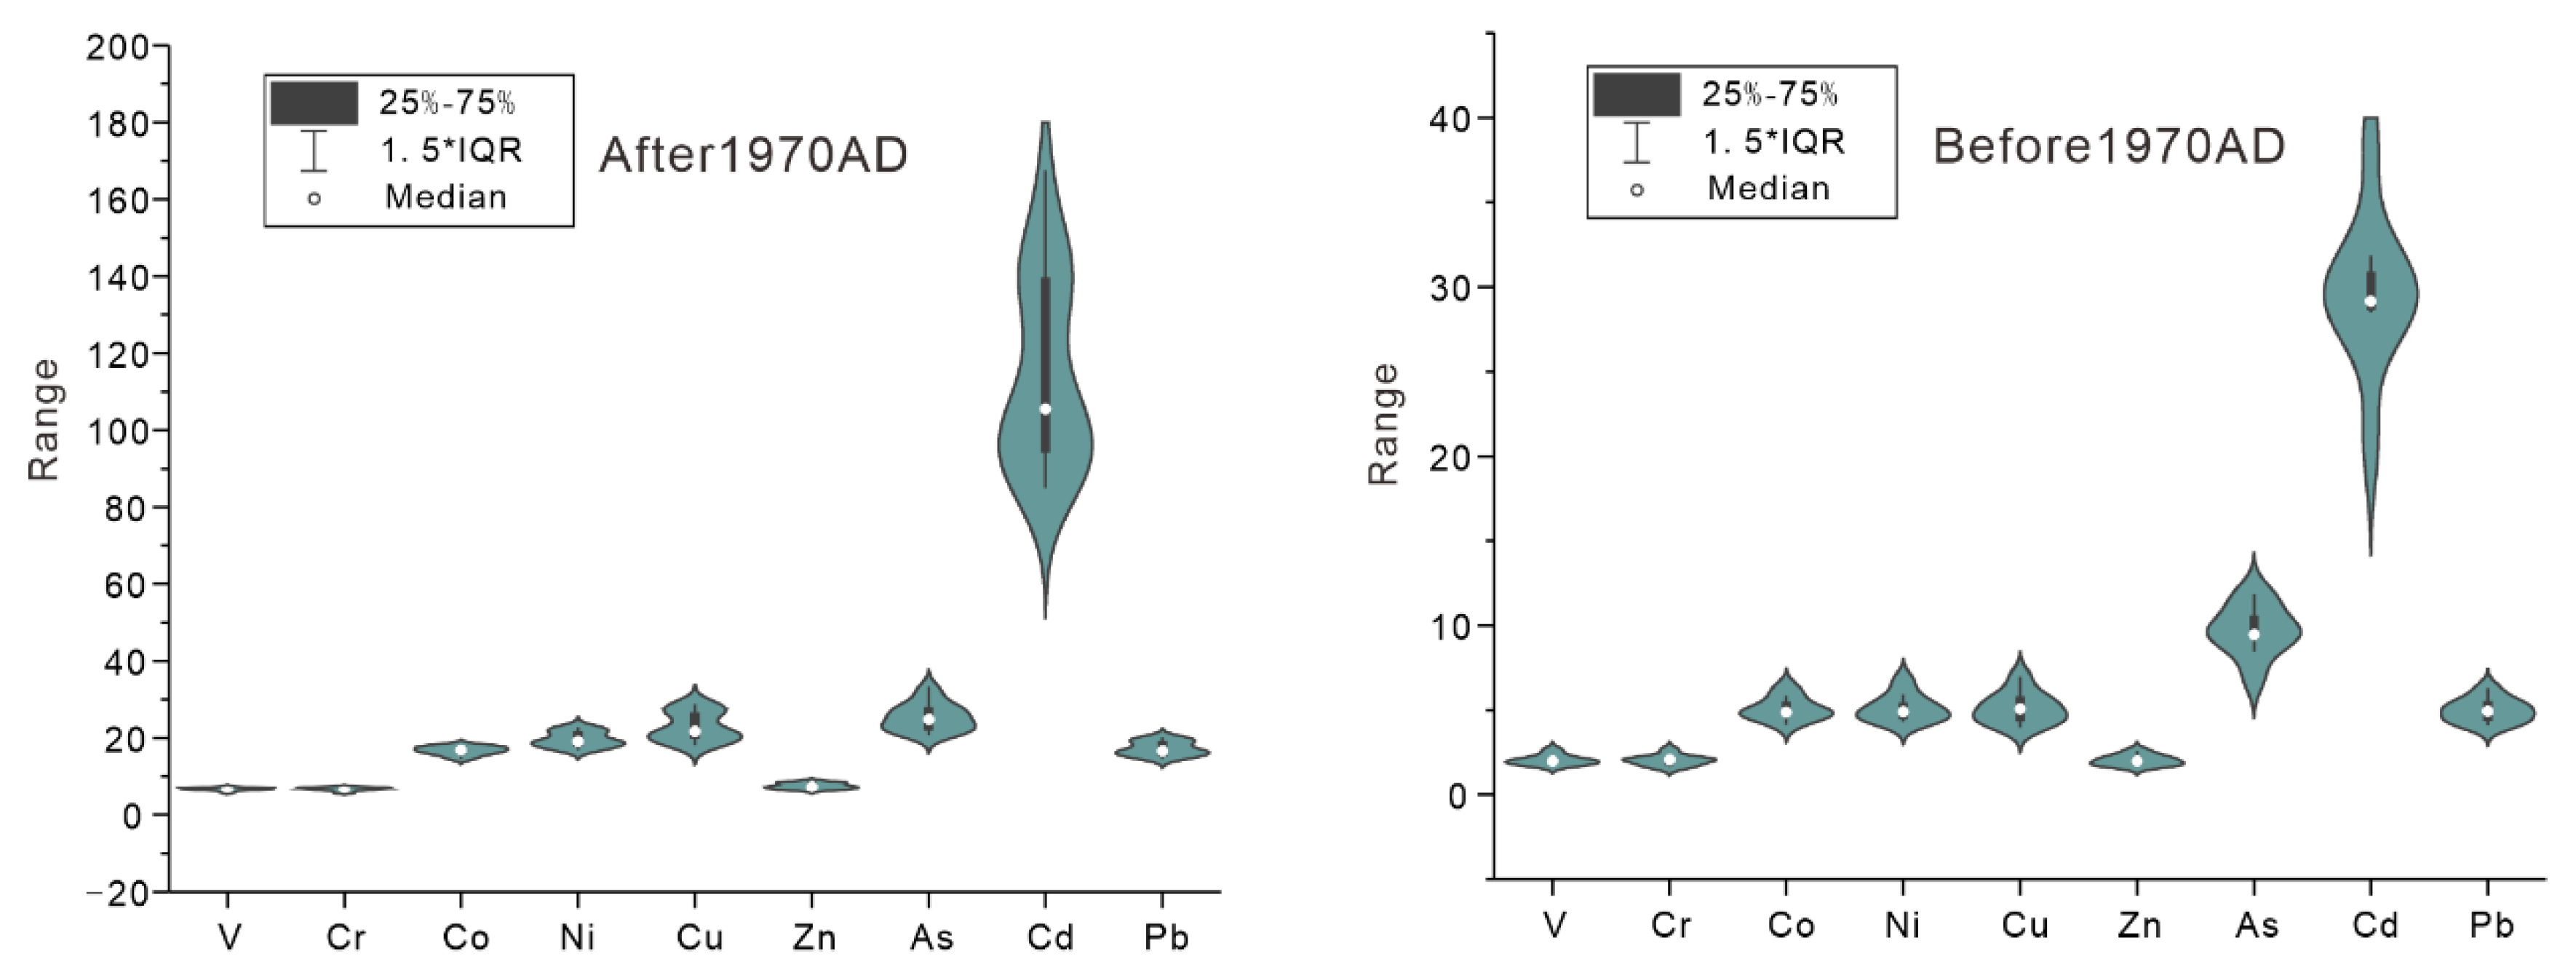
The PERI inferred the polluted degree of PTEs in the Lake sediments of North Aral Sea (Table S1). The results showed that Er values for the entire sediment core follow the ascending order of V < Cr < Zn < Co < Pb < Ni < Cu < As < Cd. With the exception of Cd, the ecological risk of individual elements was lower than 40, suggested the ecological risks for PTEs were low. Before 1970, the average ecological risk of Cd was 29.7, lower than 40. However, after 1970, the average Cd ecological risk index increased to 114.5, suggesting the Cd constitutes a considerable risk to the ecosystem of North Aral Sea (Figure 6).
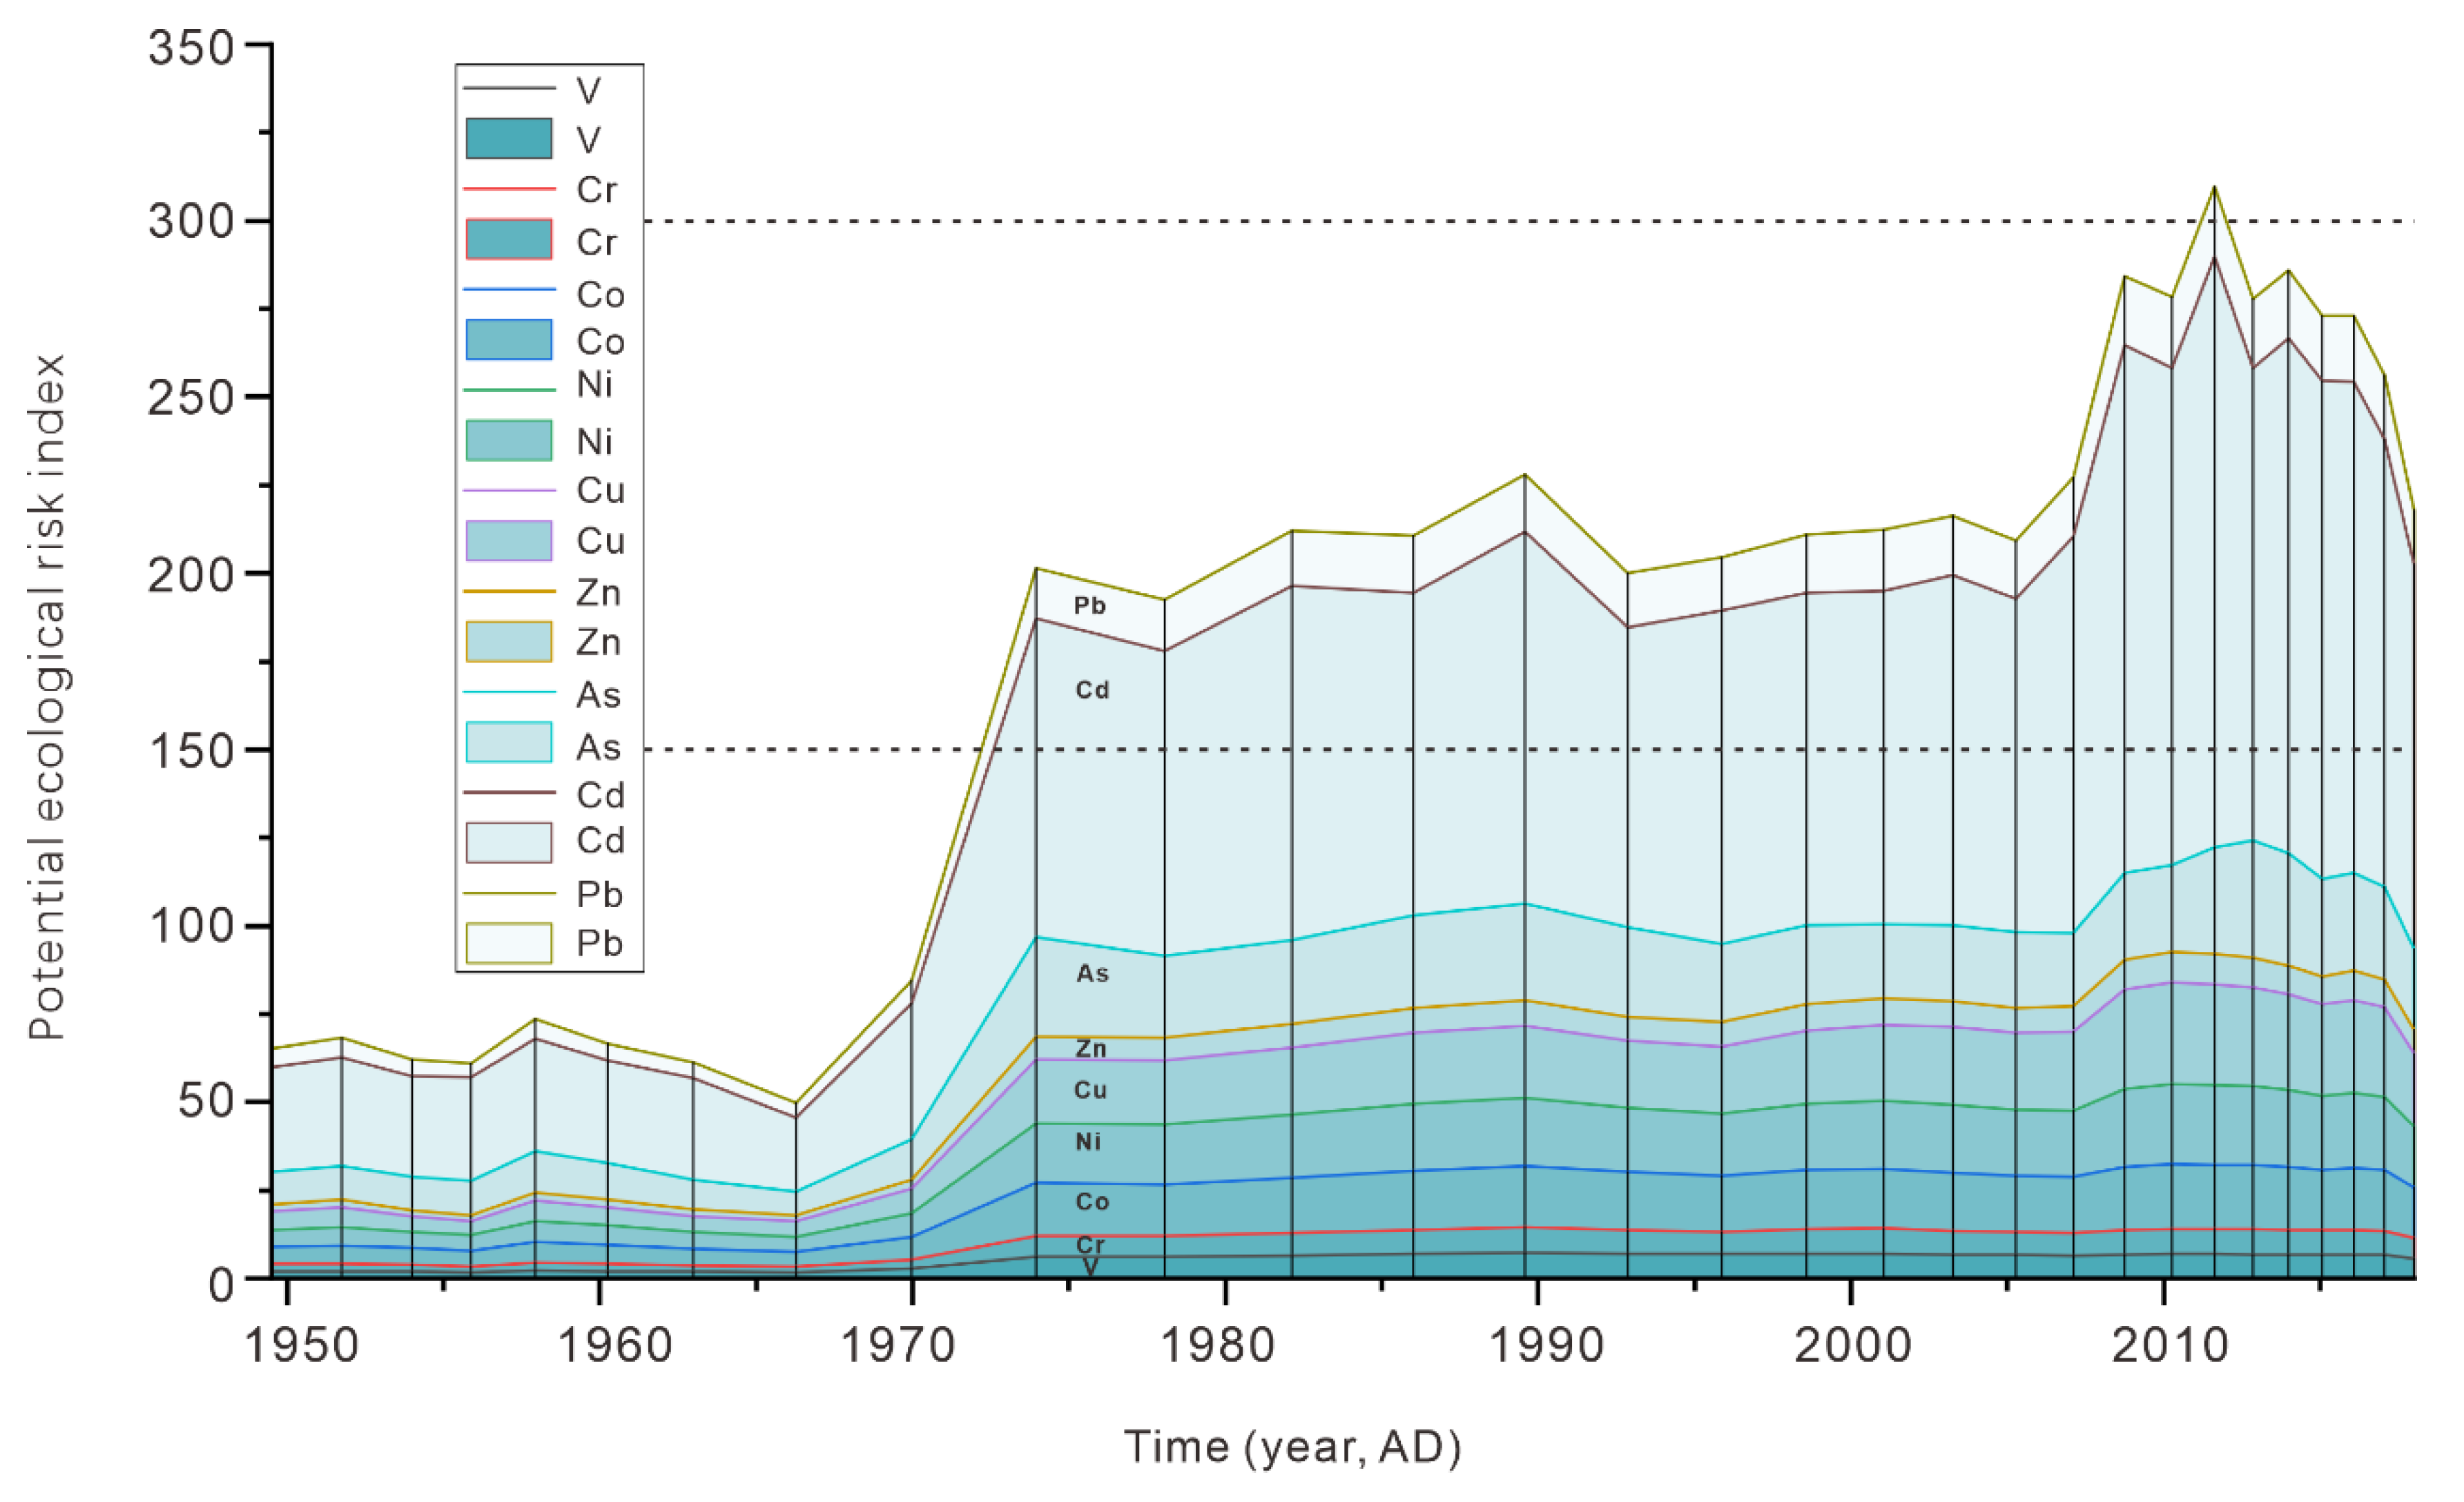
The RI values in the sediment core were all lower than 150 before 1970 AD, indicating that the integrated ecological risk of PTEs was at a low risk level. Since 1970, however, it is worth noting that the RI values have exceeded 150, which represents moderate risk. In particular, at a depth of 7 cm (ca. 2012 AD), the RI value reached 309.8, indicating a considerable risk (Figure 7). Overall, the PERI is used as an evaluation method for a large number of applications [72,73,74], and it will provide an important reference for the protection of lake ecosystems and will provide data for regional/global comparisons of environmental change during the Anthropocene. It must be mentioned that the grain size and the deposition rate of sediments will change with the variation in lake water level. On the other hand, the crystal precipitation of chemicals in lake water may also have an effect on the content of potentially toxic elements in sediments. Therefore, the relative contents of potentially toxic elements in core sediments may be quite different in different locations. Because of the difficulty of sampling in the Aral Sea, only one sediment core of the lake cannot fully reflect the overall enrichment law of lake sediments in the North Aral Sea, which is also one of the shortcomings of our paper.

5. Conclusions

This study evaluates historical changes in concentration and the potential ecological risks of PTEs in the lake sediments from North Aral Sea. The conclusions are as follows:
  • The contents of PTEs in the lake sediments from North Aral Sea changed abruptly around 1970 AD, which is associated with the anthropogenic intensification in the basin;
  • After 1975 AD, with the exception of as (Igeo < 1), the geo-accumulation index of PTEs (V, Cr, Zn, Co, Pb, Ni, C, and Cd) was greater than 1, reflecting a moderately polluted status;
  • Before 1970 AD, the total ecological risk index was lower than 150, indicating a low risk, but since 1970, the total ecological risk index has exceeded 150, which represents a moderate risk.

Supplementary Materials

The following are available online at https://www.mdpi.com/2076-3417/10/16/5623/s1, Table S1: Potential ecological risk index (PERI) of Potentially Toxic Elements (V, Cr, Co, Ni, Cu, Zn, As, Cd and Pb) from the lake sediments of North Aral Sea.

Author Contributions

Conceptualization, L.M.; Data curation, W.L.; Funding acquisition, L.M.; and J.A.; Investigation, L.M.; Methodology, L.M.; Project administration, L.M.; and J.A.; Visualization, W.L.; Writing—original draft, W.L. and L.M.; Writing—review & editing, L.M., J.A. and W.L. All authors have read and agreed to the published version of the manuscript.

Funding

This research was funded by the Regional Collaborative Innovation Project of Xinjiang Uygur Autonomous Region of China (2020E01013), National Natural Science Foundation of China (U1603242), Tianshan Youth Program of Xinjiang Uygur Autonomous Region, China (2018Q008) and the High-level Training Project of Xinjiang Institute of Ecology and Geography, CAS (E050030101).

Acknowledgments

We thank four anonymous reviewers for their helpful comments and suggestions that improved the manuscript. We thank Alim Samat, Gongxiao Ge, Gulnura Issanova and Galymzhan Saparov for their helps in the sampling process.

Conflicts of Interest

The authors declare no conflict of interest.

References

  1. Qi, J.; Bobushev, T.S.; Kulmatov, R.; Groisman, P.; Gutman, G. Addressing global change challenges for Central Asian socio-ecosystems. Front. Earth Sci. 2012, 6, 115–121. [Google Scholar] [CrossRef]
  2. Li, Z.; Chen, Y.; Li, W.; Deng, H.; Fang, G. Potential impacts of climate change on vegetation dynamics in Central Asia. J. Geophys. Res. 2015, 120, 12345–12356. [Google Scholar] [CrossRef]
  3. Saiko, T.A.; Zonn, I.S. Irrigation expansion and dynamics of desertification in the Circum-Aral region of Central Asia. Appl. Geogr. 2000, 20, 349–367. [Google Scholar] [CrossRef]
  4. Spoor, M. The aral sea Basin crisis: Transition and environment in former soviet central asia. Dev. Chang. 1998, 29, 409–435. [Google Scholar] [CrossRef]
  5. Micklin, P.P. Desiccation of the Aral Sea: A Water Management Disaster in the Soviet Union. Science 1988, 241, 1170–1176. [Google Scholar] [CrossRef] [Green Version]
  6. Mirabdullayev, I.M.; Joldasova, I.M.; Mustafaeva, Z.A.; Kazakhbaev, S.; Lyubimova, S.A.; Tashmukhamedov, B.A. Succession of the ecosystems of the Aral Sea during its transition from oligohaline to polyhaline water body. J. Mar. Syst. 2004, 47, 101–107. [Google Scholar] [CrossRef]
  7. Micklin, P. The past, present, and future Aral Sea. Lakes Reserv. Res. Manag. 2010, 15, 193–213. [Google Scholar] [CrossRef]
  8. Williams, W.D.; Aladin, N.V. The Aral Sea: Recent limnological changes and their conservation significance. Aquat. Conser. 1991, 1, 3–23. [Google Scholar] [CrossRef]
  9. Crighton, E.J.; Barwin, L.; Small, I.; Upshur, R. What have we learned? A review of the literature on children’s health and the environment in the Aral Sea area. Int. J. Public Health 2011, 56, 125–138. [Google Scholar] [CrossRef] [Green Version]
  10. Ataniyazova, O.A. Health and ecological consequences of the Aral Sea crisis. In Proceedings of the 3rd World Water Forum, Regional Cooperation in Shared Water Resources in Central Asia, Kyoto, Japan, 18 March 2003. [Google Scholar]
  11. Glazovsky, N.F. The Aral Sea Basin; The United Nations University Press: Tokyo, Japan, 1995. [Google Scholar]
  12. Shen, H.; Abuduwaili, J.; Samat, A.; Ma, L. A review on the research of modern aeolian dust in Central Asia. Arab. J. Geosci. 2016, 9, 625. [Google Scholar] [CrossRef]
  13. Abuduwaili, J. Saline dust storms and their ecological impacts in arid regions. J. Arid Land 2010, 2, 144–150. [Google Scholar] [CrossRef] [Green Version]
  14. Small, I.; Meer, J.v.d.; Upshur, R.E.G. Acting on an environmental health disaster: The case of the aral sea. Environ. Health Persp. 2001, 109, 547–549. [Google Scholar] [CrossRef] [PubMed]
  15. Zetterstrom, R. Child health and environmental pollution in the Aral Sea region in Kazakhstan. Acta Paediatrica 1999, 429, 49–54. [Google Scholar] [CrossRef] [PubMed]
  16. Chen, F.-H.; Chen, J.-H.; Holmes, J.; Boomer, I.; Austin, P.; Gates, J.B.; Wang, N.-L.; Brooks, S.J.; Zhang, J.-W. Moisture changes over the last millennium in arid central Asia: A review, synthesis and comparison with monsoon region. Quat. Sci. Rev. 2010, 29, 1055–1068. [Google Scholar] [CrossRef]
  17. Cretaux, J.-F.; Letolle, R.; Bergé-Nguyen, M. History of Aral Sea level variability and current scientific debates. Glob. Planet. Chang. 2013, 110, 99–113. [Google Scholar] [CrossRef]
  18. Sorrel, P.; Popescu, S.-M.; Head, M.J.; Suc, J.P.; Klotz, S.; Oberhänsli, H. Hydrographic development of the Aral Sea during the last 2000 years based on a quantitative analysis of dinoflagellate cysts. Paleogeogr. Paleoclimatol. Paleoecol. 2006, 234, 304–327. [Google Scholar] [CrossRef]
  19. Boomer, I.; Aladin, N.; Plotnikov, I.; Whatley, R. The palaeolimnology of the Aral Sea: A review. Quat. Sci. Rev. 2000, 19, 1259–1278. [Google Scholar] [CrossRef]
  20. Jin, Q.; Wei, J.; Yang, Z.-L.; Lin, P. Irrigation-Induced Environmental Changes around the Aral Sea: An Integrated View from Multiple Satellite Observations. Remote Sens. 2017, 9, 900. [Google Scholar] [CrossRef] [Green Version]
  21. Singh, A.; Behrangi, A.; Fisher, J.B.; Reager, J.T. On the Desiccation of the South Aral Sea Observed from Spaceborne Missions. Remote Sens. 2018, 10, 793. [Google Scholar] [CrossRef] [Green Version]
  22. Peneva, E.L.; Stanev, E.V.; Stanychni, S.V.; Salokhiddinov, A.; Stulina, G. The recent evolution of the Aral Sea level and water properties: Analysis of satellite, gauge and hydrometeorological data. J. Mar. Syst. 2004, 47, 11–24. [Google Scholar] [CrossRef]
  23. Shibuo, Y.; Jarsjö, J.; Destouni, G. Hydrological responses to climate change and irrigation in the Aral Sea drainage basin. Geophys. Res. Lett. 2007, 34, 34. [Google Scholar] [CrossRef]
  24. Schettler, G.; Oberhänsli, H.; Stulina, G.; Djumanov, J.H. Hydrochemical water evolution in the Aral Sea Basin. Part II: Confined groundwater of the Amu Darya Delta – Evolution from the headwaters to the delta and SiO2 geothermometry. J. Hydrol. 2013, 495, 285–303. [Google Scholar] [CrossRef]
  25. Schettler, G.; Oberhänsli, H.; Stulina, G.; Mavlonov, A.A.; Naumann, R. Hydrochemical water evolution in the Aral Sea Basin. Part I: Unconfined groundwater of the Amu Darya Delta-Interactions with surface waters. J. Hydrol. 2013, 495, 267–284. [Google Scholar] [CrossRef]
  26. Tornqvist, R.; Jarsjo, J.; Karimov, B. Health risks from large-scale water pollution: Trends in Central Asia. Environ. Int. 2011, 37, 435–442. [Google Scholar] [CrossRef]
  27. Rosen, M.R.; Crootof, A.; Reidy, L.; Saito, L.; Nishonov, B.; Scott, J.A. The origin of shallow lakes in the Khorezm Province, Uzbekistan, and the history of pesticide use around these lakes. J. Paleolimnol. 2018, 59, 201–219. [Google Scholar] [CrossRef]
  28. Rzymski, P.; Klimaszyk, P.; Niedzielski, P.; Marszelewski, W.; Borowiak, D.; Nowiński, K.; Baikenzheyeva, A.; Kurmanbayev, R.; Aladin, N. Pollution with trace elements and rare-earth metals in the lower course of Syr Darya River and Small Aral Sea, Kazakhstan. Chemosphere 2019, 234, 81–88. [Google Scholar] [CrossRef]
  29. Ke, X.; Gui, S.; Huang, H.; Zhang, H.; Wang, C.; Guo, W. Ecological risk assessment and source identification for heavy metals in surface sediment from the Liaohe River protected area, China. Chemosphere 2017, 175, 473–481. [Google Scholar] [CrossRef]
  30. Wang, Y.; Yang, L.; Kong, L.; Liu, E.; Wang, L.; Zhu, J. Spatial distribution, ecological risk assessment and source identification for heavy metals in surface sediments from Dongping Lake, Shandong, East China. Catena 2015, 125, 200–205. [Google Scholar] [CrossRef]
  31. Yi, Y.; Yang, Z.; Zhang, S. Ecological risk assessment of heavy metals in sediment and human health risk assessment of heavy metals in fishes in the middle and lower reaches of the Yangtze River basin. Environ. Pollut. 2011, 159, 2575–2585. [Google Scholar] [CrossRef]
  32. Liu, D.; Abuduwaili, J.; Wang, L. Salt dust storm in the Ebinur Lake region: Its 50-year dynamic changes and response to climate changes and human activities. Nat. Hazards 2015, 77, 1069–1080. [Google Scholar] [CrossRef]
  33. Abuduwailil, J.; Zhaoyong, Z.; Fengqing, J. Evaluation of the pollution and human health risks posed by heavy metals in the atmospheric dust in Ebinur Basin in Northwest China. Environ. Sci. Pollut. Res. 2015, 22, 14018–14031. [Google Scholar] [CrossRef] [PubMed]
  34. Issanova, G.; Abuduwaili, J.; Galayeva, O.; Semenov, O.; Bazarbayeva, T. Aeolian transportation of sand and dust in the Aral Sea region. Int. J. Environ. Sci. Technol. 2015, 12, 3213–3224. [Google Scholar] [CrossRef] [Green Version]
  35. Glazovsky, N.F. The salt balance of the aral sea. GeoJournal 1995, 35, 35–41. [Google Scholar] [CrossRef]
  36. Gaybullaev, B.; Chen, S.-C.; Kuo, Y.-M. Large-scale desiccation of the Aral Sea due to over-exploitation after 1960. J Mt. Sci. 2012, 9, 538–546. [Google Scholar] [CrossRef]
  37. Micklin, P. Aral Sea Basin Water Resources and the Changing Aral Water Balance. In The Aral Sea: The Devastation and Partial Rehabilitation of a Great Lake; Micklin, P., Aladin, N.V., Plotnikov, I., Eds.; Springer: Berlin/Heidelberg, Germany, 2014; pp. 111–135. [Google Scholar]
  38. Zonn, I.S.; Glantz, M.H.; Kostianoy, A.G.; Kosarev, A.N. A. In The Aral Sea Encyclopedia; Zonn, I.S., Glantz, M.H., Kostianoy, A.G., Kosarev, A.N., Eds.; Springer: Berlin/Heidelberg, Germany, 2009; pp. 7–48. [Google Scholar]
  39. Cretaux, J.F.; Kostianoy, A.; Bergé-Nguyen, M.; Kouraev, A. Present-Day Water Balance of the Aral Sea Seen from Satellite. In Remote Sensing of the Asian Seas; Barale, V., Gade, M., Eds.; Springer International Publishing: Cham, Switzerland, 2019; pp. 523–539. [Google Scholar]
  40. Plotnikov, I.S.; Ermakhanov, Z.K.; Aladin, N.V.; Micklin, P. Modern state of the Small (northern) Aral Sea fauna. Lakes Reserv. Res. Manag. 2016, 21, 315–328. [Google Scholar] [CrossRef]
  41. Aladin, N.V.; Gontar, V.I.; Zhakova, L.V.; Plotnikov, I.S.; Smurov, A.O.; Rzymski, P.; Klimaszyk, P. The zoocenosis of the Aral Sea: Six decades of fast-paced change. Environ. Sci. Pollut. Res. 2019, 26, 2228–2237. [Google Scholar] [CrossRef] [Green Version]
  42. Xie, X.; Yan, M.; Wang, C.; Li, L.; Shen, H. Geochemical standard reference samples GSD 9–12, GSS 1–8 and GSR 1–6. Geostand. Newsl. 1989, 13, 83–179. [Google Scholar] [CrossRef]
  43. Hakanson, L. An ecological risk index for aquatic pollution control. A sedimentological approach. Water Res. 1980, 14, 975–1001. [Google Scholar] [CrossRef]
  44. Lin, Q.; Liu, E.; Zhang, E.; Li, K.; Shen, J. Spatial distribution, contamination and ecological risk assessment of heavy metals in surface sediments of Erhai Lake, a large eutrophic plateau lake in southwest China. Catena 2016, 145, 193–203. [Google Scholar] [CrossRef]
  45. Kempter, H.; Krachler, M.; Shotyk, W.; Zaccone, C. Major and trace elements in Sphagnum moss from four southern German bogs, and comparison with available moss monitoring data. Ecol. Indic. 2017, 78, 19–25. [Google Scholar] [CrossRef]
  46. Huang, K.; Ma, L.; Abuduwaili, J.; Liu, W.; Issanova, G.; Saparov, G.; Lin, L. Human-Induced Enrichment of Potentially Toxic Elements in a Sediment Core of Lake Balkhash, the Largest Lake in Central Asia. Sustainability 2020, 12, 4717. [Google Scholar] [CrossRef]
  47. Zhang, J.; Deng, H.; Wang, D.; Chen, Z.; Xu, S. Toxic heavy metal contamination and risk assessment of street dust in small towns of Shanghai suburban area, China. Environ. Sci. Pollut. Res. 2013, 20, 323–332. [Google Scholar] [CrossRef] [PubMed]
  48. Karbassi, A.R.; Monavari, S.M.; Nabi Bidhendi, G.R.; Nouri, J.; Nematpour, K. Metal pollution assessment of sediment and water in the Shur River. Environ. Monit. Assess. 2007, 147, 107. [Google Scholar] [CrossRef] [PubMed]
  49. Adamo, P.; Arienzo, M.; Imperato, M.; Naimo, D.; Nardi, G.; Stanzione, D. Distribution and partition of heavy metals in surface and sub-surface sediments of Naples city port. Chemosphere 2005, 61, 800–809. [Google Scholar] [CrossRef]
  50. Callaway, J.; DeLaune, R.; Patrick, W., Jr. Chernobyl 137Cs used to determine sediment accretion rates at selected northern European coastal wetlands. Limnol. Oceanogr. 1996, 41, 444–450. [Google Scholar] [CrossRef]
  51. Abbasi, A. 210Pb and 137Cs based techniques for the estimation of sediment chronologies and sediment rates in the Anzali Lagoon, Caspian Sea. J. Radioanal. Nucl. Chem. 2019, 322, 319–330. [Google Scholar] [CrossRef]
  52. Pennington, W.; Tutin, T.G.; Cambray, R.S.; Fisher, E.M. Observations on Lake Sediments using Fallout 137Cs as a Tracer. Nature 1973, 242, 324–326. [Google Scholar] [CrossRef]
  53. Blais, J.M.; Kalff, J.; Cornett, R.J.; Evans, R.D. Evaluation of 210 Pb dating in lake sediments using stable Pb, Ambrosia pollen, and 137 Cs. J. Paleolimnol. 1995, 13, 169–178. [Google Scholar] [CrossRef]
  54. Liu, S.; Narentuya; Xia, B.; Chu, G.; Tian, M. Using 210Pbuns and 137Cs to date recent sediment cores from the Badain Jaran Desert, Inner Mongolia, China. Quat. Geochronol. 2012, 12, 30–39. [Google Scholar] [CrossRef]
  55. Swanson, S.K.; Bahr, J.M.; Schwar, M.T.; Potter, K.W. Two-way cluster analysis of geochemical data to constrain spring source waters. Chem. Geol. 2001, 179, 73–91. [Google Scholar] [CrossRef]
  56. Iqbal, M.; Khan, S.M.; Azim Khan, M.; Ahmad, Z.; Ahmad, H. A novel approach to phytosociological classification of weeds flora of an agro-ecological system through Cluster, Two Way Cluster and Indicator Species Analyses. Ecol. Indic. 2018, 84, 590–606. [Google Scholar] [CrossRef]
  57. Xu, X.-W.; Qiang, X.-K.; Fu, C.-F.; Zhao, H.; Chen, T.; Sun, Y.-F. Characteristics of frequency-dependent magnetic susceptibility in Bartington MS 2 and Kappabridge MFK 1-FA, and its application in loess-paleosol, red clay and lacustrine sediments. Chin. J. Geophys. 2012, 55, 197–206. (In Chinese) [Google Scholar]
  58. Hu, S.; Deng, C.; Appel, E.; Verosub, K.L. Environmental magnetic studies of lacustrine sediments. Chin. Sci. Bull. 2002, 47, 613–616. [Google Scholar] [CrossRef]
  59. Ma, L.; Abuduwaili, J.; Liu, W. Environmentally sensitive grain-size component records and its response to climatic and anthropogenic influences in Bosten Lake region, China. Sci. Rep. 2020, 10, 942. [Google Scholar] [CrossRef] [PubMed]
  60. Ma, L.; Wu, J.; Abuduwaili, J.; Liu, W. Geochemical Responses to Anthropogenic and Natural Influences in Ebinur Lake Sediments of Arid Northwest China. PLoS ONE 2016, 11, e0155819. [Google Scholar] [CrossRef] [Green Version]
  61. Cai, X.; McKinney, D.C.; Rosegrant, M.W. Sustainability analysis for irrigation water management in the Aral Sea region. Agric. Syst. 2003, 76, 1043–1066. [Google Scholar] [CrossRef] [Green Version]
  62. Liu, W.; Ma, L.; Abuduwaili, J. Anthropogenic Influences on Environmental Changes of Lake Bosten, the Largest Inland Freshwater Lake in China. Sustainability 2020, 12, 711. [Google Scholar] [CrossRef] [Green Version]
  63. Ma, L.; Wu, J.; Abuduwaili, J. Climate and environmental changes over the past 150 years inferred from the sediments of Chaiwopu Lake, central Tianshan Mountains, northwest China. Int. J. Earth Sci. 2013, 102, 959–967. [Google Scholar] [CrossRef]
  64. He, B.; Zhao, X.; Li, P.; Liang, J.; Fan, Q.; Ma, X.; Zheng, G.; Qiu, J. Lead isotopic fingerprinting as a tracer to identify the pollution sources of heavy metals in the southeastern zone of Baiyin, China. Sci. Total Environ. 2019, 660, 348–357. [Google Scholar] [CrossRef]
  65. Cheng, Y.; Zhang, R.; Li, T.; Zhang, F.; Russell, J.; Guan, M.; Han, Q.; Zhou, Y.; Xiao, X.; Wang, X. Spatial distributions and sources of heavy metals in sediments of the Changjiang Estuary and its adjacent coastal areas based on mercury, lead and strontium isotopic compositions. Catena 2019, 174, 154–163. [Google Scholar] [CrossRef]
  66. Huang, Y.; Zhang, S.; Chen, Y.; Wang, L.; Long, Z.; Hughes, S.S.; Ni, S.; Cheng, X.; Wang, J.; Li, T. Tracing Pb and Possible Correlated Cd Contamination in Soils by Using Lead Isotopic Compositions. J. Hazard. Mater. 2020, 385, 121528. [Google Scholar] [CrossRef] [PubMed]
  67. Jeon, B.; Scircle, A.; Cizdziel, J.V.; Chen, J.; Black, O.; Wallace, D.J.; Zhou, Y.; Lepak, R.F.; Hurley, J.P. Historical deposition of trace metals in a marine sapropel from Mangrove Lake, Bermuda with emphasis on mercury, lead, and their isotopic composition. J. Soils Sediments 2020, 1–11. [Google Scholar] [CrossRef]
  68. Lv, J. Multivariate receptor models and robust geostatistics to estimate source apportionment of heavy metals in soils. Environ. Pollut. 2019, 244, 72–83. [Google Scholar] [CrossRef] [PubMed]
  69. Guan, Q.; Zhao, R.; Pan, N.; Wang, F.; Yang, Y.; Luo, H. Source apportionment of heavy metals in farmland soil of Wuwei, China: Comparison of three receptor models. J. Cleaner Prod. 2019, 237, 117792. [Google Scholar] [CrossRef]
  70. Zhang, J.; Li, R.; Zhang, X.; Bai, Y.; Cao, P.; Hua, P. Vehicular contribution of PAHs in size dependent road dust: A source apportionment by PCA-MLR, PMF, and Unmix receptor models. Sci. Total Environ. 2019, 649, 1314–1322. [Google Scholar] [CrossRef]
  71. Wang, G.; Li, Y.; Wang, J.; Jia, Z.; Zhou, Y.; Zhou, S.; Xie, X. A modified receptor model for historical source apportionment of polycyclic aromatic hydrocarbons in sediment. Sci. Total Environ. 2020, 702, 134931. [Google Scholar] [CrossRef]
  72. Chen, J.; Zhang, H.; Li, J.; Liu, Y.; Shi, W.; Hu, H. The toxic factor of copper should be adjusted during the ecological risk assessment for soil bacterial community. Ecol. Indic. 2020, 111, 106072. [Google Scholar] [CrossRef]
  73. Liu, K.; Li, C.; Tang, S.; Shang, G.; Yu, F.; Li, Y. Heavy metal concentration, potential ecological risk assessment and enzyme activity in soils affected by a lead-zinc tailing spill in Guangxi, China. Chemosphere 2020, 126415. [Google Scholar] [CrossRef]
  74. Ustaoğlu, F.; Islam, M.S. Potential toxic elements in sediment of some rivers at Giresun, Northeast Turkey: A preliminary assessment for ecotoxicological status and health risk. Ecol. Indic. 2020, 113, 106237. [Google Scholar] [CrossRef]
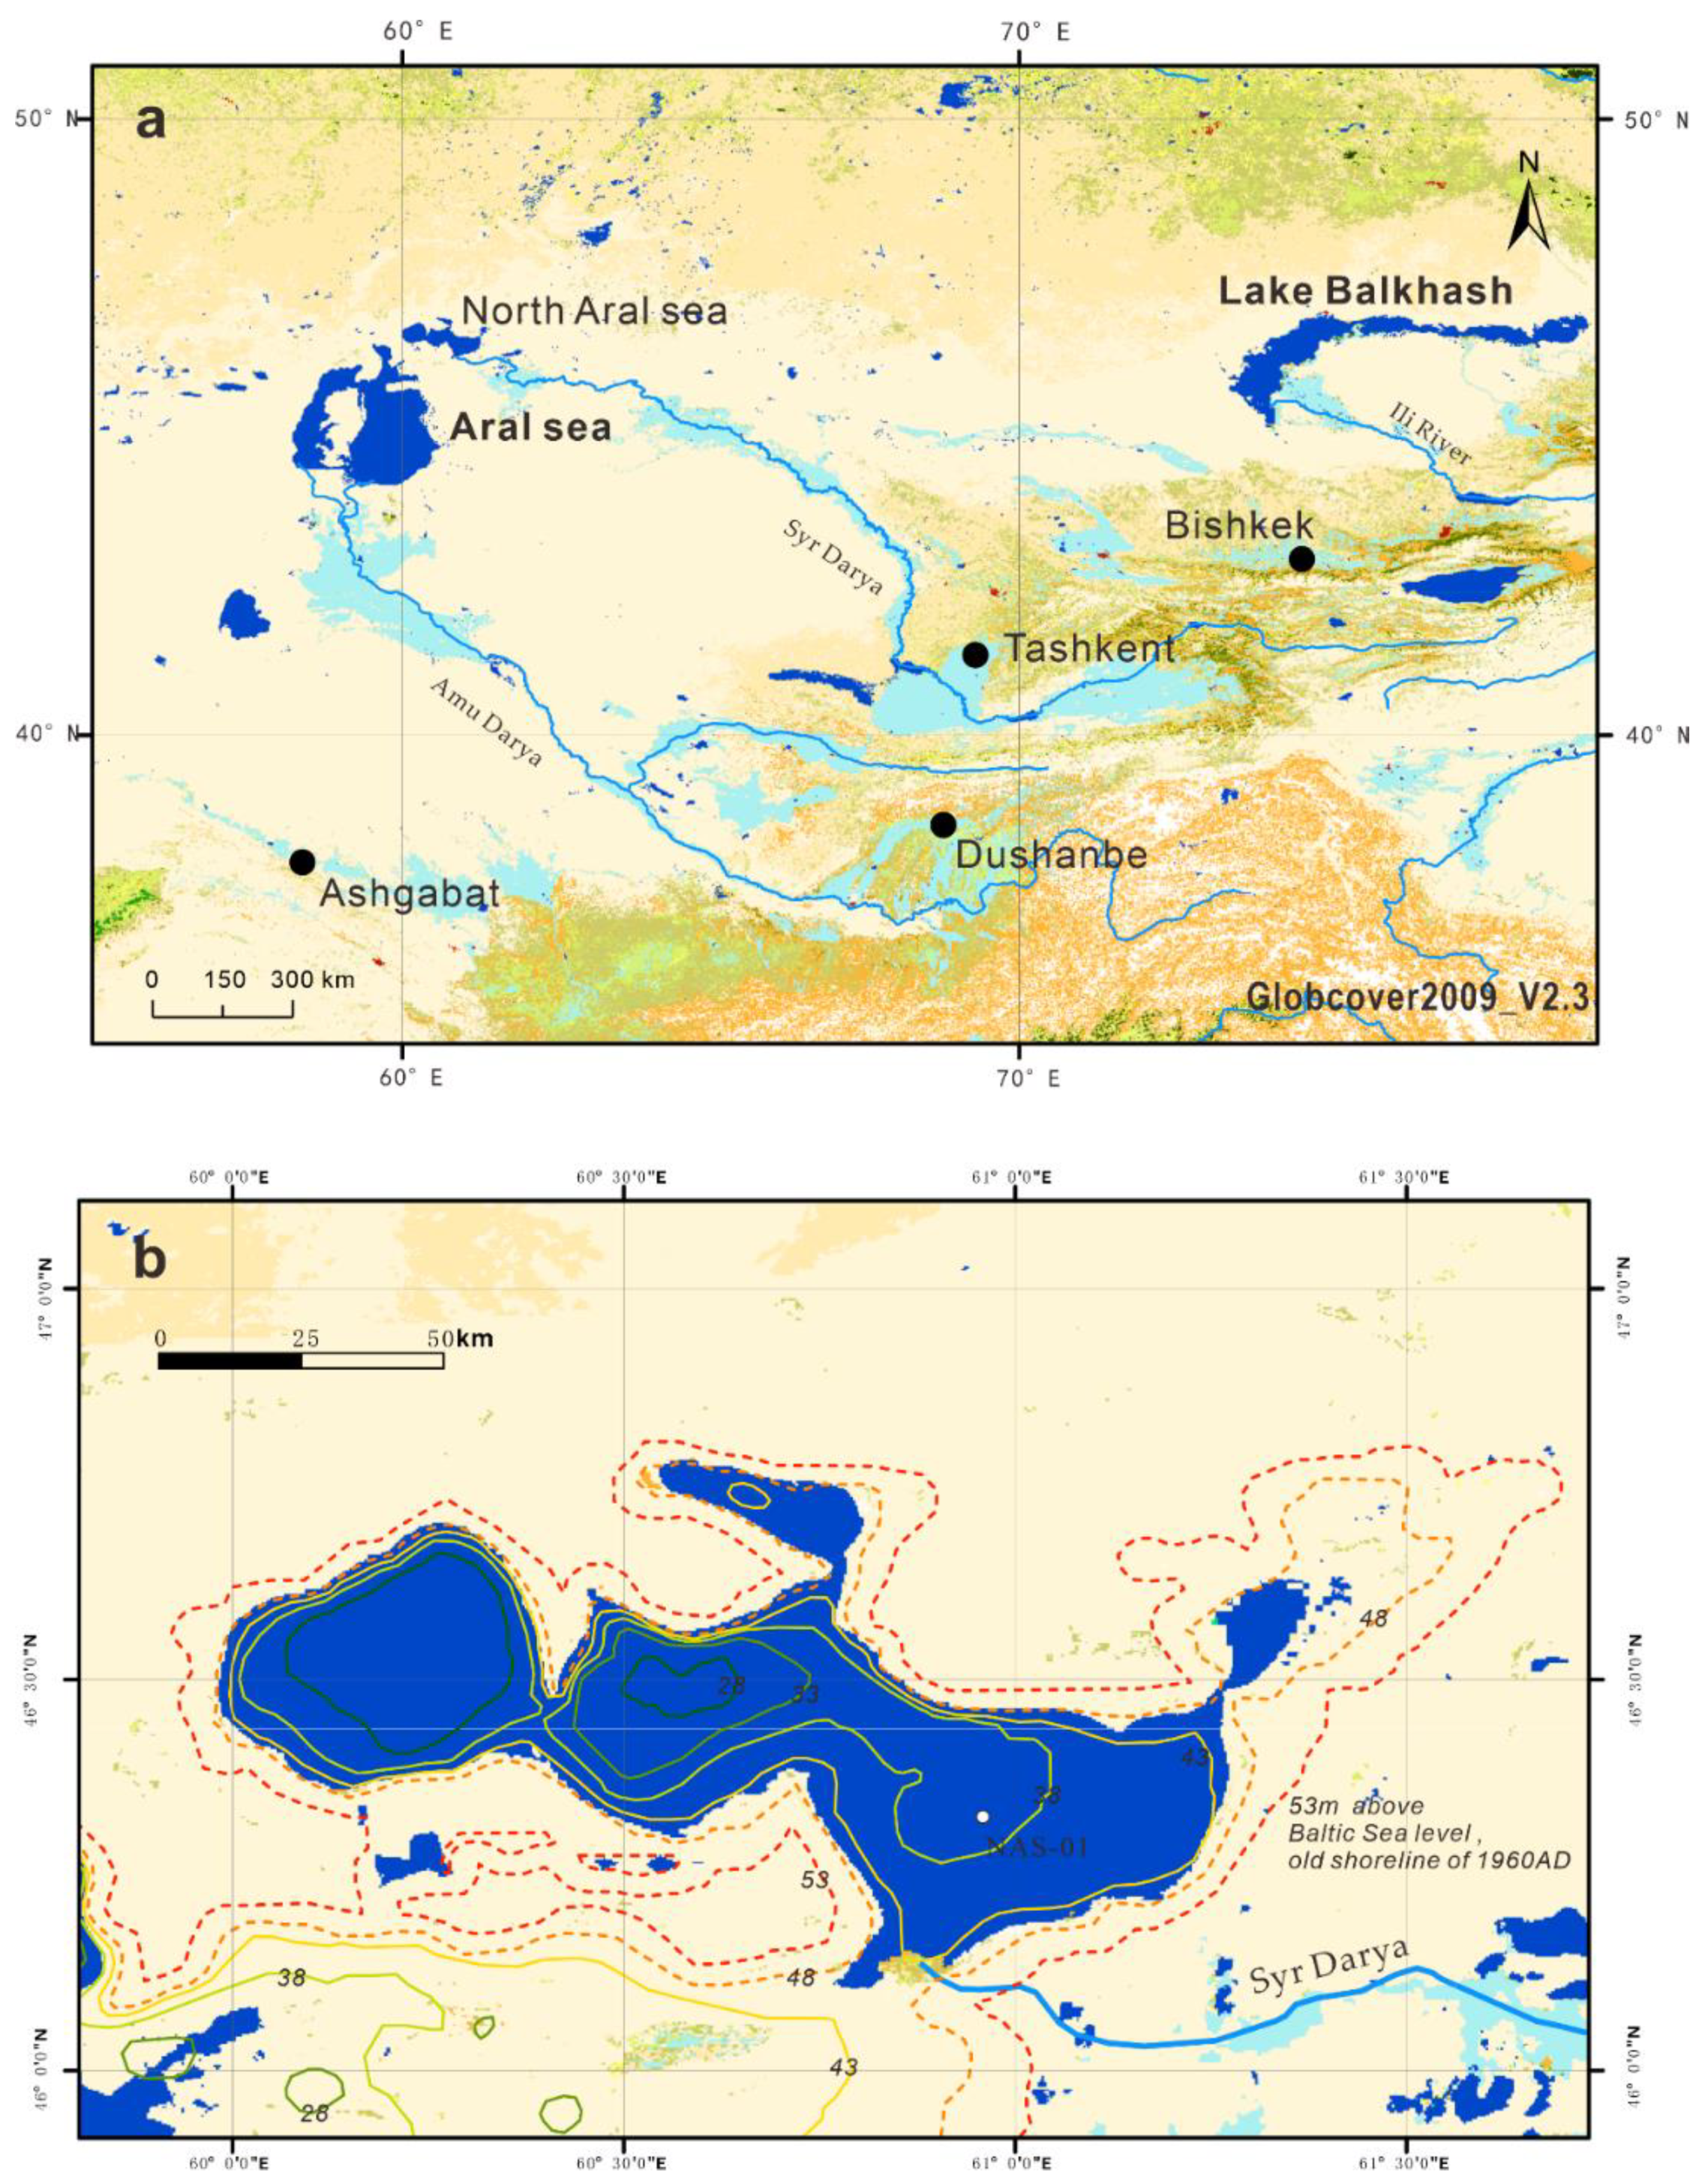
Figure 1. (a) Location of the Aral Sea in Central Asia; and (b) topographic map of North Aral Sea and the sampling location of the sediment core (NAS-01) denoted by the white cycle.
Applsci 10 05623 g001
Figure 2. Vertical variations of 137Cs, PTEs and magnetic susceptibility (MS) in lake sediments from North Aral Sea.
Applsci 10 05623 g002
Figure 3. Cluster dendrogram for samples and PTE concentrations.
Applsci 10 05623 g003
Figure 4. Time-varying curves of PTE geo-accumulation indexes (Igeo).
Applsci 10 05623 g004
Figure 5. Comparison between sedimentological records and historical records of human activities. The data of magnetic susceptibility were from the sedimentary record of North Aral Sea in this study. The trade data between the former Soviet Union and the United States (million dollars) were from the unpublished source (Juhana Aunesluoma. East-West Trade and Détente. 28 February, 2005: http://www.mv.helsinki.fi/home/miklossy/luennot/Aunesluoma.ppt). The data about surface area of irrigated Land (million hectares) in Aral Sea basin were from the reference [61].
Applsci 10 05623 g005
Figure 6. Violin plots for the PERI of PTEs (V, Cr, Co, Ni, Cu, Zn, As, Cd and Pb) from the lake sediments of North Aral Sea.
Applsci 10 05623 g006
Figure 7. Stacked area chart shows how the PTEs have collectively changed over the past ca. 70 years.
Applsci 10 05623 g007
Table 1. PERI classification standards for PTEs.
ErClassificationRIClassification
Er <40LowRI < 150Low risk
40 ≤ Er < 80Moderate150≤ RI < 300Moderate
80 ≤ Er < 160Considerable300≤ RI < 600Considerable
160 ≤ Er < 320High600 ≤ RIhigh
320 ≤ Er Very high--
Table 2. Summary statistics for 12 environmental parameters: 137Cs, magnetic susceptibility (MS) with high (HF) and low frequency (LF) and potentially toxic elements (PTEs) in the North Aral Sea sediment core.
ParametersRangeMinimumMaximumMeanStd. Deviation
StatisticStd. Error
V (mg/kg)97.929.512791.66.9438.0
Cr (mg/kg)62.2 18.2 80.459.3 4.53 24.8
Co (mg/kg)10.8 3.18 14.0 10.2 0.772 4.23
Ni (mg/kg)33.2 7.72 40.9 27.4 2.28 12.5
Cu (mg/kg)32.3 5.16 37.5 22.8 2.11 11.5
Zn (mg/kg)72.6 17.4 90.0 61.2 5.00 27.4
As (mg/kg)14.6 3.78 18.3 11.4 0.797 4.37
Cd (mg/kg)0.317 0.0453 0.362 0.192 0.0176 0.0966
Pb (mg/kg)18.2 4.64 22.8 15.4 1.23 6.74
LF (m3/kg)14.0 1.90 15.9 10.7 0.960 5.26
HF (m3/kg)13.4 2.00 15.4 10.3 0.929 5.09
137Cs (Bq/kg)29.3 0 29.313.0 1.17 6.42
Table 3. Pearson correlation coefficients (r) among the low-frequency magnetic susceptibility (LF) and geo-accumulation index (Igeo) of PTEs (n = 30, p < 0.001).
ParametersVCrCoNiCuZnAsCdPbLF
V1 0.998 0.997 0.993 0.983 0.993 0.961 0.960 0.990 0.987
Cr-1 0.998 0.996 0.989 0.996 0.966 0.970 0.995 0.989
Co--1 0.998 0.991 0.998 0.973 0.975 0.995 0.990
Ni---1 0.997 1.000 0.972 0.983 0.999 0.989
Cu----1 0.997 0.965 0.990 0.998 0.984
Zn-----1 0.969 0.981 0.999 0.989
As------1 0.967 0.969 0.962
Cd-------1 0.986 0.972
Pb--------1 0.987
LF---------1