Abstract
Ultrasound vector Doppler techniques for three-dimensional (3-D) blood velocity measurements are currently limited by low temporal resolution and high computational cost. In this paper, an efficient 3-D high-frame-rate vector Doppler method, which estimates the displacements in the frequency domain, is proposed. The novel method extends to 3-D an approach so far proposed for two-dimensional (2-D) velocity measurements by approximating the (x, y, z) displacement of a small volume through the displacements estimated for the 2-D regions parallel to the y and x directions, respectively. The new method was tested by simulation and experiments for a 3.7 MHz, 256-element, 2-D piezoelectric sparse spiral array. Simulations were also performed for an equivalent 7 MHz Capacitive Micromachined Ultrasonic Transducer spiral array. The results indicate performance (bias ± standard deviation: 6.5 ± 8.0) comparable to the performance obtained by using a linear array for 2-D velocity measurements. These results are particularly encouraging when considering that sparse arrays were used, which involve a lower signal-to-noise ratio and worse beam characteristics with respect to full 2-D arrays.
1. Introduction
Estimation of blood flow velocity through Doppler ultrasound (US) [1] has been for a long time limited to the axial component of the velocity vector. The lack of knowledge of the so-called Doppler angle between the US propagation direction and blood flow direction has in fact prevented the accurate estimation of the velocity magnitude. Even if several methods were proposed to overcome this limitation by estimating the two components of the velocity vector lying within the scan (x–z) plane (2-D Doppler), such methods only estimate the velocity in a single sample volume by exploiting triangulation [2,3,4], Doppler bandwidth [5], and transverse oscillations approaches [6,7]. Nonetheless, the introduction of high-frame-rate (HFR) imaging methods, based on plane wave transmission [8,9,10], has paved the way for the extension of vector flow imaging (VFI) to multiple points (e.g., covering a two-dimensional region of interest (ROI)). Several approaches have been so far proposed based on either 2-D speckle tracking [11,12], multiangle Doppler analysis [13,14,15], transverse oscillations [16,17], or color Doppler and continuity equations [18].
The next development step was the extension of Doppler estimation to all three components of the velocity vector. In this case as well, the first 3-D vector studies were limited to the investigation of a single sample volume and exploited multibeam or multitransducer approaches [19,20,21]. Extension of VFI to a full volume has been recently made possible by the introduction of bidimensional transducer arrays [22,23,24,25,26,27]. The first attempts were based on either row–column-addressed arrays [28,29] or full 2-D arrays [30] together with transverse oscillations, but they required long acquisition schemes, thus limiting the temporal resolution. More recently, methods exploiting HFR sequences have been developed; they have been based either on a combination of autocorrelation and a least-squares fitting approach [31], on a 3-D block matching procedure with a 3-D similarity function [32], or on particle image velocimetry [33]. However, the latter two methods required multiple heart cycles with electrocardiogram stitching to reconstruct the whole volume of interest. On the other hand, the autocorrelation-based method was characterized by a high computational load requiring more than 1 h to process one heartbeat, despite it being implemented on a powerful graphics processing unit (GPU).
Of course, when two or three components of the velocity vector have to be estimated, the computational efficiency of the used algorithm plays a fundamental role, as its complexity can become O(N2) or O(N3), respectively, with N the number of estimation points. In [12], a 2-D HFR VFI method was proposed, which, compared with a cross-correlation-based method [11], achieved a significant computational load reduction with a negligible impact on the estimation accuracy. It was based on the transmission of plane waves and a frequency domain displacement estimation method, which computed spectral phase differences in a limited number of frequency points. Therefore, in this paper, we propose an efficient 3-D HFR VFI method, inheriting the benefits of the previous 2-D VFI method by extending it to the third dimension. Specifically, the displacement estimation along the three dimensions is here obtained through two 2-D HFR VFI estimations on perpendicular planes.
The paper is organized as follows: Section 2 introduces the new 3-D VFI method, details the simulation and experimental setups, and defines the performance metrics. Section 3 shows and objectively describes simulation and experimental results that are thoroughly discussed, introducing possible perspectives, in Section 4. Appendix A recalls the basics of the 2-D HFR VFI method presented in [12].
2. Materials and Methods
2.1. High-Volume-Rate Imaging
The imaging method used in this work is based on the transmission (TX) of unsteered plane waves from a 2-D probe and on parallel beamforming in reception (RX). Since no compounding is applied, full volumes can be reconstructed at the maximum rate (i.e., equal to the pulse repetition frequency (PRF)). Then, radiofrequency (RF) volumetric data must be clutter-filtered to remove contributions due to stable or slowly moving tissues. Specifically, hereinafter, since only vessels with rigid walls are considered, clutter removal is obtained by a high-pass filter with a cutoff frequency of 5 Hz. Furthermore, RF echoes are sampled at frequency fs equal to 39 MHz; hence, the distance between pixels in the z direction is δz = c/(2fs) = 20 µm. The lateral distance between pixels is the distance between beamformed lines (300 µm) both along the x direction (δx) and y direction (δy) (see Figure 1).
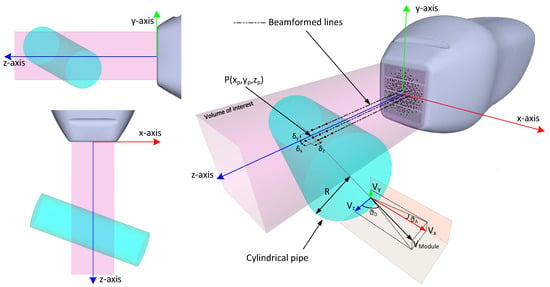
Figure 1.
Reference system for simulations and acquisitions. The volume of interest investigated by the 2-D plane wave is highlighted in light pink. The cylindrical pipe (light green) direction is defined by the beam-to-flow Doppler angle, ϑD, and the azimuth rotation angle, ϑA.
2.2. 3-D Displacement Estimation
In order to estimate the velocity components for a specific point of interest P(xp, yp, zp) (i.e., the black dot in Figure 2), the volume of RF data is divided into parallelepipeds, hereinafter referred to as “kernels”, containing MB × NB × PB pixels surrounding P. For each kernel, to estimate the average displacement between consecutive TX events, the 2-D VFI algorithm—proposed in [12] and recalled in Appendix A—is independently applied to the two perpendicular planes (yellow and purple in Figure 2) that cross the kernel’s vertical (red in Figure 2) axis. Thus, the average (x, z) and (y, z) displacement components are obtained. Note that the displacement component along the z-axis is estimated twice, allowing a more robust assessment by averaging the two estimates. It is worth highlighting that kernels can be arbitrarily located (i.e., they can be either partially overlapped or isolated), only influencing the spatial resolution of vector velocity estimates. In this study, kernels were located on a regular grid and overlapped 80% and 90% in the axial and both lateral directions, respectively, thus giving the same spatial resolution of 0.3 mm along the three directions.
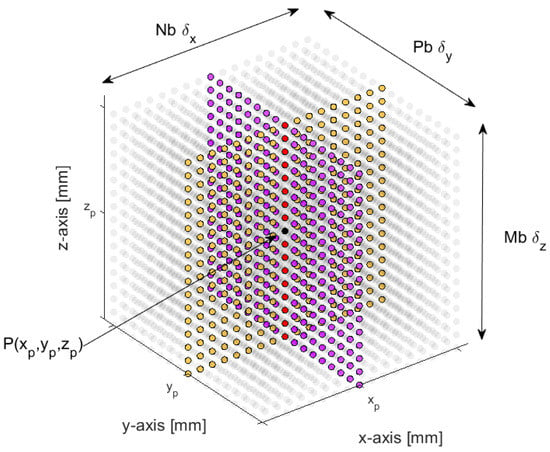
Figure 2.
Example of kernel region consisting of MB × NB × PB beamformed samples, distributed according to the step distances δz, δx, and δy for z, x, and y directions, respectively.
Given that the developed algorithm is highly parallelizable, in order to compute the 3-D displacement for the whole volume and to keep the computational burden as low as possible, the processing is split into three steps. First, the 2-D VFI algorithm is applied to the planes perpendicular to the y direction to compute both the (x, z) displacement components (Figure 3A); then, the (y, z) components are similarly obtained by processing the data from planes perpendicular to the x direction (Figure 3B); finally, the velocity components corresponding to the same kernels are grouped (Figure 3C). Here, this method was implemented using the basic Matlab (The MathWorks, Natick, MA, USA) functions and by exploiting only the central processing unit (CPU) of the host computer.
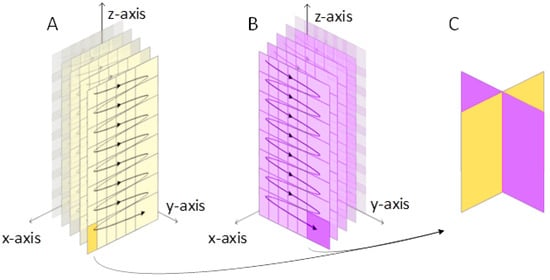
Figure 3.
3-D vector flow imaging (VFI) elaboration scheme. The beamformed volume samples are sequentially elaborated per plane in both directions (panels A and B). The corresponding components are finally grouped to obtain the velocity estimation (C).
2.3. Transmission and Reception Settings
The proposed method was validated through simulation and experiments. In both cases, the tests were based on a 256-element gridded spiral array probe built by Vermon (Vermon S.A.,Tours, France) according to our design [34,35], at 3.7 MHz central frequency. The position of the array elements matched that of a spiral pattern of 256 seeds, the density of which was modulated according to a 50% Tukey (tapered cosine) window. Moreover, to test the method at a different frequency (7 MHz), additional simulations were carried out considering the layout of a prototype Capacitive Micromachined Ultrasonic Transducer (CMUT) probe, based on a 256-element spiral array with spatial density tapered by a Blackman window. For both probes, the TX signal was always a 5-cycle sine burst at the central frequency of the probe and weighted by a Hamming window. The PRF was set to 500 Hz. In RX, a dynamic Hamming apodization window with constant f-number = 2 was implemented.
2.4. Simulations
Simulations were carried out in Matlab with Field II [36,37]. As sketched in Figure 1, a numeric phantom was developed to simulate a parabolic flow inside a straight, cylindrical vessel with 4 mm radius (R). Its axis was maintained at z0 = 16 mm, while the beam-to-flow angle resulted from different combinations of ϑD and ϑA angles, as summarized in Table 1. The density of the randomly distributed scatterers was set at 27 scatterers per resolution cell. For each setup configuration, simulations were run to simulate a 1 s long acquisition (i.e., 500 consecutive RF data volumes were produced).

Table 1.
Imaging, flow, and processing parameters.
2.5. Experiments
The experimental tests were based on the ULA-OP 256 [38] (Figure 4), which is a research scanner with 256 independent channels, characterized by full programmability, high flexibility, and access to data at any point of the RX chain. In addition, it embeds high-speed programmable devices, such as field-programmable gate arrays (FPGAs) and digital signal processors (DSPs), for real-time processing and the implementation of custom, computationally intensive algorithms. For this work, the ULA-OP 256 was used to transmit plane waves and acquire raw RF channel data, which were then postprocessed in Matlab.
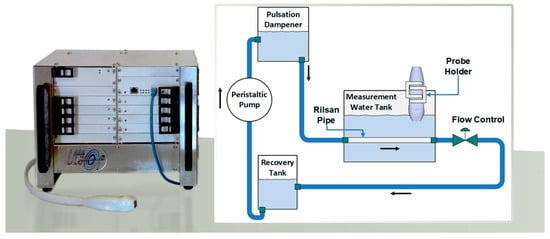
Figure 4.
On the left, the ULA-OP 256 scanner with the Vermon probe used for the experiments. On the right, the schematic diagram of the flow phantom.
In the experiments, a homemade phantom was used, in which a blood-mimicking fluid flew in a cylindrical Rilsan® pipe immersed in a water tank, as shown in Figure 4. The fluid was obtained by stirring 3 g of 10 μm polyamide spherical particles (Orgasol®, Arkema Inc., Philadelphia, PA, USA) in 2 L of demineralized water until a homogeneous suspension was achieved (density of 2.6 × 10¹⁰ scatterers/mm3). The flow was forced by a peristaltic pump connected to a pulsation dampener, capable of further reducing possible turbulences. Considering the entrance length of the tube (70 mm), parabolic flow was guaranteed by setting the peak velocity approximately at 7.5 cm/s. The distance and the angle of the Vermon probe with respect to the pipe were set through a custom holder connected to a positioning system.
2.6. Performance Metrics
The accuracy and precision of the 3-D VFI method were assessed in terms of mean relative bias and standard deviation of velocity estimates, as proposed in [29]. For each point of interest P(xp, yp, zp), located at distances ≤ (0.9 × R) from the flow axis, the mean relative bias of the axial velocity component, , is defined as
where and are the temporal means of the estimated and reference velocity components, respectively, while Np is the number of points of interest. is the reference peak velocity (7.5 cm/s). On the other hand, the mean relative standard deviation was calculated as
where
is the standard deviation evaluated for each velocity component averaged over the total number of frames NF. Similarly, mean relative biases and standard deviations for the lateral velocity components, vx and vy, and for the velocity module, vModule, were obtained through equivalent equations.
3. Results
3.1. Simulations
Figure 5 shows the three components and the module of the velocity profiles estimated along the z-axis by using the CMUT and Vermon probes. Six probe-to-flow orientations, distributed by columns, were chosen to test the method when (a) only one velocity component was nonzero (left column), (b) two velocity components were different from zero (columns 2–4), or (c) all three velocity components contributed to the velocity module (columns 5 and 6). In particular, the azimuth angle was set to 45° in the cases shown in the three rightmost columns, which implies that the lateral and elevation velocity components should be identical.
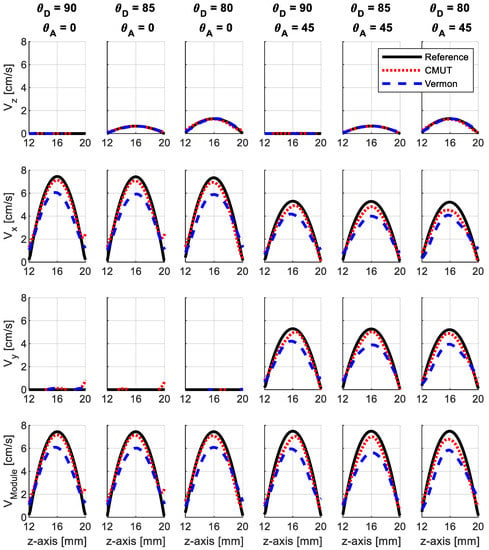
Figure 5.
Velocity profiles reconstructed along lines crossing the probe axis with different probe-to-flow orientations. The red dotted lines refer to the CMUT probe, the blue dashed ones to the Vermon probe. The black solid line is the reference velocity profile.
The differences between the profiles produced by the two probes can be appreciated in Figure 5. The velocity components (vx, vy) were better estimated with the CMUT probe, the profiles of which more closely approached the reference. Similarly, the more pronounced underestimation of the lateral velocity components in the Vermon probe yielded a corresponding underestimation of vModule (bottom panels). It is also worth noting that the estimated lateral velocity components (vx and vy, second and third rows) obtained for ϑA = 45° gave similar profiles, confirming their expected symmetry.
To visualize that the method behaved correctly even outside the axis of the probe, the 3-D representations of the flow distributions are shown in Figure 6 for the CMUT probe and for ϑD = 90°, ϑA = 0°. Here, the surface view of the x–z plane for y = 0 is reported on the left and the y–z plane for x = 0 on the right.
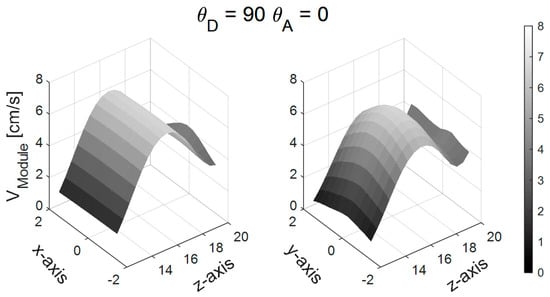
Figure 6.
Example of surface diagram for the CMUT probe simulation (ϑD = 90°, ϑA = 0°).
The relative bias, , and standard deviation, , evaluated according to Equations (1)–(3) for all simulated conditions are reported in Table 2. For the CMUT probe, and were always lower than 9.6% and 11.4%, respectively. On average, and were 6.5% ± 8.0%, respectively. The results obtained with the Vermon probe, in general characterized by larger errors ( and resulted, on average, 14.4% ± 8.7%), were, however, less dependent on the beam-to-flow orientation, with a relative bias ranging (for the velocity module) between 12.6% and 16.3%.

Table 2.
Relative bias and mean standard deviation for simulations.
3.2. Experiments
Particular care was taken to manually align the probe to the tube and obtain the same conditions used for simulation. However, from the analysis of the results, we noticed a slight misalignment of about 1° in a couple of cases, which is within the accuracy of the position system. Hence, the actual angle (ϑD, ϑA) configurations were [(91,0), (85,0), (80,0), (91,44), (85,45), (81,43)]°.
Figure 7 shows the velocity profiles experimentally obtained by using the Vermon probe. Qualitatively, the overall trend of the estimated profiles was the same observed from the simulations: vz was estimated with good accuracy, while vz and vy suffered from higher underestimation. The errors reported in Table 3 indicate that, on average, the relative error = 11.5% was lower (roughly 3%) compared with simulations, even if the standard deviation was higher (10.9%). As highlighted by the plots and confirmed in Table 3, when ϑA = 45°, there was no mismatch between the estimates of the vz and vy components. The difference between the bias of the two velocity components was lower than 1%.
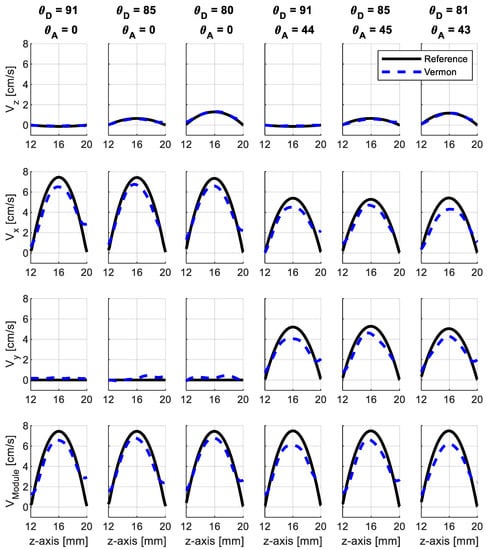
Figure 7.
Velocity profiles reconstructed by Vermon acquisitions, along the line crossing the probe axis with different probe-to-flow orientations. The black solid line is the reference velocity profile.

Table 3.
Relative bias and mean standard deviation for experiments.
4. Discussion and Conclusions
A novel 3-D high-frame-rate vector flow imaging method has been presented. The method is an extension of the 2-D approach proposed in [12], which estimates the velocity through the 2-D frequency domain phase shifts corresponding to the displacement of 2-D kernels extracted from consecutive RF frames. The proposed approach involves the transmission of unsteered plane waves from a bidimensional probe and parallel beamforming in reception. Then, the volume of beamformed data is divided into 3-D kernels and, for each of them, the 3-D vector flow is estimated.
Simulations were performed for two 256-element spiral probes having comparable dimensions (~1 cm): the first one was based on a 1024-element piezoelectric probe manufactured by Vermon; the second one was based on a CMUT prototype that is currently under development [39]. These probes were chosen since they are illustrative of the performance achievable by the proposed method at different frequencies (3.7 and 7.0 MHz). Furthermore, it was possible to connect the Vermon probe to the ULA-OP 256 research scanner to perform experimental tests. Simulations and experiments were conducted at depths around 16 mm, which are compatible with both probes and with possible peripheral vascular applications. The performance was assessed, for different beam-to-flow angles, in terms of bias and standard deviation. Even if both experiments and simulations were conducted for a maximum flow speed of 7.5 cm/s—suggested by the limited entrance length of the experimental flow phantom—the PRF was accordingly set to a low value of 500 Hz so that, in the worst case (ϑD = 80° for the high-frequency CMUT probe), the produced Doppler shift along the z direction was about 50% the aliasing limit. Hence, the obtained results indicate that the possible proximity to the aliasing limit is not a crucial issue in the proposed method.
As reported in Table 2 simulations have shown that the CMUT probe, in the presented cases, performed better than the Vermon one (mean bias ± standard deviation: 6.5% ± 8.0% vs 14.4% ± 8.7%). This difference can be attributed to the characteristics of the two probes, namely, the similar equivalent apertures (~6 mm) and different central frequencies, which are known to give better spatial resolution for higher-frequency (CMUT) probes. In addition, the CMUT probe results are consistent with those (10% ± 5%) obtained for the 2-D method with a 6 MHz linear array probe [12]. This is particularly remarkable considering the noticeable differences between the arrays used in the two cases, which involve elements of dimensions passing from 0.2 × 6 mm for the linear array to about 0.3 × 0.3 mm for the 2-D arrays.
The Vermon experimental results confirmed the simulation results, with a slightly better bias but a slightly higher standard deviation, which was probably due to the nonideality of the measurement setup. In particular, the peristaltic pump introduced flow fluctuations that could not be sufficiently attenuated with the flow stabilization system. Even if a bigger pulsation dampener or a higher hydraulic resistance might have been used to limit the flow fluctuations, we believe that the nonideality of the experimental setting had a limited impact on the final results and did not affect their value.
The computational cost of the proposed method can be assessed by referring to the analysis carried out for the 2-D method [12]. Indeed, as the 3-D VFI is a two-step extension of the 2-D method, the overall computational cost remains of the order O(N). This is much lower than the 3-D cross-correlation-based algorithms, natively O(N3), which may be decreased through appropriate optimizations to reach an order of complexity of at least O(N2). Even if the proposed method was tested offline (i.e., by postprocessing the acquired raw data), it is part of the “high-frame-rate” family, since one full (Doppler) frame can be obtained after each TX event. Furthermore, the algorithm for 3-D VFI is highly parallelizable and is suited for implementation on GPUs, as already shown for 2-D VFI in [40]. The main limitations of parallel computing are linked to data transfer rates and the number of global memory accesses, which both need the proper and careful design of memory coalescing. Considering also the increasing computational power of GPU-based devices, in the near future, the implementation of 3-D VFI should be feasible in real time, targeting input frame rates of at least 7 kHz (i.e., sufficient to estimate flow speeds up to 100 cm/s).
One of the main limitations of this work was using unsteered plane waves, which limited the extension of the investigated region due to the small size of the probe aperture. For example, as seen in the right panel of Figure 6, the paraboloid representative of the velocity module was partially cut off, since only 3.6 mm (about one-half of the pipe diameter) could be investigated along both the x and y axes. A possible alternative to extend the region of interest could be the transmission of diverging waves, although it should be taken into account that they involve a worse signal-to-noise ratio (SNR) [41,42].
Finally, it has to be highlighted that, in this study, the novel method was implemented by using sparse spiral arrays rather than full 2-D arrays [24], which allowed us to perform the first experimental tests. However, it unavoidably involved a reduced SNR and a lower sensitivity to blood flow. This could be partially compensated by using coded imaging techniques [43] or in-probe preamplifiers. Likewise, doubling the number of active elements by exploiting two synchronized ULA-OP 256 systems [34,35] could improve the system sensitivity and, at the same time, counteract the unavoidable grating lobes in the transmitted ultrasound beams associated with spiral arrays [42]. By taking these aspects into considerations, the results of this paper appear extremely encouraging and confirm that sparse arrays may be a relatively cheap solution for the implementation of 3-D imaging on systems based on a limited number of channels.
Author Contributions
Conceptualization, S.R., A.R., and P.T.; Formal Analysis S.R. and A.R.; Investigation S.R., A.R., and F.F.; Methodology, S.R.; Validation, S.R.; Visualization, S.R.; Writing—Original Draft, S.R.; Writing—Review and Editing, A.R. and P.T.; Supervision, P.T. All authors have read and agreed to the published version of the manuscript.
Funding
This research received no external funding.
Conflicts of Interest
The authors declare no conflict of interest.
Appendix A
In the 2-D VFI HFR method proposed in [12], each RF frame is divided into (possibly partially overlapped) blocks of MB × NB pixels, which are weighted with a Hann’s window to limit deleterious edge effects. The same-located blocks of two consecutive frames, smn and , are obtained at time t and t′ = t + τ, respectively. If the scatterers inside a block cover a relatively short distance during the interval τ, can be considered as a 2-D shifted version of smn. Hence, the Δz and Δx displacements can be computed from a 1-D discrete Fourier transform (DFT) for the z direction and a 2-D DFT for the x direction, as follows:
where fm and fn are the spatial frequencies in the z and x directions, respectively, while and are the phase shifts in the frequency domain. In this work, displacements were estimated at multiple frequencies to improve the robustness of estimates. Hence, kfm = 3 frequencies were uniformly distributed on a 20% bandwidth around f0, while kfn = 10 frequencies were distributed on negative and positive spatial frequencies in a bandwidth between 10% and 40% of the Shannon’s spatial frequency.
Then, the displacements were averaged as follows:
Finally, the velocity components were given by
References
- Evans, D.H.; McDicken, W.N. Doppler Ultrasound: Physics, Instrumentation and Signal Processing, 2nd ed.; Wiley-Blackwell: Hoboken, NJ, USA, 1999; ISBN 0-471-97001-8. [Google Scholar]
- Fox, M.D. Multiple crossed-beam ultrasound Doppler velocimetry. IEEE Trans. Sonics Ultrason. 1978, 25, 281–286. [Google Scholar] [CrossRef]
- Dunmire, B.; Beach, K.W.; Labs, K.-H.; Plett, M.; Strandness, D.E., Jr. Cross-beam vector Doppler ultrasound for angle-independent velocity measurements. Ultrasound Med. Biol. 2000, 26, 1213–1235. [Google Scholar] [CrossRef]
- Capineri, L.; Scabia, M.; Masotti, L. A Doppler system for dynamic vector velocity maps. Ultrasound Med. Biol. 2002, 28, 237–248. [Google Scholar] [CrossRef]
- Tortoli, P.; Dallai, A.; Boni, E.; Francalanci, L.; Ricci, S. An Automatic Angle Tracking Procedure for Feasible Vector Doppler Blood Velocity Measurements. Ultrasound Med. Biol. 2010, 36, 488–496. [Google Scholar] [CrossRef]
- Jensen, J.A.; Munk, P. A new method for estimation of velocity vectors. IEEE Trans. Ultrason. Ferroelectr. Freq. Control. 1998, 45, 837–851. [Google Scholar] [CrossRef]
- Udesen, J.; Jensen, J.A. Investigation of transverse oscillation method. IEEE Trans. Ultrason. Ferroelectr. Freq. Control. 2006, 53, 959–971. [Google Scholar] [CrossRef]
- Lu, J.-Y. 2D and 3D high frame rate imaging with limited diffraction beams. IEEE Trans. Ultrason. Ferroelectr. Freq. Control. 1997, 44, 839–856. [Google Scholar] [CrossRef]
- Cheng, J.; Lu, J.-Y. Extended high-frame rate imaging method with limited-diffraction beams. IEEE Trans. Ultrason. Ferroelectr. Freq. Control. 2006, 53, 880–899. [Google Scholar] [CrossRef]
- Montaldo, G.; Tanter, M.; Bercoff, J.; Benech, N.; Fink, M. Coherent plane-wave compounding for very high frame rate ultrasonography and transient elastography. IEEE Trans. Ultrason. Ferroelectr. Freq. Control. 2009, 56, 489–506. [Google Scholar] [CrossRef]
- Udesen, J.; Gran, F.; Hansen, K.L.; Jensen, J.A.; Thomsen, C.; Nielsen, M.B. High frame-rate blood vector velocity imaging using plane waves: Simulations and preliminary experiments. IEEE Trans. Ultrason. Ferroelectr. Freq. Control. 2008, 55, 1729–1743. [Google Scholar] [CrossRef]
- Lenge, M.; Ramalli, A.; Boni, E.; Liebgott, H.; Cachard, C.; Tortoli, P. High-frame-rate 2-D vector blood flow imaging in the frequency domain. IEEE Trans. Ultrason. Ferroelectr. Freq. Control. 2014, 61, 1504–1514. [Google Scholar] [CrossRef]
- Ekroll, I.K.; Swillens, A.; Segers, P.; Dahl, T.; Torp, H.; Lovstakken, L. Simultaneous quantification of flow and tissue velocities based on multi-angle plane wave imaging. IEEE Trans. Ultrason. Ferroelectr. Freq. Control. 2013, 60, 727–738. [Google Scholar] [CrossRef]
- Yiu, B.Y.S.; Lai, S.S.M.; Yu, A.C.H. Vector Projectile Imaging: Time-Resolved Dynamic Visualization of Complex Flow Patterns. Ultrasound Med. Biol. 2014, 40, 2295–2309. [Google Scholar] [CrossRef]
- Ricci, S.; Ramalli, A.; Bassi, L.; Boni, E.; Tortoli, P. Real-Time Blood Velocity Vector Measurement Over a 2-D Region. IEEE Trans. Ultrason. Ferroelectr. Freq. Control. 2018, 65, 201–209. [Google Scholar] [CrossRef]
- Lenge, M.; Ramalli, A.; Tortoli, P.; Cachard, C.; Liebgott, H. Plane-wave transverse oscillation for high-frame-rate 2-D vector flow imaging. IEEE Trans. Ultrason. Ferroelectr. Freq. Control. 2015, 62, 2126–2137. [Google Scholar] [CrossRef]
- Takahashi, H.; Hasegawa, H. Two dimensional blood velocity estimation using high frame rate echocardiography with transverse oscillation approach. In Proceedings of the 2015 IEEE International Ultrasonics Symposium (IUS), Taipei, Taiwan, 21–24 October 2015; pp. 1–4. [Google Scholar]
- Garcia, D.; del Alamo, J.C.; Tanne, D.; Yotti, R.; Cortina, C.; Bertrand, É.; Antoranz, J.C.; Perez-David, E.; Rieu, R.; Fernandez-Aviles, F.; et al. Two-Dimensional Intraventricular Flow Mapping by Digital Processing Conventional Color-Doppler Echocardiography Images. IEEE Trans. Med. Imaging 2010, 29, 1701–1713. [Google Scholar] [CrossRef]
- Bonnefous, O. Measurement of the complete (3D) velocity vector of blood flows. In Proceedings of the IEEE 1988 Ultrasonics Symposium Proceedings, Chicago, IL, USA, 2–5 October 1988; Volume 2, pp. 795–799. [Google Scholar]
- Newhouse, V.L.; Dickerson, K.S.; Cathignol, D.; Chapelon, J.-Y. Three-dimensional vector flow estimation using two transducers and spectral width. IEEE Trans. Ultrason. Ferroelectr. Freq. Control. 1994, 41, 90–95. [Google Scholar] [CrossRef]
- Bruni, G.; Calzolai, M.; Capineri, L.; Fort, A.; Masotti, L.; Rocchi, S.; Scabia, M. Measurement and Imaging of a Velocity Vector Field Based on a Three Transducers Doppler System. In Acoustical Imaging; Tortoli, P., Masotti, L., Eds.; Acoustical Imaging; Springer: Boston, MA, USA, 1996; pp. 431–437. ISBN 978-1-4419-8772-3. [Google Scholar]
- Fenster, A.; Downey, D.B.; Cardinal, H.N. Three-dimensional ultrasound imaging. Phys. Med. Biol. 2001, 46, R67. [Google Scholar] [CrossRef]
- Light, E.D.; Idriss, S.F.; Wolf, P.D.; Smith, S.W. Real-time three-dimensional intracardiac echocardiography. Ultrasound Med. Biol. 2001, 27, 1177–1183. [Google Scholar] [CrossRef]
- Diarra, B.; Robini, M.; Tortoli, P.; Cachard, C.; Liebgott, H. Design of Optimal 2-D Nongrid Sparse Arrays for Medical Ultrasound. IEEE Trans. Biomed. Eng. 2013, 60, 3093–3102. [Google Scholar] [CrossRef]
- Provost, J.; Papadacci, C.; Arango, J.E.; Imbault, M.; Fink, M.; Gennisson, J.-L.; Tanter, M.; Pernot, M. 3D ultrafast ultrasound imaging in vivo. Phys. Med. Biol. 2014, 59, L1–L13. [Google Scholar] [CrossRef] [PubMed]
- Rasmussen, M.F.; Christiansen, T.L.; Thomsen, E.V.; Jensen, J.A. 3-D imaging using row-column-addressed arrays with integrated apodization-part i: Apodization design and line element beamforming. IEEE Trans. Ultrason. Ferroelectr. Freq. Control. 2015, 62, 947–958. [Google Scholar] [CrossRef] [PubMed]
- Ramalli, A.; Boni, E.; Savoia, A.S.; Tortoli, P. Density-tapered spiral arrays for ultrasound 3-D imaging. IEEE Trans. Ultrason. Ferroelectr. Freq. Control. 2015, 62, 1580–1588. [Google Scholar] [CrossRef] [PubMed]
- Pappalardo, M.; Caliano, G.; Caronti, A.; Savoia, A.S.; Gatta, P.; Longo, C.; Bavaro, V. Bidimensional Ultrasonic Array for Volumetric Imaging. U.S. Patent Application WO2008083876A3, 3 June 2010. [Google Scholar]
- Holbek, S.; Christiansen, T.L.; Stuart, M.B.; Beers, C.; Thomsen, E.V.; Jensen, J.A. 3-D Vector Flow Estimation With Row–Column-Addressed Arrays. IEEE Trans. Ultrason. Ferroelectr. Freq. Control. 2016, 63, 1799–1814. [Google Scholar] [CrossRef] [PubMed]
- Holbek, S.; Hansen, K.L.; Bouzari, H.; Ewertsen, C.; Stuart, M.B.; Thomsen, C.; Nielsen, M.B.; Jensen, J.A. Common Carotid Artery Flow Measured by 3-D Ultrasonic Vector Flow Imaging and Validated with Magnetic Resonance Imaging. Ultrasound Med. Biol. 2017, 43, 2213–2220. [Google Scholar] [CrossRef]
- Correia, M.; Provost, J.; Tanter, M.; Pernot, M. 4D ultrafast ultrasound flow imaging: In vivo quantification of arterial volumetric flow rate in a single heartbeat. Phys. Med. Biol. 2016, 61, L48. [Google Scholar] [CrossRef]
- Wigen, M.S.; Fadnes, S.; Rodriguez-Molares, A.; Bjåstad, T.; Eriksen, M.; Stensæth, K.H.; Støylen, A.; Lovstakken, L. 4-D Intracardiac Ultrasound Vector Flow Imaging–Feasibility and Comparison to Phase-Contrast MRI. IEEE Trans. Med Imaging 2018, 37, 2619–2629. [Google Scholar] [CrossRef]
- Voorneveld, J.; Saaid, H.; Schinkel, C.; Radeljic, N.; Lippe, B.; Gijsen, F.J.H.; van der Steen, A.F.W.; de Jong, N.; Claessens, T.; Vos, H.J.; et al. 4-D Echo-Particle Image Velocimetry in a Left Ventricular Phantom. Ultrasound Med. Biol. 2020, 46, 805–817. [Google Scholar] [CrossRef]
- Ramalli, A.; Harput, S.; Bezy, S.; Boni, E.; Eckersley, R.J.; Tortoli, P.; D’Hooge, J. High-Frame-Rate Tri-Plane Echocardiography With Spiral Arrays: From Simulation to Real-Time Implementation. IEEE Trans. Ultrason. Ferroelectr. Freq. Control. 2020, 67, 57–69. [Google Scholar] [CrossRef]
- Harput, S.; Tortoli, P.; Eckersley, R.J.; Dunsby, C.; Tang, M.-X.; Christensen-Jeffries, K.; Ramalli, A.; Brown, J.; Zhu, J.; Zhang, G.; et al. 3-D Super-Resolution Ultrasound Imaging With a 2-D Sparse Array. IEEE Trans. Ultrason. Ferroelectr. Freq. Control. 2020, 67, 269–277. [Google Scholar] [CrossRef]
- Jensen, J.A. FIELD: A Program for Simulating Ultrasound Systems. Med. Biol. Eng. Comput. 1996, 34, 351–353. [Google Scholar]
- Jensen, J.A.; Svendsen, N.B. Calculation of pressure fields from arbitrarily shaped, apodized, and excited ultrasound transducers. IEEE Trans. Ultrason. Ferroelectr. Freq. Control. 1992, 39, 262–267. [Google Scholar] [CrossRef] [PubMed]
- Boni, E.; Bassi, L.; Dallai, A.; Meacci, V.; Ramalli, A.; Scaringella, M.; Guidi, F.; Ricci, S.; Tortoli, P. Architecture of an Ultrasound System for Continuous Real-Time High Frame Rate Imaging. IEEE Trans. Ultrason. Ferroelectr. Freq. Control. 2017, 64, 1276–1284. [Google Scholar] [CrossRef] [PubMed]
- Savoia, A.S.; Matrone, G.; Bardelli, R.; Bellutti, P.; Quaglia, F.; Caliano, G.; Mazzanti, A.; Tortoli, P.; Mauti, B.; Fanni, L.; et al. A 256-Element Spiral CMUT Array with Integrated Analog Front End and Transmit Beamforming Circuits. In Proceedings of the 2018 IEEE International Ultrasonics Symposium (IUS), Kobe, Japan, 22–25 October 2018; IEEE: Kobe, Japan, 2018; pp. 206–212. [Google Scholar]
- Rossi, S.; Lenge, M.; Dallai, A.; Ramalli, A.; Boni, E. Toward the Real Time Implementation of the 2-D Frequency-Domain Vector Doppler Method. In Applications in Electronics Pervading Industry, Environment and Society; Saponara, S., De Gloria, A., Eds.; Lecture Notes in Electrical Engineering; Springer International Publishing: Cham, Switzerland, 2019; Volume 573, pp. 129–135. ISBN 978-3-030-11972-0. [Google Scholar]
- Roux, E.; Ramalli, A.; Tortoli, P.; Cachard, C.; Robini, M.C.; Liebgott, H. 2-D Ultrasound Sparse Arrays Multidepth Radiation Optimization Using Simulated Annealing and Spiral-Array Inspired Energy Functions. IEEE Trans. Ultrason. Ferroelectr. Freq. Control. 2016, 63, 2138–2149. [Google Scholar] [CrossRef]
- Roux, E.; Varray, F.; Petrusca, L.; Cachard, C.; Tortoli, P.; Liebgott, H. Experimental 3-D Ultrasound Imaging with 2-D Sparse Arrays using Focused and Diverging Waves. Sci. Rep. 2018, 8, 9108. [Google Scholar] [CrossRef]
- Ramalli, A.; Boni, E.; Dallai, A.; Guidi, F.; Ricci, S.; Tortoli, P. Coded Spectral Doppler Imaging: From Simulation to Real-Time Processing. IEEE Trans. Ultrason. Ferroelectr. Freq. Control. 2016, 63, 1815–1824. [Google Scholar] [CrossRef]
© 2020 by the authors. Licensee MDPI, Basel, Switzerland. This article is an open access article distributed under the terms and conditions of the Creative Commons Attribution (CC BY) license (http://creativecommons.org/licenses/by/4.0/).