Article

Joint Learning of Temporal Models to Handle Imbalanced Data for Human Activity Recognition

Department of Computer and Information Sciences, Northumbria University, Newcastle upon Tyne NE1 8ST, UK
*
Author to whom correspondence should be addressed.
Appl. Sci. 2020, 10(15), 5293; https://doi.org/10.3390/app10155293
Submission received: 14 May 2020 / Revised: 23 July 2020 / Accepted: 24 July 2020 / Published: 30 July 2020
(This article belongs to the Special Issue Advances in Intelligent Internet of Things)

Abstract

:
Human activity recognition has become essential to a wide range of applications, such as smart home monitoring, health-care, surveillance. However, it is challenging to deliver a sufficiently robust human activity recognition system from raw sensor data with noise in a smart environment setting. Moreover, imbalanced human activity datasets with less frequent activities create extra challenges for accurate activity recognition. Deep learning algorithms have achieved promising results on balanced datasets, but their performance on imbalanced datasets without explicit algorithm design cannot be promised. Therefore, we aim to realise an activity recognition system using multi-modal sensors to address the issue of class imbalance in deep learning and improve recognition accuracy. This paper proposes a joint diverse temporal learning framework using Long Short Term Memory and one-dimensional Convolutional Neural Network models to improve human activity recognition, especially for less represented activities. We extensively evaluate the proposed method for Activities of Daily Living recognition using binary sensors dataset. A comparative study on five smart home datasets demonstrate that our proposed approach outperforms the existing individual temporal models and their hybridization. Furthermore, this is particularly the case for minority classes in addition to reasonable improvement on the majority classes of human activities.

1. Introduction

Human activity recognition (HAR) is the active research field for monitoring human behaviours, which stimulates various applications in fields healthcare monitoring [1], security monitoring [2], and resident situation assessment [3] and behaviour pattern recognition in pro-active home care [4]. In the home care scenario, HAR is a key component of smart home technology that makes independent living as a viable solution for elderly people, and thus enhances and maintains the quality of life and care [5,6]. Smart home settings are often referred to as Ambient Assisted Living (AAL), and their main purpose is to remotely monitor and assess the wellness of older adults and people with dementia or other relevant disabilities. Overall, smart homes with human activities monitoring have been used for transparent surrounding context representation, which have enabled various health technology applications, such as disease progress and recovery tracking, or anomaly detection with a typical example of fall detection. Additionally, the recent advancement of machine learning has significantly progressed HAR systems and achieved performance improvements in many aspects of their applications, such as elderly-care alert systems and assistance in emergencies [7]. Long-term human activity monitoring yields feasibility to determine and assess the wellness. Specifically, activities, such as sleeping, eating, and showering in smart homes, are key events to enable the tracking and assess of the functional health status of elderly people [8]. Furthermore, data collected from multimodal sensors in a smart home can provide sufficient information for the recognition of Activities of Daily Living (ADL), behaviour pattern to achieve detection, and the postural and ambulatory activity recognition [9,10].
Although deep learning techniques have been applied for ADL recognition, it is still challenging and remains an open research issue to build an accurate HAR system due to the high diversity of human activities. Besides, the frequency variance of human activities is usually imbalanced leading to additional challenges. When building a machine learning model with an imbalanced dataset, it tends to partially or completely ignore the minority classes in order to achieve satisfied overall accuracy. For example, in HAR datasets, cooking, watching TV in the living room, and sleeping usually occur in a higher frequency than showering and snack eating. Different from the existing methods, this paper aims to improve HAR from imbalanced smart home datasets, especially for less represented classes.
Although several past and recent studies have been conducted on the imbalanced class problem [11,12], there is a lack of relevant empirical work for HAR. Classical machine learning methods in the form of individual learning or ensemble learning, such as support vector machine, decision tree, random forest, naive Bayes, hidden Markov models, and their ensembles, have been used to balance between maximising the accuracy of classification on minority classes and minimising the total recognition error [13,14]. These classical methods have shown a certain level of recognition results, but these methods mainly rely on hand-crafted and classical heuristic feature extraction, which could be limited by the availability of knowledge domain experts [15]. A natural variation within each human physical activity is repeatedly presented in recorded datasets of a smart home environment and is often seen to fluctuate even more amongst inhabitants. Human activities are temporally and spatially different, and the deployed sensors in smart homes vary, so building accurate HAR systems can be challenging based on traditional machine learning where features are typically hand-crafted. Hence, discovering more systematic approaches to extract features from raw smart home datasets has drawn increasing research interests [16]. Deep learning is a promising technique for many applications, such as natural language processing, speech recognition, and image classification, which significantly outperforms shallow learning [15].
Consequently, due to the rapid increase of the number of smart home care services to monitor elderly people, deep learning for HAR systems have been more commonly employed [17,18]. Most of these systems have achieved state-of-the-art performance on various datasets of ADL [19,20]. Particularly, promising results for HAR have been achieved by two temporal deep learning models i.e., long short-term memory (LSTM), and one dimensional convolutional neural networks (1D CNN) when multiple and incremental fuzzy temporal windows are employed in order to generate input datasets to represent temporal components of human daily activities in the sensor data [17,18].
To further improve the performance, we propose a joint learning method of two different temporal models, i.e., LSTM and 1D CNN, for HAR. LSTM and 2D CNN are used in parallel for improving classification performance of acoustic scenes to process different form of input features [21]. Acoustic sequential features are processed by LSTM Layers, while spectrogram images are processed by 2D CNN. We propose a joint learning of temporal LSTM and 1D CNN models in order to learn from the same form of input features for HAR. Different from ensemble learning that often combines the outputs of many learners while using a specific aggregation function to handle imbalanced data [22], the proposed method combines the learning processes of two temporal models in a single joint training mechanism to improve the accuracy on minority classes in addition to maintain the accuracy on majority classes. Therefore, joining the learning processes of two different temporal models in the proposed method is expected to obtain a better combined model compared to simply aggregating the outputs of multiple learners. It is also expected to obtain more accurate and reliable estimates or decisions than single models. The two temporal learners of the jointly proposed methods can exploit different features from the input data to rendering a strong mutual complementary model. Complementarity in joint learning based on different models can greatly boost the performance as compared to simply combining the same learners (e.g., LSTM with LSTM in this work) in a joint learning model [23]. This is because each base learner brings different features into the joint learner to enrich the joint learning process and each learner improves the earlier layers of the other learner, but in the same time the weaknesses of each individual learners are avoided. The proposed method jointly trains the two base learner i.e., LSTM and 1D CNN, and combines the based learners by a fully connected layer, which is followed by the output layer. The joint optimization that leads to increasing the functionality of the proposed joint temporal model to gain more insight into the input data and features reduces the recognition error rate. Thereby, the proposed model increases the performance of activity recognition particularly for minority classes. We also adopt the incremental multiple fuzzy temporal windows approach in order to compute informative features to enhance recognition accuracy, particularly for minority classes as well.
To summarise, the main contributions of this paper are:
  • proposing a joint temporal model to conduct a parallel combination of LSTM and 1D CNN to improve the accuracy of activity recognition;
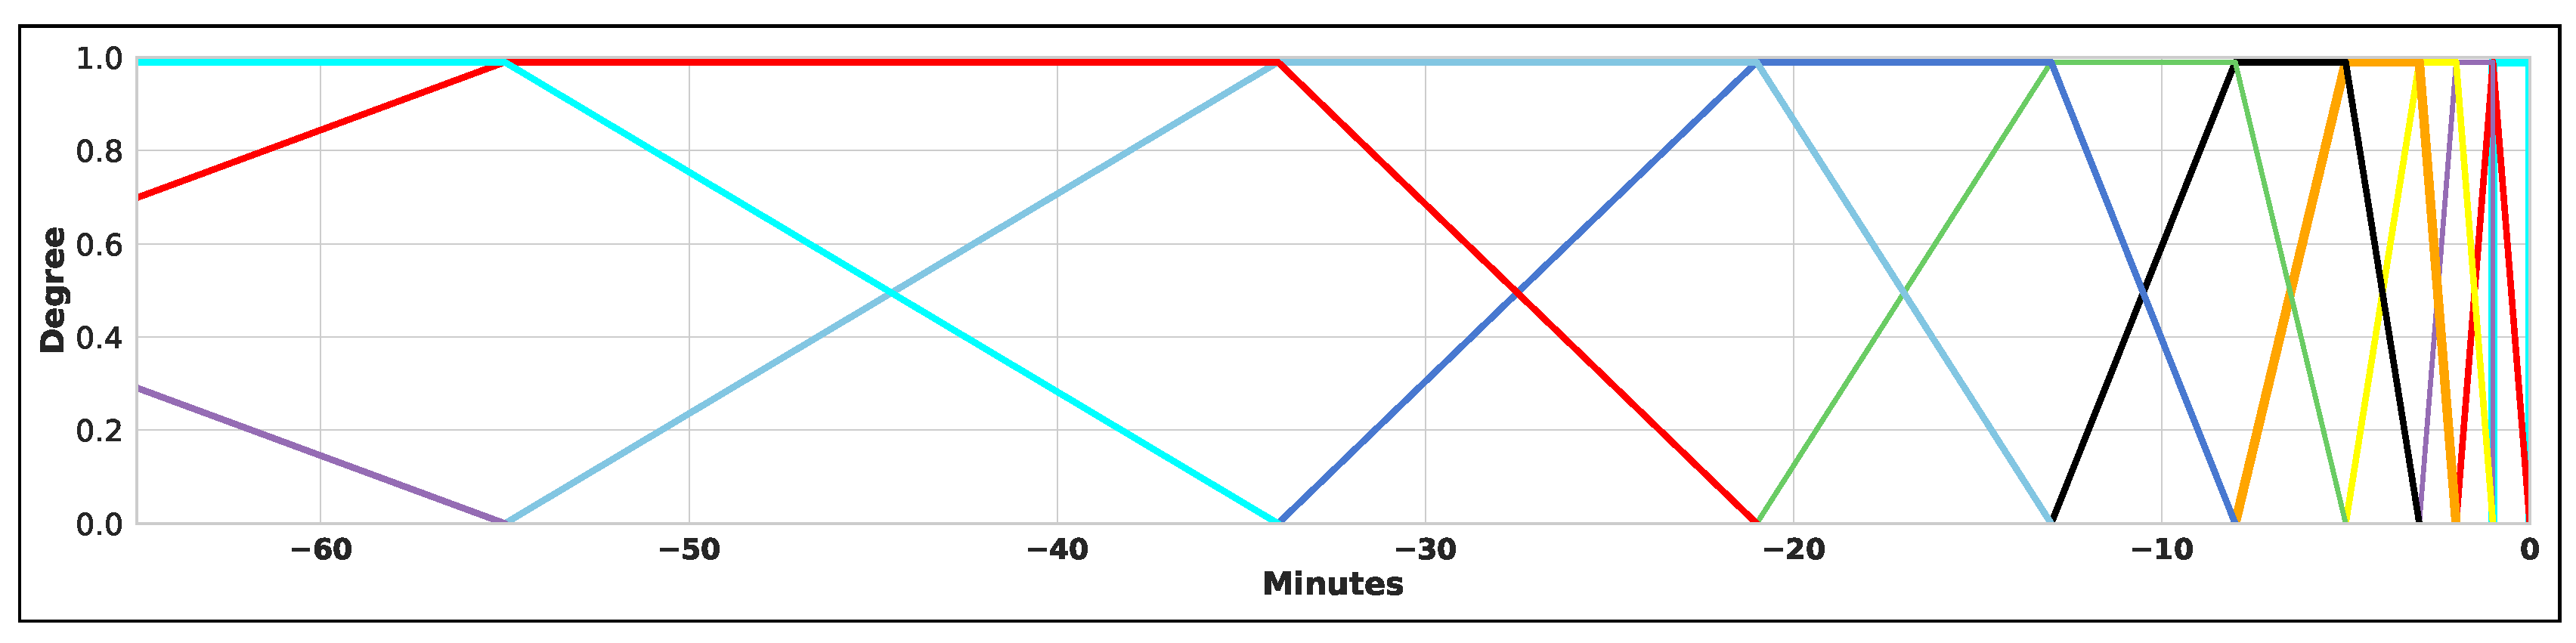
  • employing multiple fuzzy windows are used to compute features and improve the performance of human activity recognition;
  • taking the features of HAR datasets; and,
  • conducting extensive experiments using five benchmark datasets to validate the proposed approach, which shows our proposed method can improve the accuracy by more than 4% as compared with those of the existing research works
The rest of this paper is organised, as follows. Section 2, reviews the related work. Methods, individual deep learning temporal models, and the proposed joint temporal model are described in Section 3. Experimental setup and evaluations are reported and discussed in Section 4. Finally, Section 5 concludes the paper.

2. Related Work

Class imbalance problem is broadly researched, particularly using a traditional machine learning perspective. Japkowicz et al. [24] conducted an extensive systematic study and described three crucial factors of the problem: the training set size, complexity of concept, and degree of imbalance. This paper showed that problems to imbalanced classes with a minor concept complexity were insensitive, but the models with an increased concept complexity to class imbalances carried out poorly. Furthermore, it was concluded that a sufficiently large amount of training data could handle a sever complex problem, which gave satisfying accuracy. Finally, the study suggested cost-modifying and oversampling techniques for enhancing performance over the undersampling mechanism. However, the study mainly worked on data processing, while in our paper, we propose a deep learning algorithm in order to handle the imbalanced problem.
The intrinsic property of physical human activities makes classes representing imbalanced, which leads to the importance of the topic of HAR learning algorithms for imbalanced class handling, especially with a large dataset for deep learning study. Dealing with class imbalanced problems based on different strategies for deep learning methods was recently reviewed by [25]. It is revealed that there has not been enough studies with empirical work conducted on targeting the imbalanced class problem for deep learning. However, the same review indicated that traditional approaches to handling class imbalance problems used in deep learning situations show encouraging results. The traditional approaches include cost-sensitive target function and random oversampling in order to handle the imbalanced class problem and to avoid skewed learning toward majority classes.
Handling class imbalance for deep learning models mainly focuses on computer vision applications and, therefore, cannot be directly applicable to a HAR setting [25,26]. Khan et al. [27] proposed a modified cost-sensitive learning scheme with satisfying results. The cost-sensitive approach is weighting the classes differently based on the size or importance of classes while sampling is under-sampling majority classes or over-sampling minority classes. However, image classification tasks are used for the evaluation. proposed a method that combines a modified hinge loss and a sampling approach to provide tighter constraints between classes to handle class imbalance problems in computer vision tasks for a better discriminative deep representation [28]. However, two-dimensional (2-D) image classification cannot be directly translatable to a HAR setting [25,26] that usually has 1-D temporal data.
Several deep learning methods have been proposed for human activity recognition based on temporal data, which focuses on data processing. Nguyen et al. proposed a random oversampling method BLL-SMOTE on the data from mobile phone sensors which improved the human activity classification results [29]. Besides, to properly handle imbalanced activity classes, HAR systems often require selecting the temporal window size explicitly, which needs exhaustive analysis. Many shallow learning methods, including Decision Tree, Support Vector Machines (SVM), Hidden Markov Model is based on sliding, or dynamic window approaches have previously been studied [30,31,32,33]. The aim of these studies is to choose the proper window size in order to improve the classification performance. Recently, it has been found that the fuzzy temporal windows are capable of extracting good features for activity recognition from smart home sensor data [17,18]. Different from previous works, fuzzy temporal windows are used to generate the input datasets for temporal models in order to improve the performance of the minority classes in addition to the majority classes from human activity recognition.
Therefore, the proposed method has the capability to reduce the complexity of the selection of the window size and to properly and easily recognise imbalanced physical human daily activities.

3. Methods

In this paper, a joint learning deep learning method is proposed for human activity recognition, which particularly addresses the class imbalance problem. In Section, we first describe the temporal models in the Section 3.1, i.e., LSTM and 1D CNN, and the hybrid 1D CNN and LSTM model. Subsequently, the proposed method is introduced in detail. Particularly, we discuss class imbalance strategies.

3.1. Model Selection and Architecture
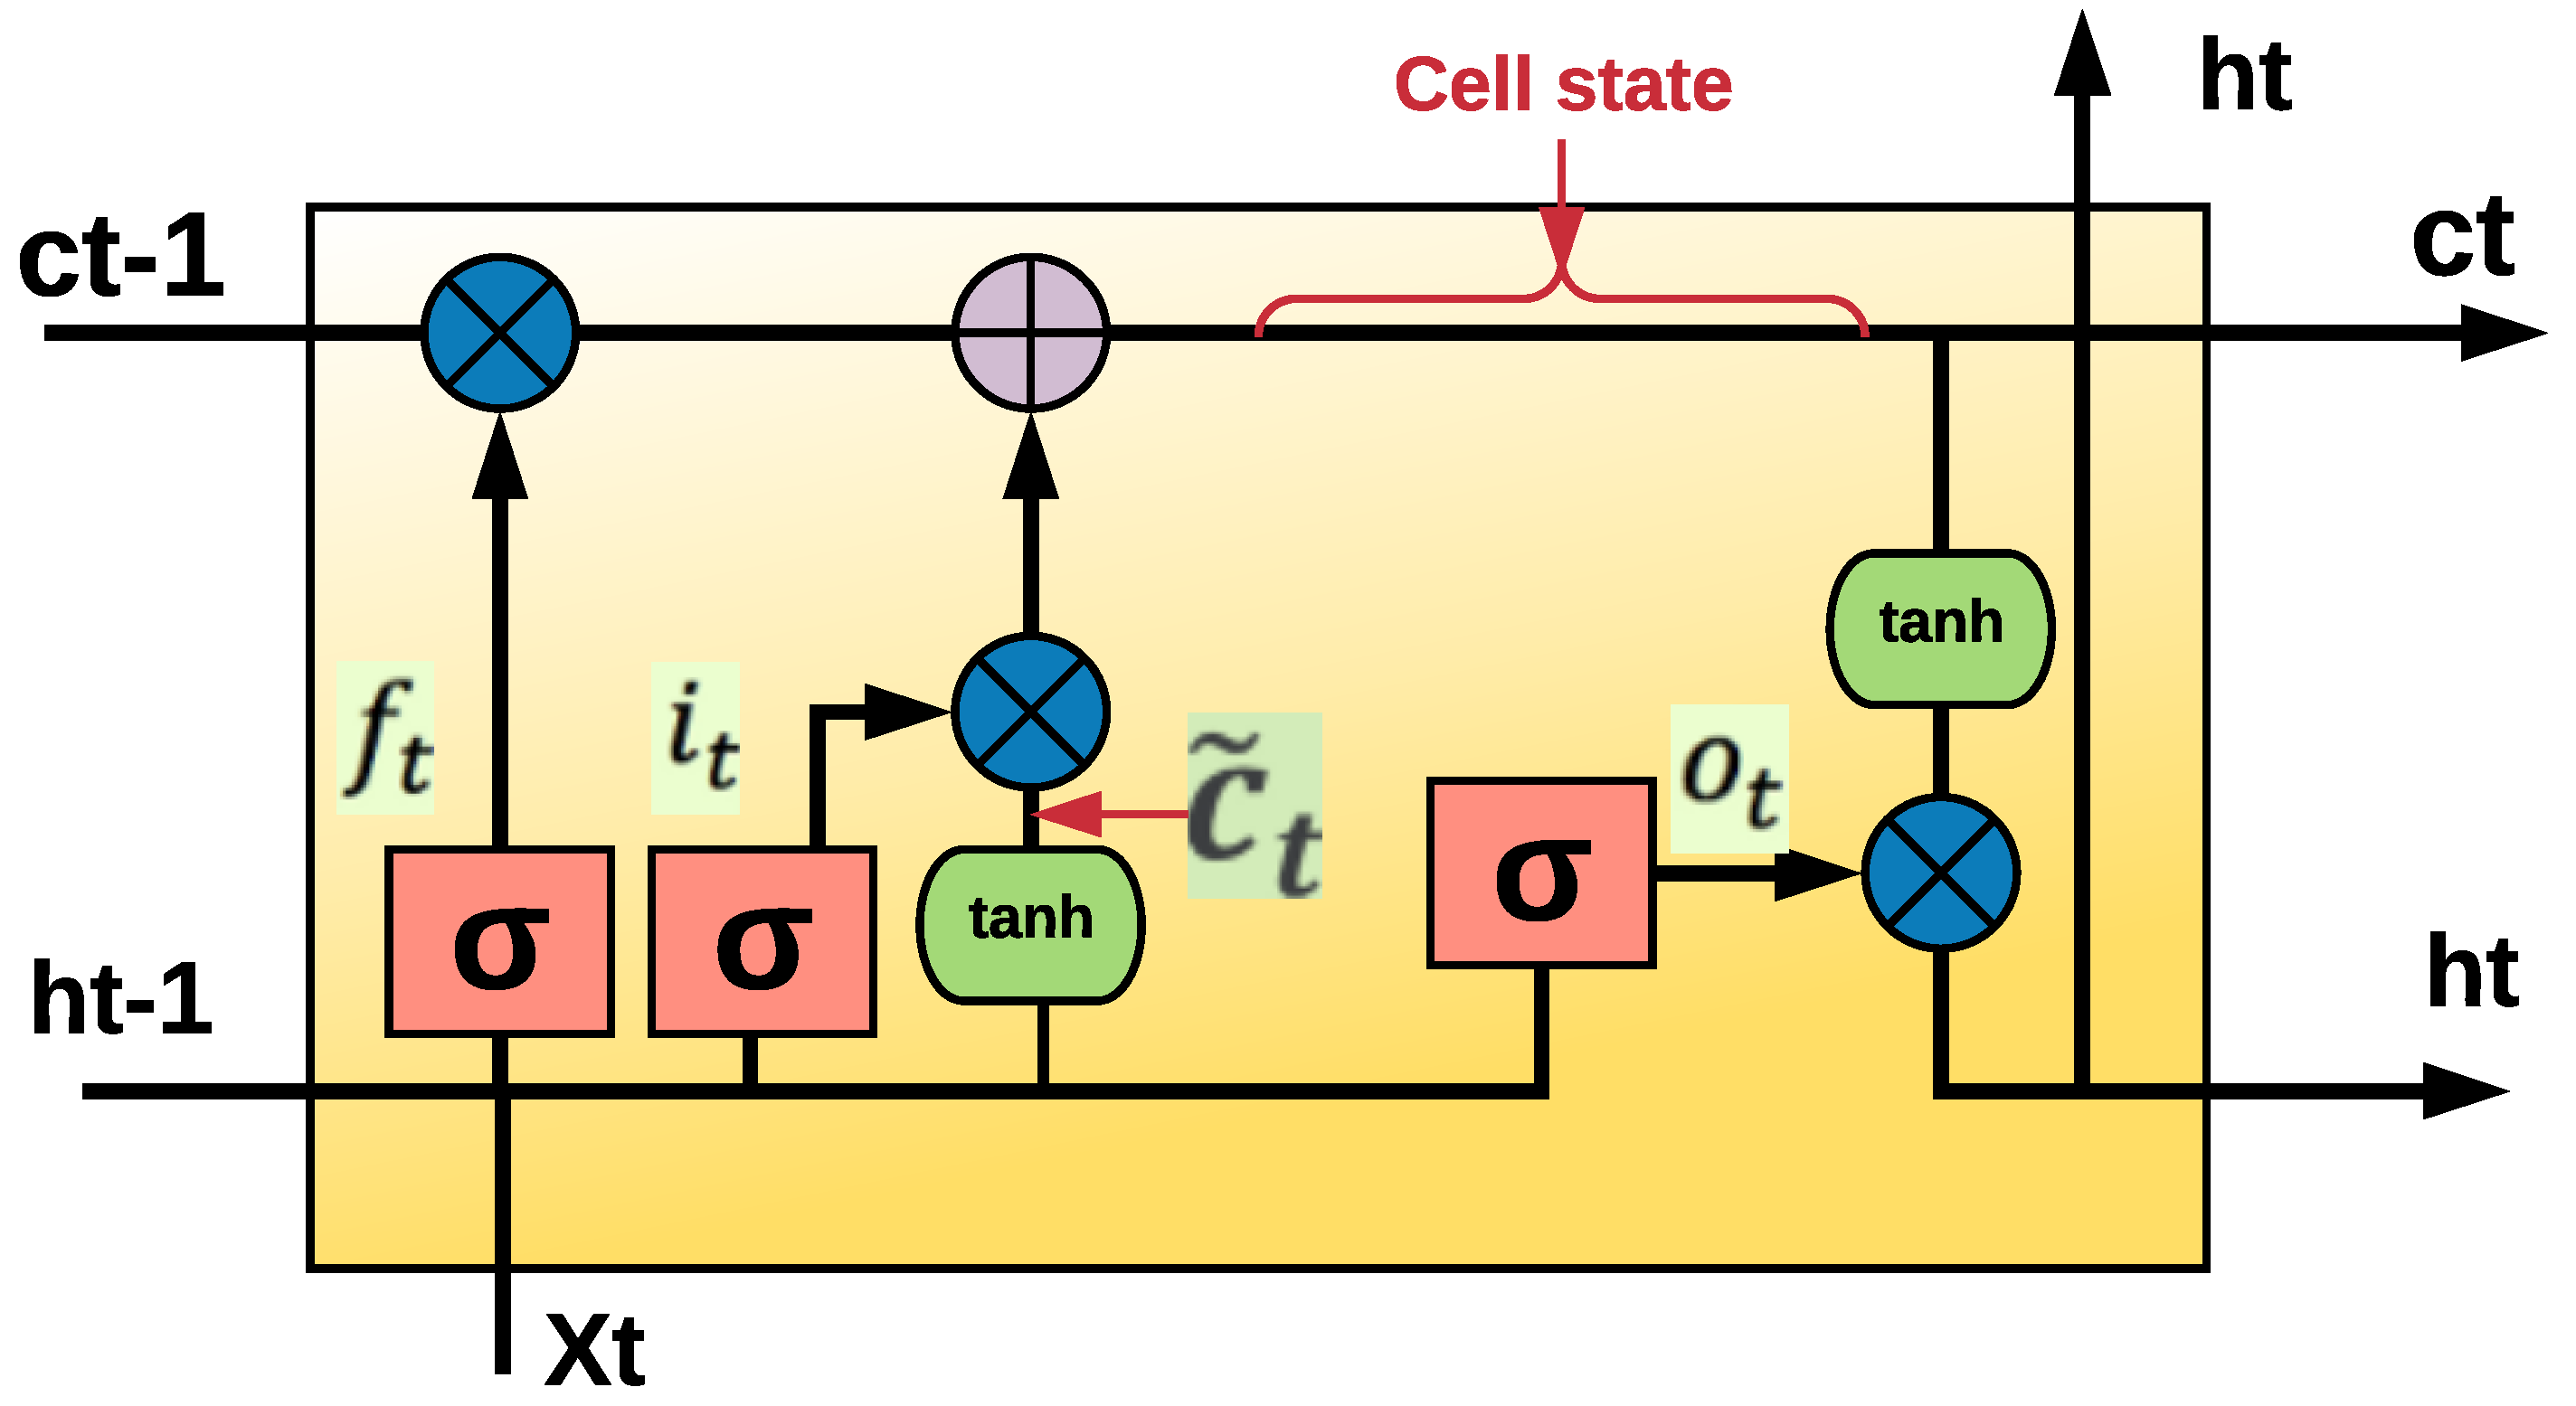
In this section, we will introduce the popular temporal models based on deep learning techniques, i.e., LSTM, 1D CNN, and the hybrid model to compare with the proposed method.

3.1.1. LSTM

LSTM extends the memory of the Recurrent Neural Network (RNN) to learn patterns from temporal sequential data [34]. It has been used to process the sensor data collected in a smart home for human activity recognition [17,18]. Different from RNN, LSTM solves the vanishing gradient problem, which learns long-term sequences and the effect of initial dependencies in the sequence. LSTM has been widely used for the applications with temporal dependence between observations [35], such as natural language processing [36], stock market prediction [37], and speech recognition [38]. Each LSTM has three gates, which are forget, input, and output gates, which remove or add information to the cell state. The cell state is the key component to LSTMs which store and pass information between LSTMs. Figure 1 shows how the three gates are connected to the cell state and to each other. Each LSTM cell operates as a memory to erase, read, and write information based on the outcomes rendered by forget, output, and input gates, respectively. Forget gate receives both a new time step X t and the previous output h t 1 as input and renders the output using sigmoid activation function to decides what information will be kept or deleted. The information will be kept if the output of the sigmoid function is 1, while the information will be completely removed if the output of the sigmoid function is 0. Equation (1) shows how the forget gates is computed. The next step comprises two parts to specifies what new information should be stored in the cell state. Input gate is the first part and specify what new information from the current input ( X t , h t 1 ) is added to the cell state. The second part is the tanh activation function that generates C ˜ t a vector of new candidate values and could be appended to the cell state. The multiplication of these two parts will be added to the multiplication of forget gate with previous cell state to create a new cell state C t . When forget gate multiplied by the previous cell state, part of the information which was specified to be deleted earlier will be forgotten. Then the new candidate values is scaled by how much the cell state is updated using i t × C ˜ t . Equations (2)–(4) show how the input gate, new candidate values, and cell state are computed, respectively. Finally, the output gate is computed based on filtered information using two different activation function and also specify the next hidden state. First, previous hidden state h t 1 and the current input time step x t are passed into the sigmoid activation function. Next, the new updated cell state is fed to the tanh activation function. The output of sigmoid function mulitplies by the output of tanh functions to generate the next hidden state. The updated cell state and the new generated hidden state pass information to the next time step. Equations (5) and (6) show the calculation of output gate and hidden state.
f t = σ ( W f . [ h t 1 , x t ] + b f ) f t represents forget gate
i t = σ ( W i . [ h t 1 , x t ] + b i ) i t represents input gate
C ˜ t = tanh ( W C . [ h t 1 , x t ] + b c ) C ˜ t represents candidate values
C t = f t × C t 1 + i t × C ˜ t C t represents Cell state
o t = σ ( W o . [ h t 1 , x t ] + b o ) o t represents output gate
h t = o t × tanh C t h t represents hidden state
where x is the input data, σ is the sigmoid activation function, tanh is the hyperbolic tangent activation function, W is the weight matrix.
LSTM has been adopted in activity recognition applications and obtained promising results [18,20,39,40,41]. Therefore, LSTM as a temporal model is used in this study. The employed LSTM model is designed using two LSTM layers and the output of the LSTM layers is flattened and fed into a fully connected layer with ReLU activation function and followed by a softmax layer. Figure 2 shows the architecture of the LSTM model.

3.1.2. 1D CNN

In the human activity recognition study, CNN is used to extract features from raw sensors data. CNN has successfully achieved satisfying results in computer vision i.e., image recognition [42], and natural language processing i.e., speech recognition and text analysis [20]. When applied for human activity recognition, CNN has the advantages of local dependency and scale invariance [15]. Specifically, CNN only considers local observations without any dependency with distant ones, and the scale is invariant for different frequencies or paces. CNN layers are applied to learn representations of human physical activity to obtain satisfying results [20]. A one dimensional (1D) CNN model that extracts local 1D sub-sequences from temporal sequential data is used in the experiments of this paper. 1D CNN has achieved competitive results as compared to LSTM in some applications of natural language processing, including machine translation and audio generation, with a cheaper computation cost [43].
The 1D CNN model is built by employing two convolutional layers each with 64 filters, and the kernel size is equal to 3, which specifies the length of the 1D convolution window with the length of stride as 1. The feature maps of convolution layers are down-sampled by the max-pooling layer, and the size of the max pooling window is equal to 2. The outputs of the max-pooling layer are flattened and then fed into a fully-connected, i.e., a dense layer with ReLU activation function followed by a soft-max layer. Figure 3 shows the architecture of 1D CNN.

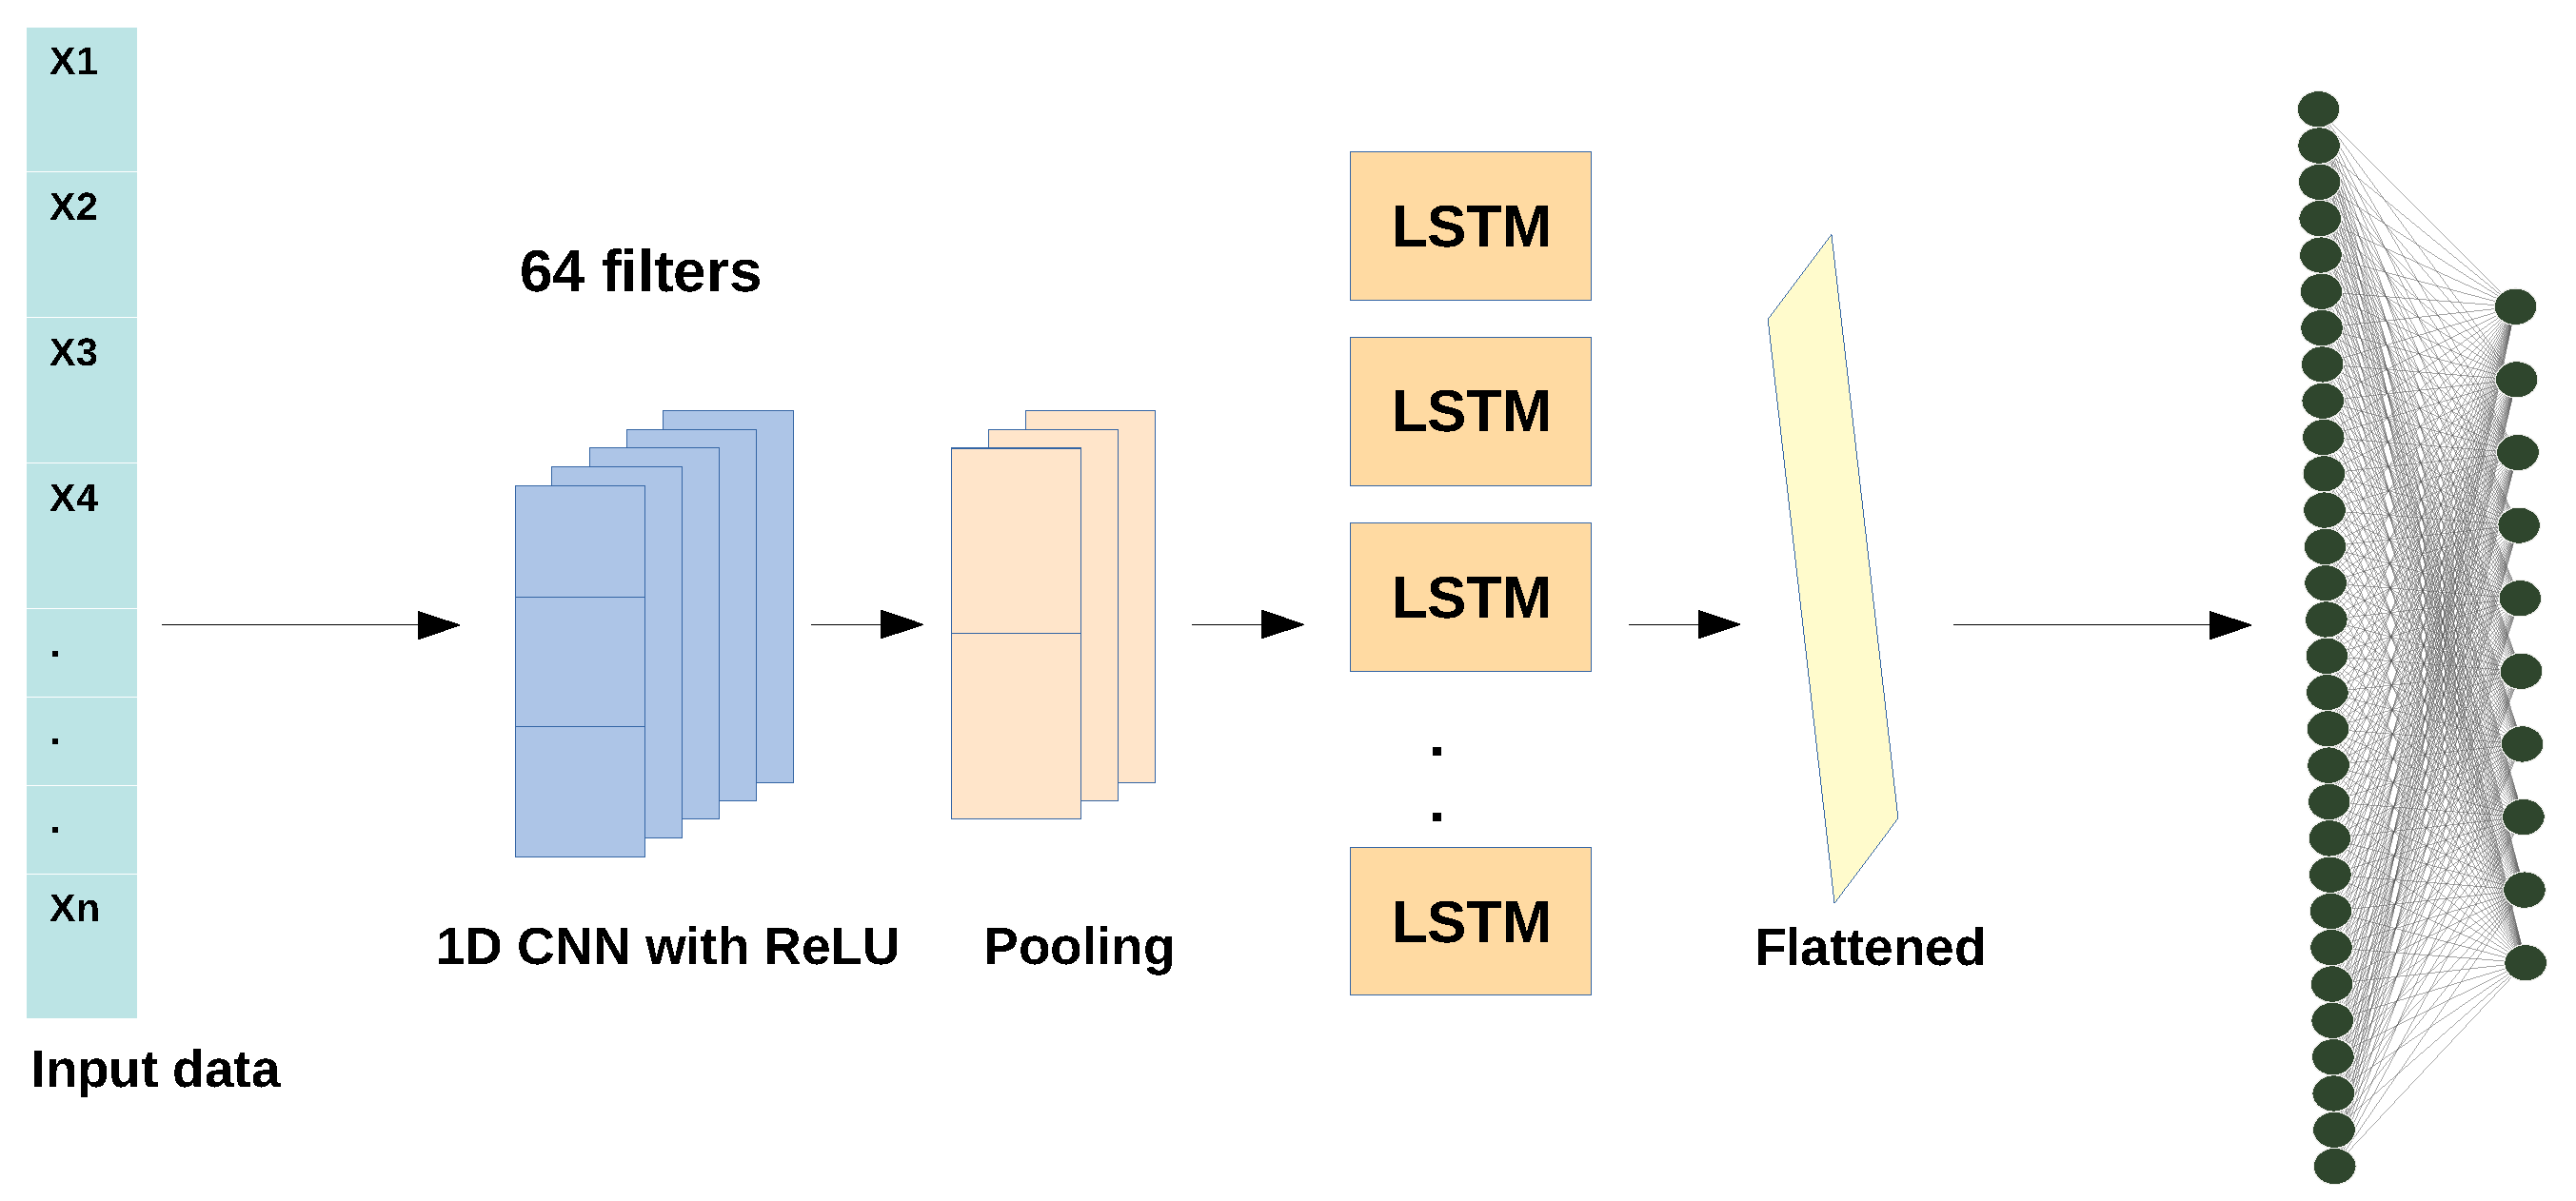
3.1.3. Hybrid Model: 1D CNN + LSTM

1D CNN and LSTM have been used sequentially to build a hybrid model for human recognition [18]. Figure 4 shows the structure of the hybrid model. 1D CNN is used for feature extraction from input data before the LSTM layers to support sequence prediction. 1D CNN layers process the input sub-sequences of human activities independently. The sub-sequences of human activities in 1D CNN are not sensitive to the time step order, which is opposite to LSTM. Moreover, 1D CNN layers are often used when an RNN model cannot realistically process and recognise long temporal sequential data. In such cases, the hybrid model could be used as a solution where 1D CNN can be applied as a pre-processing step to make the long temporal sequential data shorter through down-sampling by extracting higher level features. Subsequently, the 1D extracted features as input are fed to the RNN layers [44]. 1D CNN layers as a pre-processing step of RNN layers is particularly important to make the long sequences smaller when order sensitivity is not needed. However, order sensitivity is the key in activity recognition systems, hence the hybrid of 1D CNN and LSTM is not an optimal solution to induce order sensitivity. In this paper, the hybrid model is built by combining 1D CNN and LSTM where a 1D CNN layer is used as a pre-processing step to an LSTM layer. Specifically, the 1D CNN layer followed by a max-pooling layer with the size of the window is equal to 2. Afterwards, the LSTM layer and flattened layer are stacked, followed by fully-connected layers, i.e., a dense layer with ReLU activation function and a soft-max layer.

3.2. Proposed Joint Temporal Model

In this section, we propose joint learning of temporal model for human activity recognition. Temporal models are jointly employed in order to learn and recognise human daily living activities from smart homes aiming at increased diversity between base learners which is crucial for joint learners. The aim of joining different learner models is to produce a mutual complementary network by contributing each network with different learning approaches to build strong joint learners with good performance. Therefore, robust learners LSTM and 1D CNN for temporal data are used, which have high variance and low bias due to their almost universal function approximation ability [45] for delivering the joint learning recognition. Furthermore, the different base learners in the proposed model can expose features of different aspects of the input data which can boost the recognition performance. Joint different temporal models in addition to using leave-one-out cross-validation are used to reduce high variance. Figure 5 shows the architecture of the proposed joint learning of temporal models. Different from the Hybrid 1D CNN + LSTM model, our proposed joint learning of the temporal model includes the two parallel sequences that include LSTM and 1D CNN. The proposed method is composed of the following layers: LSTM, 1D CNN, and fully connected layers. Here, we show the details of these layers:
  • The raw temporal human activity data are used as the input of the model.
  • We use fuzzy temporal windows (More details about the fuzzy temporal windows will be introduced in Section 3.3.) for feature extraction before passing to the deep learning model.
  • The proposed deep learning model has two parallel temporal models, i.e., LSTM and 1D CNN.
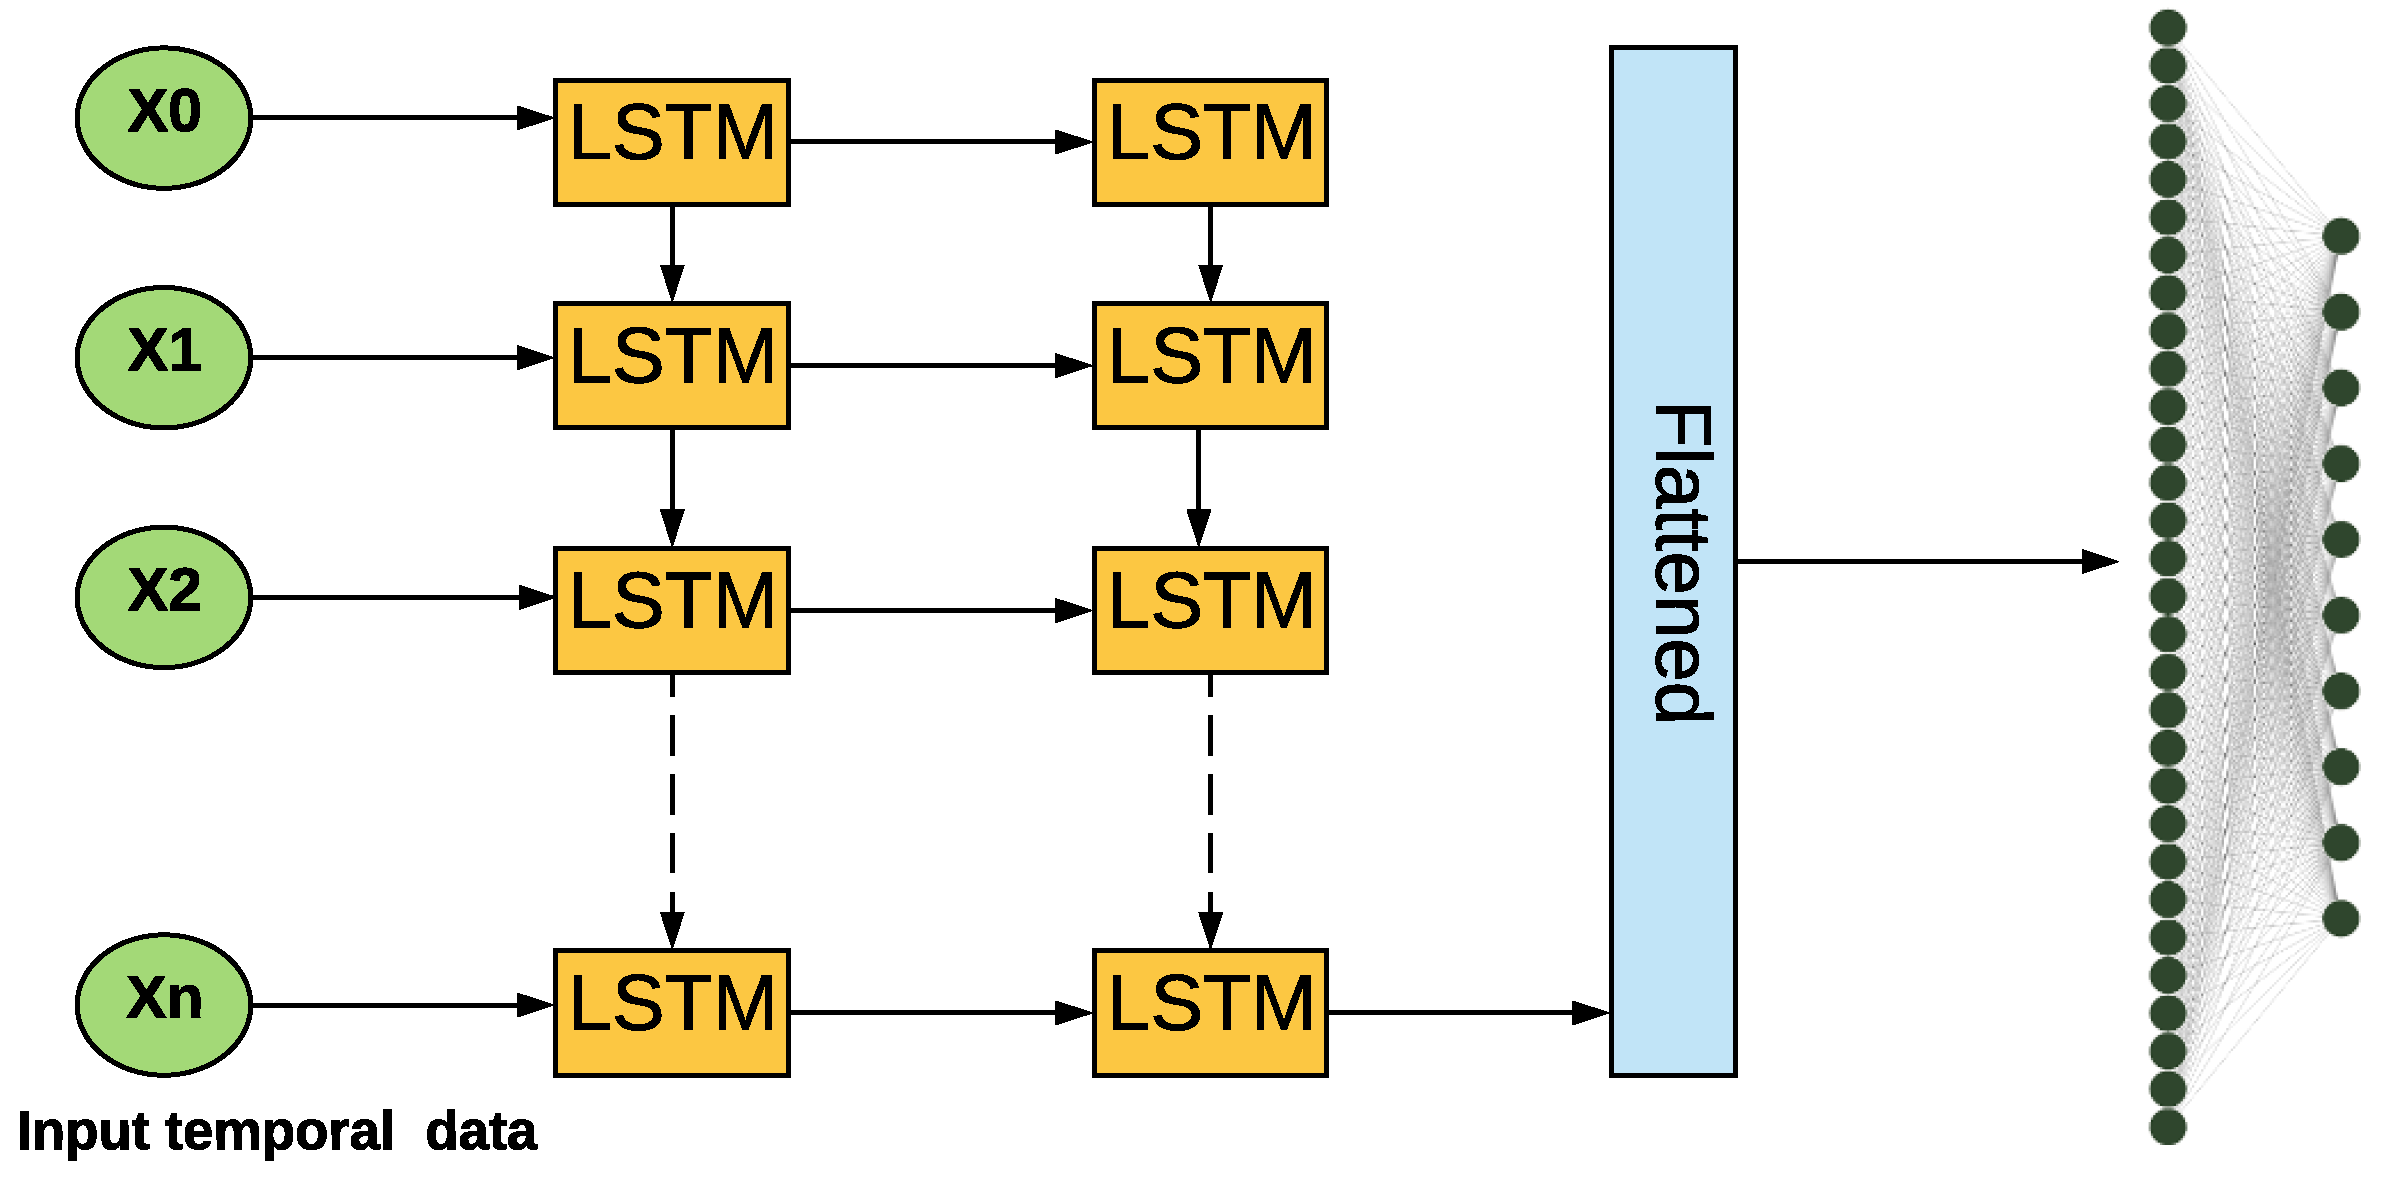
  • The first part of the model is consists of two LSTM layers.
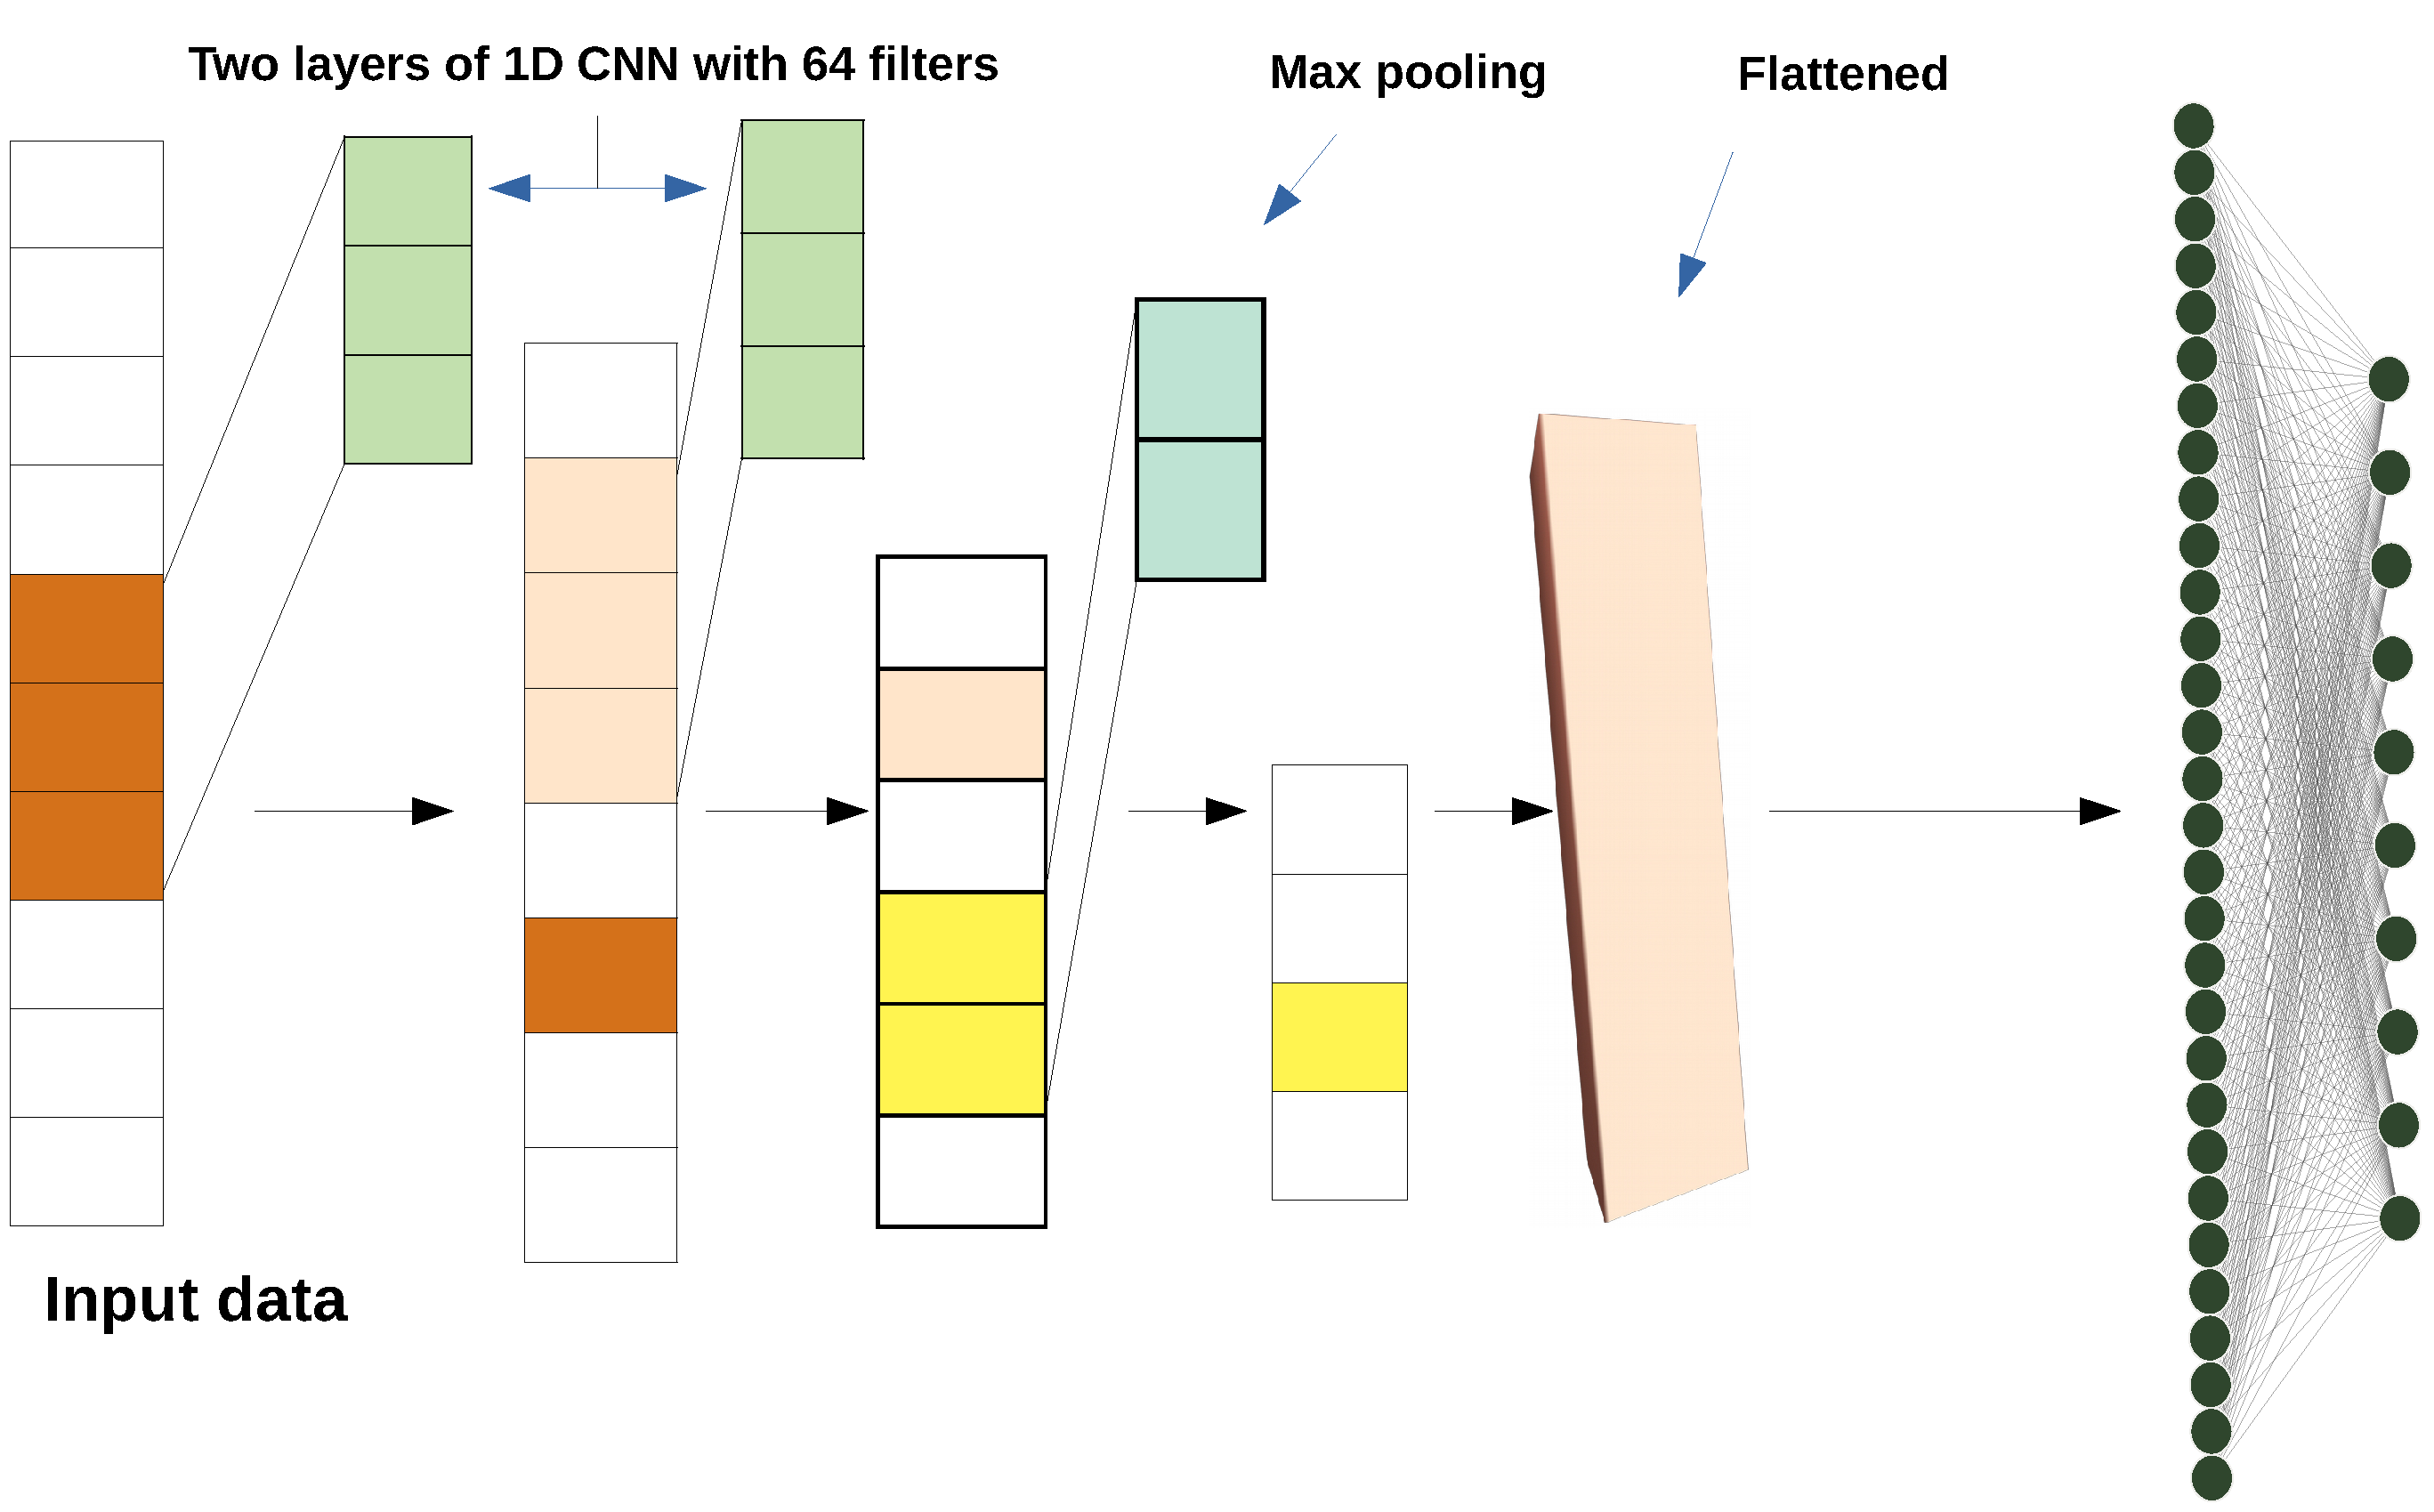
  • The second part of the model is consists of two 1D CNN layers each with 64 filters. The kernel size is equal to 3 that specifies the length of the 1D convolution window, and the stride is equal to 1.
  • Each LSTM and 1D CNN layer is followed by a dense layer to make the output-shape of LSTM and CNN layers compatible for the next shared fully-connected layer since the output-shapes of LSTM and 1D CNN layers are different.
  • Features from two separate dense layers are combined (fused) and fed to the next shared layer.
  • One shared fully connected layer with ReLU activation function is followed.
  • The final layer is the output layer with soft max activation layers.
Two layers in each of the LSTM and 1D CNN followed by a dense layer are used in order to build the model. The two multi-layer temporal models are jointly trained with 0.001 learning rate. A new shared fully-connected layer is added and connected to the dense layers of both individual temporal models. The shared fully-connected layer aggregates different exposed features of the two different models to boost the recognition performance of the minority classes in addition to the majority classes. Moreover, aggregating different exposed features in the proposed learning method helps the classifier in detecting rare activities and avoids having models biased toward one class or the other when compared to an individual learner. During updating parameters i.e., model weights, both LSTM and 1D CNN models contribute to adjust the weights through the shared layer to correctly map the input data to the output class activities. Hence, the new shared layer is used to further learn and share learned information across both joint models of the system to allow each temporal model to improve the earlier layer of the other temporal model. Thereby, the joint optimisation will maximise their capacity to enhance the recognition performance of all the classes, including the minority classes. Designing the parallel and joint learning of temporal models by combining the order-sensitivity of LSTM with the speed and lightness of 1D CNN renders an efficient model for human activity recognition. The shared fully connected layer is followed by an output layer to properly recognise human activities. When designing the deep learning structure, we consider joint robust learners with diversity, which can help to boost the recognition performance of minority classes.

3.3. Fuzzy Temporal Windows for Data Pre-Processing

As shown in Figure 5, fuzzy temporal windows (FTWs) are used to generate the input datasets from the raw sensor data for training temporal models. A fuzzy set that introduces each FTW T k is specified by a membership function. The shape of the fuzzy set corresponds to a trapezoidal function T k [ l 1 , l 2 , l 3 , l 4 ] is shown in Equation (7). Four values that define the trapezoidal membership functions are a lower limit l 1 , an upper limit l 4 , a lower support limit l 2 , and an upper support limit l 3 . The four values of these l 1 , l 2 , l 3 , l 4 are provided by the Fibonacci sequence, which has recently been successfully used for introducing FTWs. The Fibonacci sequence can easily be used for FTWs to build training datasets without involving a knowledge expert definition [17,18,46]. Figure 6 shows 12 multiple and incremental FTWs are designed based on the Fibonacci sequence. To generate a training input dataset, the FTWs are slided over raw sensors data x in every minute according to Equation (7): For example, in Ordonez smart homes A, the training input dataset generated by applying 15 FTWs on the raw sensor activations from all 12 binary sensors with the window size of 1 min. The datasets of Ordonez smart home A and B have 20,358 and 30,469 examples, respectively, where each example represents one minute of data with 12 × 15 = 180 features. Algorithm 1 shows the procedure of using FTWs in order to generate input training datasets.
Algorithm 1: Fuzzy temporal windows to generate input Datasets
 1:
Input: S e n s o r _ d a t a     Sensor data from smart homes
 2:
F T W s F i b o n a c c i S e q u e n c e      Fibonacci Sequence to define values of FTWs
 3:
I n t e r v a l s _ s e n s o r S e n s o r _ d a t a      Raw sensor data
 4:
for f t w F T W s do
 5:
for i n t e r v a l _ s e n s o r I n t e r v a l s _ s e n s o r do
 6:
  apply f t w on i n t e r v a l _ s e n s o r
 7:
end for
 8:
e x t r a c t e d _ f e a t u r e s m a x i m u m ( f t w )
 9:
end for
10:
d a t a s e t s e x t r a c t e d _ f e a t u r e s
11:
Output: d a t a s e t s
T k ( x ) [ l 1 , l 2 , l 3 , l 4 ] = 0 x l 1 ( x l 1 ) / ( l 2 l 1 ) l 1 < x < l 2 1 l 2 x l 3 ( l 4 x ) / ( l 4 l 3 ) l 3 < x < l 4 0 l 4 x

4. Experimental Setup and Evaluation

In the section, we will show details of the experimental setup and evaluation with the details of five used datasets, evaluation methods and results.

4.1. Dataset of Smart Home Data

Five human Activities of Daily Living (ADLs) recorded using binary sensors in real smart homes from public datasets are used for the evaluation. Among them, two datasets contain the sensor data from residents’ daily routine, referred as to Ordonez Home A and B [47]. These two smart homes are typically equipped with different binary sensors that can capture the daily physical activities of the residents. The binary sensors in these datasets are passive infrared (PIR) motion detectors to detect physical activities and interactions in a limited area, pressure sensors on beds and couches in order to detect the user’s presence, reed switches on cupboards and doors to measure open or close status, and float sensors in the bathroom to measure toilet being flushed or not. Table 1 provides details of the two Ordonez smart homes A and B with information of the inhabitants, and the number of activities and sensors. In Ordonez Home A, nine physical activities were carried out in fourteen days over a period of 20358 min, where data were recorded by twelve sensors in the home. In Ordonez Home B, ten physical activities were carried out in twenty-two days over a period of 30,469 min, where data were recorded by twelve binary sensors. The timeline of the physical human activities for all the smart homes data is segmented in time slots using the window size Δt = 1 mi. The activities of the common activities from Ordonez Homes A and B are Breakfast, Lunch, Sleeping, Grooming, Leaving, Idle, Snack, Showering, Spare Time/TV, and Toileting, respectively. In addition to these activities, Ordonez Home B has the activity Dinner. Table 2 shows the number of observations for each activity in the Ordonez datasets.
Three datasets from [48,49] were collected from three other environments equipped with binary sensors as well, refer to as Kasteren home A, B, and C. The details of these datasets are shown in Table 1. In Kasteren home A, ten daily human activities were carried out in twenty-five days over a period of 40,005 min, which were recorded from fourteen sensors in the smart home A. In Kasteren home B, thirteen daily physical human activities were carried out in fourteen days over a period of 38,900 min, which were recorded from twenty-three binary sensors. In Kasteren home C, sixteen daily human activities that were carried out in nineteen days over a period of 25,486 min, which were carried out from 21 binary sensors. The timeline of the daily human activities for all Kasteren smart homes is segmented in time slots using the window size Δt = 1 min as well. Table 3 shows the number of observations for each activity in the Kasteren datasets.
The raw sensor data from smart home provide the start time and end time of the sensor activations as well as the type ( such as pressure sensor), location (such as bed), and place (such as bedroom) of the sensors. To pre-process the raw sensor data and generate the input datasets of the models, multiple and incremental fuzzy temporal windows are used. Fuzzy temporal windows have been successfully used to capture signal sensors of a long and short duration of human activities, such as sleep or snack from raw sensor data, which help to increase the performance of the temporal models [17,18,46]. Besides, temporal models i.e., LSTM and 1D CNN achieve better performance for activity recognition when the input datasets are generated by fuzzy temporal windows when compared to other methods such as Equally Sized Temporal Windows (ESTWs), Raw and Last Activation (RLA), and Raw and Last Next Activation (RLNA) [17,18,46].

4.2. Models Parameter

For all of the models in this study, we use a range of learning rates from 0.0001 to 0.01, a range of batch sizes from 8 to 64, a range of dropout rate from 15% to 50%, and a range of the number of epochs from 5 to 50. We have conducted a series of trial and error experiments over these ranges. We have noticed that 10 epochs at a learning rate of 0.001 and the batch size of 10 with 40% dropout rate are optimal for the models to converge. While a large batch size often can render rapid training, it needs more memory space and it delays the convergence of deep learning models [18]. On the contrary, smaller batch sizes that need less memory space could make the training process slower but could make the convergence of deep learning models faster; therefore, it is mostly a trade-off problem [18,50]. To prevent the models from overfitting, the 40% dropout rate as a regularization technique is used [51]. The dropout technique ignores neurons that are randomly selected during the training process. THe dropout technique temporally disconnects the ignored neurons on the forward pass; hence, in the backward pass their weights will not be updated.

4.3. Goals, Metrics and Methodology
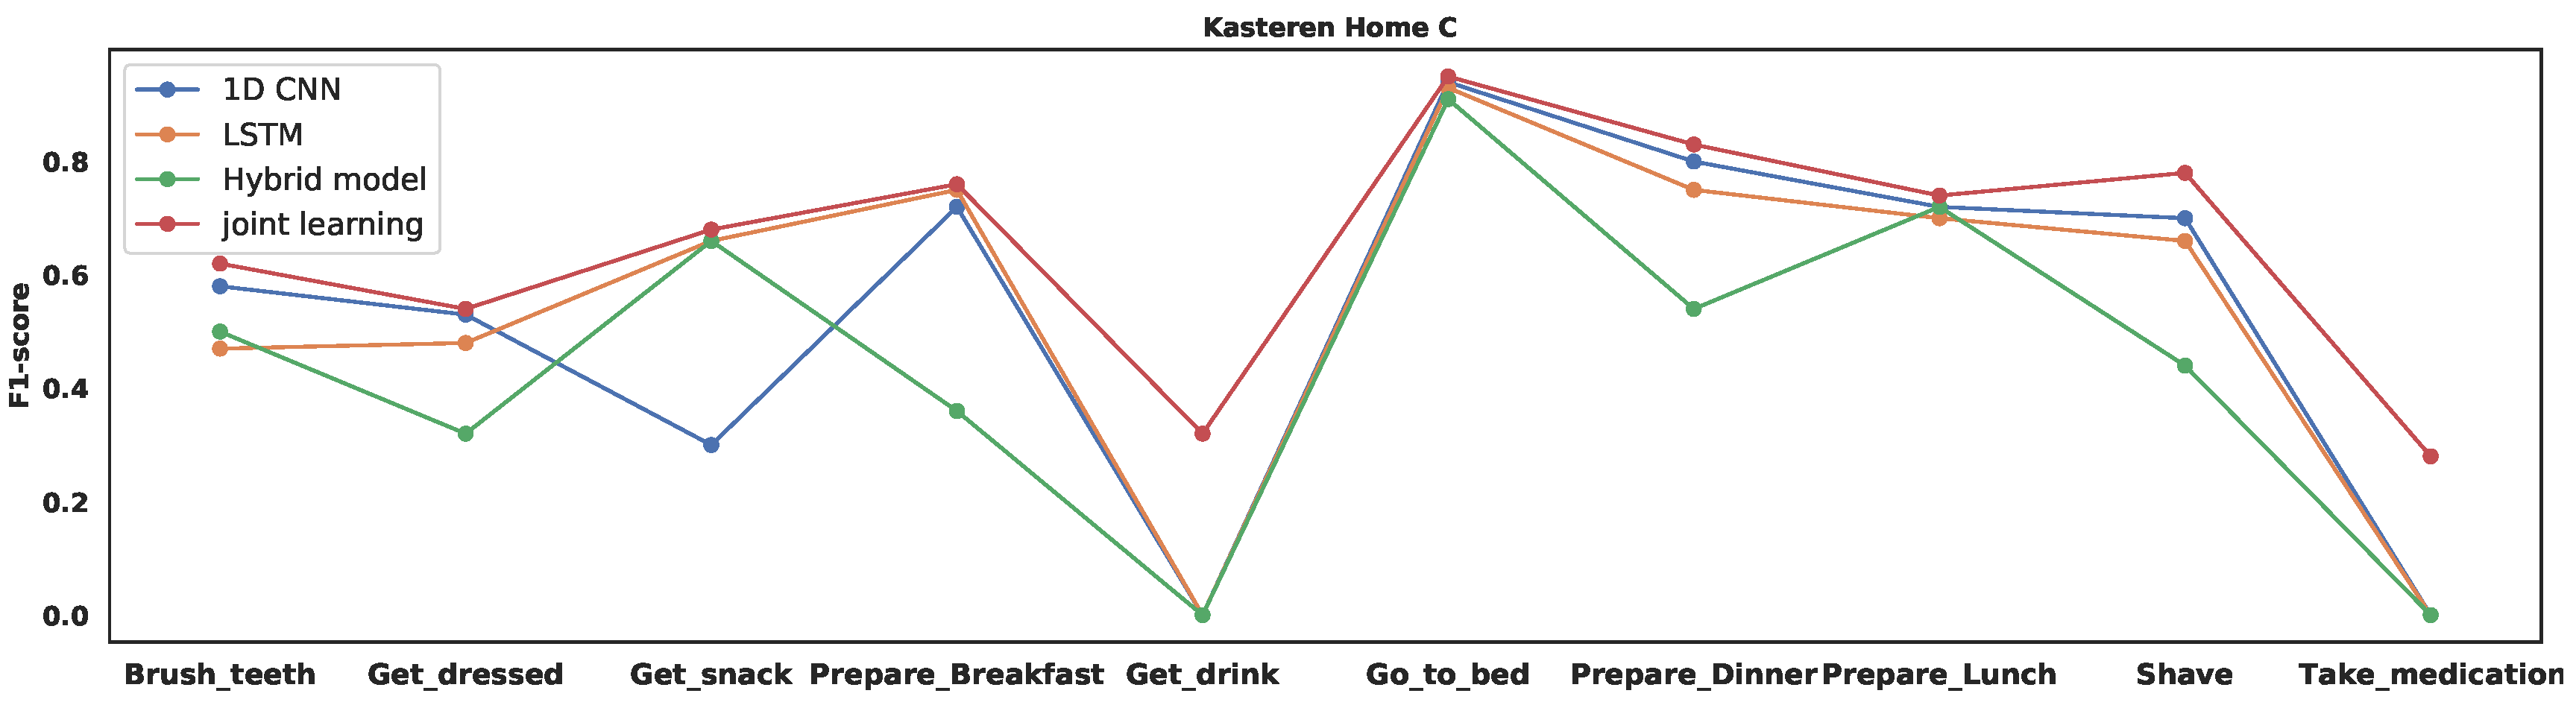
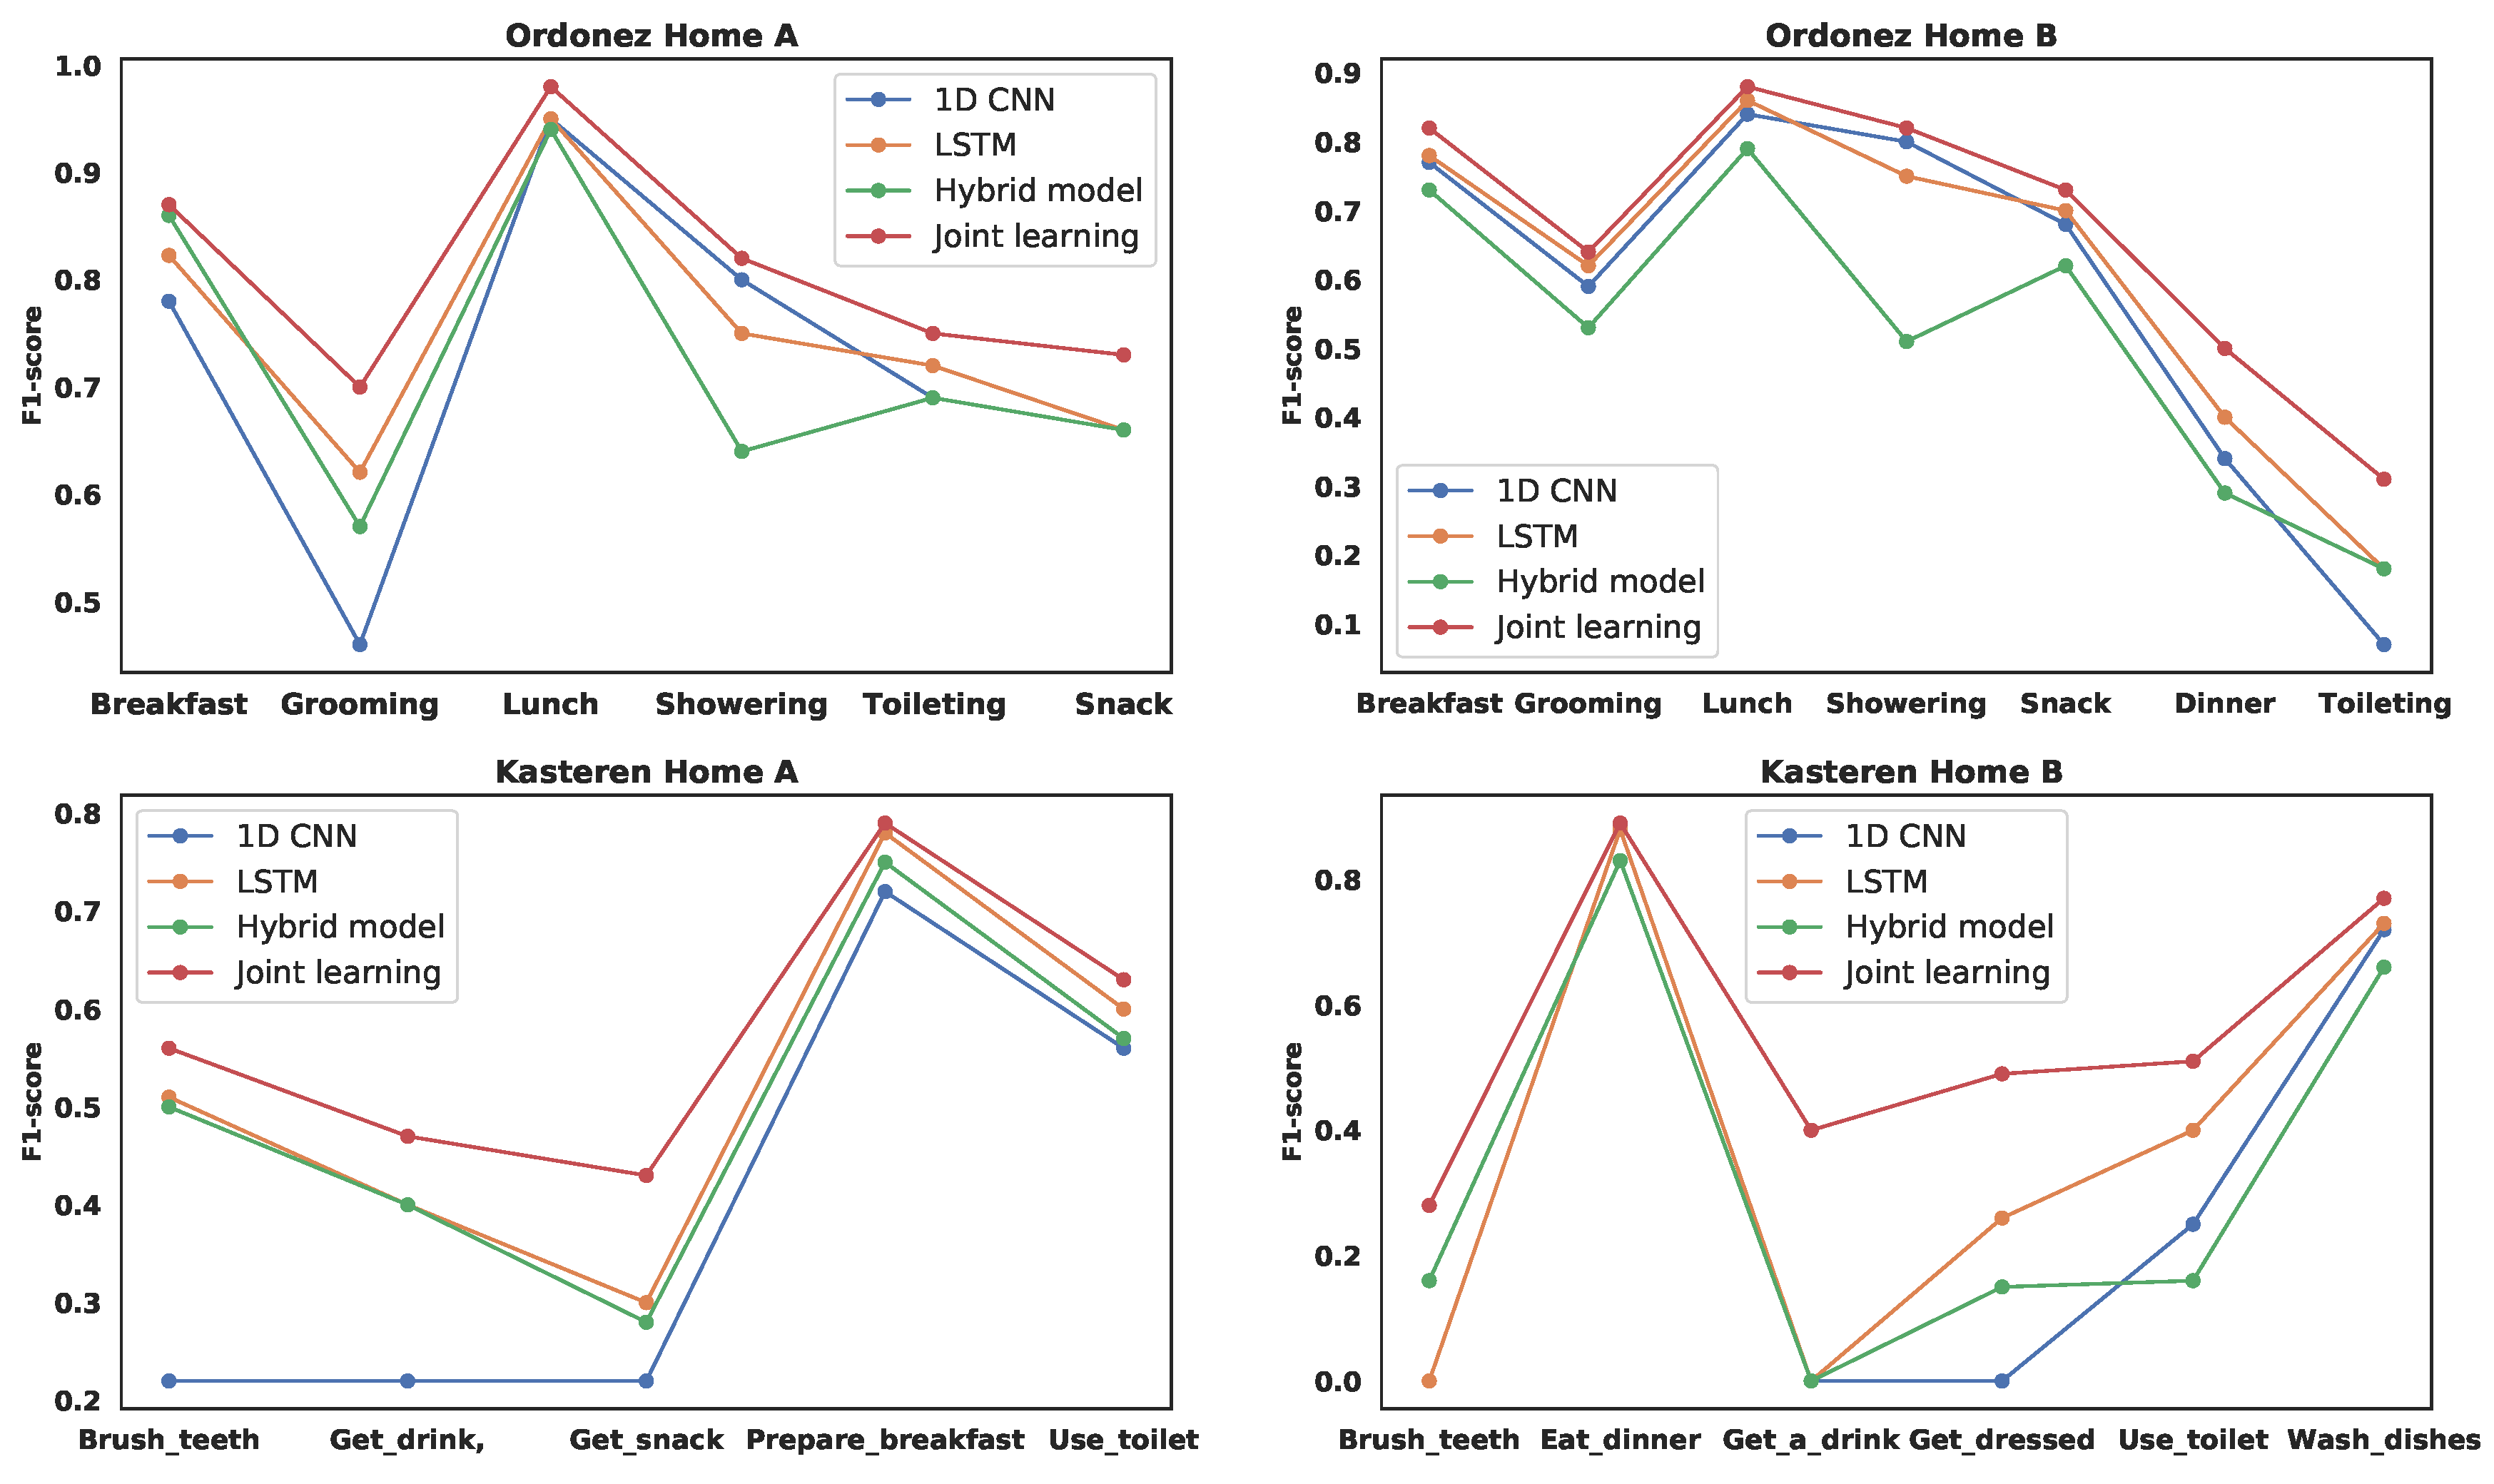
The goal of the experiments is to show the performance of the proposed joint learner and conduct a thorough comparison to show the advantage of the proposed model, which enhances the performance of activity recognition and particularly the activities with less frequency. To perform the experiments efficiently, free online Google Colab is used in order to train the networks in this study that continuously provides a single 12 GB NVIDIA Tesla K80 GPU for 12 h.
The leave-one-day-out cross-validation is used in the evaluation for all of the models, specifically the human activities on an individual day are used for testing of the models and the models are trained on the human activities of the rest of the days. This procedure is circulated until the human activities data from all the recorded days are involved in the testing set [52]. The average F-score is calculated from the results of the cross-validation for all the models that has successfully been performed in [18,44,53]. Because the classes of the human activity datasets collected from smart homes are imbalanced, the proposed joint learning of temporal models handles the imbalanced human activity classes and avoids having classifiers biased toward the majority classes.
The evaluation plays an important role in this study. Accuracy is often employed to measure the performance of classifiers. However, accuracy in the presence of imbalanced classes cannot be appropriate measured for classification because less presented classes have a very little impact on accuracy as compared to the prevalent classes [54]. Hence, the F1-score is employed to measure and evaluate all of the temporal models since the F1-score is the weighted average of recall and precision that can provide more insight into the functionality of the temporal models than the accuracy metric [55]. The F1-score is calculated in Equations (8)–(10), respectively.
F 1 = 2 · p r e c i s i o n · r e c a l l p r e c i s i o n + r e c a l l
r e c a l l = T P T P + F N
p r e c i s i o n = T P T P + F P
where TP, FP, and FN are the number of true positives, false positives, and false negatives, respectively. Moreover, the F1-score is widely used in activity recognition [18,45,56].

4.4. Results

In this section, the experimental results of the experiments of the proposed joint learning of temporal models are presented and discussed. The joint temporal model is compared with LSTM, 1D CNN, and hybrid 1D CNN+LSTM. Table 4 shows the F-scores of the proposed joint learning of temporal models when compared with the individual and hybrid learners from Ordonez Home A and B datasets. Regarding the Kasteren datasets A, B, and C, the F-scores of the proposed joint learning of temporal models compared with the LSTM, 1D CNN, and hybrid model are shown in Table 5 and Table 6. The results show that the joint learning of temporal models outperforms the individual temporal and hybrid learners by more than 4% in total from all the datasets. Figure 7 and Figure 8 show the improvement of F1-score results of minority classes from all the five datasets by the proposed method when compared with the individual learners and the hybrid learner.
When compared with LSTM, 1D CNN, and the hybrid model, the use of our proposed model increases the F-scores by 4%, 6%, and 6% in Ordonez home A, and by 4%, 6%, and 10% in Ordonez home B respectively. Regarding to the infrequent activities Breakfast, Grooming, Lunch, showering, toileting, snack, Dinner, the proposed method improves F-scores by 4%, 8%, 3%, 7%, and 3% from Ordonez home A and by 4%, 1%, 2%, 2%, 11%, and 10% in Ordonez home B, respectively. This confirms the proposed model is capable of achieving better performance for the recognition of minority classes. When compared with LSTM, the proposed method improves F-scores by 4% from Ordonez home A, B, and Kasteren home A, as well as by 9% and 11% from Kasteren home B and C, respectively. When compared with 1D CNN, the proposed method improves F-scores by 5% from Ordonez home A, B, and by 11%, 15%, and 14% from Kasteren home A, B, and C, respectively. When compared with the hybrid model, the proposed method improves F-score by 6%, 10%, 5%, 12%, and 16% from Ordonez home A, B, and Kasteren home A, B, and C respectively.
Regarding the F-score results from Kasteren datasets A, the results of the minority classes in addition to majority classes are increased using the proposed model when compared with the individual models and the hybrid model. The minority classes from home A are Brush_teeth, Get_drink, Get_Snack, Prepare_Breakfast, Take_shower, Use_toilet, those from home B are Get_a_drink, Get_dressed, Use_toilet, Brush_teeth, Eat_dinner, Wash_dishes, and those from home C are Brush_teeth, Get_dressed, Get_snack, Get_drink, Go_to_bed, Prepare_Breakfast, Prepare_Dinner, Prepare_Lunch, Shave, Take_medication, and Use_toilet. The experimental results show that the proposed joint learning of temporal models can improve the performance of minority classes besides the majority classes for human activity recognition.
All of the models perform poorly for some minority activities, such as Get_drink with only 20 samples, and take medication with only six samples from Kasteren Home C. Firstly, a small number of samples are given high dimensional data with 315 features (21 sensors * 15 fuzzy temporal windows) from Kasteren Home C dataset, and one likely problem is the curse of dimensionality of the smart home datasets, since high dimension creates difficulties for the classifier to search. Secondly, the results indicate that there is not enough variation in the smart home data with respect to these two activities and the input features are non-informative and useless in the separation of these activities from the rest. To further improve these minority classes, imbalanced data could be handled from data level, i.e., oversampling minority class using SMOTE [57] in addition to handling imbalanced data from algorithm level as we have performed by proposing joint learning, which could be considered in the future work of this study.
To further evaluate, the proposed method is compared with joint learning based on two LSTM models and joint learning based on two 1D CNN models with the same configuration of the proposed method. The results show that the proposed method achieves higher F1-score as shown in Figure 9. This indicates that the diversity and complementarity of the proposed method are more important than training combined the same learners i.e LSTM with LSTM or 1D CNN with 1D CNN.

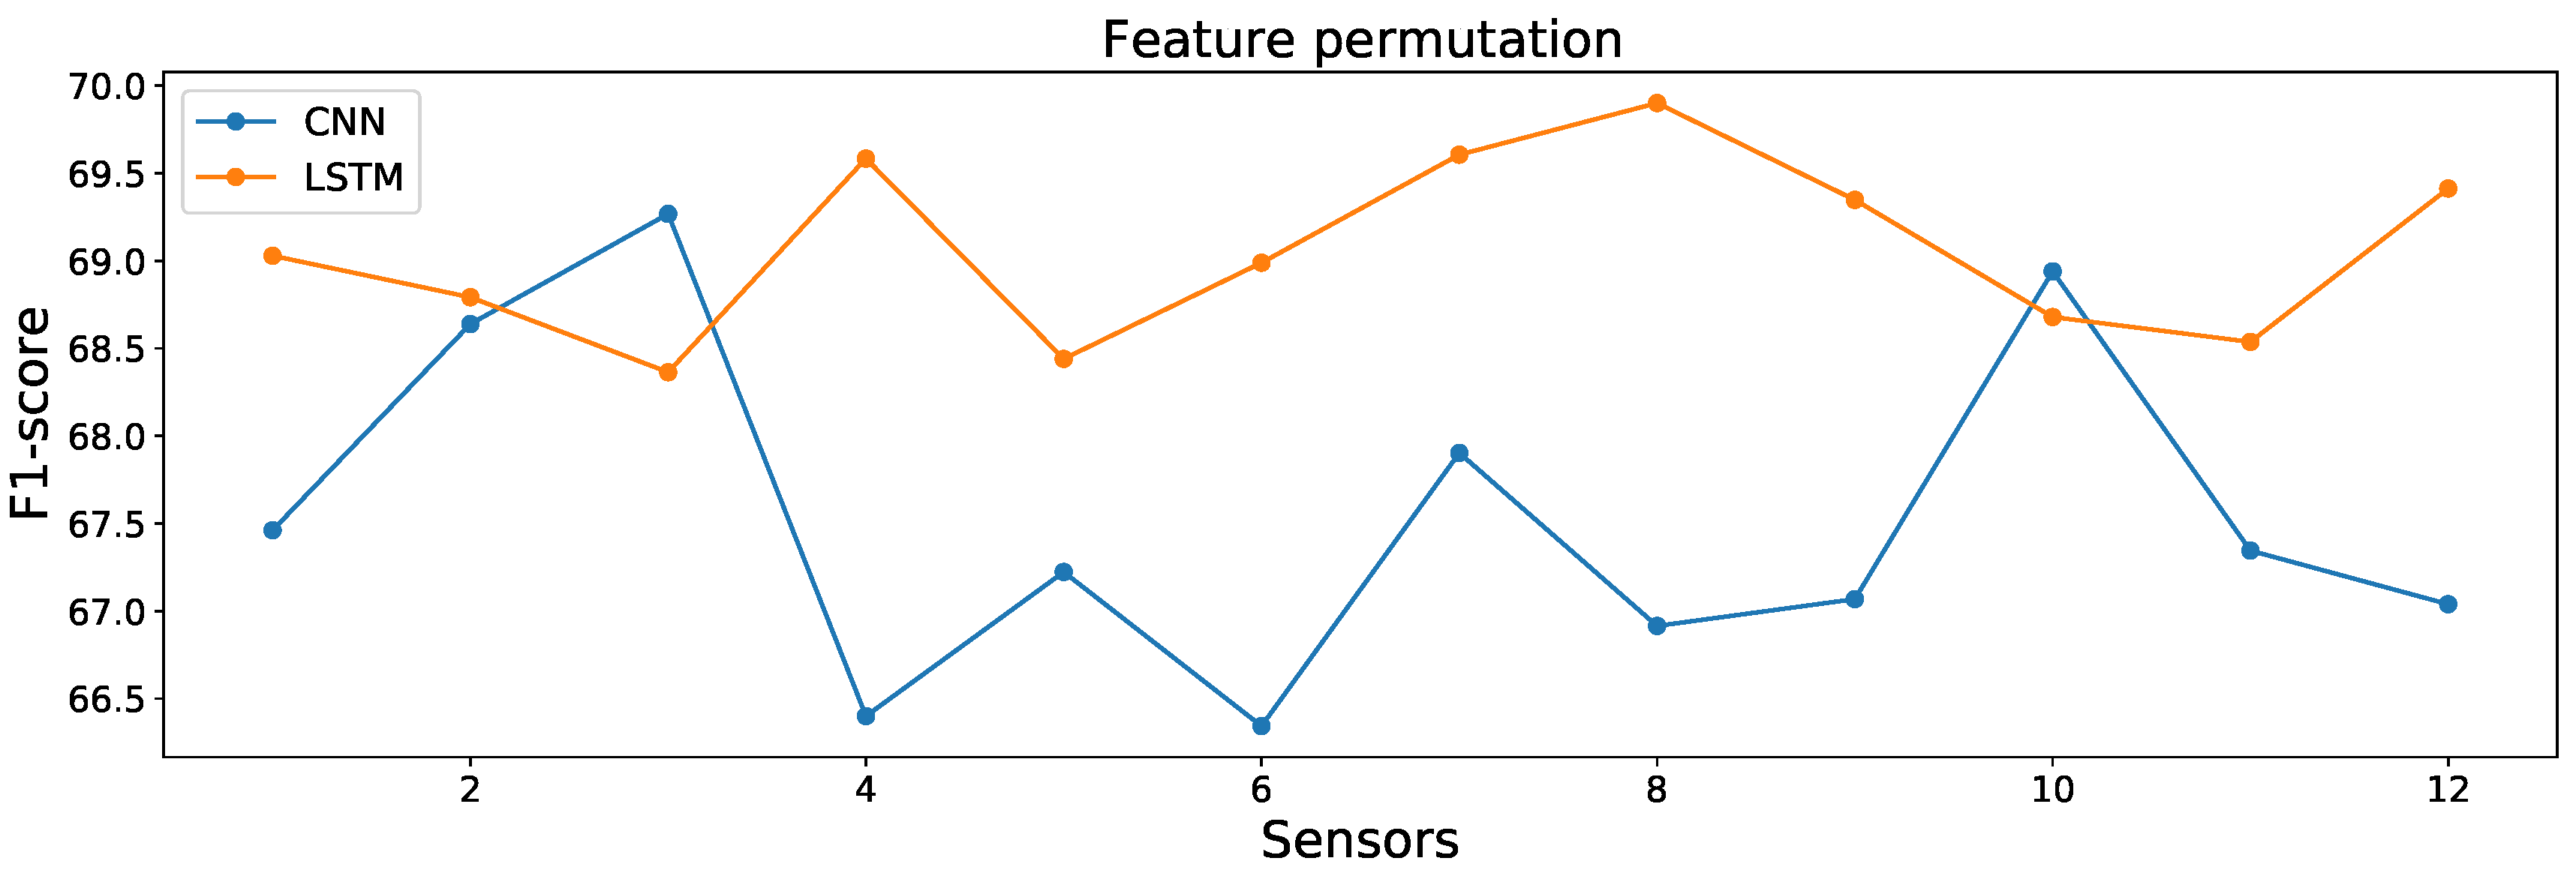
4.5. Model Interpretability

In this section, permutation feature importance (PFI) as a useful mechanism of model interpretability [58,59,60] is conducted to show more insight of each LSTM and 1D CNN independently. PFI is used to compute and rank input feature importance from Ordonez smart home A and B datasets based on how useful feature are at HAR for LSTM and 1D CNN. PFI reflects how each predictor variable is important from HAR for each LSTM and 1D CNN. Experiments that are based on PFI show that the most and least important features from both datasets are different in HAR for LSTM and 1D CNN. This indicates the most important features in recognition process varies between LSTM and 1D CNN, which has been considered to take advantage of most important features in both models in the proposed joint learning. Hence, the proposed joint temporal model exposes different features from input data into the joint learning to improve the performance of HAR particularly minority classes given the different rank of the important features from both models. The rank of features in LSTM and 1D CNN based on the PFI is different, which is indicative of how much each LSTM and 1D CNN models relies on the features. This illustrates that the joint proposed model takes feature importance in both models into account in the joint learning. Therefore, the joint learning can use a set of the most important features from one model and a different set from the other model to contribute in the recognition to generally improve the performance of HAR particularly minority classes. Algorithm 2 designed based on [60,61] shows the process of PFI in detail. Firstly, the result scores, i.e., F1-score of each LSTM and 1D CNN, are computed. Next, a single feature from the dataset is randomly shuffled to generated a permuted version of the dataset. This mechanism removes the relationship between the features and the true labels. Subsequently, the LSTM and 1D CNN models are independently applied on the permuted version of the dataset to compute the result score. Finally, we subtract the result score based on permuted data from the result score of the original data. This mechanism measures features’ importance by computing the error of the LSTM and 1D CNN after permuting the feature. Moreover, after applying permutation on a feature, the decrease of the f1-score indicates the model depedency on the permuted feature. This mechanism is applied on all of the features to compute feature importance. Table 7 and Table 8 show PFI on the Ordonez smart homes A and B datasets and the rank of the importance of each feature. Further, the value of mean and standard deviation of the F1-score for N runs after permuting the feature are presented. Figure 10 and Figure 11 show the mean results of f1-score with N = 12 run for 12 sensors after permuting the sensor features.
Algorithm 2: Compute Permutation Feature Importance (PFI)
 1:
Input: Train model M on original dataset D, label vector Y, error measure L(Y, Y ^ )
 (original datasets is the dataset without permutation, Y ^ is the predicted label)
 2:
Compute result score R S o r i g i n a l ( M ^ ) = L ( Y , M ^ ( D ) )      (e.g., F1-score )
 3:
for for each feature j from D do
 4:
for for each repetition n = 1 t o N do
 5:
  feature permutation on D to generate D ^ n , j     (This removes the relationship between D j and Y)
 6:
  Compute result score R S p e r m u t e d , n j ( M ^ ) = L ( Y , M ^ ( D n , j ) )   (e.g., F1-score on the permuted data)
 7:
end for
 8:
 Compute feature importance i j for feature j, i j = R S o r i g i n a l ( M ^ ) 1 n n = 1 N R S p e r m u t e d , n j ( M ^ )
 9:
end for
10:
Output: feature importance i for all the features
We further analyse the effect of the proposed method for the performance improvement to the minority classes: Breakfast, Grooming, Lunch, showering, toileting, snack, Dinner. For example, the feature PIR_Cooktop_Kitchen is the most important feature for LSTM but the least important feature for 1D CNN from smart home A, as shown in Table 7. In contrast, the feature Electric_Microwave_Kitchen is one of the most important features for 1D CNN, but the last ranked and least important feature for LSTM. In addition to the two aforementioned features, the features Magnetic_Fridge_Kitchen, Magnetic_Cupboard_Kitchen, and Electric_Toaster_Kitchen have the different rankings from LSTM and 1D CNN, where they contribute to the recognition of minority classes of the kitchen area, such Breakfast, Lunch and snack. Moreover, the PIR_Basin_Bathroom, Flush_Toilet_Bathroom, and PIR_Shower_Bathroom features have different rankings where they contribute to the recognition of minority activities of bathroom area, such as Grooming, showering, and toileting. Features from smart home B also have different rankings where they contribute to the recognition of minority activities from both kitchen and bathroom areas. For example, PIR_Shower_ Bathroom is one of the most important features for LSTM, but the least important features for 1D CNN, as shown in Table 8. Moreover, the Magnetic_Fridge_Kitchen and Electric_Microwave_Kitchen are the most important features for 1D CNN where they can contribute to the recognition of the minority classes such as Breakfast, Lunch, Dinner, and snack. Hence, the proposed joint learning takes advantage of the complementary features to improve the performance of the minority classes.

5. Conclusions

This paper proposes joint learning of the temporal model in an effort to improve the classification results for minority classes, as well as for the majority classes of human activity recognition tasks in smart homes. The data are preprocessed using FTWs to extract informative features. The proposed model is built upon LSTM and 1D CNN in parallel as one joint model. Extensive evaluations have been conducted in order to compare the proposed joint model with individual temporal models, i.e., LSTM, 1D CNN, and their hybridisations to show the superiority of the proposed model. The experimental results also confirm that our model has better performance for imbalanced data. The F-score results of the joint temporal model outperform 1D CNN, LSTM, and the hybrid learner by up to 4%.
The proposed joint learning outperforms the state-of-the-arts by 4% to 10%, which can be considered a substantial margin, since building accurate HAR systems is challenging due to the large diversity of activities since different sensors record human movements and inherently imbalanced the frequency of activities. Besides that the proposed method is evaluated against state-of-the-art based on five standard benchmark datasets of activity recognition. An accepted threshold for a model to be considered to be successful is mainly based on the application scenario. Because activity recognition could be used to security perspective or elderly monitoring, the minimal 4% improvement is a substantial margin.
Future work will investigate a newly proposed method in human activity recognition to handle imbalanced human activity problems by integrating a data level and an algorithm level. Handling imbalanced class problems from data level in addition to applying the proposed joint learning will further improve the recognition rate, particularly for extremely rare activities. One approach could be oversampling using SMOTE technique to only generate new samples from infrequent activities. Besides, weak supervision will be used to properly and correctly label the newly generated samples, since SMOTE is not sufficiently accurate in labeling new samples.

Author Contributions

Conceptualization, R.A.H.; methodology, R.A.H.; software, R.A.H.; validation, R.A.H., B.W., W.L.W. and L.Y.; formal analysis, R.A.H.; investigation, R.A.H.; resources, R.A.H.; data curation, public datasets; writing—original draft preparation, R.A.H.; writing—review and editing, R.A.H., B.W.; visualization, R.A.H.; supervision, B.W.; Project administration, B.W.; funding acquisition, B.W. All authors have read and agreed to the published version of the manuscript.

Funding

This research received no external funding.

Conflicts of Interest

The authors declare no conflict of interest.

References

  1. Ogbuabor, G.; La, R. Human activity recognition for healthcare using smartphones. In Proceedings of the 2018 10th International Conference on Machine Learning and Computing, Macau, China, 26–28 February 2018; pp. 41–46. [Google Scholar]
  2. Niu, W.; Long, J.; Han, D.; Wang, Y.F. Human activity detection and recognition for video surveillance. Prcoceedings of the 2004 IEEE International Conference on Multimedia and Expo (ICME) (IEEE Cat. No. 04TH8763), Taipei, Taiwan, 27–30 June 2004; Volume 1, pp. 719–722. [Google Scholar]
  3. Lee, D.; Helal, S. From activity recognition to situation recognition. In International Conference on Smart Homes and Health Telematics; Springer: Berlin/Heidelberg, Germany, 2013; pp. 245–251. [Google Scholar]
  4. Park, J.; Jang, K.; Yang, S.B. Deep neural networks for activity recognition with multi-sensor data in a smart home. In Proceedings of the Internet of Things (WF-IoT), 2018 IEEE 4th World Forum on Internet of Things, Singapore, 5–8 February 2018; pp. 155–160. [Google Scholar]
  5. Mokhtari, G.; Aminikhanghahi, S.; Zhang, Q.; Cook, D.J. Fall detection in smart home environments using UWB sensors and unsupervised change detection. J. Reliab. Intell. Environ. 2018, 4, 131–139. [Google Scholar] [CrossRef]
  6. Hamad, R.A.; Järpe, E.; Lundström, J. Stability analysis of the t-SNE algorithm for humanactivity pattern data. In Proceedings of the 2018 IEEE International Conference on Systems, Man, and Cybernetics (SMC2018), Miyazaki, Japan, 7–10 October 2018; pp. 1839–1845. [Google Scholar]
  7. Fatima, I.; Fahim, M.; Lee, Y.K.; Lee, S. Analysis and effects of smart home dataset characteristics for daily life activity recognition. J. Supercomput. 2013, 66, 760–780. [Google Scholar] [CrossRef]
  8. Jing, L.; Wang, T.; Zhao, M.; Wang, P. An adaptive multi-sensor data fusion method based on deep convolutional neural networks for fault diagnosis of planetary gearbox. Sensors 2017, 17, 414. [Google Scholar] [CrossRef] [PubMed] [Green Version]
  9. Nweke, H.F.; Teh, Y.W.; Al-Garadi, M.A.; Alo, U.R. Deep learning algorithms for human activity recognition using mobile and wearable sensor networks: State of the art and research challenges. Expert Syst. Appl. 2018, 105, 233–261. [Google Scholar] [CrossRef]
  10. Cao, L.; Wang, Y.; Zhang, B.; Jin, Q.; Vasilakos, A.V. GCHAR: An efficient Group-based Context—Aware human activity recognition on smartphone. J. Parallel Distrib. Comput. 2018, 118, 67–80. [Google Scholar] [CrossRef]
  11. Thai-Nghe, N.; Gantner, Z.; Schmidt-Thieme, L. Cost-sensitive learning methods for imbalanced data. In Proceedings of the 2010 International Joint Conference on Neural Networks (IJCNN), Barcelona, Spain, 18–23 July 2010; pp. 1–8. [Google Scholar]
  12. Sun, Z.; Song, Q.; Zhu, X.; Sun, H.; Xu, B.; Zhou, Y. A novel ensemble method for classifying imbalanced data. Pattern Recognit. 2015, 48, 1623–1637. [Google Scholar] [CrossRef]
  13. Chathuramali, K.M.; Rodrigo, R. Faster human activity recognition with SVM. In Proceedings of the 2012 International Conference on Advances in ICT for Emerging Regions (ICTer), Colombo, Sri Lanka, 12–15 December 2012; pp. 197–203. [Google Scholar]
  14. Lara, O.D.; Labrador, M.A. A survey on human activity recognition using wearable sensors. IEEE Commun. Surv. Tutor. 2013, 15, 1192–1209. [Google Scholar] [CrossRef]
  15. Wang, J.; Chen, Y.; Hao, S.; Peng, X.; Hu, L. Deep learning for sensor-based activity recognition: A survey. Pattern Recognit. Lett. 2019, 119, 3–11. [Google Scholar] [CrossRef] [Green Version]
  16. Li, F.; Shirahama, K.; Nisar, M.A.; Köping, L.; Grzegorzek, M. Comparison of Feature Learning Methods for Human Activity Recognition Using Wearable Sensors. Sensors 2018, 18, 679. [Google Scholar] [CrossRef] [Green Version]
  17. Medina-Quero, J.; Zhang, S.; Nugent, C.; Espinilla, M. Ensemble classifier of long short-term memory with fuzzy temporal windows on binary sensors for activity recognition. Expert Syst. Appl. 2018, 114, 441–453. [Google Scholar] [CrossRef]
  18. Hamad, R.A.; Salguero, A.G.; Bouguelia, M.; Espinilla, M.; Quero, J.M. Efficient activity recognition in smart homes using delayed fuzzy temporal windows on binary sensors. IEEE J. Biomed. Health Inf. 2019, 1. [Google Scholar] [CrossRef]
  19. Yang, J.; Nguyen, M.N.; San, P.P.; Li, X.; Krishnaswamy, S. Deep Convolutional Neural Networks on Multichannel Time Series for Human Activity Recognition. In Proceedings of the Twenty-Fourth International Joint Conference on Artificial Intelligence, Buenos Aires, Argentina, 25–31 July 2015; Volume 15, pp. 3995–4001. [Google Scholar]
  20. Hammerla, N.Y.; Halloran, S.; Ploetz, T. Deep, convolutional, and recurrent models for human activity recognition using wearables. arXiv 2016, arXiv:1604.08880. [Google Scholar]
  21. Bae, S.H.; Choi, I.; Kim, N.S. Acoustic scene classification using parallel combination of LSTM and CNN. In Proceedings of the Detection and Classification of Acoustic Scenes and Events 2016 Workshop (DCASE2016), Budapest, Hungary, 3 September 2016; pp. 11–15. [Google Scholar]
  22. Galar, M.; Fernandez, A.; Barrenechea, E.; Bustince, H.; Herrera, F. A review on ensembles for the class imbalance problem: Bagging-, boosting-, and hybrid-based approaches. IEEE Trans. Syst. Man, Cybern. Part (Appl. Rev.) 2011, 42, 463–484. [Google Scholar] [CrossRef]
  23. Zhou, Z.H. Ensemble Methods: Foundations and Algorithms; CRC Press: Boca Raton, FL, USA, 2012. [Google Scholar]
  24. Japkowicz, N.; Stephen, S. The class imbalance problem: A systematic study. Intell. Data Anal. 2002, 6, 429–449. [Google Scholar] [CrossRef]
  25. Johnson, J.M.; Khoshgoftaar, T.M. Survey on deep learning with class imbalance. J. Big Data 2019, 6, 27. [Google Scholar] [CrossRef]
  26. Lin, T.Y.; Goyal, P.; Girshick, R.; He, K.; Dollár, P. Focal loss for dense object detection. In Proceedings of the IEEE International Conference on Computer Vision, Venice, Italy, 22–29 October 2017; pp. 2980–2988. [Google Scholar]
  27. Khan, S.H.; Hayat, M.; Bennamoun, M.; Sohel, F.A.; Togneri, R. Cost-sensitive learning of deep feature representations from imbalanced data. IEEE Trans. Neural Networks Learn. Syst. 2017, 29, 3573–3587. [Google Scholar]
  28. Huang, C.; Li, Y.; Change Loy, C.; Tang, X. Learning deep representation for imbalanced classification. In Proceedings of the IEEE Conference on Computer Vision and Pattern Recognition, Las Vegas, NV, USA, 30 June 2016; pp. 5375–5384. [Google Scholar]
  29. Nguyen, K.T.; Portet, F.; Garbay, C. Dealing with Imbalanced data sets for Human Activity Recognition using Mobile Phone Sensors. In Proceedings of the 3rd International Workshop on Smart Sensing Systems, Rome, Italy, 25–28 June 2018. [Google Scholar]
  30. Stikic, M.; Huynh, T.; Van Laerhoven, K.; Schiele, B. ADL recognition based on the combination of RFID and accelerometer sensing. In Proceedings of the Second International Conference on Pervasive Computing Technologies for Healthcare, Tampere, Finland, 30 January–1 February 2008; pp. 258–263. [Google Scholar]
  31. Tapia, E.M.; Intille, S.S.; Larson, K. Activity recognition in the home using simple and ubiquitous sensors. In International Conference on Pervasive Computing; Springer: Berlin/Heidelberg, Germany, 2004; pp. 158–175. [Google Scholar]
  32. Yala, N.; Fergani, B.; Fleury, A. Feature extraction for human activity recognition on streaming data. In Proceedings of the International Symposium on Nnovations in Intelligent SysTems and Applications (INISTA), Madrid, Spain, 2–4 September 2015; pp. 1–6. [Google Scholar]
  33. Espinilla, M.; Medina, J.; Hallberg, J.; Nugent, C. A new approach based on temporal sub-windows for online sensor-based activity recognition. J. Ambient. Intell. Humaniz. Comput. 2018, 1–13. [Google Scholar] [CrossRef] [Green Version]
  34. Hochreiter, S.; Schmidhuber, J. Long short-term memory. Neural Comput. 1997, 9, 1735–1780. [Google Scholar] [CrossRef]
  35. Collins, J.; Sohl-Dickstein, J.; Sussillo, D. Capacity and trainability in recurrent neural networks. Stat 2017, 1050, 28. [Google Scholar]
  36. Young, T.; Hazarika, D.; Poria, S.; Cambria, E. Recent trends in deep learning based natural language processing. IEEE Comput. Intell. Mag. 2018, 13, 55–75. [Google Scholar] [CrossRef]
  37. Chen, K.; Zhou, Y.; Dai, F. A LSTM-based method for stock returns prediction: A case study of China stock market. In Proceedings of the 2015 IEEE International Conference on Big Data (Big Data), Santa Clara, CA, USA, 29 October–1 November 2015; pp. 2823–2824. [Google Scholar]
  38. Graves, A.; Jaitly, N.; Mohamed, A.R. Hybrid speech recognition with deep bidirectional LSTM. In Proceedings of the 2013 IEEE Workshop on Automatic Speech Recognition and Understanding, Olomouc, Czech Republic, 8–12 December 2013; pp. 273–278. [Google Scholar]
  39. Singh, D.; Merdivan, E.; Psychoula, I.; Kropf, J.; Hanke, S.; Geist, M.; Holzinger, A. Human activity recognition using recurrent neural networks. In International Cross-Domain Conference for Machine Learning and Knowledge Extraction; Springer: Berlin/Heidelberg, Germany, 2017; pp. 267–274. [Google Scholar]
  40. Murad, A.; Pyun, J.Y. Deep recurrent neural networks for human activity recognition. Sensors 2017, 17, 2556. [Google Scholar] [CrossRef] [PubMed] [Green Version]
  41. Hamad, R.A.; Kimura, M.; Lundström, J. Efficacy of Imbalanced Data Handling Methods on Deep Learning for Smart Homes Environments. SN Comput. Sci. 2020, 1, 1–10. [Google Scholar] [CrossRef]
  42. Yoo, H.J. Deep convolution neural networks in computer vision: A review. IEIE Trans. Smart Process. Comput. 2015, 4, 35–43. [Google Scholar] [CrossRef]
  43. Moya Rueda, F.; Grzeszick, R.; Fink, G.; Feldhorst, S.; ten Hompel, M. Convolutional neural networks for human activity recognition using body-worn sensors. Informatics 2018, 5, 26. [Google Scholar] [CrossRef] [Green Version]
  44. Ordóñez, F.J.; Roggen, D. Deep convolutional and lstm recurrent neural networks for multimodal wearable activity recognition. Sensors 2016, 16, 115. [Google Scholar] [CrossRef] [PubMed] [Green Version]
  45. Guan, Y.; Plötz, T. Ensembles of deep lstm learners for activity recognition using wearables. Proc. Acm. Int. Mob. Wearable Ubiquitous Technol. 2017, 1, 1–28. [Google Scholar] [CrossRef] [Green Version]
  46. Medina-Quero, J.; Orr, C.; Zang, S.; Nugent, C.; Salguero, A.; Espinilla, M. Real-time Recognition of Interleaved Activities Based on Ensemble Classifier of Long Short-Term Memory with Fuzzy Temporal Windows. Multidiscip. Digit. Publ. Inst. Proc. 2018, 2, 1225. [Google Scholar]
  47. Ordóñez Morales, F.J.; Toledo Heras, M.P.d.; Sanchis de Miguel, M.A. Activity Recognition Using Hybrid Generative/Discriminative Models on Home Environments Using Binary Sensors. Sensors 2013, 13, 5460–5477. [Google Scholar] [CrossRef]
  48. Van Kasteren, T.L.; Englebienne, G.; Kröse, B.J. Human activity recognition from wireless sensor network data: Benchmark and software. In Activity Recognition in Pervasive Intelligent Environments; Springer: Berlin/Heidelberg, Germany, 2011; pp. 165–186. [Google Scholar]
  49. Kasteren, T.; Englebienne, G.; Kröse, B. An activity monitoring system for elderly care using generative and discriminative models. Pers. Ubiquitous Comput. 2010, 14, 489–498. [Google Scholar] [CrossRef] [Green Version]
  50. Devarakonda, A.; Naumov, M.; Garland, M. AdaBatch: Adaptive Batch Sizes for Training Deep Neural Networks. arXiv 2017, arXiv:1712.02029. [Google Scholar]
  51. Srivastava, N.; Hinton, G.; Krizhevsky, A.; Sutskever, I.; Salakhutdinov, R. Dropout: A simple way to prevent neural networks from overfitting. J. Mach. Learn. Res. 2014, 15, 1929–1958. [Google Scholar]
  52. Van Kasteren, T.; Noulas, A.; Englebienne, G.; Kröse, B. Accurate activity recognition in a home setting. In Proceedings of the 10th international conference on Ubiquitous computing, ACM, Seoul, Korea, 21–24 September 2008; pp. 1–9. [Google Scholar]
  53. Singh, D.; Merdivan, E.; Hanke, S.; Kropf, J.; Geist, M.; Holzinger, A. Convolutional and recurrent neural networks for activity recognition in smart environment. In Towards Integrative Machine Learning and Knowledge Extraction; Springer: Berlin/Heidelberg, Germany, 2017; pp. 194–205. [Google Scholar]
  54. Sun, Y.; Kamel, M.S.; Wong, A.K.; Wang, Y. Cost-sensitive boosting for classification of imbalanced data. Pattern Recognit. 2007, 40, 3358–3378. [Google Scholar] [CrossRef]
  55. He, H.; Garcia, E.A. Learning from imbalanced data. IEEE Trans. Knowl. Data Eng. 2009, 21, 1263–1284. [Google Scholar]
  56. López Medina, M.Á.; Espinilla, M.; Paggeti, C.; Medina Quero, J. Activity Recognition for IoT Devices Using Fuzzy Spatio-Temporal Features as Environmental Sensor Fusion. Sensors 2019, 19, 3512. [Google Scholar] [CrossRef] [PubMed] [Green Version]
  57. Chawla, N.V.; Bowyer, K.W.; Hall, L.O.; Kegelmeyer, W.P. SMOTE: Synthetic minority over-sampling technique. J. Artif. Intell. Res. 2002, 16, 321–357. [Google Scholar] [CrossRef]
  58. Breiman, L. Random forests. Mach. Learn. 2001, 45, 5–32. [Google Scholar] [CrossRef] [Green Version]
  59. Fisher, A.; Rudin, C.; Dominici, F. All Models are Wrong, but Many are Useful: Learning a Variable’s Importance by Studying an Entire Class of Prediction Models Simultaneously. J. Mach. Learn. Res. 2019, 20, 1–81. [Google Scholar]
  60. Molnar, C. Interpretable Machine Learning. 2020. Available online: https://leanpub.com/interpretable-machine-learning (accessed on 14 May 2020).
  61. Pedregosa, F.; Varoquaux, G.; Gramfort, A.; Michel, V.; Thirion, B.; Grisel, O.; Blondel, M.; Prettenhofer, P.; Weiss, R.; Dubourg, V.; et al. Scikit-learn: Machine Learning in Python. J. Mach. Learn. Res. 2011, 12, 2825–2830. [Google Scholar]
Figure 1. Single long short-term memory (LSTM) cell.
Applsci 10 05293 g001
Figure 2. Architecture of the LSTM model for human activity recognition.
Applsci 10 05293 g002
Figure 3. Architecture of the one dimensional convolutional neural networks (1D CNN) model for human activity recognition.
Applsci 10 05293 g003
Figure 4. Architecture of the Hybrid 1D CNN + LSTM model for human activity recognition.
Applsci 10 05293 g004
Figure 5. Architecture of the proposed joint learning of temporal model for human activity recognition.
Applsci 10 05293 g005
Figure 6. Example of multiple incremental fuzzy temporal windows to segment raw sensors data.
Applsci 10 05293 g006
Figure 7. F1-score results of only minority classes for Kasteren Home C.
Applsci 10 05293 g007
Figure 8. F1-score results of only minority classes.
Applsci 10 05293 g008
Figure 9. Joint learning compared with joint LSTM+LSTM and Joint 1D CNN+1D CNN.
Applsci 10 05293 g009
Figure 10. Results of mean F1-score for feature permutation of 12 sensors with N = 12 runs from Ordonez Home A.
Applsci 10 05293 g010
Figure 11. Results of mean F1-score for feature permutation of 12 sensors with N = 12 runs from Ordonez Home B.
Applsci 10 05293 g011
Table 1. Details of the datasets.
Ordonez-Home AOrdonez-Home BKastern-Home AKastern-Home BKastern-Home C
SettingHomeHomeApartmentApartmentHouse
Rooms45326
Duration14 days21 days25 days14 days19 days
Sensors1212142321
Activities1011101316
Age--262857
Gender--MaleMaleMale
Table 2. Frequency of activities in the Ordonez datasets.
ActivityHome AHome B
Dinner-120
Snack6408
Showering9675
Grooming98427
Breakfast120309
Toileting138167
Lunch315395
Idle15983553
Leaving16645268
Sleeping786610763
Spare Time/ TV85558984
Total20,35830,469
Table 3. Frequency of activities in the Kasteren datasets.
ActivityHome CActivityHome BActivityHome A
Eating345Brush_teeth25Idle7888
Idle5883Eat_brunch132Brush_teeth21
Brush_teeth75Eat_dinner46Get_drink21
Get_dressed70Get_a_drink6Get_snack24
Get_drink20Get_dressed27Go_to_bed11,599
Get_snack8Go_to_bed6050Leave_house19,693
Go_to_bed7395Idle20,049Prepare_Breakfast59
Leave_house11,915Leaving_the_house12,223Prepare_Dinner325
Prepare_Breakfast78Prepare_brunch82Take_shower221
prepare_Dinner300Prepare_dinner87Use_toilet154
Prepare_Lunch58Take_shower109--
Shave57Use_toilet39
Take_medication6Wash_dishes25--
Take_shower184 --
Use_toilet_downstairs57----
Use_toilet_upstairs35----
Total26,486Total38,900Total40,005
Table 4. F1-score results of Ordonez Smart home datasets.
ActivitiesHome AHome B
LSTM1D CNN1D CNN+
LSTM
Joint
Learning
LSTM1D CNN1D CNN+
LSTM
Joint
Learning
Breakfast82.2778.4386.7987.0578.6577.1073.9182.74
Grooming62.0646.6657.1470.9662.9959.6753.6364.08
Leaving89.9088.6088.3991.7396.4397.3196.4898.19
Lunch95.5095.4594.5798.3186.4584.4779.7688.13
Showering75.8680.0064.0082.3575.0080.0051.8182.71
Sleeping97.2397.2397.1399.6699.4799.4999.2699.62
Snack66.6666.6666.6673.3270.3768.9662.1173.19
Spare_Time/TV97.7995.9397.2898.9795.8194.5195.5196.60
Toileting72.2169.2369.8475.2318.510.0718.4631.18
Dinner----40.0034.2829.4150.27
Total82.1679.7980.2086.3972.3669.5966.0376.51
Table 5. F1-score results of Kasteren Smart home datasets.
(a) Home A
ActivitiesLSTM1D CNN1D CNN+
LSTM
Joint
Learning
Brush_teeth51.0922.0350.0056.32
Get_drink40.0022.2040.0147.11
Get_Snack30.1422.2228.5743.36
Go_to_bed88.2088.1887.9689.96
Leave_house99.5399.7599.4599.88
Prepare_breakfast78.0072.0075.0079.19
Prepare_Dinner88.8894.0196.5596.73
Take_shower85.2479.4580.0086.31
Use_toilet60.8656.6057.6963.33
Total69.1061.8268.0773.54
(b) Home B
ActivitiesLSTM1D CNN1D CNN+
LSTM
Joint
learning
Brush_teeth0.000.0016.6628.57
Eat_brunch91.4289.2891.2292.12
Eat_dinner88.0088.8883.3388.91
Get_a_drink0.000.0000.0040.00
Go_to_bed99.0899.2099.2899.66
Leaving_the_house95.790.8988.0998.72
Prepare_brunch84.6578.5782.7587.80
Get_dressed26.660.0015.3849.63
Prepare_dinner96.3696.9690.9097.11
Take_shower83.6374.5080.0084.93
Use_toilet40.0025.0016.6651.33
Wash_dishes74.3372.7266.6677.72
Total65.4059.6661.7474.70
Table 6. F1-score results of Kasteren home C datasets.
ActivitiesLSTM1D CNN1D CNN+LSTMJoint Learning
Eating74.2880.0080.0082.70
Brush_teeth47.6158.3350.0062.50
Get_dressed48.4853.3332.8754.67
Get_drink00.000.000.0032.85
Get_snack66.6630.0066.6668.00
Go_to_bed93.6594.6891.4894.86
Leave_house92.8691.8191.6498.96
Prepare_Breakfast75.0072.2236.3676.75
Prepare_Dinner75.5580.7054.4483.69
prepare_Lunch70.0072.7272.7274.35
Use_Toilet_Downstairs15.380.0005.2622.22
Use_toilet_upstairs13.330.0016.6618.38
Shave66.6670.0044.4478.88
Take_medication0.000.000.0028.42
Take_shower70.0072.1370.9674.65
Total53.9651.6847.5664.46
Table 7. Permutation feature importance of Ordonez Home A.
Sensors_FeatureFeature ImportanceF1-Score of N Runs
Type_Location_Place of SensorsLSTMRank1D CNNRankMean ± SD of LSTMMean ± SD of CNN
PIR_Shower_Bathroom13.13712.43869.02 ± 2.6367.46 ± 1.30
PIR_Basin_Bathroom13.36511.261068.79 ± 2.1868.63 ±3.35
PIR_Cooktop_Kitchen13.79110.631268.36 ± 2.7169.26 ± 4.58
Magnetic_Main door_Entrance12.571013.50269.58 ± 3.1766.40 ± 2.93
Magnetic_Fridge_Kitchen13.72212.67668.44 ± 2.9667.22 ± 1.53
Magnetic_Cabinet_Bathroom13.17613.55168.98 ± 5.0466.34 ± 2.82
Magnetic_Cupboard_Kitchen12.551111.99969.60 ± 2.1467.90 ± 2.25
Electric_Microwave_Kitchen12.251212.98369.90 ± 2.6066.91 ± 1.94
Electric_Toaster_Kitchen12.81812.83569.34 ± 2.4367.06 ± 3.35
Pressure_Bed_Bedroom13.48410.961168.67 ± 3.2168.94 ± 4.04
Pressure_Seat_Living13.62312.55768.53 ± 3.7767.34 ± 4.10
Flush_Toilet_Bathroom12.74912.86469.41 ± 2.1067.03 ± 1.55
Table 8. Permutation feature importance of Ordonez Home B.
Sensors_FeatureFeature ImportanceF1-Score of N Runs
Type_Location_Place of SensorsLSTMRank1D CNNRankMean ± SD of LSTMMean ± SD of CNN
PIR_Shower_ Bathroom9.5627.62962.79 ± 1.9561.96 ± 1.25
PIR_Basin_Bathroom11.6215.661160.73 ± 1.8063.92 ± 1.61
PIR_Door_Kitchen8.53910.28363.82 ± 1.7059.30 ± 1.26
PIR_Door_Bedroom8.10116.811064.25 ± 1.4862.77± 1.35
PIR_Door_Living8.6579.39763.70 ± 1.4860.19 ± 1.63
Magnetic_ Maindoor_Entrance8.12109.60664.23 ± 1.9059.98 ± 1.41
Magnetic_Fridge_Kitchen6.651211.43265.70 ± 1.6858.15 ± 1.26
Magnetic_Cupboard_Kitchen9.0655.031263.29 ± 1.7864.55 ± 1.05
Electric_Microwave_Kitchen8.71612.41163.64 ± 1.3457.17 ± 1.90
Pressure_Bed_Bedroom8.6389.68563.72 ± 1.2459.90 ± 2.13
Pressure_Seat_Living9.40310.20462.95 ± 2.1859.38 ± 1.15
Flush_Toilet_Bathroom9.3349.35863.02 ± 2.7060.24 ± 2.38

