1. Introduction
Cerium (IV) dioxide (ceria) is one of the most common forms of cerium and it has a wide range of uses in applications mostly for its physical and mechanical properties. It is, for example, used as a polishing agent, an additive for heat-resisting alloys and in ceramics [
1,
2]. It is also added to thorium oxide gas lantern mantles. Without the presence of ceria, the flame would be practically colorless with minimal luminosity [
3]. Another interesting application is its usage as a surrogate material for nuclear fuels [
4].
On the other side, ceria nanoparticles are well known for their catalytic properties, which are widely used as an electrolyte material [
5], in solid oxide fuel cells [
6], in solar cells [
7], for fuel oxidation [
8], as automotive three-way catalysts to oxidize exhaust gases [
9] and as part of composite materials [
10]. Recently, lots of studies have also reported seeing the potential for usage of ceria nanoparticles in biotechnology, environmental chemistry and medicine [
11,
12].
Such a wide field of applications goes hand in hand with ceria nanoparticles’ exceptional redox properties, which are mainly granted by the very fast redox-cycling between (3+) and (4+) states of cerium [
13]. This cycling is caused by many oxygen vacancies that occur exclusively on the surface of nanoparticles, and the occurrence of these vacancies is not random [
14]. The most stable vacancies are located at the (111), (110) and (310) crystal planes, whereas vacancies occurring in the bulk form are unstable [
15]. The more the nanoparticle’s crystallite size decreases, the more oxygen vacancies occur [
16]. This undoubtedly has an impact on the nanoparticles’ properties, which are therefore mainly controlled by the crystallite size of the nanoparticles and by the oxidation state of the cerium [
17]. Precise control over the crystallite size of the ceria nanoparticles led us to the synthesis of a new, highly specifically working catalyst with unique properties [
18].
Vast numbers of papers have been published referring to nanoparticle synthesis of ceria and other nanoparticles in general. The crystallite size of the nanoparticles can be modified both during and after synthesis. A dominant synthetic route in the case of the ceria nanoparticles is hydrothermal synthesis [
19]. This method can be modified by e.g., use of different solvents [
20] at different temperatures [
21], by ultrasound [
22], by use of various atmospheres [
23] or by irradiation [
24,
25]. Methods having the most significant impact on the crystallite size of already synthesized nanoparticles are, in general, based on milling [
26,
27]. In this study, the modification of ceria nanoparticles’ crystallite sizes was achieved using thermal treatment, and the as-prepared nanoparticles with different particle sizes were analyzed using a broad spectrum of analytic techniques. Because immobilization through thermal treatment of these materials is crucial for possible future applications, nanoparticles of various sizes were also examined for the catalytic decomposition of selected chlorinated phenols.
2. Materials and Methods
Ammonium hydroxide and cerium sulfate tetrahydrate were both of analytical grade purity (p.a.) and purchased from PENTA chemicals. 2,4,6-trichlorophenol of 98% purity was purchased from Sigma-Aldrich.
Ceria nanoparticles used for all experiments were prepared via a fast and simple precipitation method, where an aqueous solution of cerium (IV) sulfate and an ammonium water solution reacted [
28]. Firstly, a saturated solution of cerium (IV) sulfate was prepared, which equaled the ratio of 6.5 g of cerium (IV) sulfate tetrahydrate to 10 g of distilled water. For the precipitation, a 25% aqueous ammonium solution was used, which was added dropwise until it reached a slightly alkaline environment. The formed suspension was washed multiple times with distilled water for the removal of ammonium sulfate byproduct. After having the nanoparticles washed, the centrifugation process was applied to remove the vast majority of the water and to hasten the drying process. After having the nanoparticles centrifuged, the nanoparticles were dried in a vacuum dryer at 35 °C at 0.2 atm.
Alumina crucibles were used for the thermal treatment experiment. Each crucible was filled with approximately 200 mg of ceria nanoparticles. The heating of the samples was performed in a furnace with a static air atmosphere and a heating rate of 10 °C/min. Target temperatures were as follows: 300 °C, 600 °C, 900 °C and 1100 °C. When the final temperature was reached, each sample was taken out of the furnace and cooled rapidly to room temperature. Samples were termed according to their final temperatures as TT-300, TT-600, TT-900, and TT-1100. The nontreated sample (i.e., the reference sample) of the initial nanoparticles was termed TT-25.
Immobilization of ceria nanoparticles by the thermal treatment was demonstrated by attaching the same dose of non-treated ceria nanoparticles in the 5% ethanol dispersion to the roughened silica glass and alumina underlays respectively, with subsequent air drying. In order to create an immobilized layer, the samples were heated in a furnace with a static air atmosphere at a heating rate of 10 °C/min to the final temperature 1100 °C.
The samples were then characterized by XRD, which was performed at room temperature using the Bruker 2D Phaser powder diffractometer with Bragg–Brentano parafocusing geometry, equipped with a Co lamp generating λ = 0.1789 nm, and the setup used U = 40 kV, I = 40 mA. The data were scanned over the angular range of 10–80° (2θ) with a step size of 0.019° (2θ). Panalytical X´Pert HighScore Plus software was used for XRD data analysis and for the calculations of nanoparticle sizes using the Debye–Scherrer calculator. The diffraction patterns were processed without background subtraction.
High-resolution transmission electron microscopy (HR-TEM) was performed using an EFTEM Jeol 2200 FS microscope (Jeol, Japan). A 200 kV acceleration voltage was used for measurement. Sample preparation was attained by drop-casting the suspension (1 mg mL−1 in water) on a TEM grid (Cu, 200 mesh, Formvar/carbon) and drying it at 50 °C for 12 h. Structural characteristics were obtained from selected area electron diffraction (SAED).
The Brunauer–Emmett–Teller (BET) analysis of specific surfaces was performed using the NOVAtouch LX2 (Quantachrome Instruments) sorption analyzer. All samples were outgassed for 10 h at 100 °C under a high vacuum. A nitrogen-cooled (77 K) detector was used for evaluation of the results using BET analysis and Kelvin equations. The Quantachrome software was used for the evaluation of measured data and for the determination of the surface area.
The morphology was investigated using SEM with an FEG electron source (a Tescan Lyra dual-beam microscope). To conduct the measurements, all samples were placed on carbon conductive tape. Each measurement was carried out using a 10 kV electron beam. Elemental composition and mapping were measured by an EDS analyzer (X-MaxN) with a 20 mm2 SDD detector (Oxford instruments) and AZtecEnergy software. For the purposes of SEM and EDS measurements, the ceria layers on both the silicon glass and the alumina ceramics were coated by 5 nm of Au.
Experiments assessing the catalytic activity of the nanoparticles were performed on a 2,4,6-trichlorophenol aqueous solution, which was measured with an Avantes AvaSpec UV–VIS spectroscope. For the experiment, 60 mg of sample TT-25, TT-600 and TT-1100 were put into three vials, and 10 mL of 9.5 × 10⁻⁴ mol/L concentrated 2,4,6-trichlorophenol (TCP) aqueous solution was then added to each. The light source provided a combination of both deuterium and halogen discharge tubes, which covered wavelengths from 180 nm to 880 nm. All measurements were carried out in a 0.5 cm infrasil cuvette, and for the evaluation of data, Avasoft 8.2 software was used.
The thermal behavior was analyzed by simultaneous thermal analysis (STA). The DTA and TG curves were recorded simultaneously on a Linseis STA PT1600 apparatus at a heating rate of 10 °C·min−1 in a dynamic air atmosphere (50 mL·min−1).
3. Results and Discussion
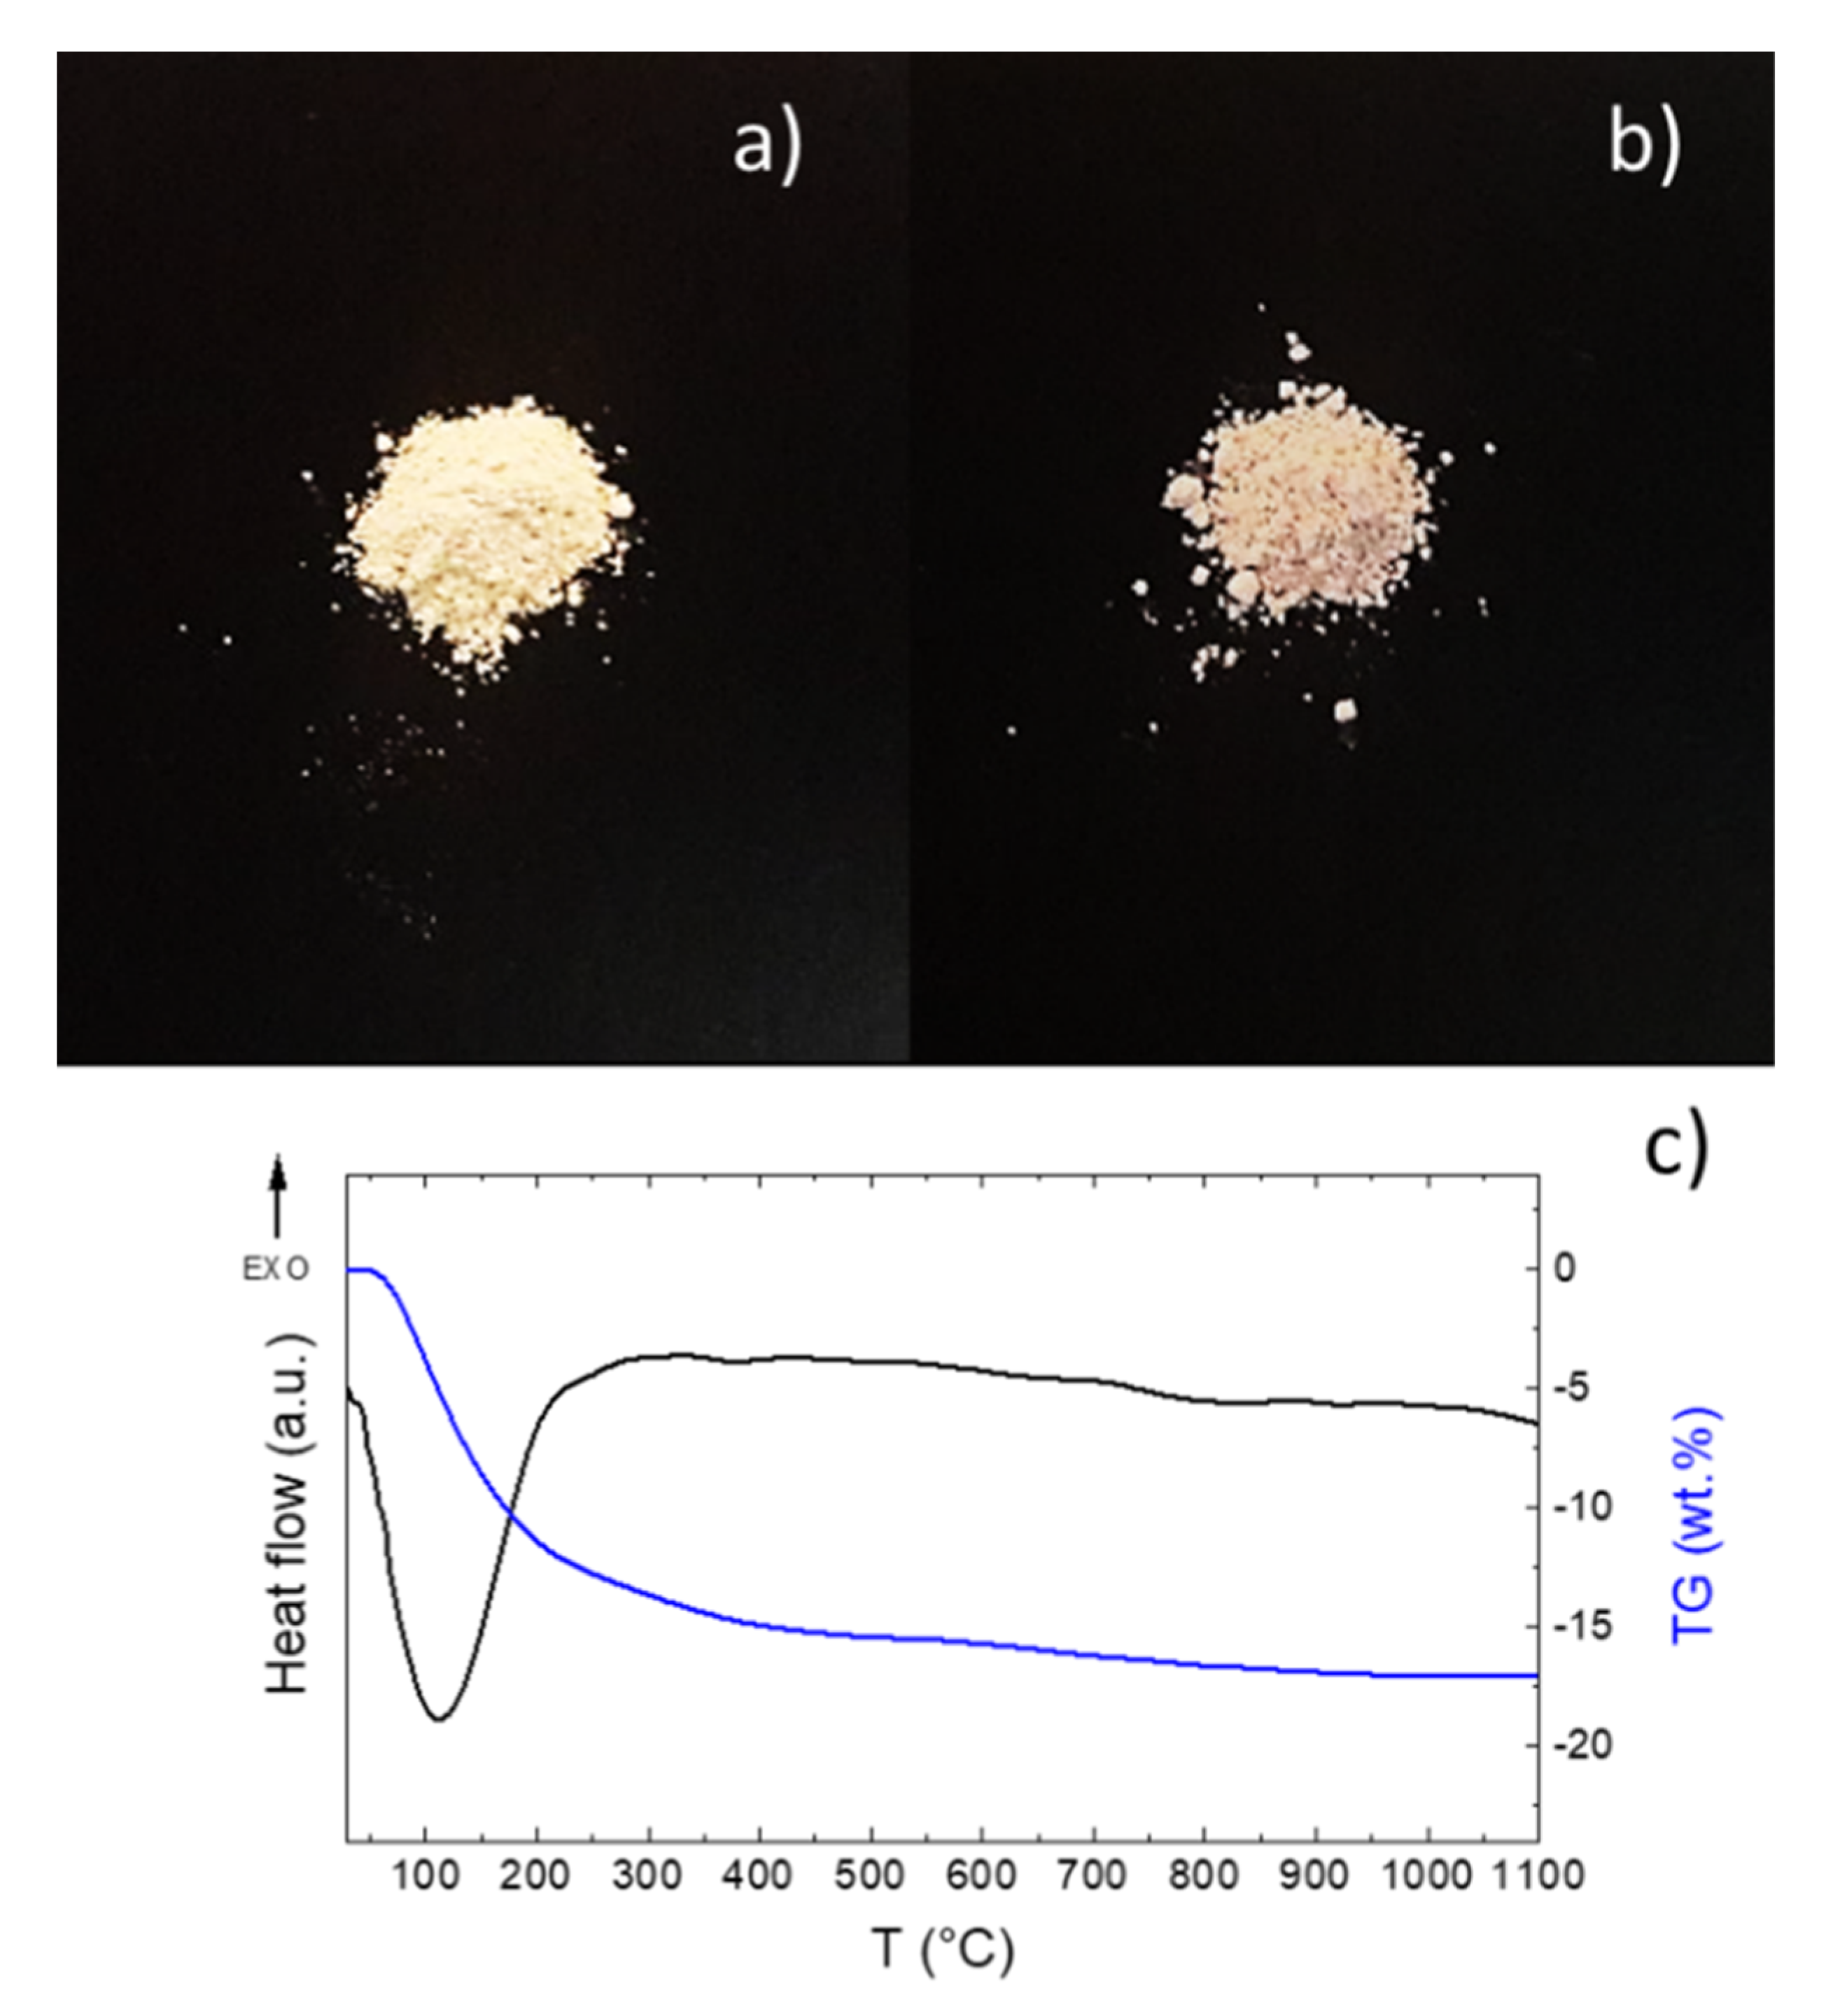
Dry ceria nanoparticles synthesized via the precipitation method can be seen in
Figure 1a. Such nanoparticles were used as initial material for the thermal treatment method. These nanoparticles have a pale yellow color, which is distinctive for nanocrystalline cerium dioxide with a hydrated surface. Performance of the thermal treatment method led to both crystallite size changes and dehydration of the nanoparticles. Both of these effects had a major impact on the nanoparticles’ color. The dehydration had a major impact at the beginning of the thermal treatment, which is documented in the STA measurements shown in
Figure 1c. Based on the STA analysis, it was proved that nanocrystalline CeO
2 contained approximately 17 wt.% of water. The dehydration process ended at approximately 300 °C, as can be seen from both the DTA and TG curves. Due to this fact, it is reasonable to prepare the first sample at 300 °C and the remaining samples at higher temperatures.
No color change could be observed when comparing the thermally treated samples; however, as is apparent from
Figure 1, the nontreated sample was notably different from the heated ones. Due to the dehydration, the samples first turned brighter while, at higher temperatures, the effect of the crystallite growth turned the color to slightly pink. A summary of all prepared samples can be seen in
Table 1.
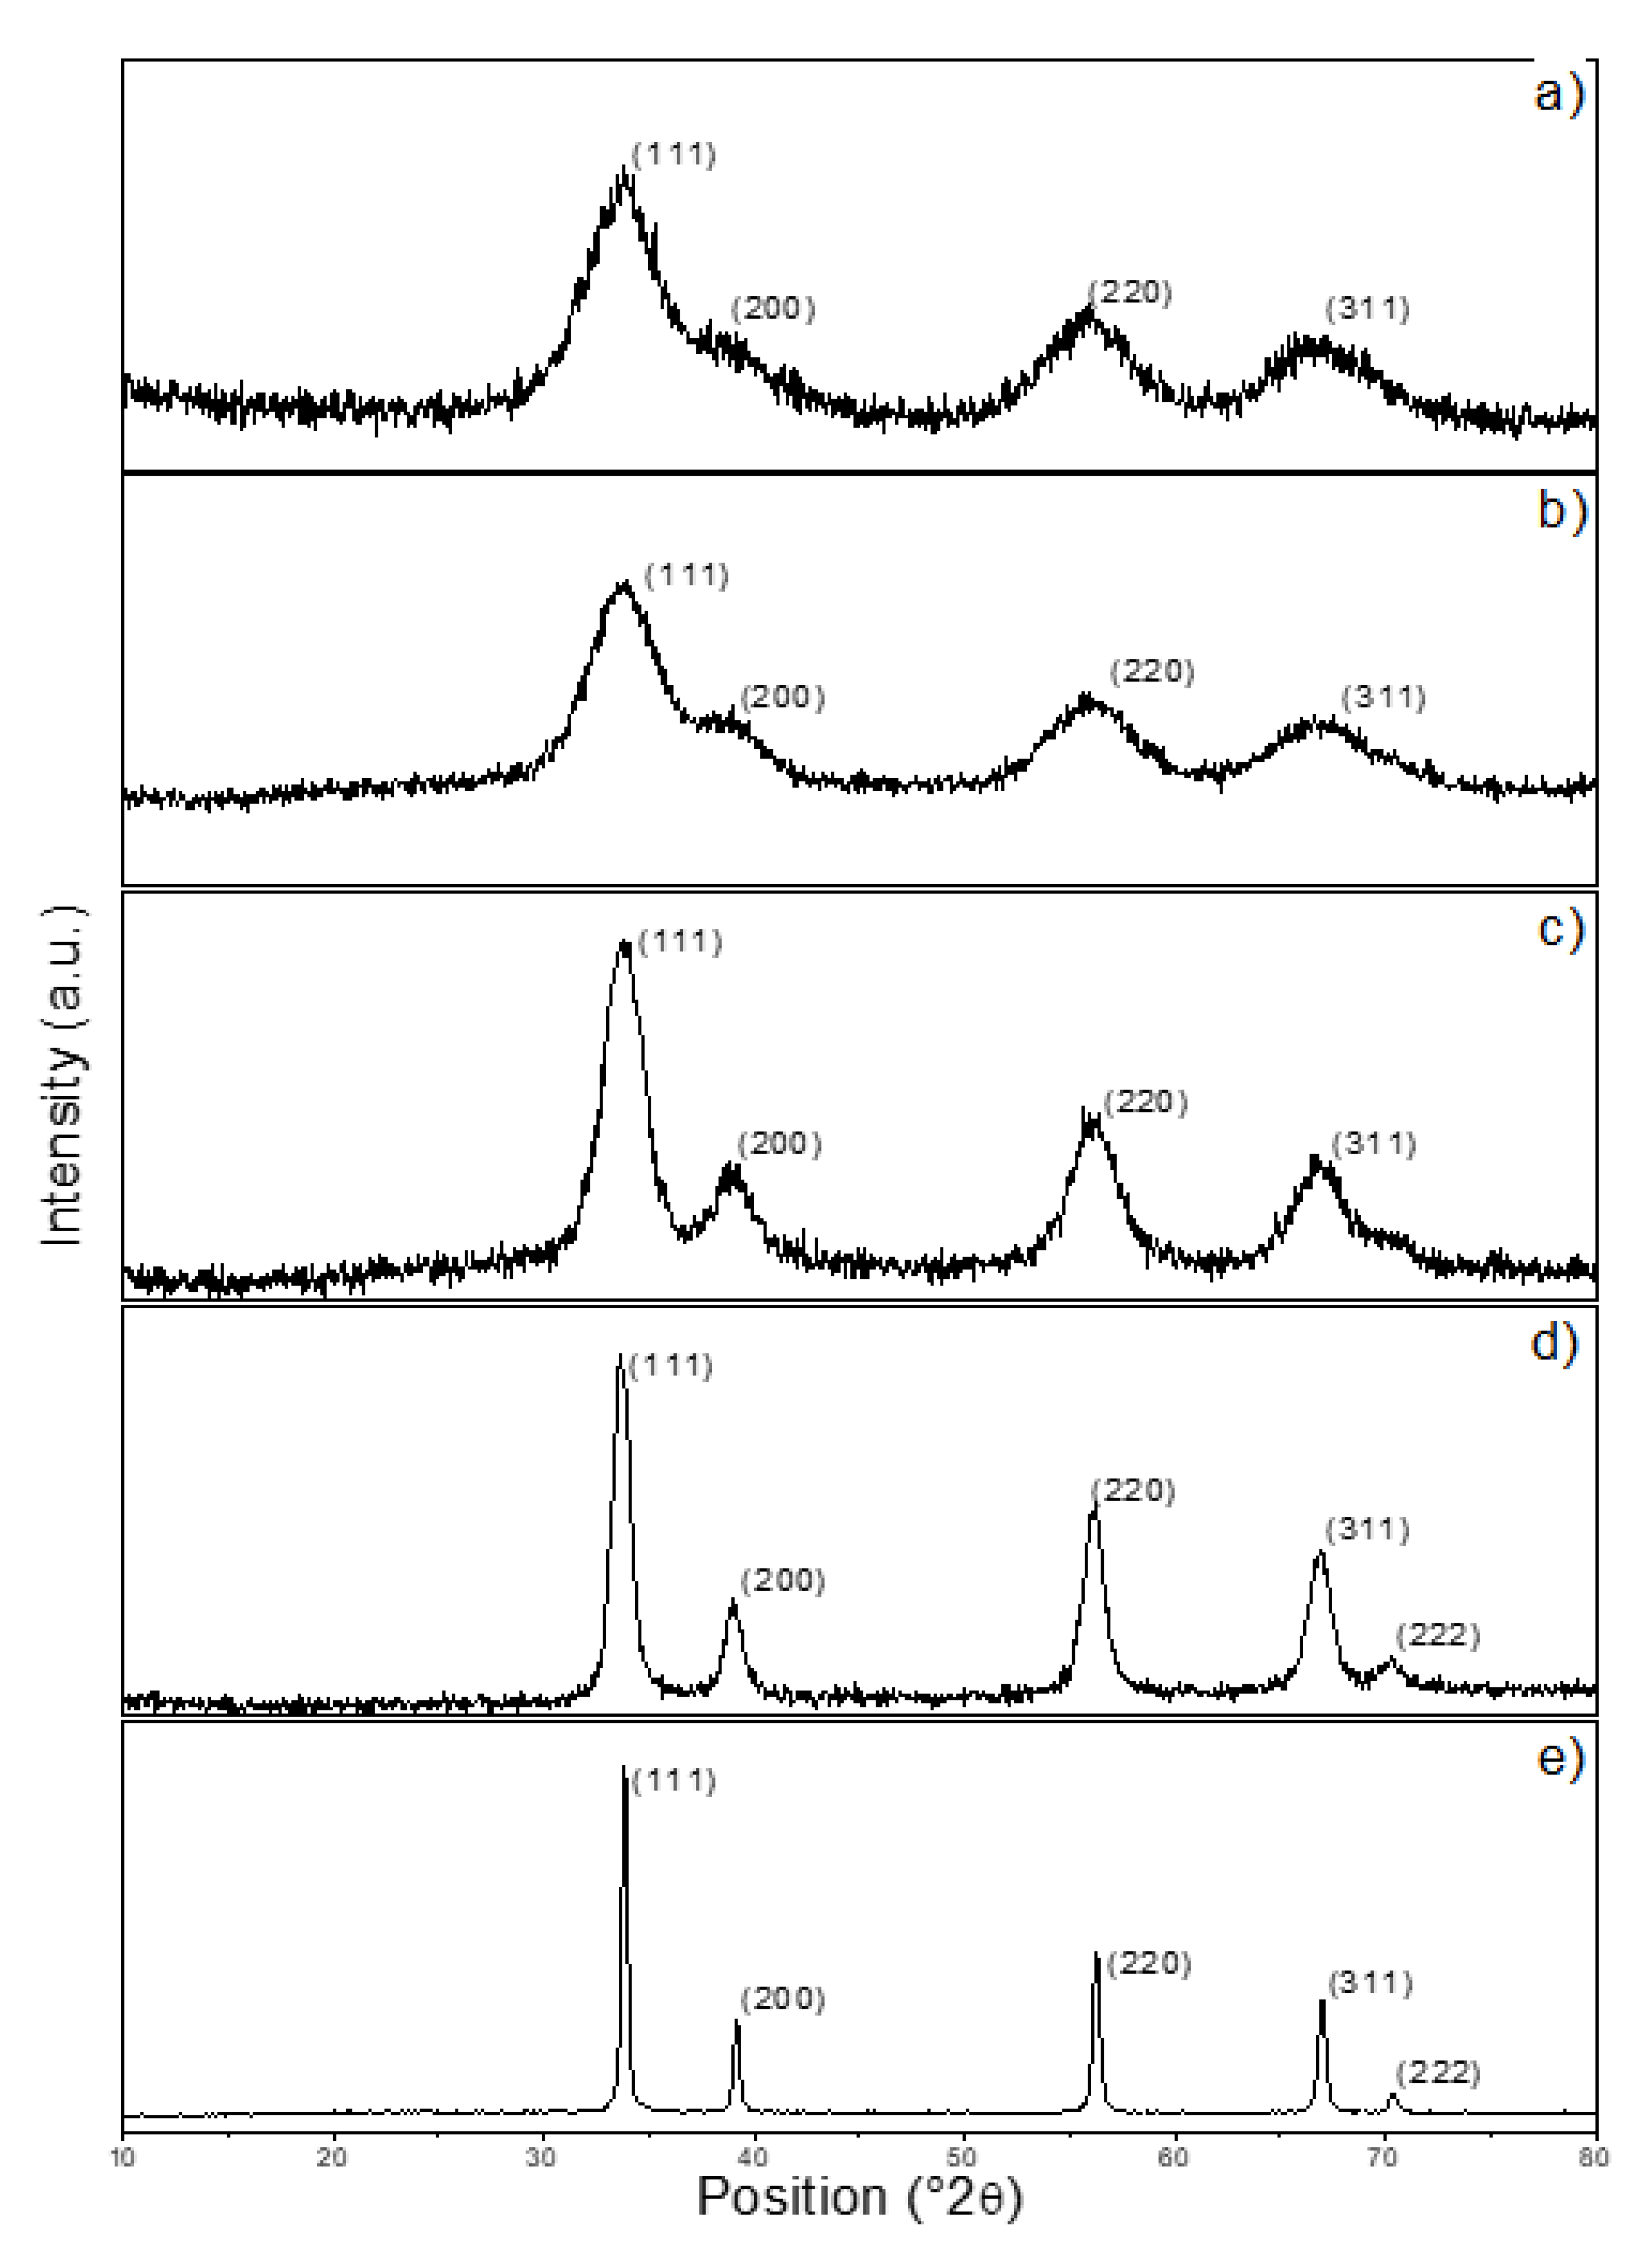
The diffraction pattern of the precipitated ceria is shown in
Figure 2a. The diffraction pattern corresponded with ICDD 04-013-9853 (cubic structure, space group Fm-3m) and the ceria was in the form of a fluorite structure, as expected. There was apparently no or only a low amount of the amorphous phase left after the processing of the precipitated sample (
Figure 2a). According to the Scherrer equation, the crystallite size was approximately 18 Å for the (111) crystallographic plane. Let us note that the approximate crystallite size was calculated as an average of the values obtained for the individual crystal planes. The diffraction on the (111) plane was the most significant and hence the most relevant. It is essential to mention that the calculated results can be affected by some error, especially for those crystallographic planes whose reflections overlapped. The diffractions belonging to the (220) and (311) planes were clearly recognizable, but no more reflections could be seen due to the very small particle sizes. For sample TT-300 (
Figure 2b), there were no significant changes in comparison to the non-treated sample, TT-25. According to the estimation made by the Scherrer equation, the average crystallite size was around 22 Å. The average crystallite size of sample TT-600 (
Figure 2c) reached 35 Å. We saw a new peak at approximately 2θ = 70°, which was attributed to the (222) plane. The diffraction pattern of sample TT-900 is shown in
Figure 2d. Here, the crystallite size value increased to 81 Å. The last sample, TT-1100, is shown in
Figure 2e. The final size of the TT-1100 crystallites was 358 Å.
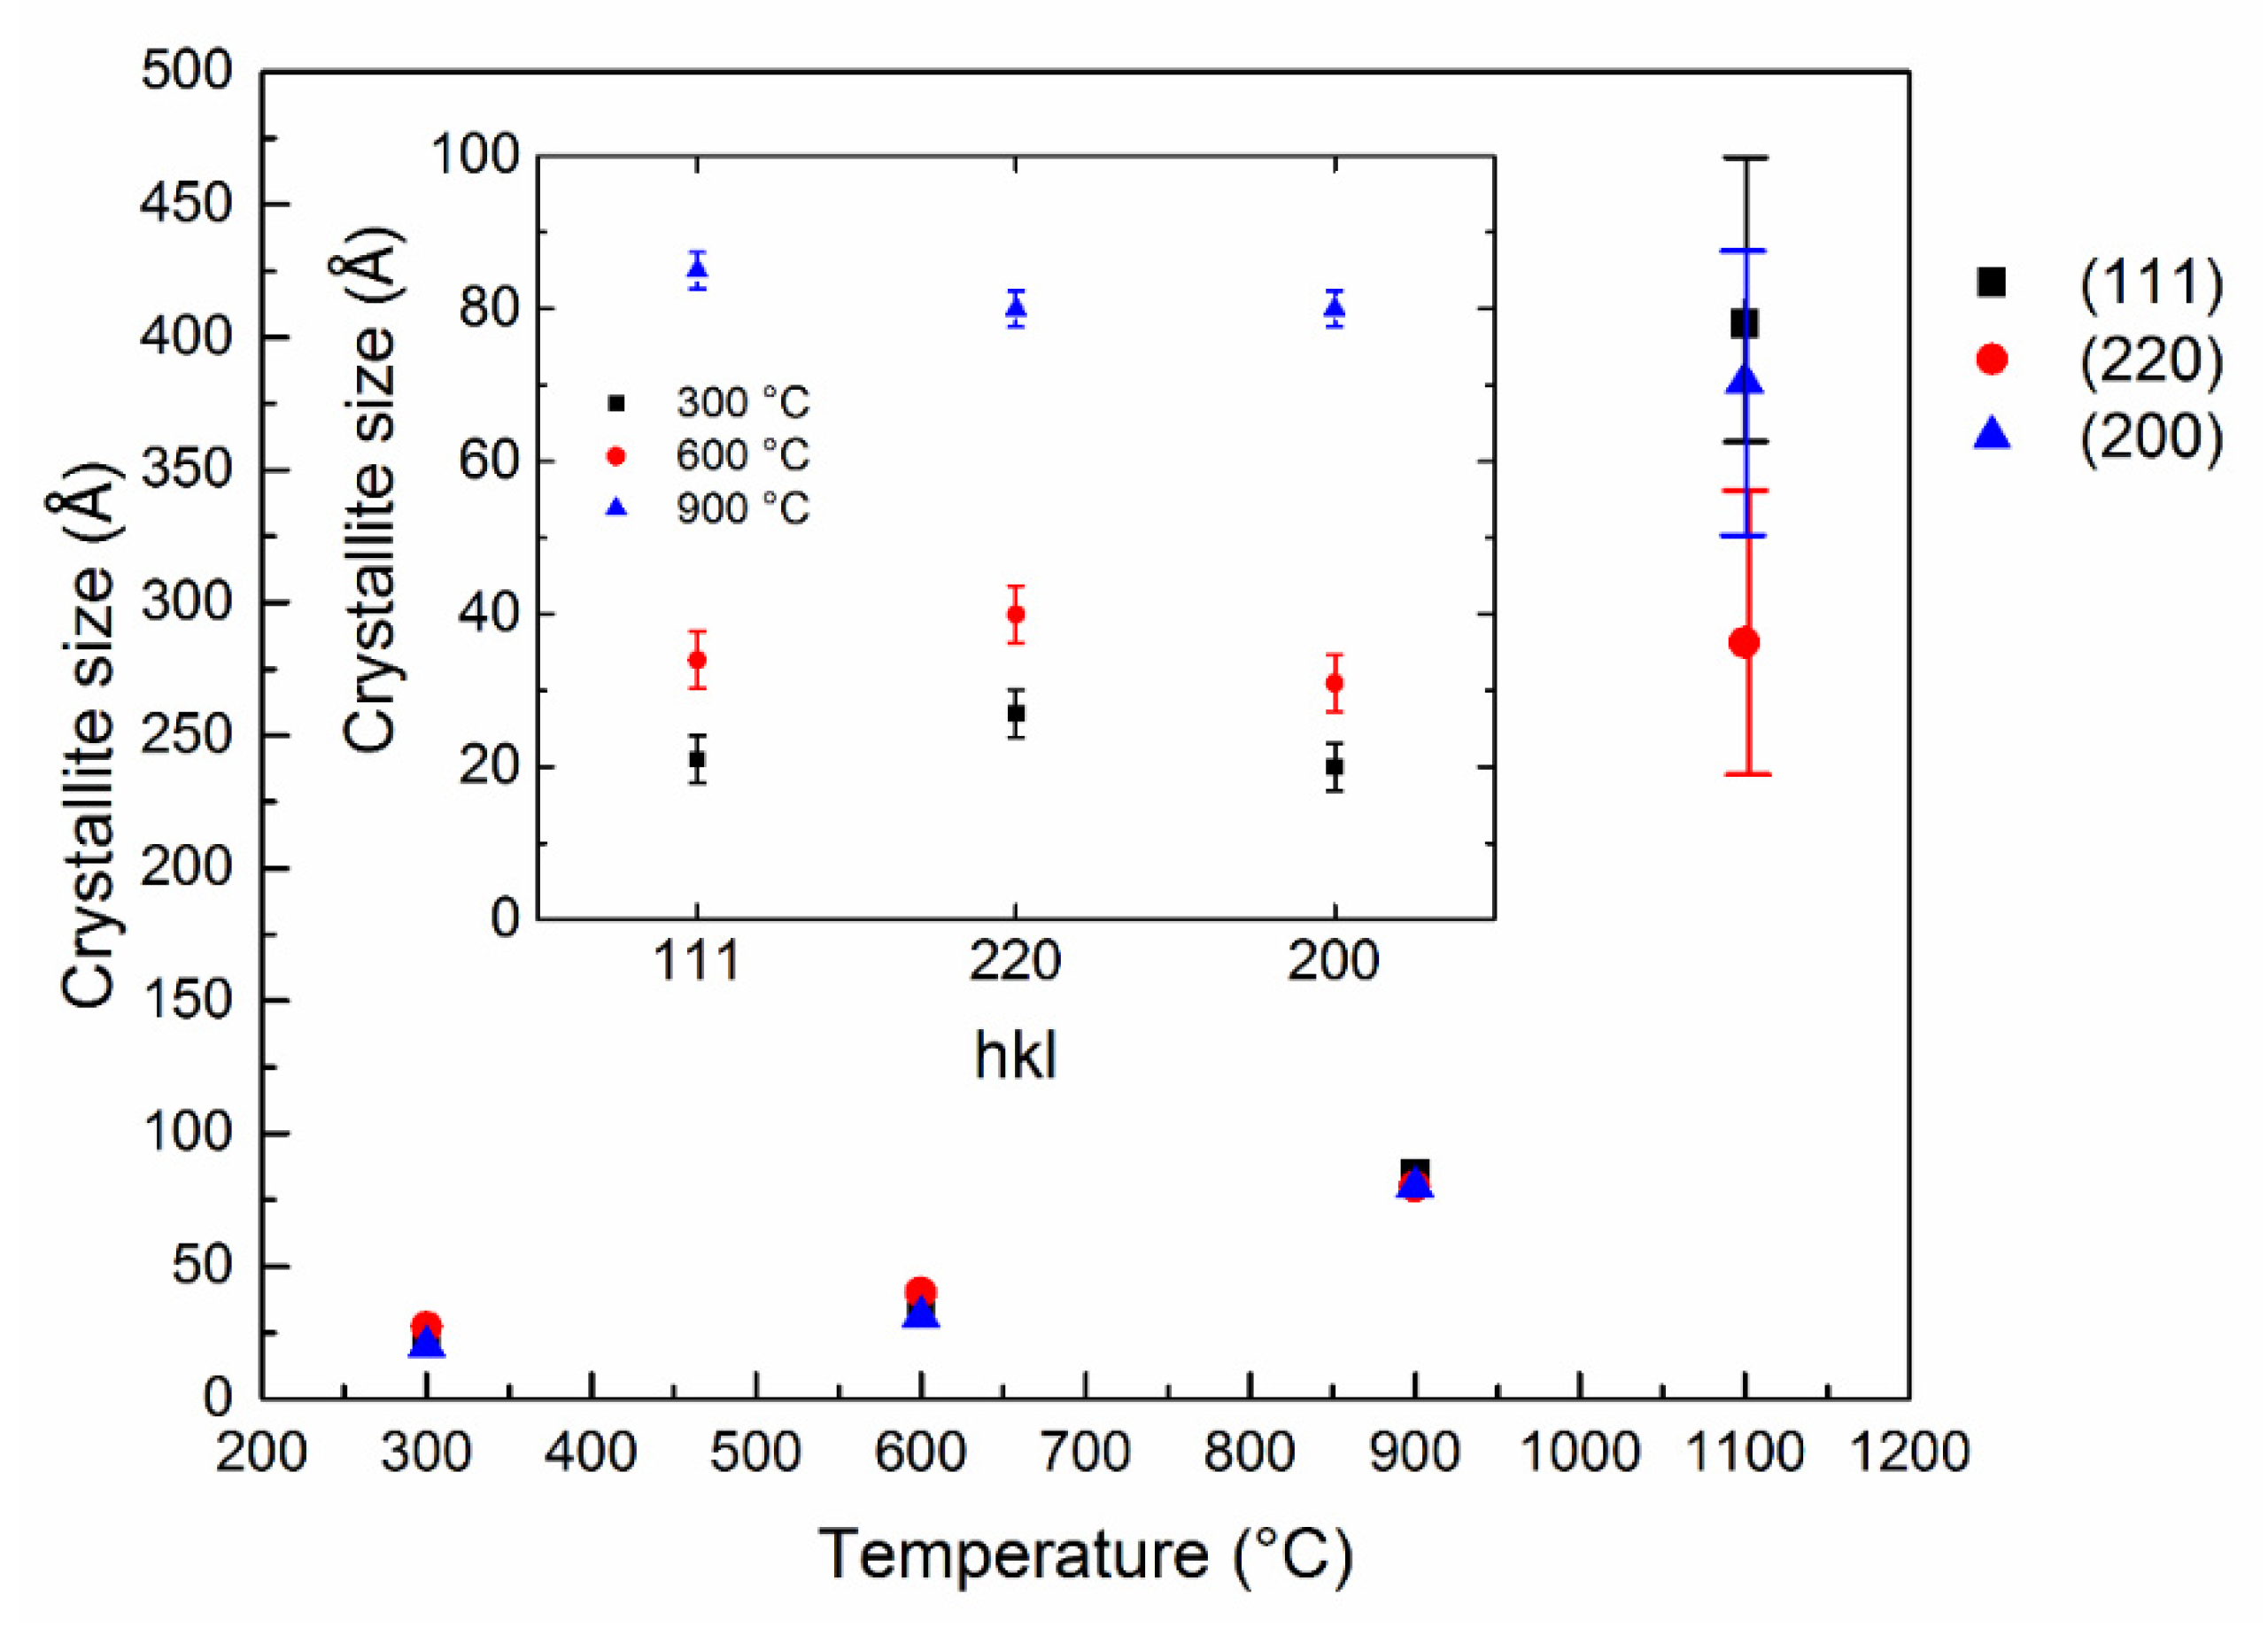
The temperature dependence of the crystallite size is shown in
Figure 3. As mentioned, the crystallite sizes were calculated from the Scherrer equation, making use of all crystal planes with the most intense signals: (220), (111) and (200). The average crystallite size was calculated and is also visualized in
Figure 3. In this figure, the non-treated sample TT-25 is not included because its crystallite sizes were too small.
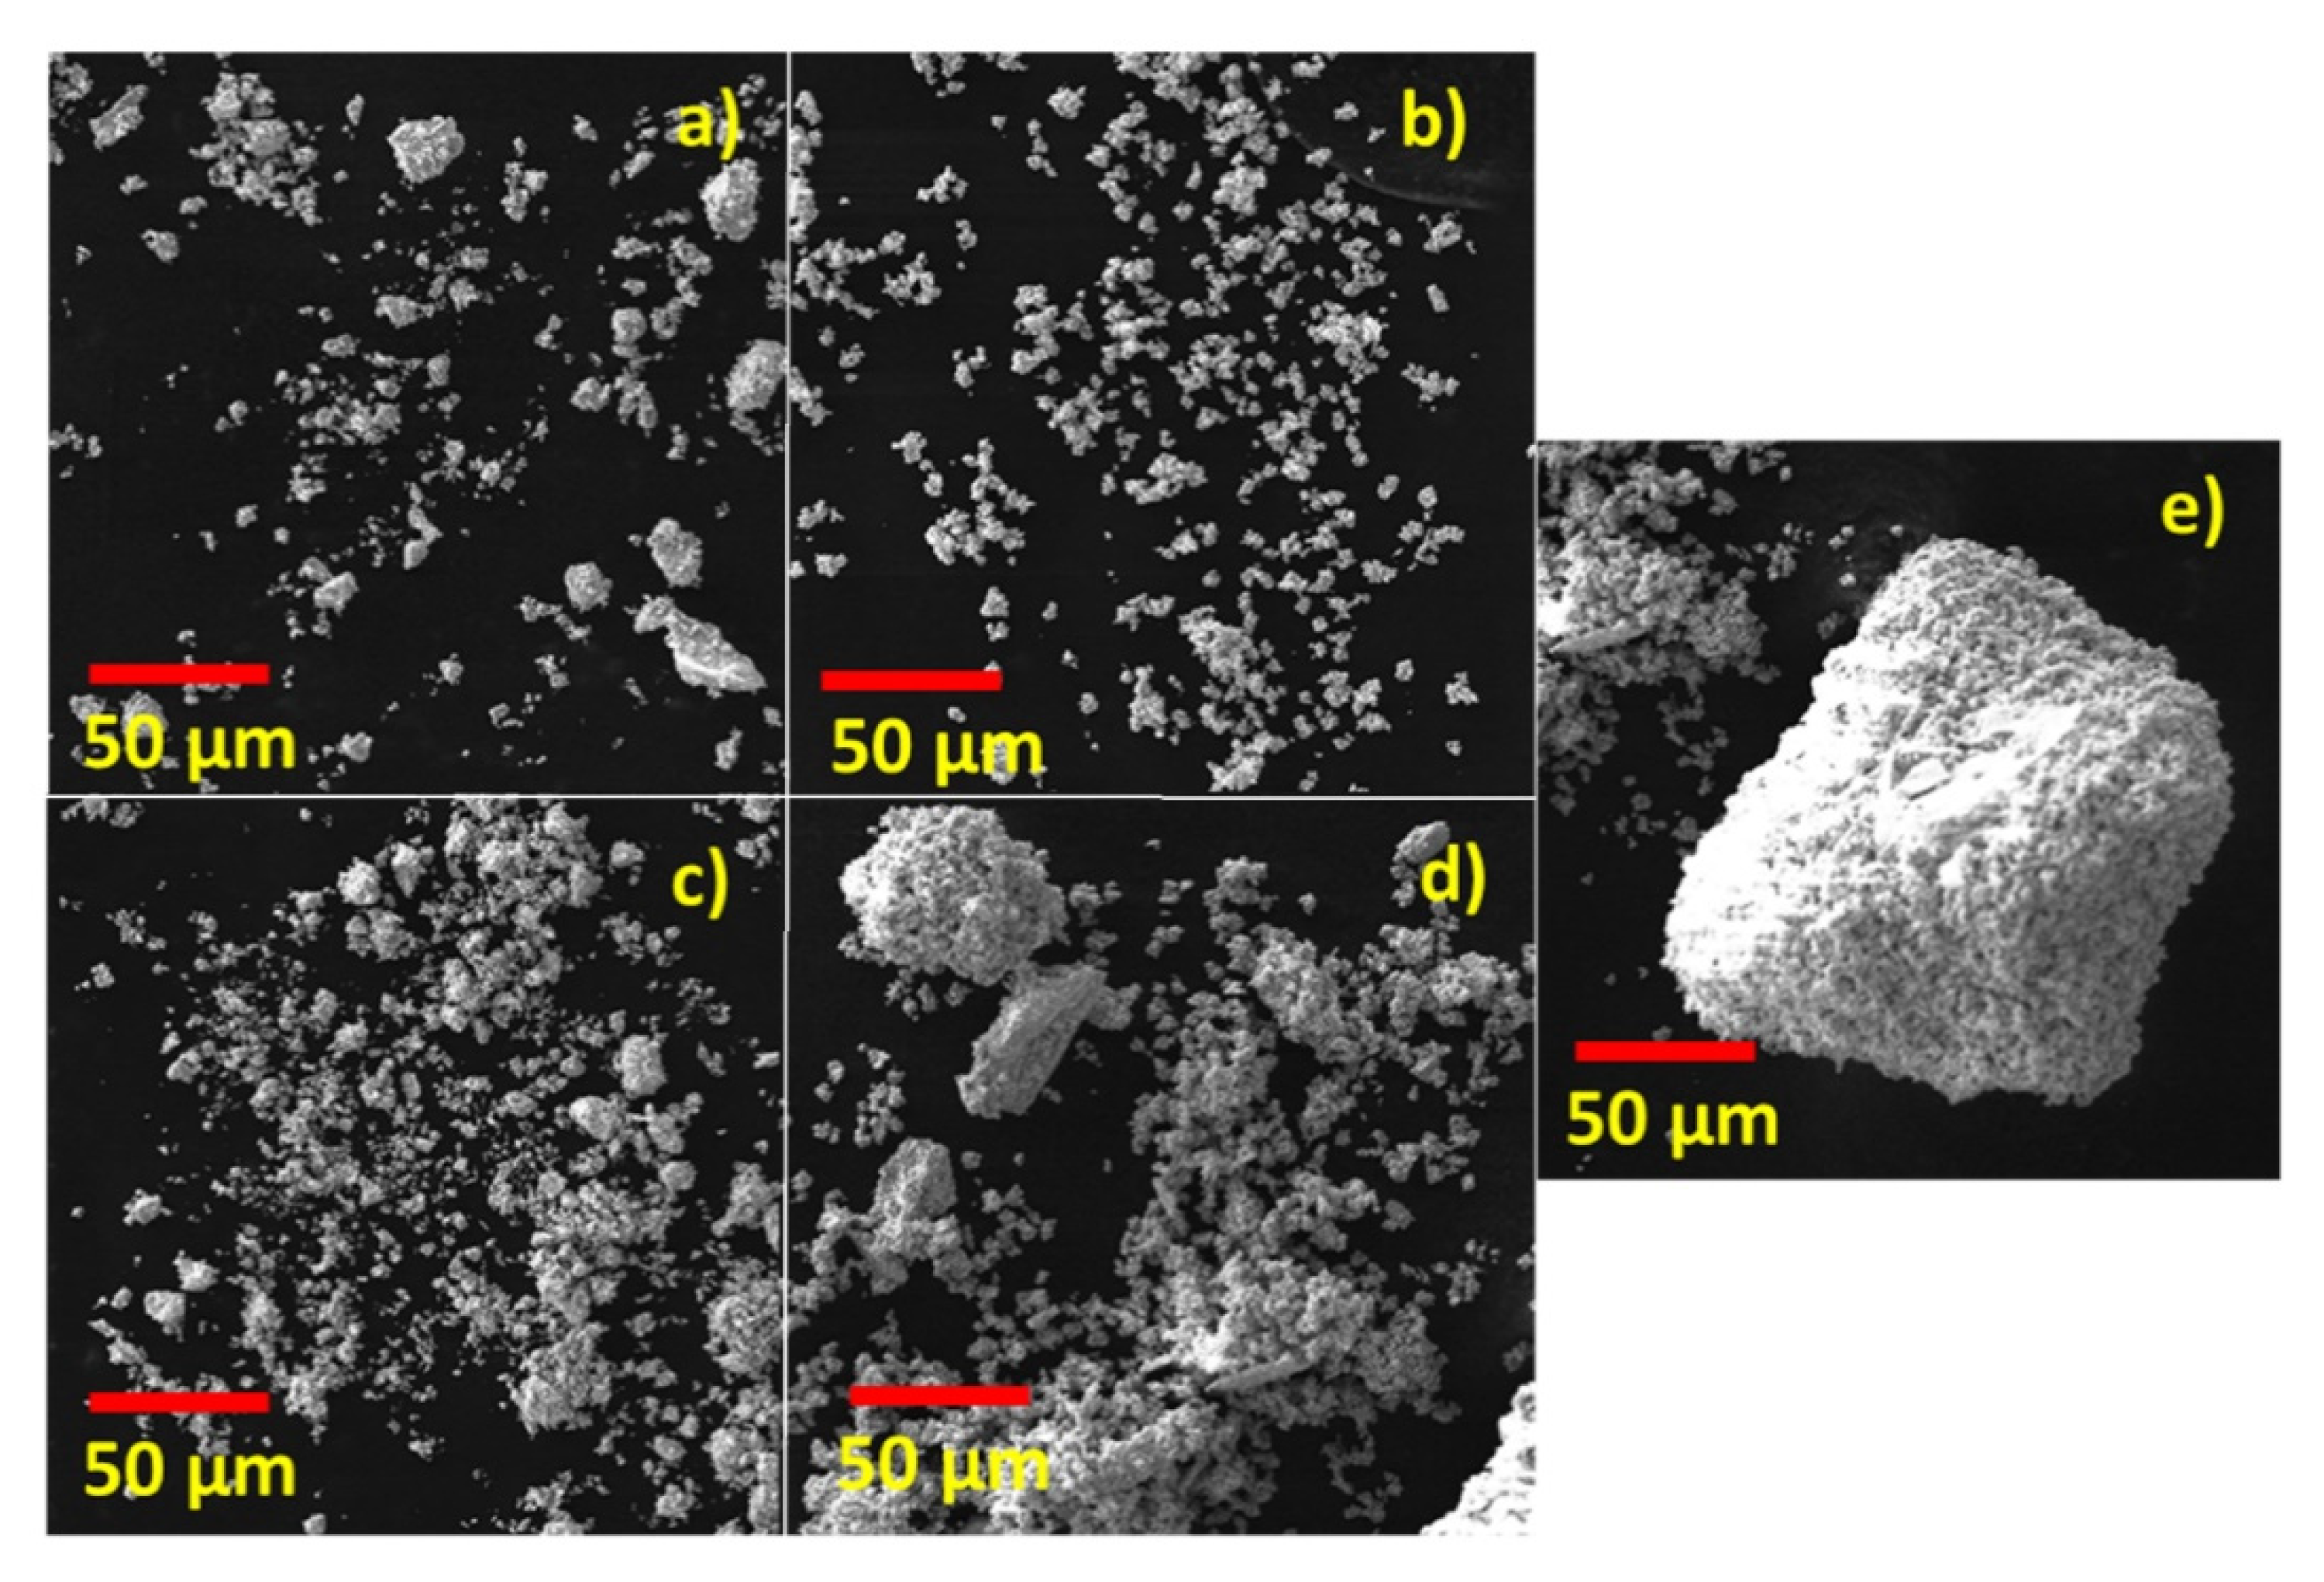
The results of the SEM measurement can be seen in
Figure 4. All pictures were captured with a magnification of 1300x. It is evident that the objects formed by the nontreated nanoparticles (
Figure 4a) were finer and looser. With the increasing temperature, the nanoparticles conglomerated, forming bigger aggregates. However, it was difficult and almost impossible to determine the absolute size of the objects. Needless to say, the size of the formed objects was not uniform, but in general, when observing the treated samples, it was almost impossible to find such fine objects as in
Figure 4a. Additionally, if we focus on the morphology of the TT-1100 sample shown in
Figure 4e, we can see significant differences in comparison with the previous samples. Both of these effects had an impact on the surface area of the nanoparticles, which will be discussed later.
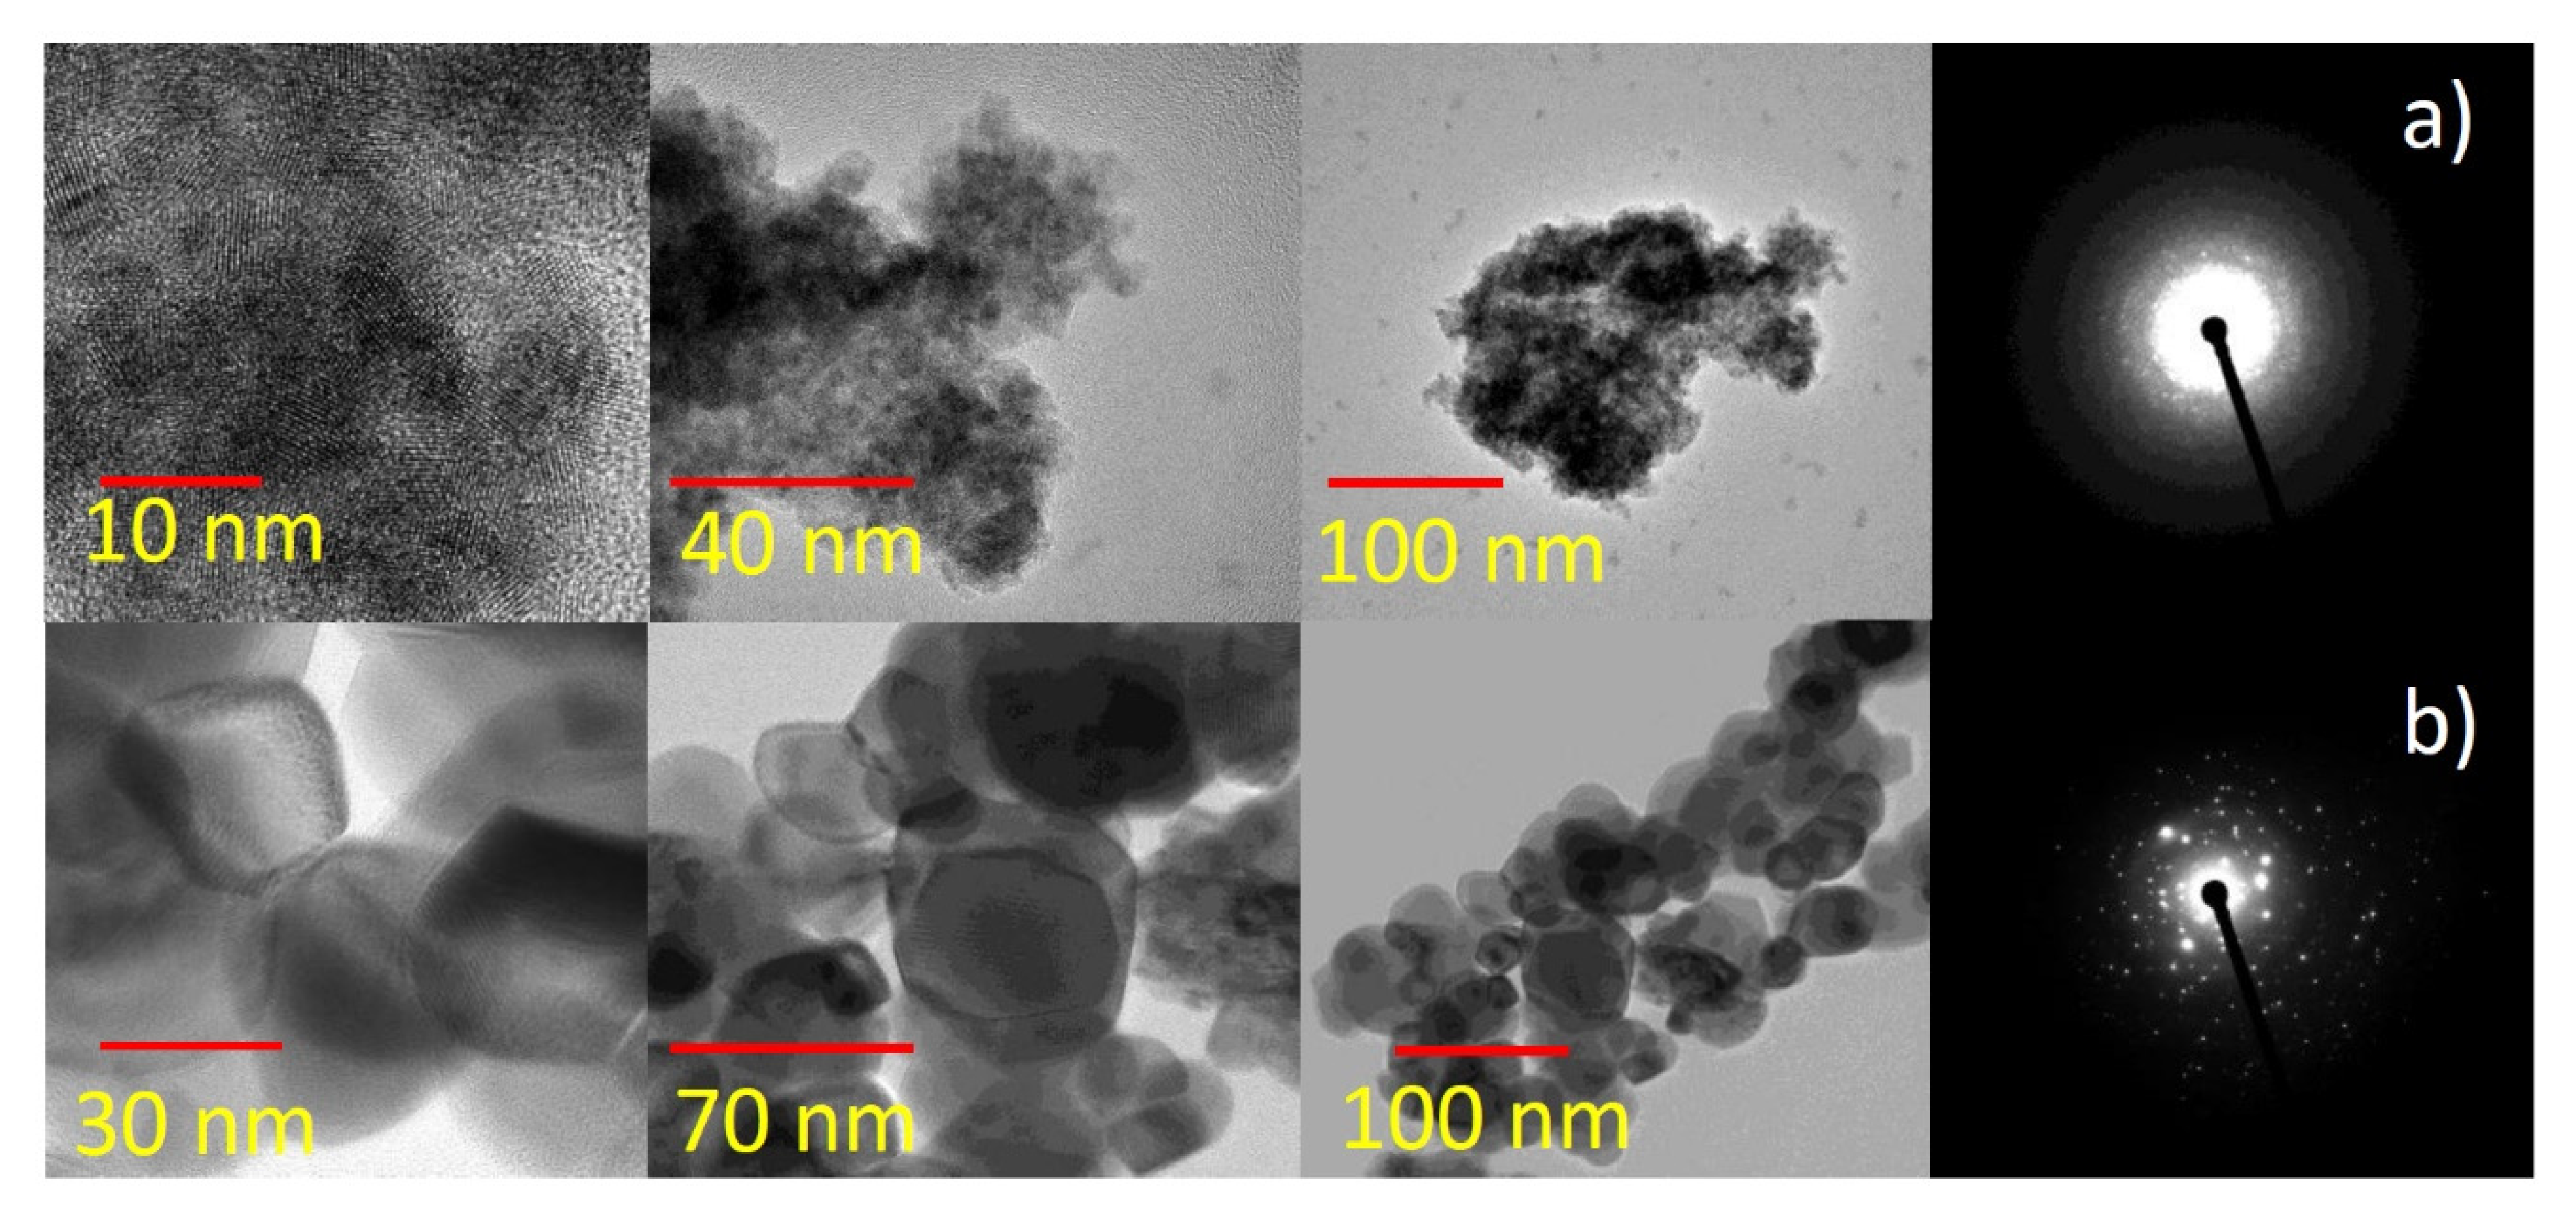
To directly observe the size and morphology of the nanoparticles, a high-resolution transmission electron microscope (HR-TEM) was used. The measurements of selected samples TT-25 and TT-1100 can be seen in
Figure 5, while TEM micrographs of all samples are shown in
Figure S1 in Supporting Information. Increasing particle sizes with increasing temperatures were clearly visible. It is significant that the results of both the HR-TEM and SAED measurements were in agreement with the XRD measurements.
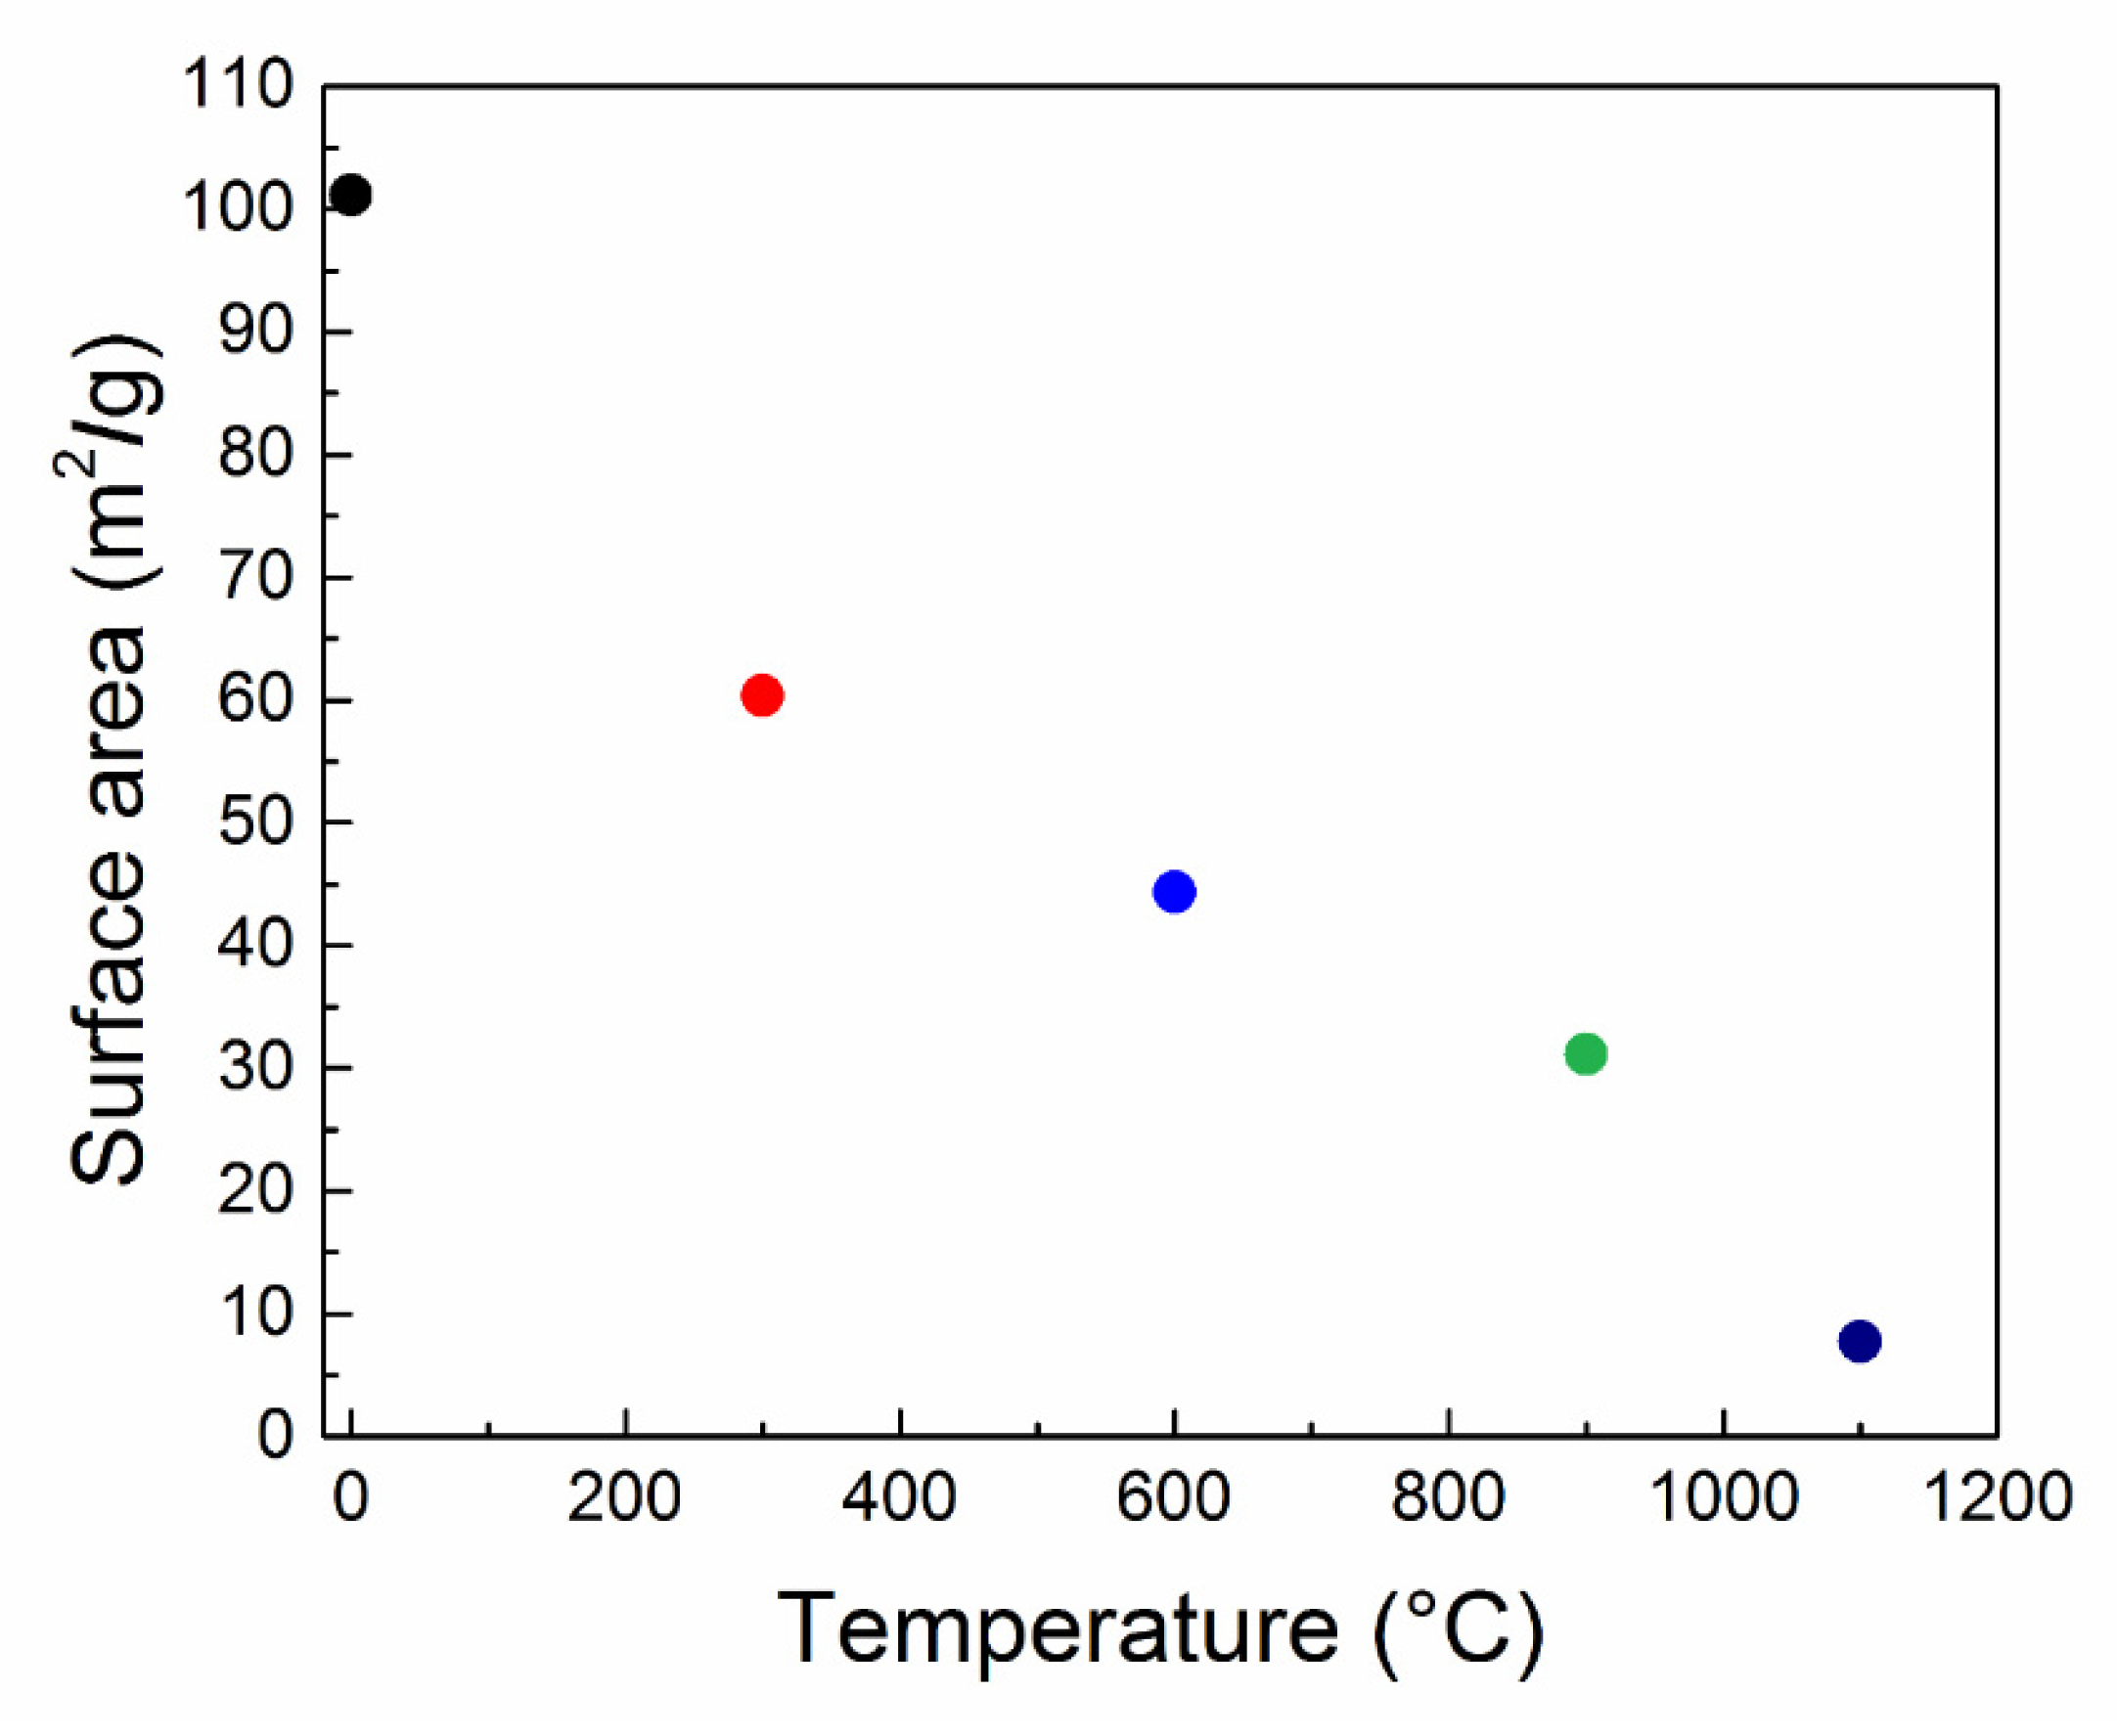
The BET analysis of the data obtained by a sorption analyzer was used for the nanoparticles’ surface area determination. In relation to the catalytic activity of nanoparticles, the specific surface area was the most important quantity. The results of the measurements can be seen in
Figure 6. The most significant surface area change appeared for sample TT-300. This effect was a bit contrary to the X-ray diffraction measurements, where the changes in crystallite sizes between the low-temperature treated samples were only minimal. We believe that such a significant drop in surface area is due to dehydration of the surface and subsequent agglomeration or aggregation of ceria nanoparticles. After the first drop in surface area, we could see a quite linear decrease with the increasing temperature of the thermal treatment, corresponding to the crystallite size changes. Between samples TT-900 and TT-1100, we could see again a significant reduction in surface area. This nevertheless corresponded to the crystallite size change, which was unusually large in comparison with previous samples. If we focus on the absolute values of the surface area and crystallite sizes, we can see huge irregularities. These irregularities could be caused by the agglomeration and formation of the large clusters, which were observed by SEM.
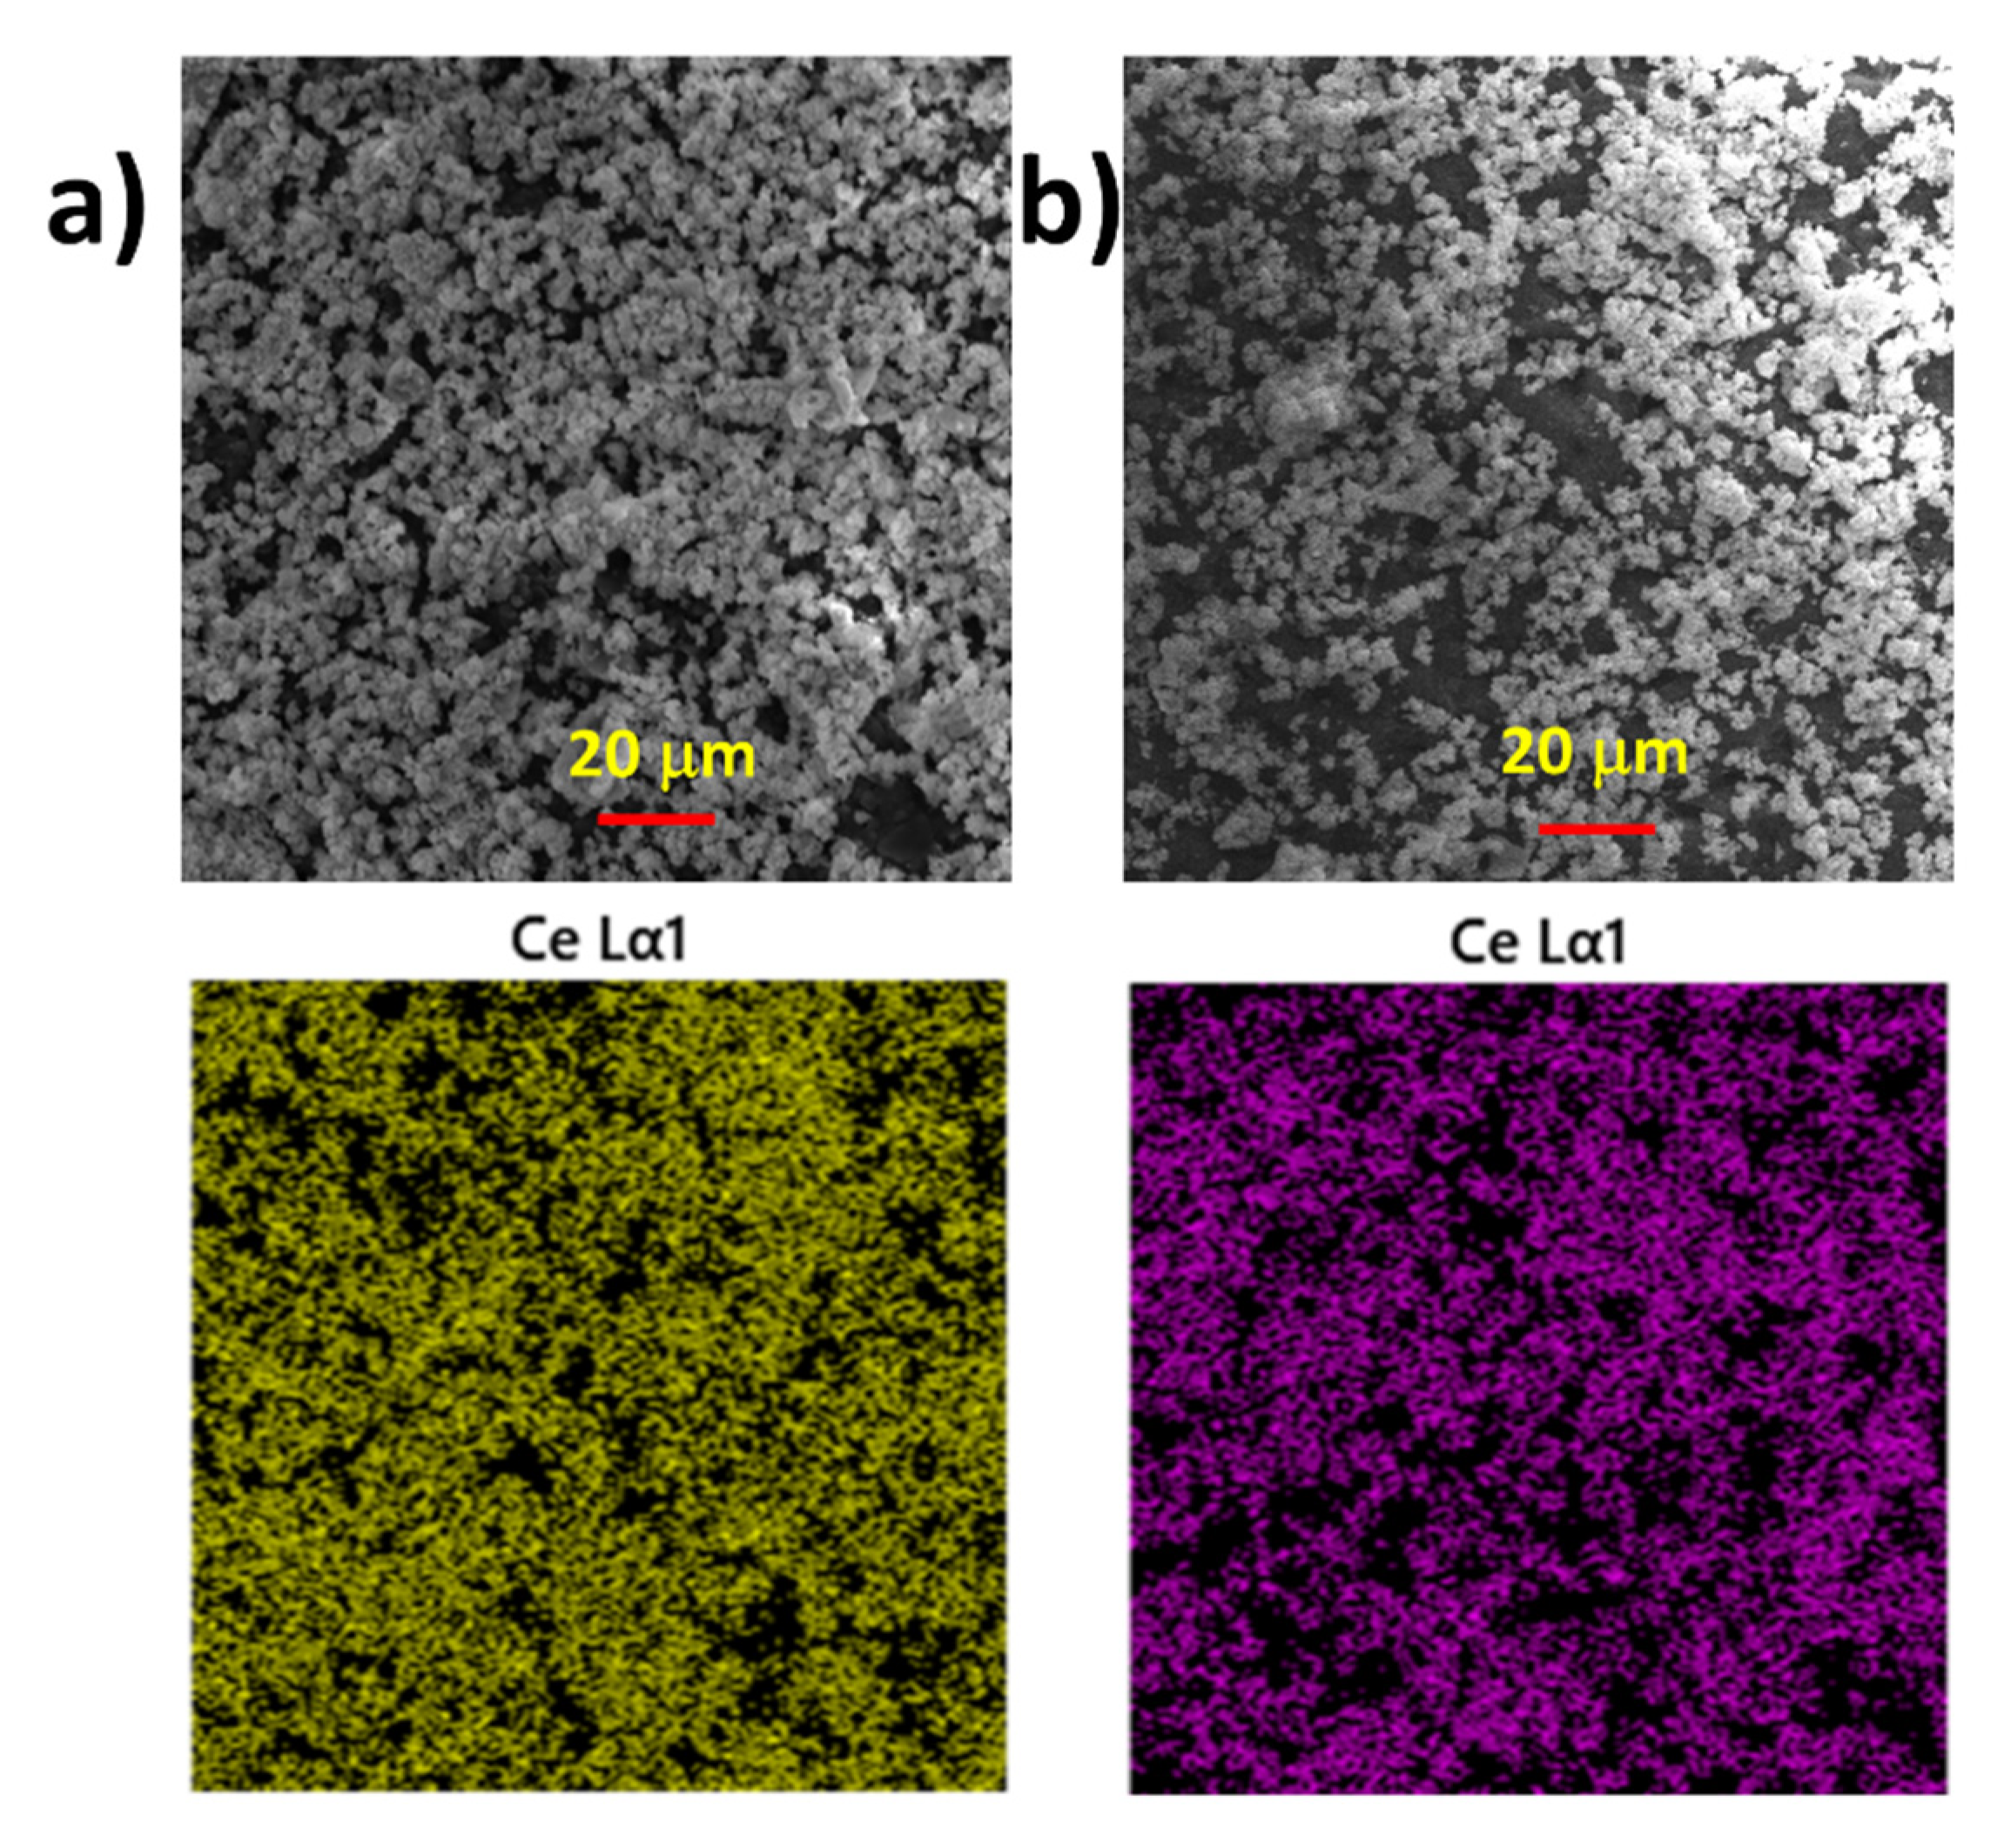
Thin ceria layers prepared on alumina underlays (
Figure 7a) and roughened silica glass (
Figure 7b) were examined. The layers were sufficiently mechanically stable and, in the reverse horizontal position, no powder fell out of the samples. Similarly, the layers were resistant to laminar water flow. Nevertheless, for practical applications, other ingredients for better fixation of the ceria nanoparticles on the layer may be needed. Samples were also investigated by SEM and EDS. The morphology of the prepared layers with EDS maps of ceria can be seen. In both cases, the surface was relatively covered with similar complex ceria aggregates with apparently large surfaces. In the case of the alumina underlay, the cover was seemingly more homogenous, and this may indicate that the alumina surface is more convenient for the purpose of immobilization of catalytic ceria nano-surfaces than roughened silica glass. It is expected that the catalytic properties of ceria on alumina and silica underlays are about the same as the catalytic property of the nanoparticles synthesized at the same temperature, which is evaluated further in [
29].
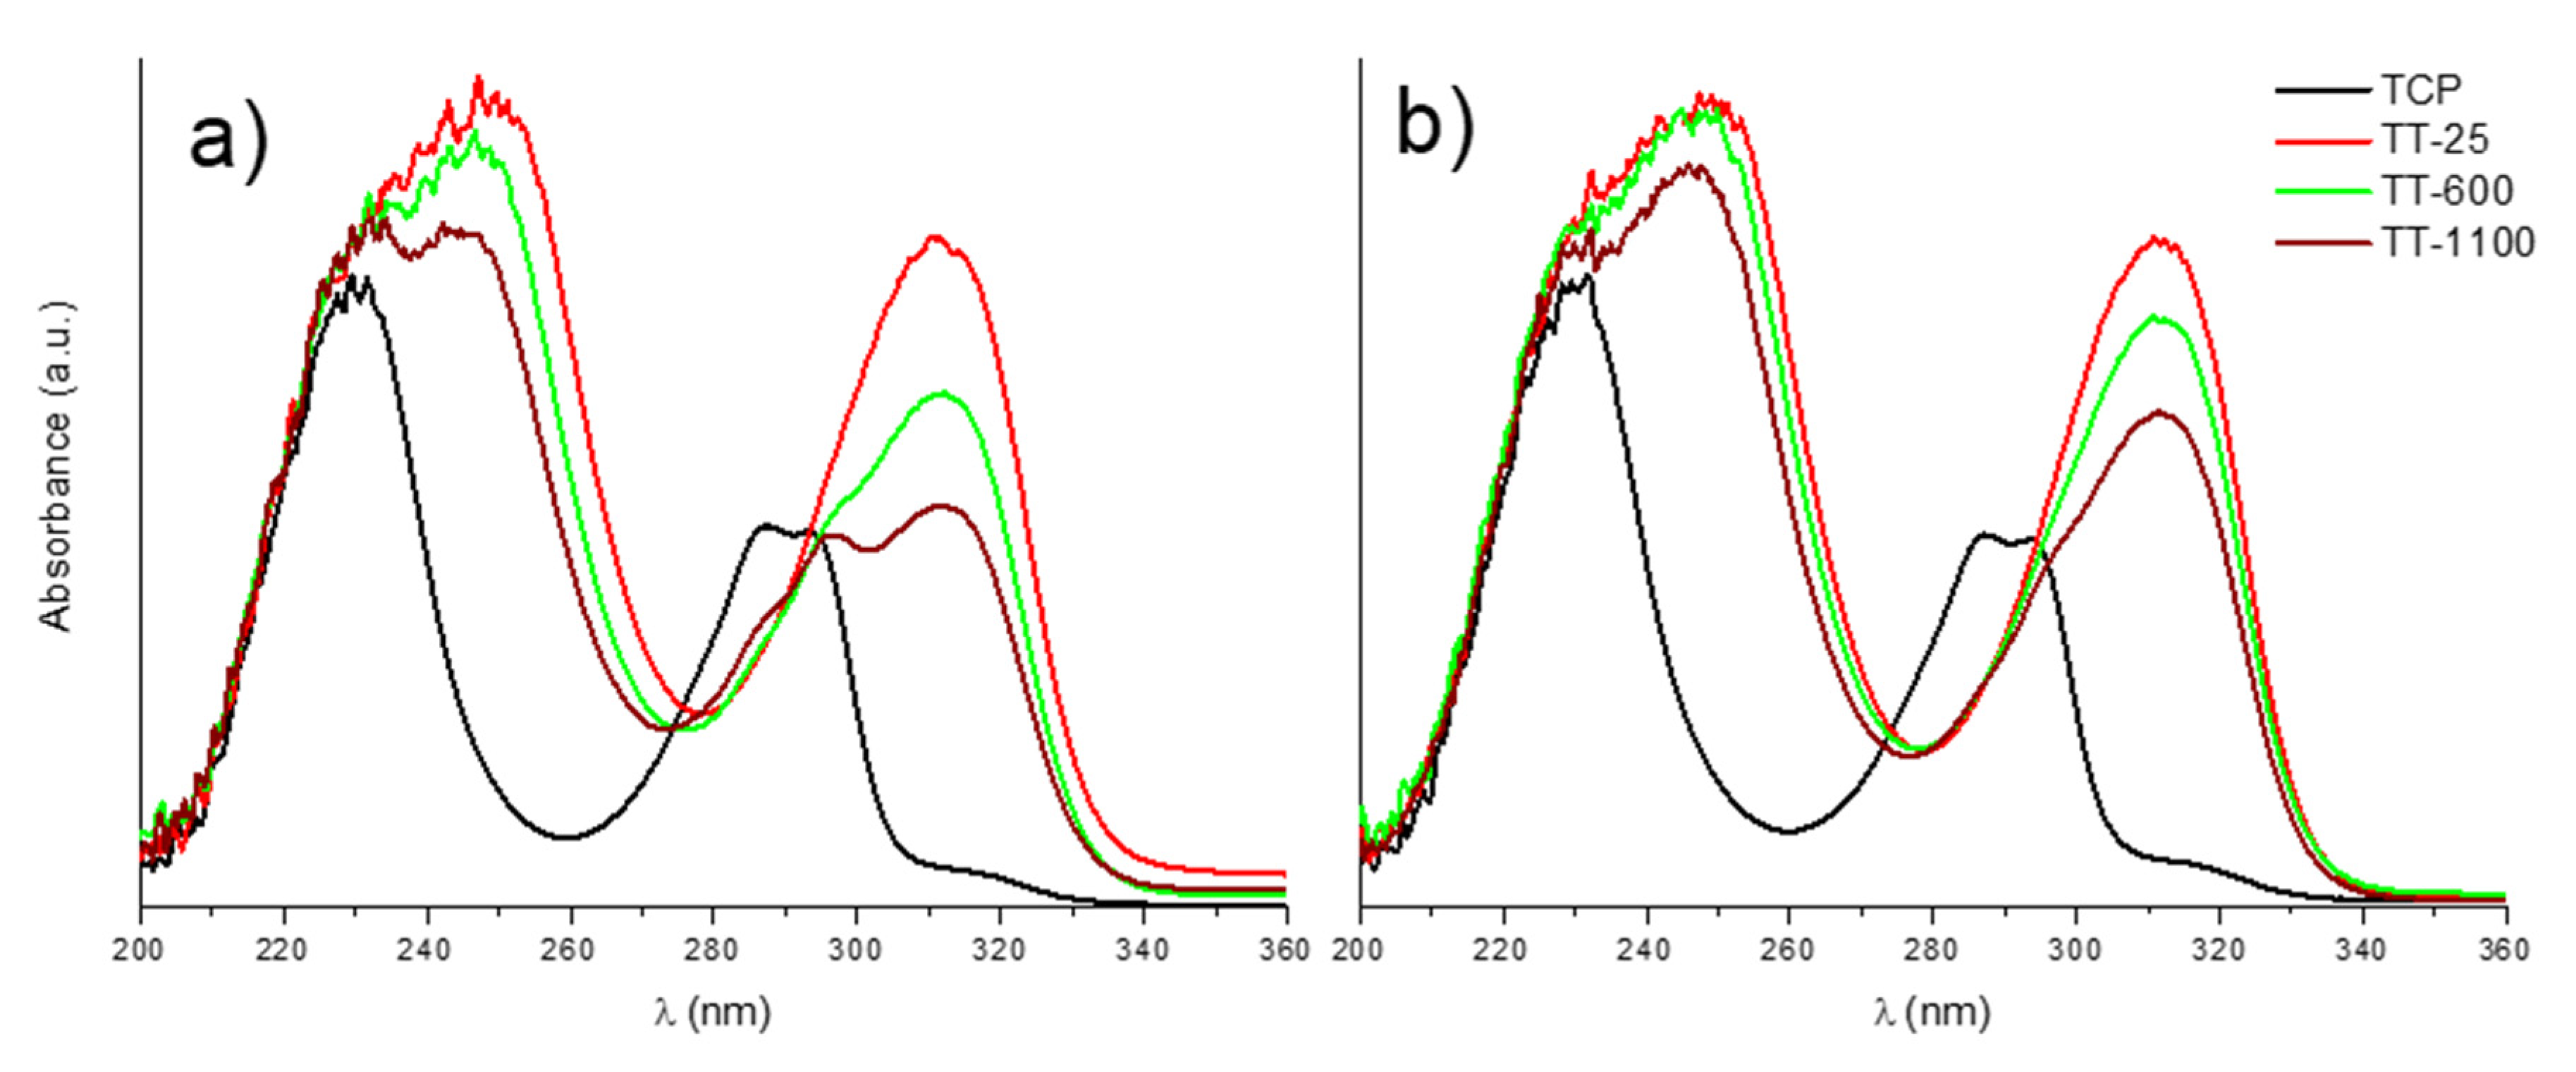
Synthesized nanoparticle fractions were evaluated on catalytic activity on model contaminant 2,4,6-TCP in a water environment. In order to rule out only the surface absorption effect, an experiment was carried out. A decreasing catalytic activity was expected to be observed with the growth of crystallite sizes. Therefore, because of their significant crystallite size differences, only the TT-25, TT-600 and TT-1100 samples were examined. For the UV–VIS measurement, each sample had to be centrifuged to get a liquid phase free from the nanoparticles. For this purpose, the SIGMA 2k15 centrifuge was used with the setup of 15,300 rpm. The first measurement took place 30 min after the experiment was set up, and then after 1, 5, 8, 12 and 14 days. After each measurement, the entire measured sample was returned to the centrifugation vial and placed for a sonic bath treatment, redispersing the separated nanoparticles to suppress their losses to a minimum. All samples were then stored in the dark under standard laboratory conditions. The results of the measurements can be seen in
Figure 8. No detailed mechanism of the reaction was exanimated in this study, and it is described in the literature for Fenton-like catalysts [
30,
31], where it is considered to be based on radical generation caused by the transition of oxidative states, in the case of CeO
2 by Ce
3+/Ce
4+.
The molar amount of nanoparticles added to the system exceeded the molar amount of TCP by almost 72 times. According to our experience and measurements, such a surplus of nanoparticles should reliably shift the UV–VIS signal of TCP to lower energies, signaling the presence of the deprotonated form. As can be seen in
Figure 8a, 30 min after the experiment started, the TT-25 sample signal showed an expected shift to higher wavelengths and increased its intensity. UV–VIS signals of all other samples also shifted to lower energies, but the absorbance decreased as the samples’ surface areas diminished. The absorbance of the TT-25 sample remained unchanged during the entire experiment’s duration, while all other samples’ absorbances increased. As can be seen in
Figure 8b, 14 days after the experiment had begun, the TT-600 sample showed a higher absorbance value, but still not as high as the TT-25 sample, while the TT-1100 sample still had the lowest absorbance value. The absolute concentration of TCP in the samples was not essential in the case of this experiment. This experiment just aimed to demonstrate that the surface area reduction of the used nanoparticles led to decreased catalytic activity. It is essential to say that we did not observe any unexpected reactions or by-products. We only observed a limited function of the treated nanoparticles, which means that the higher the temperature of nanoparticles’ thermal treatment was, the higher the amount of catalyst that was needed to reach the same result as with the use of the non-treated ones. It has to be noted that the speed of the catalytic reaction was significantly slower than in the case of combined Fenton-like catalysts systems [
30], but it was outweighed by the simplicity of the pure ceria system and by the possibility of using the high-temperature thermal method for preparation of advanced ceria-nanoparticle-based systems, which was proven by our study since the ceria nanoparticles treated at high temperatures were still active.
4. Conclusions
In this study, ultrafine nanoparticles of cerium dioxide were prepared by a simple precipitation method, where the approximate crystallite size of such prepared nanoparticles was around 18 Å. Application of the thermal treatment method to these nanoparticles led to apparent crystallite growth, which was clearly observed by XRD and HR-TEM, and the absolute crystallite size changes were calculated using the Debye–Scherrer formulae. As could have been predicted, the most significant crystallite growth occurred for temperatures higher than 900 °C. Moreover, there was a significant color change of the nanoparticles, depending on the nanoparticles’ crystallite size changes and dehydration of their surfaces.
The results of the BET analysis showed a constant trend in the decrease of the nanoparticles’ specific surface area; however, it did not correspond to the X-ray measurements. The surface area of the low-temperature-treated samples dropped very markedly, while at the same time, the crystallite sizes changes were only minimal. The most likely reason for this effect is the aggregate size change, which is very difficult to determine. In the case of this study, the SEM analysis was performed in order to unravel this trend, which showed the formation of various large objects. These definitely affect the surface area, but their size is impossible to determine precisely by SEM analyses. Thin layers of ceria on both glass and ceramic surfaces using the highest temperature of 1100 °C were prepared and exanimated to demonstrate the possibility of immobilization of ceria nanoparticles, which is important for possible catalysis applications.
Selected samples were tested for their catalytic properties, and all results appeared in accordance with the specific surface area. This means that the more the sample was thermally treated, the weaker and slower its catalytic reaction was. These results show promising potential for catalytic decomposition of chlorinated phenols, where the thermal treatment of the nanoparticles leads to reduced catalytic activity, but not to its vanishing. This might be useful for possible immobilization of such nanoparticles by the thermal processing of surfaces and, subsequently, for various environmental and industrial applications.
This contribution will be useful for advanced research in the catalytic decomposition of pesticide residues and for the processing of ceria-based ceramic composites, in which the temperature of sintering has to be carefully adjusted to avoid undesired crystallite growth.


