Article

Effect of Nano-Silica on the Autogenous Shrinkage, Strength, and Hydration Heat of Ultra-High Strength Concrete

1
Department of Architectural Engineering, Kangwon National University, Chuncheon-Si 24341, Korea
2
Energy and Environment Division, Korean Institute of Ceramic Engineering and Technology, Jinju-Si 52851, Korea
*
Author to whom correspondence should be addressed.
Appl. Sci. 2020, 10(15), 5202; https://doi.org/10.3390/app10155202
Submission received: 1 July 2020 / Revised: 25 July 2020 / Accepted: 27 July 2020 / Published: 28 July 2020
(This article belongs to the Special Issue Modern Cement-Based Materials)

Abstract

:
In this paper, the effect of nano-silica on the autogenous shrinkage, hydration heat, compressive strength hydration products of Ultra-High Strength Concrete (UHSC) is studied. The water/binder ratio (w/b) of UHSC is 0.2. The nano-silica replaces 2% and 4% of the mass fraction of the cement in UHSCs, respectively. A new instrument was developed to simultaneously measure the autogenous shrinkage, internal relative humidity, and internal temperature of UHSC. The following results were obtained from the analysis of the experimental data: (1) The trends in the autogenous shrinking of UHSC can be divided into two stages, which are the variable temperature stage and the room temperature stage. The dividing point between the two stages occurs at the age of approximately 2 days. During the room temperature stage, the internal relative humidity and autogenous shrinkage showed a good linear relationship. (2) The compressive strength of UHSC increased significantly with the increase of nano-silica content at 3 days, 7 days, and 28 days. (3) The total accumulated heat of UHSC increased during the 72 h, with the increasing of nano-silica content. (4) The XRD data at the age of 28 days showed that the Ca(OH)2 peaks of nS2 and nS4 have a tendency to weaken due to the pozzolanic reaction, compared with the peak of nS0.

1. Introduction

Concrete is widely used in the construction industry because of its many advantages, such as its low-cost [1], high strength, good plasticity [2], and good durability. With the development of the construction industry, ordinary strength concrete cannot meet the needs of actual projects. At the same time, ultra-high strength concrete (UHSC), with its superior mechanical properties and durability, has been studied and produced [3]. UHSC is a type of concrete with a low water/binder ratio and various additives. The most common additives include mineral admixtures and fibrous materials. With nanotechnology’s continuous development, more and more nano-mineral materials are being applied in the construction industry, such as nano-calcium carbonate (nano-CaCO3) [4,5], nano-titanium dioxide (nano-TiO2) [6,7], nano-silica (nano-SiO2) [8,9], and so on. Due to its high level of activity and very high specific surface area, nano-SiO2 (nS) is often integrated into the construction of cement-based materials to obtain a superior performance, compared with traditional materials [10,11].
Most researchers have paid attention to the properties of UHSC-containing nS, such as their mechanical properties, durability, and microstructure, for example, and the study of a nano-silica modified low water/binder ratio (w/b = 0.2) UHSC can be traced back to Yu et al. [11]. A series of experiments confirmed that the optimal mixing amount of nS obtained is 3.74 wt.%. Ghafari et al. [12] investigated the effect of nS on the durability of UHSC. By comparing the accelerated corrosion test results of UHSC with and without nS, it was found that UHSC containing nS has better corrosion resistance. nS can effectively reduce the corrosion rate of steel bars in UHSC. Ghafari et al. [13] evaluated the performance of UHSC with nS by thermogravimetric analysis, mercury intrusion porosimetry, and scanning electron microscopy. After replacing the cement amount of 3 wt.%, the cement paste exhibited the best performance. UHSCs blended with nano-silica alone were studied [11,13], and more researchers began to focus on the addition of at least two kinds of nano-particles to UHSCs. Li et al. [14] studied the properties of UHSC containing nS and nano-limestone. For a denser microstructure and high mechanical properties of UHSC, it is necessary to dope the UHSC matrix with nS and nano-limestone, which added 1 wt.% and 3 wt.%, respectively. Wu et al. [15] studied the effects of different nano-CaCO3 and nS contents on the performance of UHSC. The study showed that the optimal dosages for nano-CaCO3 and nS are 1.6%–4.8% and 0.5%–1.5%, respectively. It was also found that nS provides more strength before the age of 7 days, and the 7–28 days strength increased due to the nano-CaCO3.
Compared to studies on the effect of nS on the mechanical properties and microstructure of UHSCs, there have been relatively few studies on the effect of nS on the autogenous shrinkage of UHSCs. All UHSC designs are based on a low water–cement ratio. Although such a configuration can obtain high strength, UHSC also shows exceptionally large autogenous shrinkage, thereby increasing the early cracking risk of the substrate. In short, shrinkage is the unavoidable volume deformation of UHSC in the process of gradual hardening. It is a disadvantage that cannot be ignored in the construction engineering phase of UHSC. The effect of nS on the autogenous shrinkage of concrete has been studied extensively. Baloch et al. [16] studied the properties of self-compacting pastes mixed with nS. Their results showed that nS increases the total shrinkage due to the initiation of the pozzolanic reaction. Chen et al. [17] studied the properties of composite cement pastes with the addition of nS and silica fume and found that both nS and silica fume promote the increase of autogenous shrinkage. They also found that in early-age shrinkage, nS plays a more active effect than silica fume. Chen et al. [18] found that nS effectively improved the mechanical properties of mortars mixed with recycling plastic waste, but also increased the self-shrinkage.
Although many studies have been done on the autogenous shrinkage of UHSC, these previous studies showed some weak points. First, most researchers have only focused on measuring the autogenous contraction strain of UHSC, but few studies have explored the relationship between the simultaneous measurement of internal relative humidity, internal temperature, and autogenous shrinkage. Second, most previous studies focused on autogenous shrinkage at a constant temperature, such as 20 °C. However, in real construction projects, due to the effect of binder hydration, the internal temperature of hardening concrete will initially increase and then decrease due to heat convection. The mechanism responsible for the interaction between hydration heat, temperature variance, and autogenous shrinkage needs more investigation.
This study’s primary purpose is to observe the effect of nS on the autogenous shrinkage of UHSCs. In addition, the internal relative humidity (IRH) and internal temperature (IT) are measured simultaneously by improving the experimental installation on ASTM C1698-09 [19]. The research methods implemented include the internal relative humidity, autogenous shrinkage, internal temperature, compressive strength, X-ray diffraction, and isothermal calorimetry tests.
The innovative points of this study are summarized as follows: First, the new measuring instrument is modified to simultaneously determine the autogenous shrinkage, internal relative humidity, and internal temperature. Second, the trends in the autogenous shrinking of UHSC are divided into two stages, the variable temperature stage (Stage I) and the room temperature stage (Stage II). The mechanism of autogenous shrinkage in the two stages is explained. The deformation of autogenous shrinkage is closely related to the internal relative humidity in stage II and shows a good linear relationship. Finally, we find a very interesting phenomenon: in stage I (until 2 days of age), the internal relative humidity of UHSC undergoes a reduced–increased process as the binder hydration proceeds. In stage II, the internal relative humidity of UHSC continuously decreases with the progress of binder hydration. This phenomenon is different from the continuous decrease of the internal relative humidity of concrete from the final setting time reported in previous studies [20].

2. Materials and Methods

2.1. Material and Specimen Preparation

Type Ι ordinary Portland cement (OPC) and nano-silica were used as binders for the UHSC mix design. The chemical composition of cement and nano-silica are listed in Table 1. Nano-silica flour with a specific surface area of 263 m2/g and an average particle size of 15 nm was used. The superplasticizer used in this study was a polycarboxylate (PCE) superplasticizers supplied by Dongnam Co., Ltd., Seoul, Korea. Due to the large specific surface area of the nano-silica [21], the superplasticizer content required in this study was increased due to the increase in the amount of nS added. For nS0, nS2, and nS4, the superplasticizer content was 0.9, 2.4, and 3.9 wt.%, respectively. The details of measurement of a slump were shown as follows: after mixing, the fresh UHSC mixture was cast into a conical mold. After removing the conical mold, the average of two mutually perpendicular diameters was recorded as the mini-slump flow of UHSC. The slump of specimens of nS0, nS2 and nS4 was approximately 195 mm.
The UHSC mix designs are shown in Table 2. The water/binder ratio (w/b) of UHSC was 0.2. All binders were mixed for 30 s by a mortar mixer. Water was added and mixed for 1 min followed by the addition of superplasticizer, and then it was mixed for an additional 2 min at a low speed and 3 min at a high speed. In this paper, nano-silica is labeled nS2 and nS4 instead of 2 wt.% and 4 wt.% ordinary Portland cement, and the control group is labeled nS0.

2.2. Experimental Program

2.2.1. Isothermal Calorimetry

The isothermal calorimetry technique was used to study the reaction heat and hydration. A TAM-Air isothermal conduction calorimeter (TA Instruments, New Castle, DE, USA) was used to measure the heat release rate and cumulative heat of the adhesives. Calibration was done at 20 °C, before measurements for a period of 72 h. All binders were mixed by a mortar mixer and transferred to the calorimeter. In addition, Hu et al. [22] experimentally found that the curve obtained by the first-order derivative of the heat release rate curve showed a good correlation with the setting time. Therefore, the samples’ setting time was obtained by the first derivative of the heat release rate curve. This method can accurately assess the hydration process while accurately determining the setting time. The final setting time (start time of the autogenous shrinkage test) is related to the time at which the concrete evolves at the maximum rate during the acceleration period [23].

2.2.2. Autogenous Shrinkage, Internal Relative Humidity, and Internal Temperature

The current ASTM C1698 standard can only measure the autogenous shrinkage of concrete, but it cannot simultaneously measure the internal relative humidity and internal temperature. For cast-in-place concrete in actual engineering, engineers are interested not only in the autogenous shrinkage of concrete but also in its internal relative humidity and internal temperature. Therefore, an experimental machine that can simultaneously measure the three indicators of autogenous shrinkage, internal relative humidity, and internal temperature is urgently needed. Based on the above features, such an experimental device was invented in the present study. Figure 1a shows the overall schematic diagram of the internal relative humidity, internal temperature, and deformation measurement set-up. A corrugated tube with concrete is placed on the steel support, and the magnet absorbs one end of the corrugated tube. The linear variable differential transducer (LVDT) measures the deformation throughout the experiments. To ensure the internal relative humidity and temperature reflect the real values inside the samples, a sensor bar with a measurement accuracy of ±0.8% RH and ±0.1 °C is embedded into the specimens. A PVC tube with an inner diameter 15 mm is used to hold the sensor. Two rectangular holes are made on the surface of the PVC tube to keep the sensor bar at the same humidity as the surrounding materials. Figure 1b is the physical object of the measurement set-up. The whole set-up was placed in a constant temperature chamber at 20 ± 1 °C for 7 days. The most obvious advantage of the new measuring instrument is that it can simultaneously measure the autogenous shrinkage, internal relative humidity, and internal temperature.

2.2.3. X-ray Diffraction

X-ray diffraction (XRD) measurements were conducted to examine the crystalline phases in the specimens cast at the age of 28 days. XRD was carried out by using a Panalytical X’pert-pro MPD diffractometer (Panalytical, Almelo, The Netherlands) with Cu Kα radiation (1.5404 Å), a step size of 0.1°, and a 2 θ range of 10–75° [24].

2.2.4. Compressive Strength Test

The standard specimens for the compressive strength test, with sizes of 40 mm × 40 mm × 160 mm, were tested based on ASTM C349 [25]. The specimens were sealed with polyethylene film and kept in a constant temperature and humidity box at 20 °C for 3, 7, and 28 d.

3. Results and Discussion

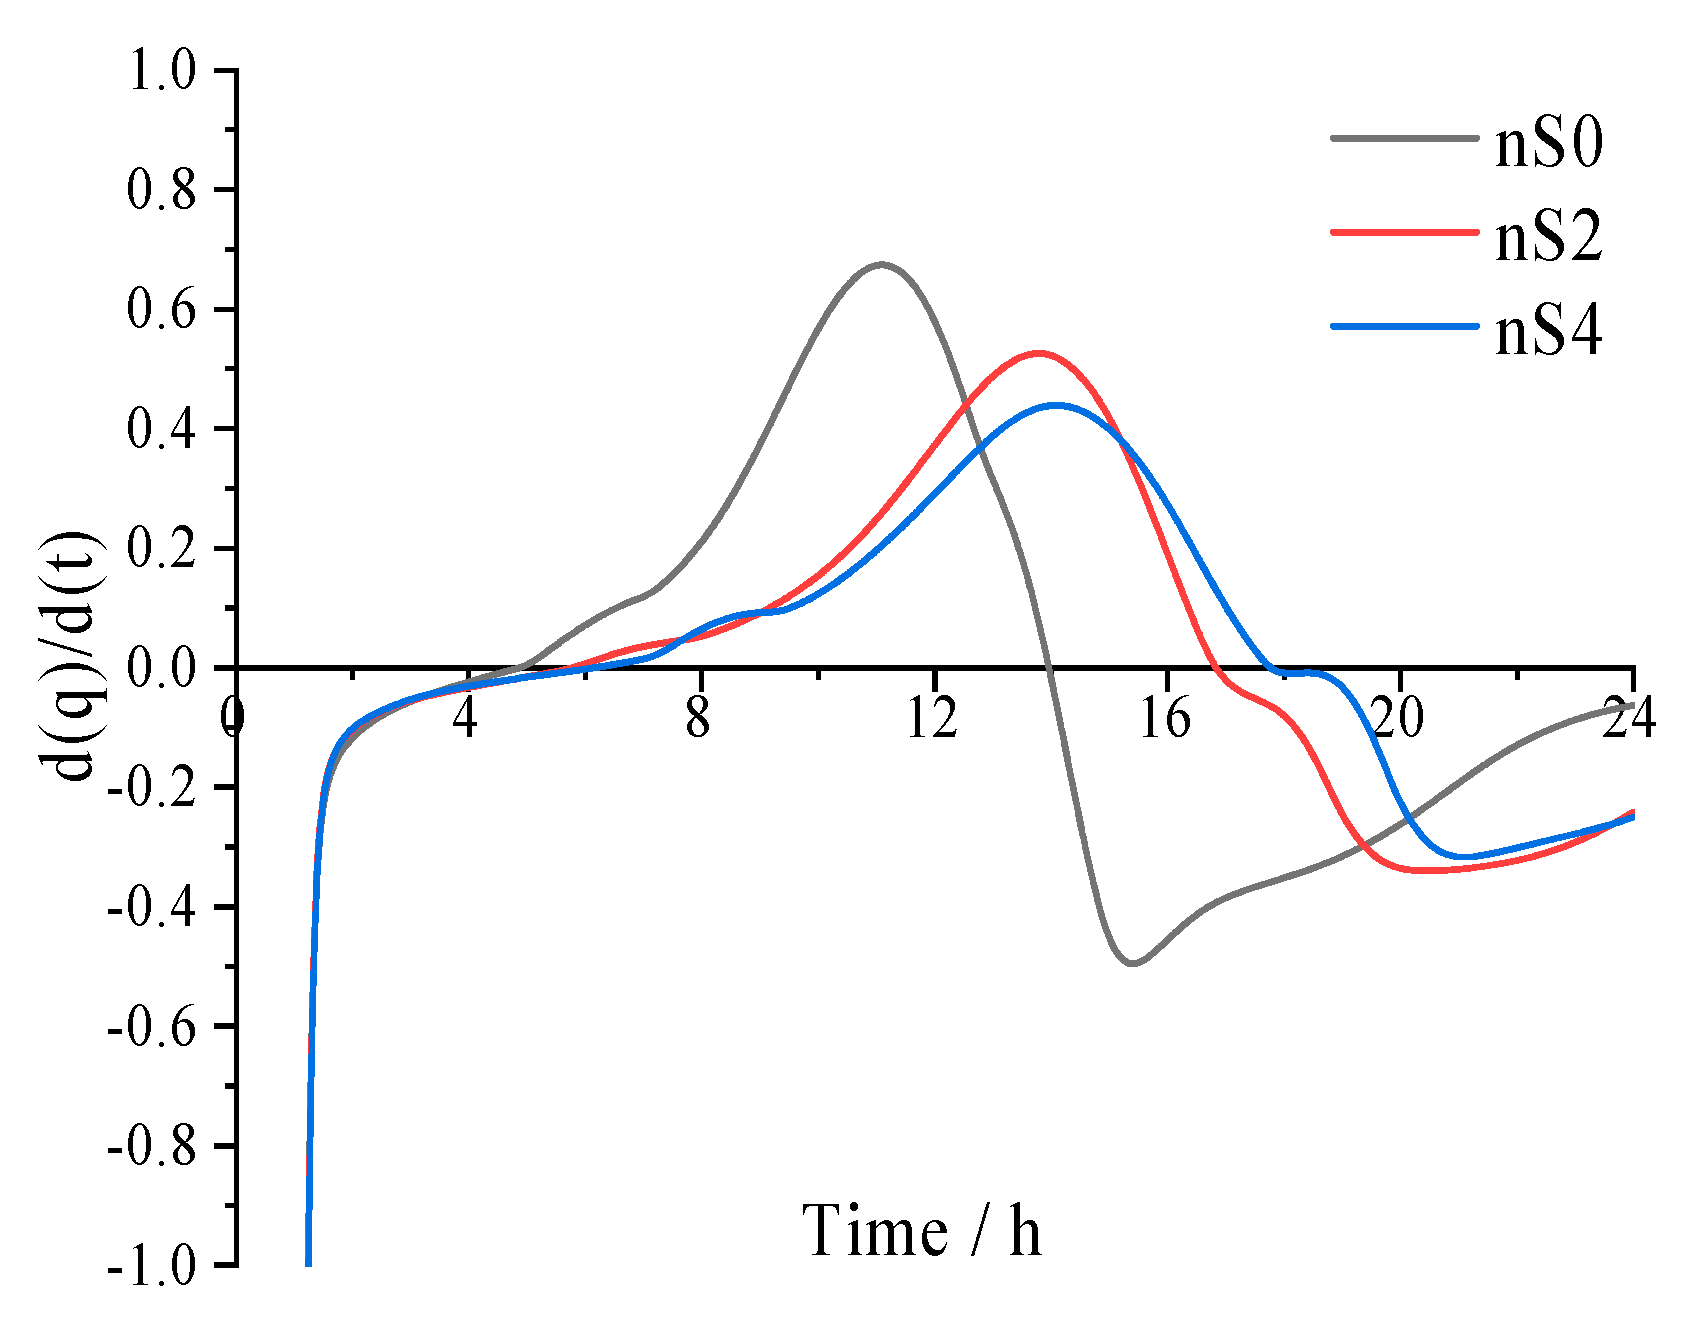
3.1. Isothermal Calorimetry

Figure 2 shows the heat release rate and accumulated hydration heat of the adhesives kept at a temperature of 20 °C for 72 h. nS0 represents the paste without nanoparticles. nS2 and nS4 represent pastes containing nano-silica doped with 2 wt.% and 4 wt.% cement, respectively. Cement hydration involves the initial (pre-induction) period, induction period, acceleration (post-induction) period, deceleration period, and diffusion period [26].
As shown in Figure 2a, the main heat flow peaks appeared in the order of nS0 > nS2 > nS4. The PCE used in this study delayed the binder hydration kinetics in all UHSC systems with its dosage. In the induction period, the appearance of the main hydration peak was delayed and the peak heat flow rate values were suppressed because of the addition of PCE. This behavior occurred because the surface of cement and nS particles was adsorbed by PCE molecules. The surface dissolution and product nucleation sites were inhibited by this adsorption of PCE molecules, resulting in suppression of the hydration kinetics in the induction period [27]. In addition, it can be clearly observed that there were three peaks for nS2 and nS4. The first peak represents a dissolved peak of tricalcium aluminate. The second peak represents an exothermic peak of C3S and other topochemical reactions, and the last peak represents sulphate-type-AFm and C3A rehydration. The formation of three peaks was due to the following three reactions. The first peak, representing initial hydration on the cement particle surface, mainly involved tricalcium aluminate (C3A). However, since the paste was stirred outside the bottle, the first peak was not captured entirely. The second peak was due to the consumption of C3S and other topochemical reactions [28], resulting in the formation of calcium silicate hydrate (C–S–H) and calcium hydroxide (CH). The third distinct peak was due to the formation of sulphate-type-AFm (monosulphate) or due to secondary hydration of C3A with ettringite [29]. This is similar to the experimental results of a previous study [10]. The appearance of monosulphate depends on the gypsum content. After the depletion of gypsum, and AFt is unstable and AFt begins to change into AFm. If the gypsum is depleted in the first 3 days, monosulphate can be formed. The three peaks were still observed in the nS0 specimens. However, due to the proximity of the second and third peaks to each other, the two peaks could not be easily distinguished.
Figure 2b shows the cumulative heat accumulation curve of all UHSCs for 72 h at 20 °C. It can be observed that as the nano-silica was added, the heat released from UHSCs increased significantly, indicating an increase in the hydration phase formation relative to the amount of binder. For example, compared with the heat released from nS0 (145 J/g) at 3 days, nS2 (160 J/g) and nS4 (170 J/g) were observed to increase approximately by 10% and 17%, respectively. It is worth noting that, in the initial period, the amount of heat released from nS2 and nS4 was greater than that from nS0 because of the nucleation effect of nano-silica which promotes cement hydration [30]. However, in the acceleration period, the heat released from nS0 was greater than that from nS2 and nS4. This behavior occurred, because the higher PCE content reduces binder hydration [31], resulting in a decrease in the heat flow rate, making the cumulative heat of the nS0 the highest. Finally, in the deceleration period and diffusion period, the heat release from nS4 was the greatest, followed by nS2, and the heat release from nS0 was the lowest.
The setting time was determined by the first derivative of the heat release rate curve of the specimen [22]. Figure 3 is a typical plot of the first derivative of the heat release rate curve from the original isothermal calorimetry test data. The time at which the first derivative curve reached its maximum value was used to determine the initial setting time, and the increase in calorific value was the highest at this point. After the initial setting time, the first derivative value began to decrease. The time at which the first derivative dropped to zero was defined as the final setting time. The hydration rate reached the highest point at this time.
The obtained maximum values of the first derivative (initial setting time) of nS0, nS2, and nS4 are expressed by ti0, ti2, and ti4, and the values are 11.05, 13.68, and 14.16 h, respectively. The obtained zero values (final setting time) of the first derivative of nS0, nS2, and nS4 are expressed by tf0, tf2, and tf4, and the values are 14.13, 16.74, and 17.65 h, respectively. The setting time results mainly relate to the test methods, concrete mixtures, and curing conditions. Regarding test methods, Hu et al. [22] found that compared with the Vicat needle method (ASTM C191), the setting time determined by the isothermal calorimetry method is much higher. The trend of results from the Vicat needle method was consistent with those from the isothermal calorimetry method [22]. There was a linear relationship between the two methods [22]. Regarding concrete mixtures, Zhang et al. [32] found that polycarboxylate superplasticizers can retard cement hydration and increase the setting time. This is because the surface dissolution and product nucleation sites are inhibited by the adsorption of polycarboxylate molecules, resulting in a delay of the hydration kinetics [33,34]. In summary, due to the combined effect of the testing method and superplasticizer addition, the setting time of UHSC in this study is significantly high (setting time after 11 h). In future research, setting time measurement with a Vicat needle method will be done for UHSC with nano-silica.

3.2. Development of Autogenous Shrinkage, Internal Relative Humidity, and Internal Temperature

3.2.1. Autogenous Shrinkage

The modified deformation measurement set-up was used to investigate the autogenous shrinkage (AS), internal temperature (IT), and internal relative humidity (IRH) of the three groups’ specimens for up to 7 days. nS0 was used to define specimens without nano-silica, and nS2 and nS4 were used to define specimens containing 2 wt.% and 4 wt.% nano-silica in cement.
Figure 4 shows the effect of nS on the development of AS in UHSC. Firstly, the shrinkage rate of all specimens increased from the test start time (final setting time) for 2 days. Secondly, after 2 days, the autogenous shrinkage of nS0 developed very slowly, while that of nS2 and nS4 continued. Although the shrinkage speed of nS2 and nS4 reduced at an early age, it continued to occur. Finally, until 7 days, the autogenous shrinkage strains of nS0, nS2, and nS4 were −738.96, −879.04, and −1002.16 μm/m, respectively. The total shrinkage increased as the nS content increased (in all specimens). The reason for this behavior was the initiation of the pozzolanic reaction, in which nano-silica reacts with Ca(OH)2 to produce more compact and dense C–S–H gel, which leads to a reduction of capillary pores and a refinement of the pore structure of UHSC, resulting in the promotion of high shrinkage [12,16].
The experimental data measured by LVDT show that all three specimens underwent expansion at the beginning (1.2–6.7 h). Expansion and shrinkage were joint occurrences. All small positive peaks are expansions. Expansion occurred due to a combination of the formation of AFm, the internal variable temperature, and water absorption by hydration productions. The main reason for the shrinkage was that binder hydration consumed some of the water and IRH decreased, resulting in self-drying. Macro-phenomena lead to expansion when the factor where the expansion occurs dominates; otherwise, macro-phenomena lead to shrinkage when the factor where the shrinkage occurs dominates [35,36]. Moreover, the expansion of nS2 was more pronounced compared to nS0. However, the expansion of nS4 did not show up more noticeably as the amount of nS increased.

3.2.2. Development of the Internal Relative Humidity, Shrinkage, and Internal Temperature

Autogenous shrinkage occurs without any loss of moisture from the concrete, and it is a microvolume change. Many past studies have introduced the capillary tension theory to explain shrinkage behavior [37]. Capillary water is subjected to surface tension through the curved moon surface, causing volume changes and deformation of the concrete. The decrease in relative humidity in the pore structure causes capillary tension to cause shrinkage stresses, a mechanism that causes the autogenous shrinkage of concrete [38,39].
Figure 5, Figure 6 and Figure 7 show the relationships among the shrinkage strain, internal temperature, and internal relative humidity of all specimens curing to 7 days. The experimental data of IRH and AS of UHSC were analyzed. The trends in the autogenous shrinking of UHSC were divided into two stages, the variable temperature stage (Stage I) and the room temperature stage (Stage II). The dividing point between the two stages occurred after approximately 2 days.
Firstly, in stage I, Figure 2a shows that the maximum hydration rates of nS0, nS2, and nS4 were 3.22, 2.78, and 2.60 mW/g, respectively. As mentioned in the previous section, in order to ensure the same workability, UHSC added with a higher amount of nano-silica requires more superplasticizers, which suppress binder hydration. This trend of the hydration rate values decreasing with an increasing nS content is shown by the IT values (the data can be seen in Figure 5a, Figure 6a and Figure 7a). The maximum IT values of nS0, nS2, and nS4 were 30.51, 29.58, and 28.02 °C (ITnS0 > ITnS2 > ITnS4), respectively.
Secondly, in stage I, the IRH curve peaks of all specimens showed distinct downward peaks in a short time after the final setting time, and the timing at which these peaks appeared corresponded to the highest peak of IT. The three main reasons for this behavior are as follows: The continued occurrence of binder hydration led to a decrease in IRH. Meanwhile, at a higher temperature, water in the ink bottle spaces was released and redistributed as condensed water with the passage of time, resulting in an increase in IRH [40]. The last factor was the greater decrease in the surface tension of the interstitial fluid due to the increased superplasticizer content. The reduction in surface tension resulted in an increase in the IRH [41]. Therefore, the macroscopic expression was a decline in IRH [42].
Thirdly, in stage II, the IRH of all specimens continued to decrease. This behavior was due to the continued binder hydration, which consumed some of the water, resulting in the IRH decreasing. The final IRH value of UHSC at 7 days decreased as the nS content increased, and the final IRH values of nS0, nS2, and nS4 were 88.54%, 87.76%, and 74.19%. The IRH trend of UHSC was consistent with the trend in AS. From the results shown in Figure 5b, Figure 6b and Figure 7b, it is clear that as the content of nS added increased, the AS of UHSC became more significant, and the final IRH value decreased more. The AS values of nS0, nS2, and nS4 were −738.96, −879.04, and −1002.16 μm/m, respectively.
In stage I (initial 2 days), a significant reduction in IRH was exhibited due to the dominant effects of binder hydration and PCE addition. Afterwards, binder hydration continued, leading to an increase IT, and the ink bottle effect became dominant, leading to a rebound in IRH. In stage II, the results shown in Figure 5c, Figure 6c and Figure 7c indicate that AS and IRH had great significant linear relevance for UHSC, regardless of the dosage of nS. In addition, in stage II, the cement paste is at a constant temperature, and the autogenous shrinkage is mainly caused by self-desiccation. Many researchers have reported a linear relationship between the decrease in internal relative humidity and the increase in autogenous shrinkage [41]. Thus, we also chose a linear regression.

3.3. X-ray Diffraction

Compared with 3 and 7 days, the reaction extent of nS at 28 days is much higher, and CH reduction is significant [10]. Thus, XRD analysis was done at the age of 28 days. The XRD patterns of UHSC at the curing age of 28 days are presented in Figure 8. A 2 θ degree angle between 10 and 75 degrees was selected. For concrete with a low water-binder ratio (0.2), a large amount of cement is not hydrated, so XRD analysis found the majority of cement remained non-hydrated. The trend of Ca(OH)2 (CH) consumption was determined by the intensity variation of the main diffraction peaks (A—Alite, B—Belite, P—Portlandite). Compared with nS0, the CH intensities corresponding to nS2 and nS4 specimens decreased. This was due to the pozzolanic reaction of the added nS and CH, which consumed the CH produced by cement hydration [43]. This finding is consistent with that of Ghafari et al. [13], which indicated higher pozzolanic performance in the presence of a higher percentage of nS. In addition, XRD a qualitative analysis method. For the quantitative measurement of CH content, thermogravimetric analysis (TGA) is much better. A TGA should be done in further study.

3.4. Compressive Strength

The test specimen used for the compressive strength test is cement paste. Figure 9 shows the compressive strength of the cubed UHSC specimen with a side length of 50 cm for 3, 7, and 28 days of curing (three replicates were used for each test). It is clear that nS improved the compressive strength of UHSC, regardless of the curing age and dosage of nS. The main mechanisms behind this were the nano-filler effect [44] and the pozzolanic reaction [29]. The addition of nS can partially fill large pores and capillary pores. In addition, the addition of nS reacts with the calcium hydroxide formed by the binder hydration to produce more C–S–H gel [45].
Compared to the control group at 28 days of age, the compressive strength increased by 26.31% with 2 wt.% added, and the compressive strength increased by 30.32 with 4 wt.% added. As the addition of nS increased, the ability of nS to enhance the compressive strength of UHSCs decreased significantly [46]. Similar experimental results have been reported in previous studies [11]. This behavior is most likely due to the fact that excess nS did not contribute significantly to the compressive strength. In addition, because of the high surface energy of nS, the pronounced tendency towards agglomeration reduced the ability to enhance the compressive strength [13].
Figure 10 shows the relationship between compressive strength and the cumulative heat of hydration at 3 days of age for UHSCs. A linear relationship between the compressive strength and cumulative heat of hydration can be clearly observed. The hydration heat came from the chemical reaction of binders, and the compressive strength came from the deposition of reaction products. The essence of hydration heat was found to be closely related to compressive strength development [47].

4. Conclusions

By studying the effects of nano-silica on the autogenous shrinkage, internal relative humidity, internal temperature, and compressive strength of UHSCs, the following conclusions were reached:
  • The isothermal calorimetric data showed that due to the significantly delayed effect of polycarboxylate superplasticizers, the heat flow peaks of each hydration heat appeared in the order of nS0 > nS2 > nS4. Three peaks (dissolved peak of tricalcium aluminate, the exothermic peak of C3S and other topochemical reactions, and sulphate-type-AFm and C3A rehydration) were found in the heat flow curves in all UHSCs. Isothermal calorimetry is used to determine the setting time approximately. The setting time of UHSC specimens was delayed due to the addition of polycarboxylate superplasticizers. A greater amount of polycarboxylate superplasticizers led to more noticeable delayed effects.
  • Total shrinkage increased with an increase in the nano-silica content. All specimens expanded at the beginning of the aging (1.2–6.7 h). The expansion of nS2 was more pronounced compared to that of nS0. However, the expansion of nS4 did not show up more noticeably as the amount of nS increased.
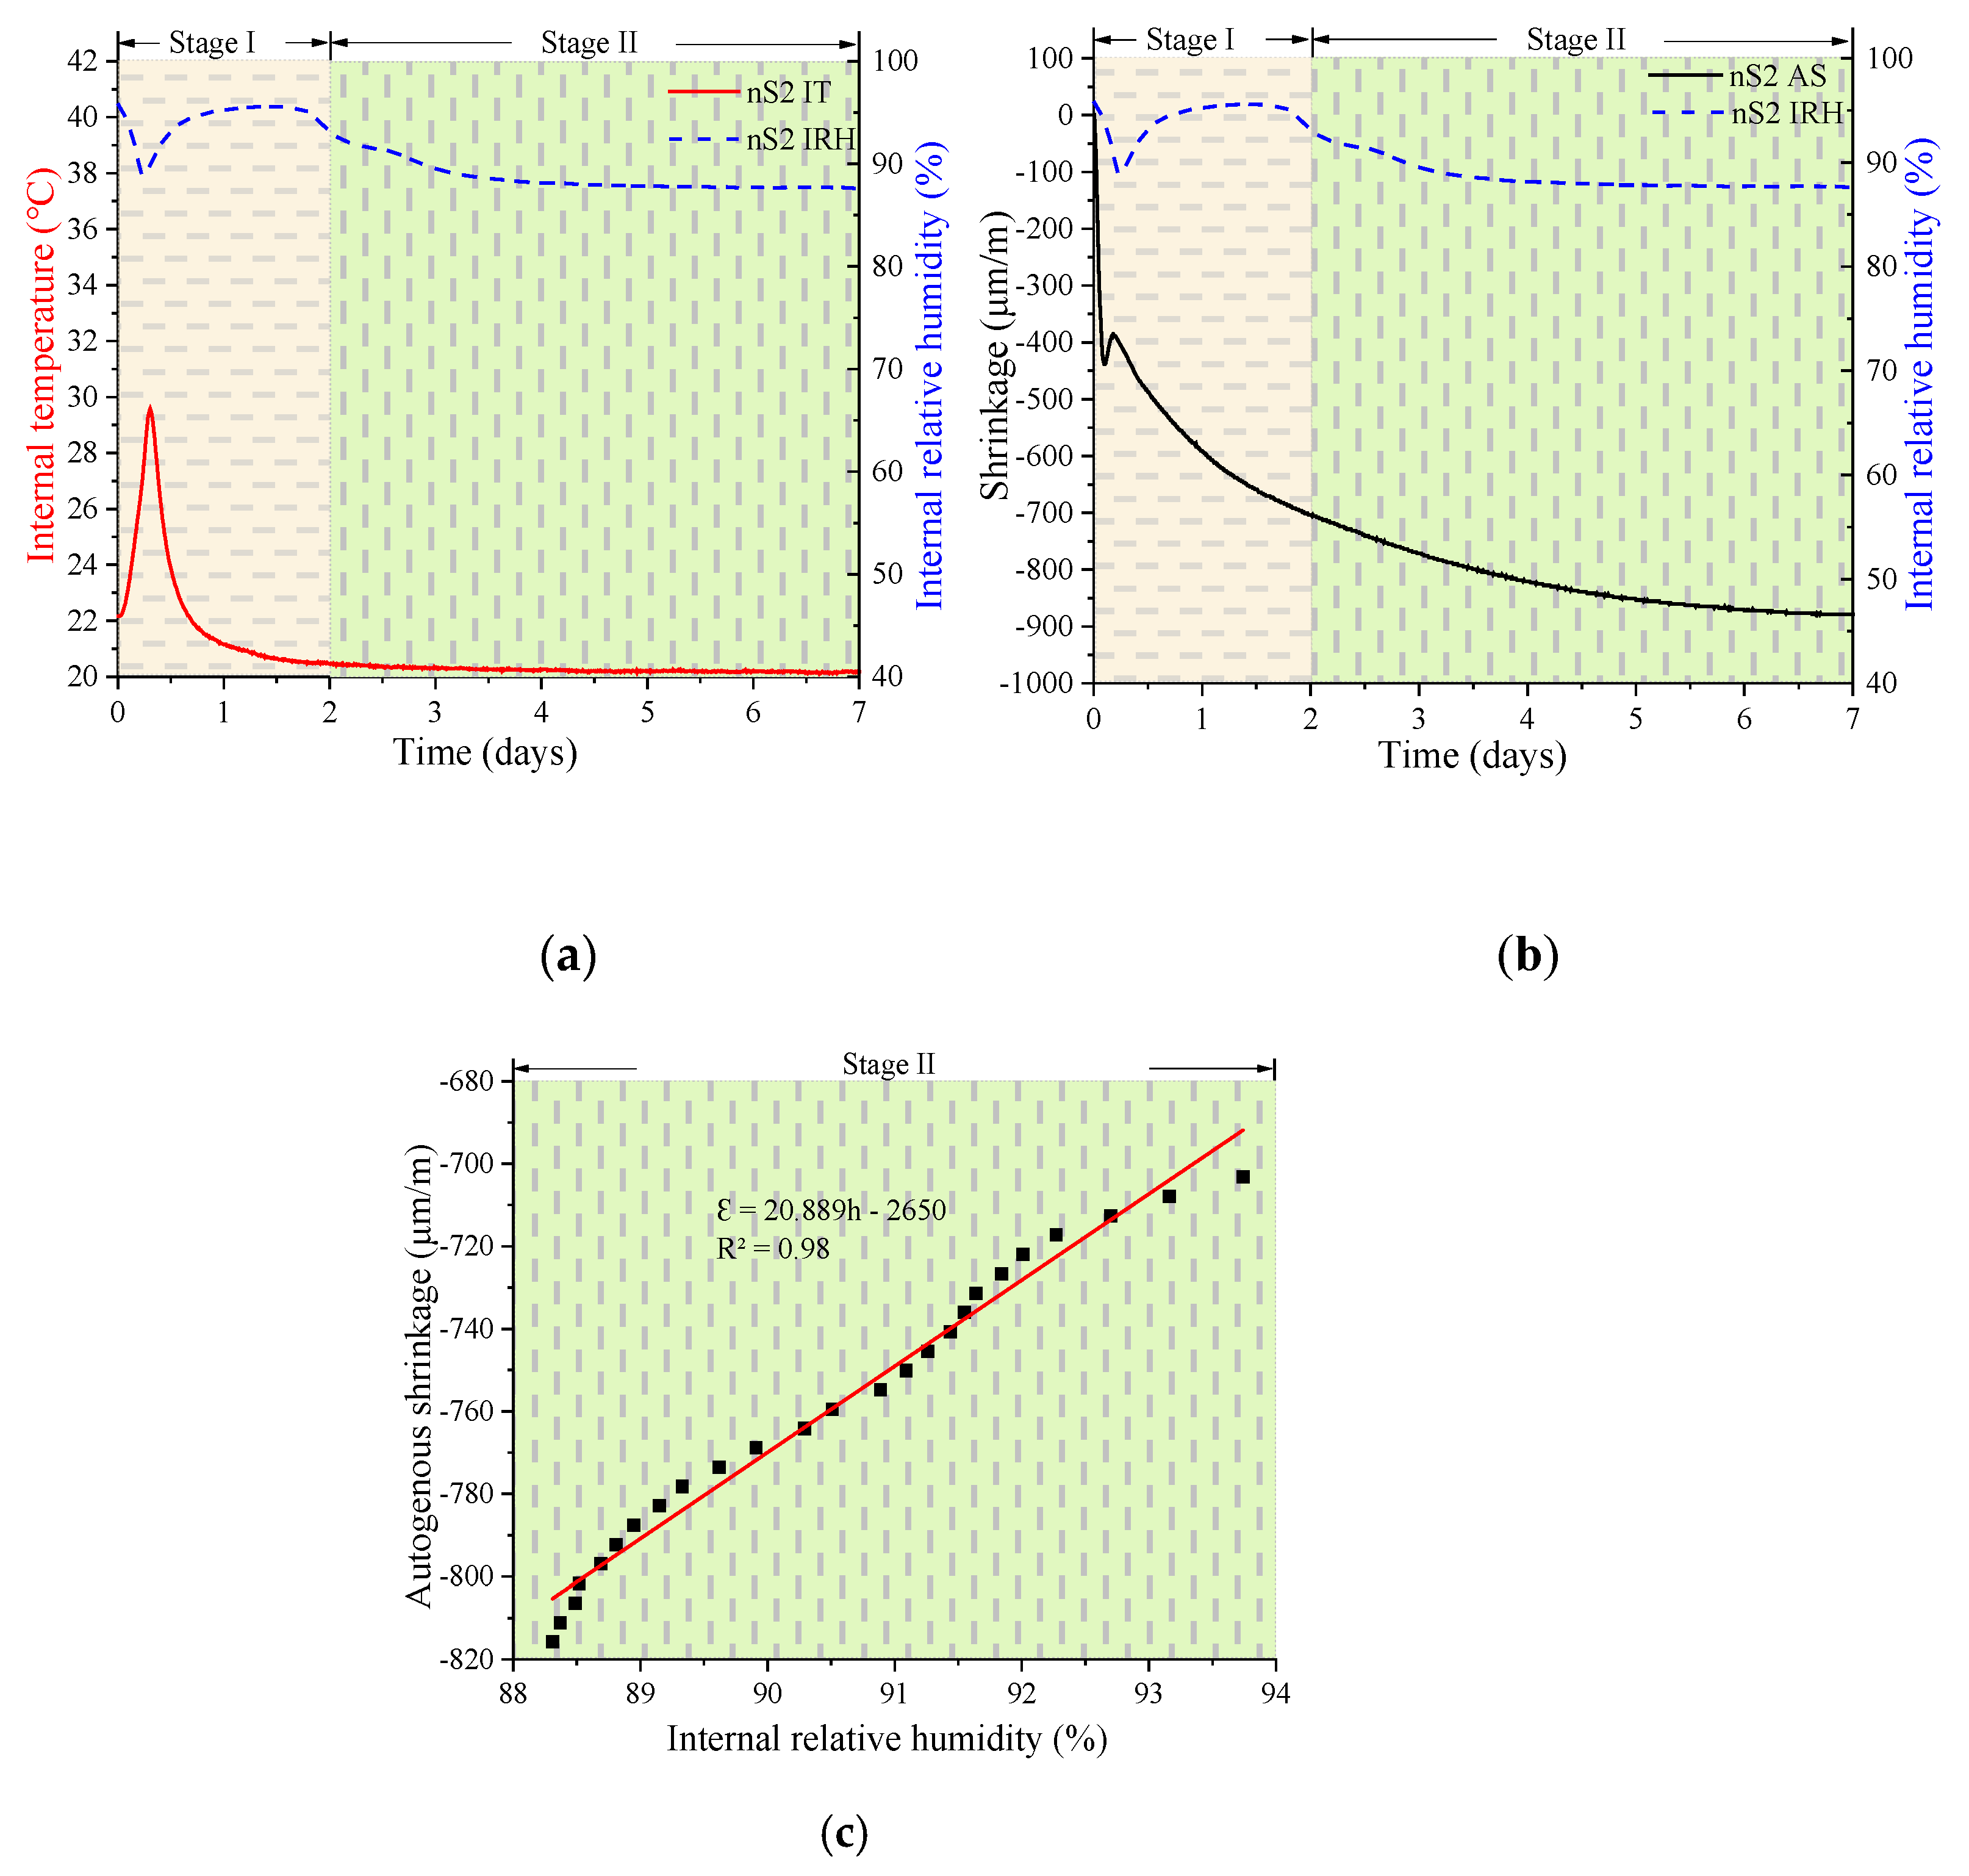
  • The trends in the autogenous shrinking of UHSC were divided into two stages: the variable temperature stage (Stage I) and the room temperature stage (Stage II). The dividing point between the two stages occurred at approximately 2 days. In stage I, the hydration rate values decreased as the nS content increased. The maximum IT values decreased as the nS content increased. The IRH curve peaks of all specimens showed distinct downward peaks in a short period of time, and the timing at which these peaks appeared corresponded to the location of the highest peak of IT. However, in stage II, the IRH of all specimens continued to decrease. The final IRH value of UHSC after 7 days decreased as the nS content increased.
  • At 28 days, XRD analysis showed that compared with nS0, the CH intensity of the nS2 and nS4 specimens decreased. This was due to the pozzolanic activities of the added nano-silica and CH, which consumed the CH produced by cement hydration.
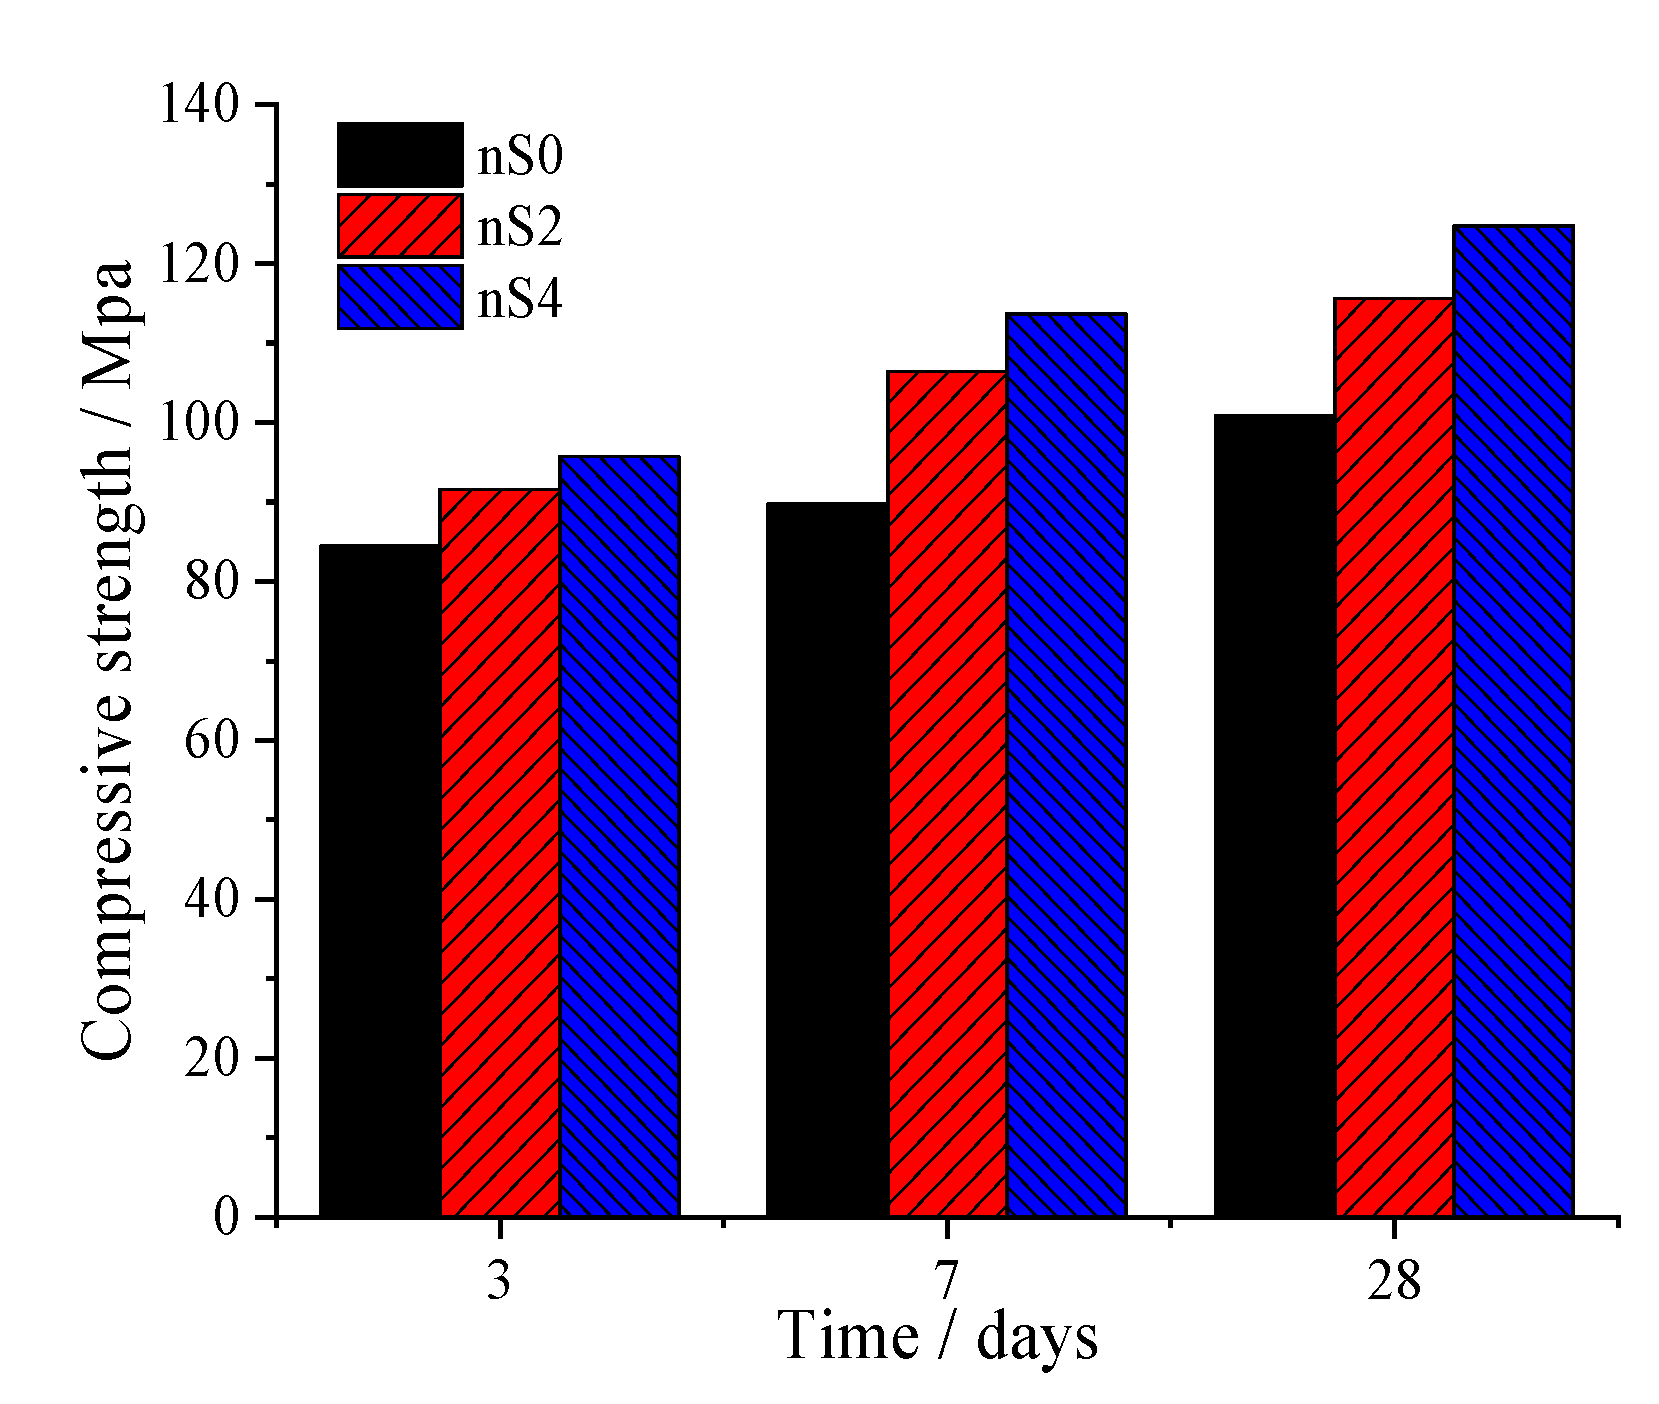
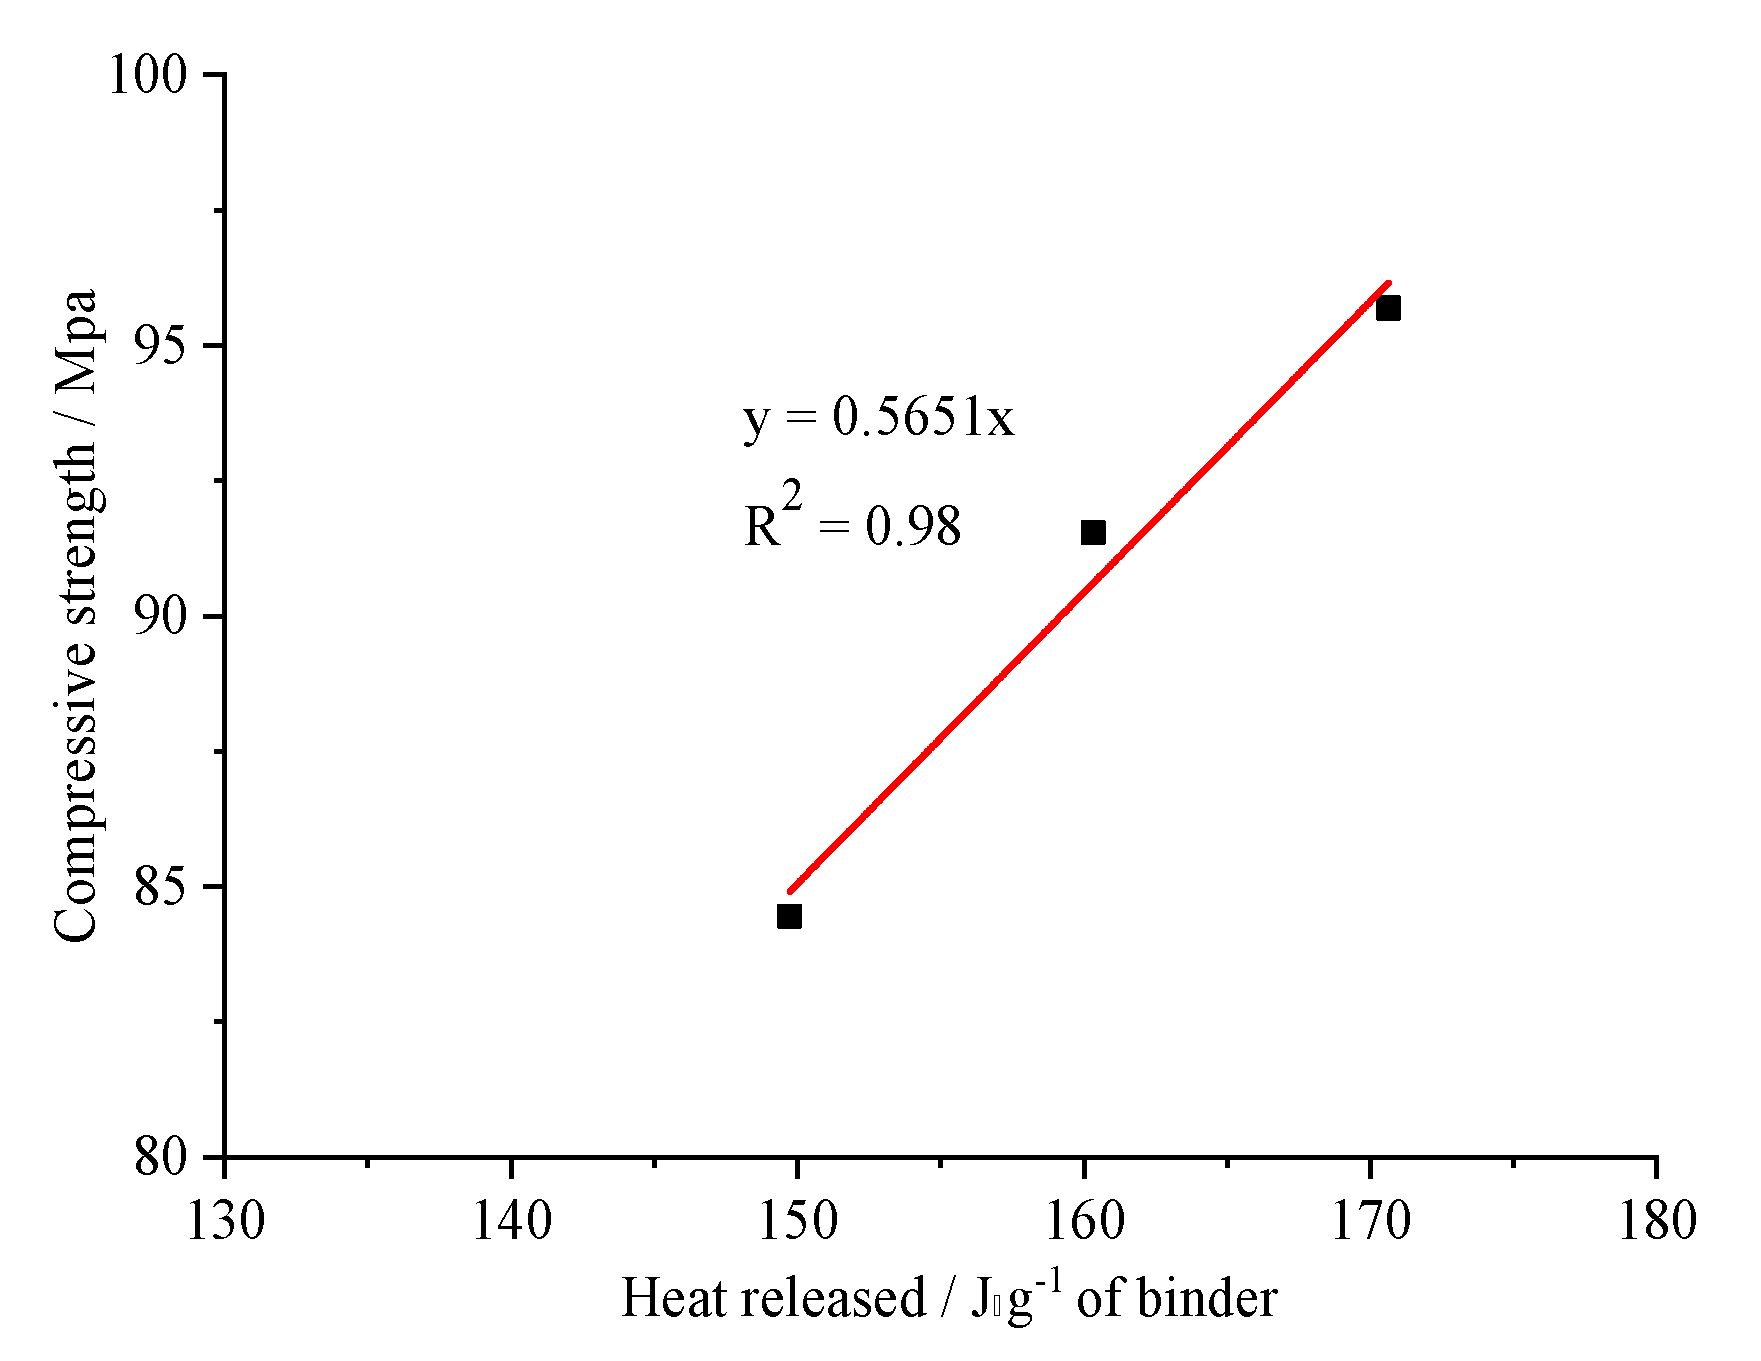
  • Firstly, at 3 days, a linear relationship between the compressive strength and cumulative heat of hydration was clearly observed. Secondly, at 28 days, the addition of 2 wt.% and 4 wt.% nano-silica increased the strength of the specimen by 26.31% and 30.32%, respectively. As the amount of nS added increased, the ability of nS to enhance the compressive strength of UHSCs decreased significantly.

Author Contributions

Data curation, G.-Z.Z. and X.-Y.W.; Formal analysis, X.-Y.W.; Funding acquisition, X.-Y.W.; Investigation, G.-Z.Z. and X.-Y.W.; Methodology, G.-Z.Z.; Project administration, G.-Z.Z.; Resources, H.-K.C.; Software, H.-K.C. and X.-Y.W.; Supervision, G.-Z.Z.; Validation, H.-K.C.; Visualization, H.-K.C.; Writing—original draft, G.-Z.Z.; Writing—review & editing, X.-Y.W. All authors have read and agreed to the published version of the manuscript.

Funding

This research is supported by the Basic Science Research Program through the National Research Foundation of Korea (NRF), funded by the Ministry of Science, ICT and Future Planning (No. 2015R1A5A1037548), and an NRF grant (NRF-2020R1A2C4002093).

Conflicts of Interest

The authors declared that they have no conflict of interest to this work. We declare that we do not have any commercial or associative interest that represents a conflict of interest in connection with the work submitted.

References

  1. Sarma, K.C.; Adeli, H. Cost Optimization of Concrete Structures. J. Struct. Eng. 1998, 124, 570–578. [Google Scholar] [CrossRef]
  2. Chen, W.F. Concrete plasticity: Macro- and microapproaches. Int. J. Mech. Sci. 1993, 35, 1097–1109. [Google Scholar] [CrossRef]
  3. Aitcin, P.C. The durability characteristics of high performance concrete: A review. Cem. Concr. Compos. 2003, 25, 409–420. [Google Scholar] [CrossRef]
  4. Sato, T.; Beaudoin, J.J. Effect of nano-CaCO3 on hydration of cement containing supplementary cementitious materials. Adv. Cem. Res. 2011, 23, 33–43. [Google Scholar] [CrossRef] [Green Version]
  5. Meng, T.; Yu, Y.; Wang, Z. Effect of nano-CaCO3 slurry on the mechanical properties and micro-structure of concrete with and without fly ash. Compos. Part B Eng. 2017, 117, 124–129. [Google Scholar] [CrossRef]
  6. Mohseni, E.; Ranjbar, M.M.; Tsavdaridis, K.D. Durability Properties of High-Performance Concrete Incorporating Nano-TiO2 and Fly Ash. Am. J. Eng. Appl. Sci. 2015, 8, 519–526. [Google Scholar] [CrossRef] [Green Version]
  7. Mohseni, E.; Naseri, F.; Amjadi, R.; Khotbehsara, M.M.; Ranjbar, M.M. Microstructure and durability properties of cement mortars containing nano-TiO2 and rice husk ash. Constr. Build. Mater. 2016, 114, 656–664. [Google Scholar] [CrossRef]
  8. Chithra, S.; Kumar, S.S.; Chinnaraju, K. The effect of Colloidal Nano-silica on workability, mechanical and durability properties of High Performance Concrete with Copper slag as partial fine aggregate. Constr. Build. Mater. 2016, 113, 794–804. [Google Scholar] [CrossRef]
  9. Khaloo, A.; Mobini, M.H.; Hosseini, P. Influence of different types of nano-SiO2 particles on properties of high-performance concrete. Constr. Build. Mater. 2016, 113, 188–201. [Google Scholar] [CrossRef]
  10. Rupasinghe, M.; Nicolas, R.S.; Mendis, P.; Sofi, M.; Ngo, T. Investigation of strength and hydration characteristics in nano-silica incorporated cement paste. Cem. Concr. Compos. 2017, 80, 17–30. [Google Scholar] [CrossRef]
  11. Yu, R.; Spiesz, P.; Brouwers, H.J.H. Effect of nano-silica on the hydration and microstructure development of Ultra-High Performance Concrete (UHPC) with a low binder amount. Constr. Build. Mater. 2014, 65, 140–150. [Google Scholar] [CrossRef] [Green Version]
  12. Ghafari, E.; Arezoumandi, M.; Costa, H.; Julio, E. Influence of nano-silica addition on durability of UHPC. Constr. Build. Mater. 2015, 94, 181–188. [Google Scholar] [CrossRef]
  13. Ghafari, E.; Costa, H.; Julio, E.; Portugal, A.; Durães, L. The effect of nanosilica addition on flowability, strength and transport properties of ultra high performance concrete. Mater. Des. 2014, 59, 1–9. [Google Scholar] [CrossRef] [Green Version]
  14. Li, W.; Huang, Z.; Cao, F.; Sun, Z.; Shah, S.P. Effects of nano-silica and nano-limestone on flowability and mechanical properties of ultra-high-performance concrete matrix. Constr. Build. Mater. 2015, 95, 366–374. [Google Scholar] [CrossRef]
  15. Wu, Z.; Shi, C.; Khayat, K.; Wan, S. Effects of different nanomaterials on hardening and performance of ultra-high strength concrete (UHSC). Cem. Concr. Compos. 2016, 70, 24–34. [Google Scholar] [CrossRef] [Green Version]
  16. Baloch, H.; Usman, M.; Rizwan, S.A.; Hanif, A. Properties enhancement of super absorbent polymer (SAP) incorporated self-compacting cement pastes modified by nano silica (NS) addition. Constr. Build. Mater. 2019, 203, 18–26. [Google Scholar] [CrossRef]
  17. Chen, Y.; Deng, Y.-F.; Li, M.-Q. Influence of Nano-SiO2 on the Consistency, Setting Time, Early-Age Strength, and Shrinkage of Composite Cement Pastes. Adv. Mater. Sci. Eng. 2016, 2016, 1–8. [Google Scholar]
  18. Chen, H.; Xu, Y.; Zhang, D.; Huang, L.; Zhu, Y.; Huang, L. The Influence of Nano-SiO2 and Recycled Polypropylene Plastic Content on Physical, Mechanical, and Shrinkage Properties of Mortar. Adv. Civ. Eng. 2019, 2019, 1–12. [Google Scholar] [CrossRef] [Green Version]
  19. Standard Test Method for Autogenous Strain of Cement Paste and Mortar; ASTM C1698-09(2014); ASTM International: West Conshohocken, PA, USA, 2014. [CrossRef]
  20. Zhang, J.; Wang, Q.; Zhang, J. Shrinkage of internal cured high strength engineered cementitious composite with pre-wetted sand-like zeolite. Constr. Build. Mater. 2017, 134, 664–672. [Google Scholar] [CrossRef] [Green Version]
  21. Stefanidou, M.; Papayianni, I. Influence of nano-SiO2 on the Portland cement pastes. Compos. Part B Eng. 2012, 43, 2706–2710. [Google Scholar] [CrossRef]
  22. Hu, J.; Ge, Z.; Wang, K. Influence of cement fineness and water-to-cement ratio on mortar early-age heat of hydration and set times. Constr. Build. Mater. 2014, 50, 657–663. [Google Scholar] [CrossRef]
  23. Taylor, H.F.W. Cement Chemistry; Thomas Telford Publishing: London, UK, 1997. [Google Scholar]
  24. Lin, R.-S.; Wang, X.-Y.; Lee, H.-S.; Cho, H.-K. Hydration and Microstructure of Cement Pastes with Calcined Hwangtoh Clay. Materials 2019, 12, 458. [Google Scholar] [CrossRef] [PubMed] [Green Version]
  25. Standard Test Method for Compressive Strength of HydraulicCement Mortars (Using Portions of Prisms Broken in Flexure); ASTM C349-14; ASTM International: West Conshohocken, PA, USA, 2014. [CrossRef]
  26. Yuan, B.; Yu, Q.; Brouwers, H. Reaction kinetics, reaction products and compressive strength of ternary activators activated slag designed by Taguchi method. Mater. Des. 2015, 86, 878–886. [Google Scholar] [CrossRef]
  27. Meng, W.; Kumar, A.; Khayat, K.H. Effect of silica fume and slump-retaining polycarboxylate-based dispersant on the development of properties of portland cement paste. Cem. Concr. Compos. 2019, 99, 181–190. [Google Scholar] [CrossRef]
  28. Budnikov, P.P.; Strelkov, M.I. Some Recent Concepts on Portland Cement Hydration and Hardening; Highway Research Board: Washington, DC, USA, 1966; pp. 447–464. [Google Scholar]
  29. Land, G.; Stephan, D. The influence of nano-silica on the hydration of ordinary Portland cement. J. Mater. Sci. 2011, 47, 1011–1017. [Google Scholar] [CrossRef]
  30. Jo, B.W.; Kim, C.H.; Lim, J.H. Investigations on the development of powder concrete with nano-SiO2 particles. KSCE J. Civ. Eng. 2007, 11, 37–42. [Google Scholar] [CrossRef]
  31. Sakai, E.; Kasuga, T.; Sugiyama, T.; Asaga, K.; Daimon, M. Influence of superplasticizers on the hydration of cement and the pore structure of hardened cement. Cem. Concr. Res. 2006, 36, 2049–2053. [Google Scholar] [CrossRef]
  32. Zhang, M.-H.; Sisomphon, K.; Ng, T.S.; Sun, D.J. Effect of superplasticizers on workability retention and initial setting time of cement pastes. Constr. Build. Mater. 2010, 24, 1700–1707. [Google Scholar] [CrossRef]
  33. Plank, J.; Sachsenhauser, B. Experimental determination of the effective anionic charge density of polycarboxylate superplasticizers in cement pore solution. Cem. Concr. Res. 2009, 39, 1–5. [Google Scholar] [CrossRef]
  34. Jansen, D.; Neubauer, J.; Goetz-Neunhoeffer, F.; Haerzschel, R.; Hergeth, W.-D. Change in reaction kinetics of a Portland cement caused by asuperplasticizer—Calculation of heatflow curves from XRD data. Cem. Concr. Res. 2012, 42, 327–332. [Google Scholar] [CrossRef]
  35. Quennoz, A.; Scrivener, K. Interactions between alite and C3A-gypsum hydrations in model cements. Cem. Concr. Res. 2013, 44, 46–54. [Google Scholar] [CrossRef]
  36. Mehta, P.; Wang, S. Expansion of ettringite by water adsorption. Cem. Concr. Res. 1982, 12, 121–122. [Google Scholar] [CrossRef]
  37. Tazawa, E.-I. Autogenous Shrinkage of Concrete, 1st ed.; Japan Concrete Institute: Tokio, Japan, 1999. [Google Scholar]
  38. Holt, E. Contribution of mixture design to chemical and autogenous shrinkage of concrete at early ages. Cem. Concr. Res. 2005, 35, 464–472. [Google Scholar] [CrossRef]
  39. Soliman, A.M.; Nehdi, M.L. Effect of drying conditions on autogenous shrinkage in ultra-high performance concrete at early-age. Mater. Struct. 2010, 44, 879–899. [Google Scholar] [CrossRef]
  40. Ishida, T.; Maekawa, K.; Kishi, T. Enhanced modeling of moisture equilibrium and transport in cementitiousmaterials under arbitrary temperature and relative humidity history. Cem. Concr. Res. 2006, 37, 565–578. [Google Scholar] [CrossRef]
  41. Bentz, D.P.; Geiker, M.R.; Hansen, K.K. Shrinkage-reducing admixtures and early-age desiccation in cement pastes and mortars. Cem. Concr. Res. 2001, 31, 11. [Google Scholar] [CrossRef]
  42. Morin, V.; Tenoudji, F.C.; Feylessoufi, A.; Richard, P. Superplasticizer effects on setting and structuration mechanisms of ultrahigh-performance concrete. Cem. Concr. Res. 2001, 31, 63–71. [Google Scholar] [CrossRef]
  43. Hakamy, A.; Shaikh, F.U.A.; Low, I.-M. Microstructures and mechanical properties of hemp fabric reinforced organoclay–cement nanocomposites. Constr. Build. Mater. 2013, 49, 298–307. [Google Scholar] [CrossRef]
  44. Rong, Z.; Sun, W.; Xiao, H.; Jiang, G. Effects of nano-SiO2 particles on the mechanical and microstructural properties of ultra-high performance cementitious composites. Cem. Concr. Compos. 2015, 56, 25–31. [Google Scholar] [CrossRef]
  45. Madani, H.; Bagheri, A.; Parhizkar, T. The pozzolanic reactivity of monodispersed nanosilica hydrosols and their influence on the hydration characteristics of Portland cement. Cem. Concr. Res. 2012, 42, 1563–1570. [Google Scholar] [CrossRef]
  46. Lee, H.-S.; Lim, S.-M.; Wang, X.-Y. Optimal Mixture Design of Low-CO2 High-Volume Slag Concrete Considering Climate Change and CO2 Uptake. Int. J. Concr. Struct. Mater. 2019, 13, 56. [Google Scholar] [CrossRef]
  47. Wang, X.-Y.; Luan, Y. Modeling of Hydration, Strength Development, and Optimum Combinations of Cement-Slag-Limestone Ternary Concrete. Int. J. Concr. Struct. Mater. 2018, 12. [Google Scholar] [CrossRef] [Green Version]
Figure 1. The internal relative humidity, internal temperature, and deformation measurement set-up. (a) Design drawing; (b) physical object.
Applsci 10 05202 g001
Figure 2. Isothermal calorimetry curves of all UHSCs for 72 h. Heat flow curves (a) and cumulative heat curves (b).
Applsci 10 05202 g002
Figure 3. A typical curve of first derivative of the heat evolution curve (d(q)/d(t)).
Applsci 10 05202 g003
Figure 4. Autogenous shrinkages of UHSCs cast for 7 days.
Applsci 10 05202 g004
Figure 5. Development of the internal relative humidity (IRH) and internal temperature (IT) (a) and autogenous shrinkage (b) with the age of the nS0 specimen. Linear regression results (c) of the IRH and autogenous shrinkage of the nS0 specimen in stage II.
Applsci 10 05202 g005
Figure 6. Development of the IRH and IT (a) and autogenous shrinkage (b) with the age of the nS2 specimen. Linear regression results (c) of the IRT and autogenous shrinkage of the nS2 specimen in stage II.
Applsci 10 05202 g006
Figure 7. Development of the IRH and IT (a) and autogenous shrinkage (b) with the age of the nS4 specimen. Linear regression results (c) of the IRH and autogenous shrinkage of the nS4 specimen in stage II.
Applsci 10 05202 g007
Figure 8. XRD patterns of UHSC casting for 28 days.
Applsci 10 05202 g008
Figure 9. Compressive strength change of UHSCs at 3, 7, and 28 days.
Applsci 10 05202 g009
Figure 10. The linear regression results of heat released and the compressive strength of UHSCs at 3 days of age.
Applsci 10 05202 g010
Table 1. Chemical compositions of cement and nano-silica.
SiO2Al2O3Fe2O3CaOMgOSO3ZnOK2OP2O5Loss
Cement (%)21.956.072.4561.382.802.540.111.580.100.46
Nano-silica (%)99.800.05--------
Table 2. Mix proportion design of ultra-high strength concrete (UHSC).
NumberBinder/%w/bSuperplasticizer/%
CementNano-Silica
nS010000.20.9
nS29820.22.4
nS49640.23.9

