Article

Stabilization of Sand with Colloidal Nano-Silica Hydrosols

1
Department of Civil Engineering, Urmia University, Oroumieh 5756151818, Iran
2
Department of Civil Engineering, National Cheng Kung University, Tainan 701, Taiwan
3
Department of Computing and Engineering, University of East London, London E16 2RD, UK
4
Department of Civil, Structural and Environmental Engineering, Trinity College Dublin, Dublin 2, Eircode D02 Dublin, Ireland
*
Author to whom correspondence should be addressed.
Appl. Sci. 2020, 10(15), 5192; https://doi.org/10.3390/app10155192
Submission received: 20 June 2020 / Revised: 19 July 2020 / Accepted: 20 July 2020 / Published: 28 July 2020

Abstract

:
Colloidal nano-silica (NS) hydrosols are electrochemically stabilized, polymerized amorphous silica in low viscosity solutions, and in the form of hydrated gels, silica globules or pellicles. Compared to applications in concrete technology, the use of silica-based binders for groundwork applications has received little attention. Silica-based hydrosols impose no known direct risks to humans and are generally courteous to the soil health and ecosystem service functions. Their localized impact on microorganisms however needs to be further investigated. To this end, NS hydrosols have a scope for use as an alternative low-viscose material in groundworks. The current understanding of interactions between NS hydrosols and soil (sand) is, however, confused by the limited availability of experimental evidence concerning undrained static flow and large strain behavior. The contributions, presented in this paper, advance the knowledge through experimental testing, molecular modelling, and micro-analytical measurements. Four grades of colloidal NS (1–15 wt.%) were synthesized for grouting medium-dense sub-angular fine siliceous sand specimens. Consolidated-undrained triaxial compression testing was performed on the base and treated sand for isotropic consolidation over the effective stress range 100–400 kPa. Overall, silica impregnation produced improvements in yield and residual undrained shear strengths, restricted unwelcomed impacts of excess pore water pressure, and led to the formation of generally more dilative, strain-hardening behavior. Steady states and static flow potential indices are also studied as functions of confinement level and viscosity of the NS grout.

1. Introduction

Monotonic loading of loose, saturated sand deposits may lead to the abrupt loss of shear strength and, as such, continues to be one of the most challenging problems in ground engineering [1,2]. The sudden strength loss that occurs for undrained conditions is also known as static flow or softening [3,4] and takes place before the effective stress path reaches the failure line. Static flow can have catastrophic consequences in natural and engineered earth systems, such as debris flow in sandy hillslopes. Fine particles in the sand can influence the likelihood and extent of softening, and has received extensive attention; seminal 20th century contributions, include [5,6,7,8]. Nevertheless, the role and implications of fines in loose sands remain somewhat disputed. For instance, Lade et al. [9] reported on the formation of fresh collapsible structures in the sand upon the addition of non-plastic fines. Yamamuro and Covert [10] had reported similar observations, but limited these unwelcomed skeletal structures to certain fines/sand ratio. Contractive response and flow in composite geomaterials were described in earlier works, including [8]. These tied in with reported cases of diminished strength in silty sands [6]. The unwelcomed impacts of the fines content were debated in [11], where the addition of up to 40 wt.% of silica silt to Ottawa Sand was found to reduce the rapid shearing-induced collapsibility. Georgiannou [12] subsequently reported a substantial reduction in brittleness for sands with 2.5 wt.% fines provided that the fines content was non-plastic. A series of more recent investigations have followed, which demonstrate the dependency of stiffness, yield, and the post-yield response of composite granular soils on fines content [13], packing state, as well as the fines’ physicochemical properties [14,15,16].
In making provision for establishing or extending the built settings on loose sands, research into binary geomaterials (saturated sand with various fines contents for the present investigation) led to the development of a diverse range of chemical stabilization techniques. These techniques share uncertainties inherited from the contradictory views on the impacting role of the fines content in sand. Chemical stabilization often causes significant disturbances that include altering the soil structural composition and/or physical properties, changing groundwater flow pathways, modifying the thermal properties of the ground, changing the soil mineralogical composition, and altering geochemical conditions. Furthermore, chemical stabilization invariably disrupts the soil biogeochemical cycles that emerge from the exchange and transport of matter and energy, which are driven by the interaction of the living organisms in the soils, a perspective currently often overlooked by the engineering profession. Among the plethora of chemical agents, siliceous-based grouts have minimal detrimental effects on ground functions. Hydrated sodium silicate (Na2O.nSiO2, 0.06–0.203 g/cm3 density) was employed by Kaga and Yonekura [17] for stabilization of five sands of diverse gradations, with emphasis on the role of sand relative density (Dr—that is, a packing proxy parameter) on strength of the composites. In examining the reduction in erodibility of standard-Proctor compacted medium silica sand for treatment using 1–4 wt.% NS additive of 11–13 nm particle size, Zomorodian et al. [18] reported a six-fold improvement in hydraulic erosion resistance for the optimum performing concentration of 1.5 wt.% NS achieved after a remarkably short one-day curing. Kodaka et al. [19] used a low-viscose solution of colloidal silica (4 wt.% silica), with mean particle size, D50, of 10 nm, to stabilize poorly-graded Toyoura sand (D50 = 0.2 mm) for demonstration of the remarkable role of nano-particles in eliminating liquefaction and collapsibility potentials investigated under cyclic torsional stress conditions. Tsukamoto et al. [20] combined Toyoura sand (D50 = 0.17 mm) with 6 wt.% silicate-based solution (i.e., acid silica sol) for investigation of enhanced undrained cyclic resistance as a function of small- and large-strain stiffnesses. A series of more recent works on the use of colloidal silica (aqueous silica nano-particles) have followed, as grout in soils ranging from liquefiable sands [21,22,23,24] to kerosene-contaminated sandy clay [25].
The present investigation demonstrates findings from a series of monotonic undrained triaxial compression tests to study the impact of NS-treatment on the static flow (i.e., static liquefaction) of saturated medium-dense clean angular sands, and to determine the steady-state parameters. Through a control on the normality of saline solution and pore water temperature, the gelation time was lowered to attain coagulated rounded porous hydrated silica flocs at constrictions between neighboring sand grains. The specimen shearing continued to reach or closely approach the critical state, leading to the development of a novel critical state soil mechanics (CSSM) framework for NS-treated sands. The impact of sand and silica-floc size, and shape are discussed b contrasting macro-scale findings with those of standard Toyoura and Fujian sands, and also through qualitative particle-scale events. The latter gains stimulus from two directions. Firstly, the informed design of NS grouts for groundworks is relevant. For instance, in the context of the well-established passive-site stabilization technique [22], substantial decrease in vertical strains (from the 2–2.5% levels expected in untreated sands to 0.1–0.3% in NS-mediated sands) upon dynamic motions offer remarkable liquefaction resistance, but ground motion amplifications in certain depths continue to pose restrictions to the feasibility of the method. The local excessive amplifications mark potential degradation in sand particles’ adhesion (following grout injection) and possible incomplete gelation of NS grouts. Shape and size of sand grains and silica flocs, as well as soil structure and packing state, play pivotal roles within the mechanisms that leads to NS gelation. To have a better control on induction and gelation time that satisfies the intended grout reach and homogeneity, while retaining the ecosystem service provision. Engineers will have to face the challenge of adopting material compositions and implementation methods in an informed manner, possibly by gaining particle-level insight. Secondly, discussion of particle-level events could be used for predictive purposes. In the context of multi-modal soils, e.g., NS-mediated sands, predicting stress paths that could lead to static flow and the problematic progressive loosening can be of interest in design of more resilient engineered subgrades, embankments, and flood defense systems. For engineered sands, stress-strain response and mechanisms controlling the onset of flow and critical state are most complex, but can be intuited from particle-scale insights.
This study is an investigation as to what extent the mechanical behavior (under axial-symmetric stress conditions) of the sand compares, with the mixtures providing evidence of the influence of the structure of the materials on their mechanical response. The main emphasis is on the post-yield response of the test materials. The findings from this work will be of particular interest to practitioners with an interest in employing NS grout for remediation of distressed sandy earth systems.

2. Materials and Methods

2.1. Material Properties

Testing materials contained one type of sand and four grades of colloidal NS solution, giving four binary mixtures. The base sand was the Firoozkuh 161 (F161) sand, predominantly siliceous (SiO2 > 96%, Fe2O3 = 0.2–0.7%, Al2O3 = 0.5–1.6%, CaO = 0.2–0.5%, Na2O = 0.03–0.08%, K2O = 0.03–0.10%) and comprising of angular to sub-angular particles. Firoozkuh sand is the Iranian standard sand. The F161 sand is a product of frost shattering and erosion of parent granitic rocks from the Alborz mountain range, Iran. Subsequent fluvial transportation through local river systems has rendered the sub-angular particle shape and well-sorted gradation to the sand.
The colloidal silica used was predominantly siliceous, in the form of 30 wt.% silica aqueous solution (hydrosol), with sodium oxides forming its second largest chemical compound type. Upon precipitation in ambient laboratory conditions, hydrosols form porous flocs with rounded shape and regular geometry. The gradation parameters and grain-scale properties were captured for the two components and are discussed in the next section.

2.1.1. Grading, Shape and Texture

The particle- and mode-size distribution curves for the F161 sand, as determined from dry sieving in compliance with BS1377-2 [26], are presented in Figure 1, with the material’s deduced gradation parameters summarized in Table 1. F161 sand is a bimodal, moderately-well sorted fine sand, with D50 = 0.23 mm. In Figure 1b, the first and second pronounced modes for F161 sand are 0.24 and 0.50 mm, respectively. The minimum and maximum void ratio (emin, emax) measured in accordance with ASTM D4253 and D4254 were 0.548 and 0.943, respectively. The gradation properties of the NS material were provided by the manufacturer, ISATIS Group, with its D50 range reported as 11–16 nm. Figure 2 shows the shape and texture of the sand grains and precipitated hydrosols, as evidenced from secondary electron-microscopy images.
To clear the sand from organic matters and carbonates, it was first treated with 0.5 N (Normality) HCl solution (150 mL acid diluted with distilled water to produce a total volume of 800 mL), then thoroughly washed with distilled water and treated with a 35 wt.% H2O2 solution. Next, the sand grains were washed with distilled water, dried at 40 °C for 24 h and a random subset of them chosen for microscopy analysis.
Particle shape was quantified in terms of sphericity and roundness, employing the methods introduced in Wadell [27]. Sphericity (S) is a measure of convergence of the particle dimensions in the three-dimensional coordinate system, and can be estimated as a function of r m a x i n , the radius of the largest sphere inscribing the particle, and also r m i n c i r , the radius of the smallest sphere circumscribing the particle:
S = r m a x i n r m i n c i r
Particles with highest sphericity (i.e., approaching unity) contain minimum eccentricity and platiness. Roundness (R), a measure of surface features and scale relative to the particle radius, can be estimated as a function of the equivalent particle radius ( r i ), the average radius of surficial features, and N , the number of surficial features:
R = r i N r m a x i n    
Angular particles have the minimum roundness index. The shape parameters for the F161 sand and precipitated hydrosol flocs (i.e., hydrated amorphous silica) are listed in Table 1 and Table 2.
The roundness and sphericity of F161 sand is much lower than that of the NS flocs. The roundness implies quick precipitation of silica and that colloidal NS particles probably polymerize in the pore-void solution and then settle (at constrictions between neighboring sand grains) in the form of coagulated porous hydrated gel. The adjustments adopted for, and the implications of, the imposed quick precipitation rate are further discussed later in the paper.

2.1.2. Geochemistry of Colloidal NS

The NS, which is used to construct the binary mixtures was a low viscose (5.5 cP [1 cP = 1 mPa-s]) colloidal material with a pH of 10, and density of 1.1 g/cm3 at 20 °C. Distilled water was added to the hydrosol to form four grades of NS solution at 1%, 5%, 10%, and 15% by weight and sol viscosity slightly above 1 cP. The solutions were then combined with electrolyte (sodium chloride) and hydrochloric acid to adjust the pH level at pH of 6 and ionic concentration at 0.03 N. Once blended with the electrolyte (i.e., saline solution), deprotonation of the hydroxyl tail of Si-O-H chains (i.e., silanol) led to the liberation of H+ ions and generation of a net surficial negative charge. The consequent repulsive forces detached nano-particles until the pH of solution progressively decreases to near neutral levels (pH of around 6). As repulsive forces relaxed, free silicon ions reacted with deprotonated silanol compounds to form strong Si-O-Si siloxane bonds and led to the subsequent setting into a firm gel. Generally, the rate of gelation depends on the rate of siloxane formation and hence the volume of added saline solution (i.e., normality), pH of solution and temperature of pore water. This adopted adjustment generated a favorable condition for quick polymerization of the sol.
The gel time was specified as the time required for the viscosity to increase from an initial 1 cP, at which state the viscosity is understood to exponentially increase. The gel time for 10% NS solution in ambient conditions was found, using try and error, to be in the 570 ± 20 minute range. This is generally consistent with previous similar attempts [28]. Treated sand specimens were permitted to cure at constant moisture and temperature conditions of 21 °C for a predetermined 24-h period ahead of shear testing. The chemical composition of the colloidal NS was studied using X-ray fluorescence analysis, with the results presented in Table 3. LOI in Table 3 is loss in dry mass on ignition at 440 °C.

2.2. Specimen Preparation

A series of undrained triaxial compression tests was conducted on reconstituted base sand and binary test specimens to study their shear responses as a function of NS content. Double-split-type molds, 36-mm diameter and 80 mm high, were used to prepare the sand specimens. A rubber membrane was first placed (stretched) over the inner wall surface of the mold and secured against it by applying vacuum pressure. Air-pluviation was used to form the initially metastable loose to medium-dense sand specimens. This method has been successfully used to minimize grain segregation and leads to formation of homogeneous metastable random packing [29,30,31]. The air-dried sand was poured from a constant height (~10 mm drop) into the specimen mold. Through tapping of the mold’s outer wall surface, identical uniform specimens were formed to various targeted relative density values. When set up in the triaxial cell apparatus, full saturation was achieved by flushing gaseous carbon dioxide and de-aired water upwards through the membrane-enclosed sand specimens via the triaxial base pedestal. For practical purposes, a pore pressure coefficient B value of 0.96 was deemed enough to represent the specimen state of full saturation. With respect to the treated specimens, the NS solution was allowed to permeate upwards through the saturated specimen via the bottom drainage line of the base pedestal. A small backpressure of 10 kPa was applied to facilitate the grout movement. The specimens were retained within the double-split mold to avoid disintegration during the grouting process. A grout volume equivalent to three times the volume of the specimen pore voids was flushed into each specimen to maximize grout reach. When the solution was exposed to air, the grout gel time was approx. 60–90 min; nevertheless, to ensure the formation of cementation bonds, grouted specimens were allowed to cure for a 24-h period at constant temperature of 25 °C. Following curing, the split mold and rubber membrane were removed, and the post-treatment specimen height and mass were recorded. Treated specimens were then carefully placed back on the base pedestal, resealed inside the rubber membrane, and a 20 kPa confinement pressure applied. Figure 3 shows the general triaxial apparatus set-up used in this study.

2.3. Isotropic Consolidation and Undrained Compression Testing

The saturated sand specimens and four binary mixtures (1%, 5%, 10%, and 15% NS) were isotropically consolidated to four target mean effective stresses (pc) of 100, 200, 300 and 400 kPa in the triaxial apparatus. The consolidation stage was followed with strain-controlled undrained compression employing an axial displacement rate of 1 mm/min, which was deemed suitable in minimizing creep deformations. A submersible load cell located inside the triaxial cell chamber monitored the deviatoric force imposed along the specimen axis. Peak and post-peak responses were captured in the form of stress path and stress-strain traces. The testing program is summarized in Table 4, listing the relative density, NS content, mean effective stress achieved at the end of the consolidation stage (i.e., pc), and corresponding void ratio (ec), for each test specimen.
In Table 4, the Test ID gives the specimen NS content in brackets, followed by pc value applied; for example, S(15):200 stands for an F161 sand specimen grouted with 15 wt.% NS that was isotropically consolidated to pc = 200 kPa. The void ratio at the end of the consolidation stage was determined for each specimen from its measured consolidation volumetric strain and water content determined at the end of the compression stage, which, when it was undrained, was the same as that occurring at the end of the consolidation stage.

2.3.1. Variation of Packing with NS Content

The post-consolidation void ratio and relative density are reflections of the specimen packing state and flow potential of the various binary mixtures. In Graton and Fraser packing system and three-dimensional (3D) Euclidean space, all specimens investigated possess a loose 600 body-centered cubic packing (i.e., each unit cell comprising of 6 square sides) to fairly loose 402 packing (i.e., each unit cell comprising of 4 square sides and 2 rhombohedra sides) state [32]. There is a relatively short route between the 600 and 402 packing states, which essentially encompasses typical collapse through hydro-consolidation or application of modest stress for any granular metastable form (dune sand and loess, and here extended to medium dense sand) from initial void ratios as high as 0.9 to a value of approx. 0.6 [33]. This implies a fairly large collapse potential remains for the sand specimen’s post-treatment, a common case in remediation of problematic soils when a proppant is very slowly flushed into the soil’s open pore-network. In the next few sections, the extent of this ‘residual’ flow potential is measured and discussed in form of scale-dependent events.
For both base and treated sand specimens, Figure 4 presents the variation of the post-consolidation void ratio (ec) with mean initial effective stress (pc) for the four levels of isotropic consolidation pressure investigated. From Figure 4, it is evident that for pc = 100 kPa, the variation in NS content over the 0–15% range produced the sharpest drop in the void ratio, demonstrating the pronounced role of silica flocs in facilitating the consolidation; i.e., the higher the fines content, the lower the post-consolidation void ratio and the denser the packing state (higher Dr). This marks the transition from the 600 and 402 packing state through sand particles’ contact modification. For pc = 200 kPa, the variation in NS content over the 0–15% range produced marginal changes in post-consolidation void ratio—that is, ε v = ( e S ( 0 ) : 100 e S ( 15 ) : 100 ) / ( 1 + e S ( 0 ) : 100 ) = 0.56 % . This marks a packing state where the direct interlocking between sand grains diminishes the impact of silica flocs in consolidation volumetric change. As the effective stress increases beyond 200 kPa, only a modest rise in the ε v was recorded with increasing NS content. This suggests that silica flocs regain control on the packing state during consolidation.
Overall, the compressibility increases with NS content and pc, and does not appear to decrease as specimens become denser. The latter marks a fundamental difference between sand-silt composites and sand-NS composites. Using the Mai Liao silty fine sand deposits in western Taiwan as an example, the fines content can vary from 0% to 50% and compressibility decreases with increasing fines content because it produces denser specimens.
In the present investigation, the air-pluviation method employed in preparing the test specimens led to the formation of an initial open packing. Polymerized NS flocs tend to accumulate at grain contact points. Flocs form interparticle bridge and buttress units, shield the sharp particle asperities and enhance the apparent cohesion (elaborated in following sections). For low initial mean effective stresses (100 kPa), interparticle silica flocs benefit from lower confinement levels and facilitate the rearrangement of sand particles. At 200-kPa effective stress, rearranged sand particles directly engage with one another through interlocking. As the mean effective stress increases beyond 200 kPa, a cohort of flocs consolidate, leading to sand particle-to-particle contact modification and structural collapse. This produces a more pronounced reduction (against levels seen at 200 kPa effective stress) in void ratio. In other words, the mobilized interparticle forces upon isotropic consolidation reach their maximum possible level for pc ≈ 200 kPa. The mechanical implications of this particle-level phenomenon are discussed in the following sections.

2.3.2. Steady States in Sand

On the undrained shearing, medium dense to loose sands, under moderate to low confining pressure, initially contract and then dilate at larger strains and as static shear stresses increase. Liquefaction (i.e., static flow or static limited flow) occurs as shear stress increases beyond the residual shear strength. This stress dependent transition from an initial compressive to dilative behavior takes place along a ‘phase transformation’ (PT) line in the stress space. The location of the PT line is dependent on minor and intermediate principal stresses and the sand’s relative density [34]. On the q p plane, phase transformation occurs where the effective stress path changes in direction; i.e., at the axis point of curvature where the mean effective stress ( p ) decreases to its minimum value (see Figure 5a).
Taking ‘steady state’ as the state of deformation under constant stress components [35,36,37,38], the PT point can be regarded as a ‘steady state’. In the literature, this state is broadly referred to as the quasi-steady state (QSS), where post-peak deformations take place under constant p . The QSS is followed by the ultimate steady state (USS). For loose sands and low confinement levels, the QSS occurs at minimum shear stress (principal stress difference, q′) (see Figure 5b and also the paper by [38]). A course of strain hardening normally follows the QSS, unless the sand is at reasonably large levels of initial effective confining pressure (or in a very loose state). In this case, no post-peak hardening develops, and the minimum stress state evolves into the critical steady state (CSS). Given the dry deposition sample-preparation method, employed in the present investigation, the test specimens fall in the medium dense sand category, as confirmed by the post-consolidation void ratios reported in Table 5.

3. Undrained Shear Behavior for Binary Mixtures

A series of undrained triaxial compression tests was performed on the base and treated sand specimens, investigating 1%, 5%, 10% and 15% NS contents. The specimens were sheared monotonically by axial compression to >40% axial strain in order to reach or closely approach the critical state. Table 5 presents a summary of the testing program and steady states.
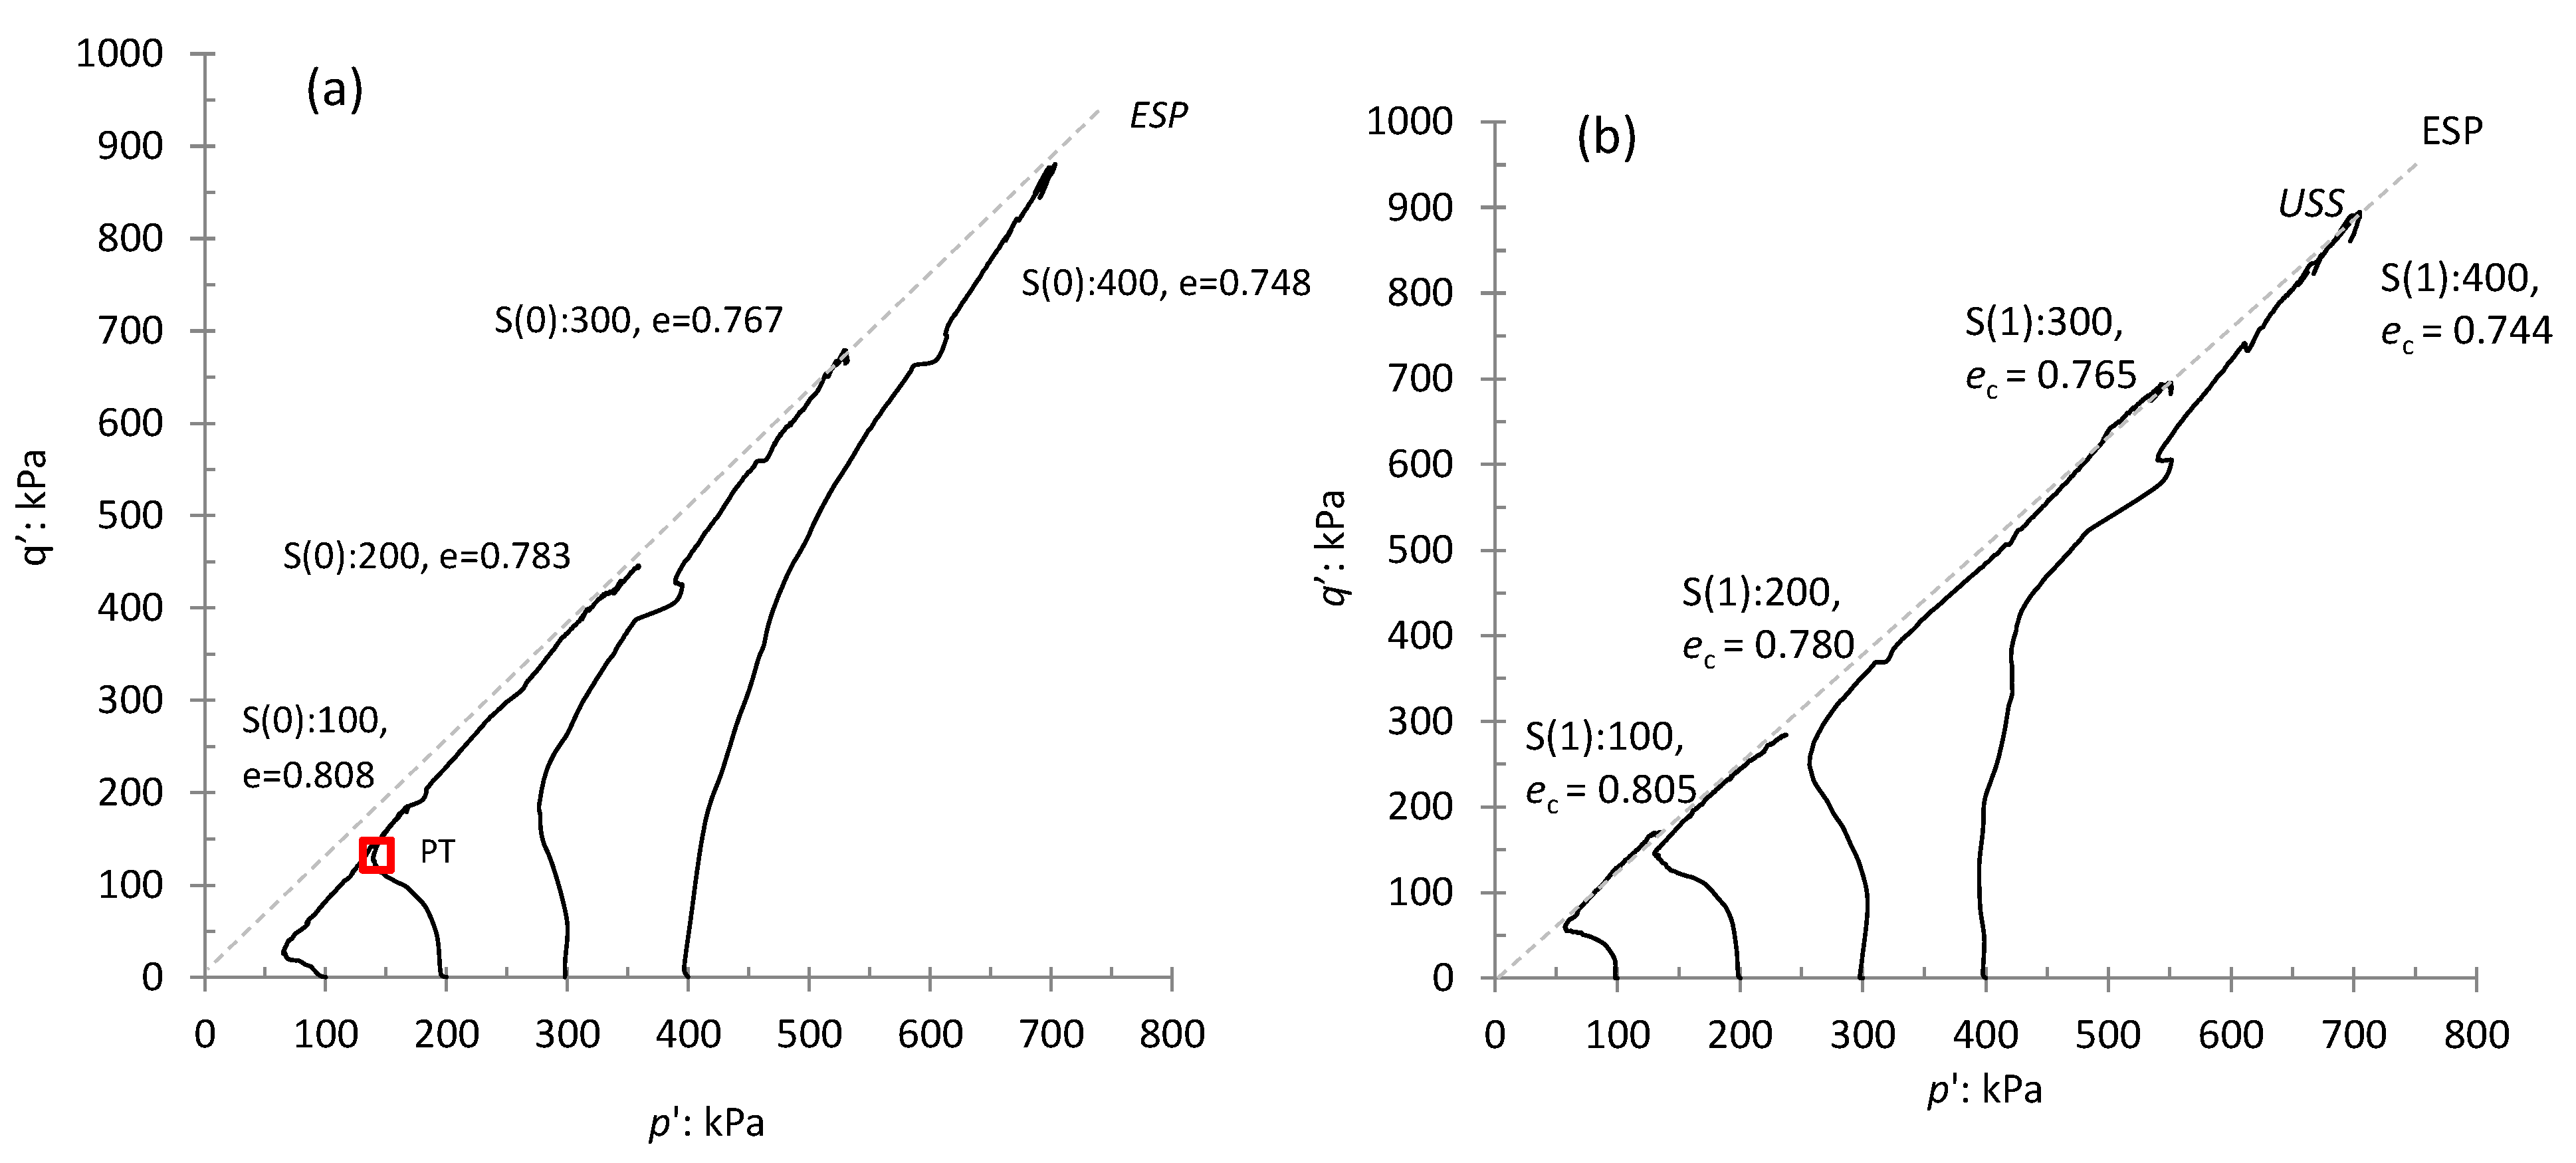
Figure 6 shows the shear responses in the q p plane of the base sand and four NS-treated sand mixtures. Stress paths are plotted for four initial mean effective stresses ( p c = 100–400 kPa), with the post-consolidation void ratio (ec) adopted as the basis for comparison.
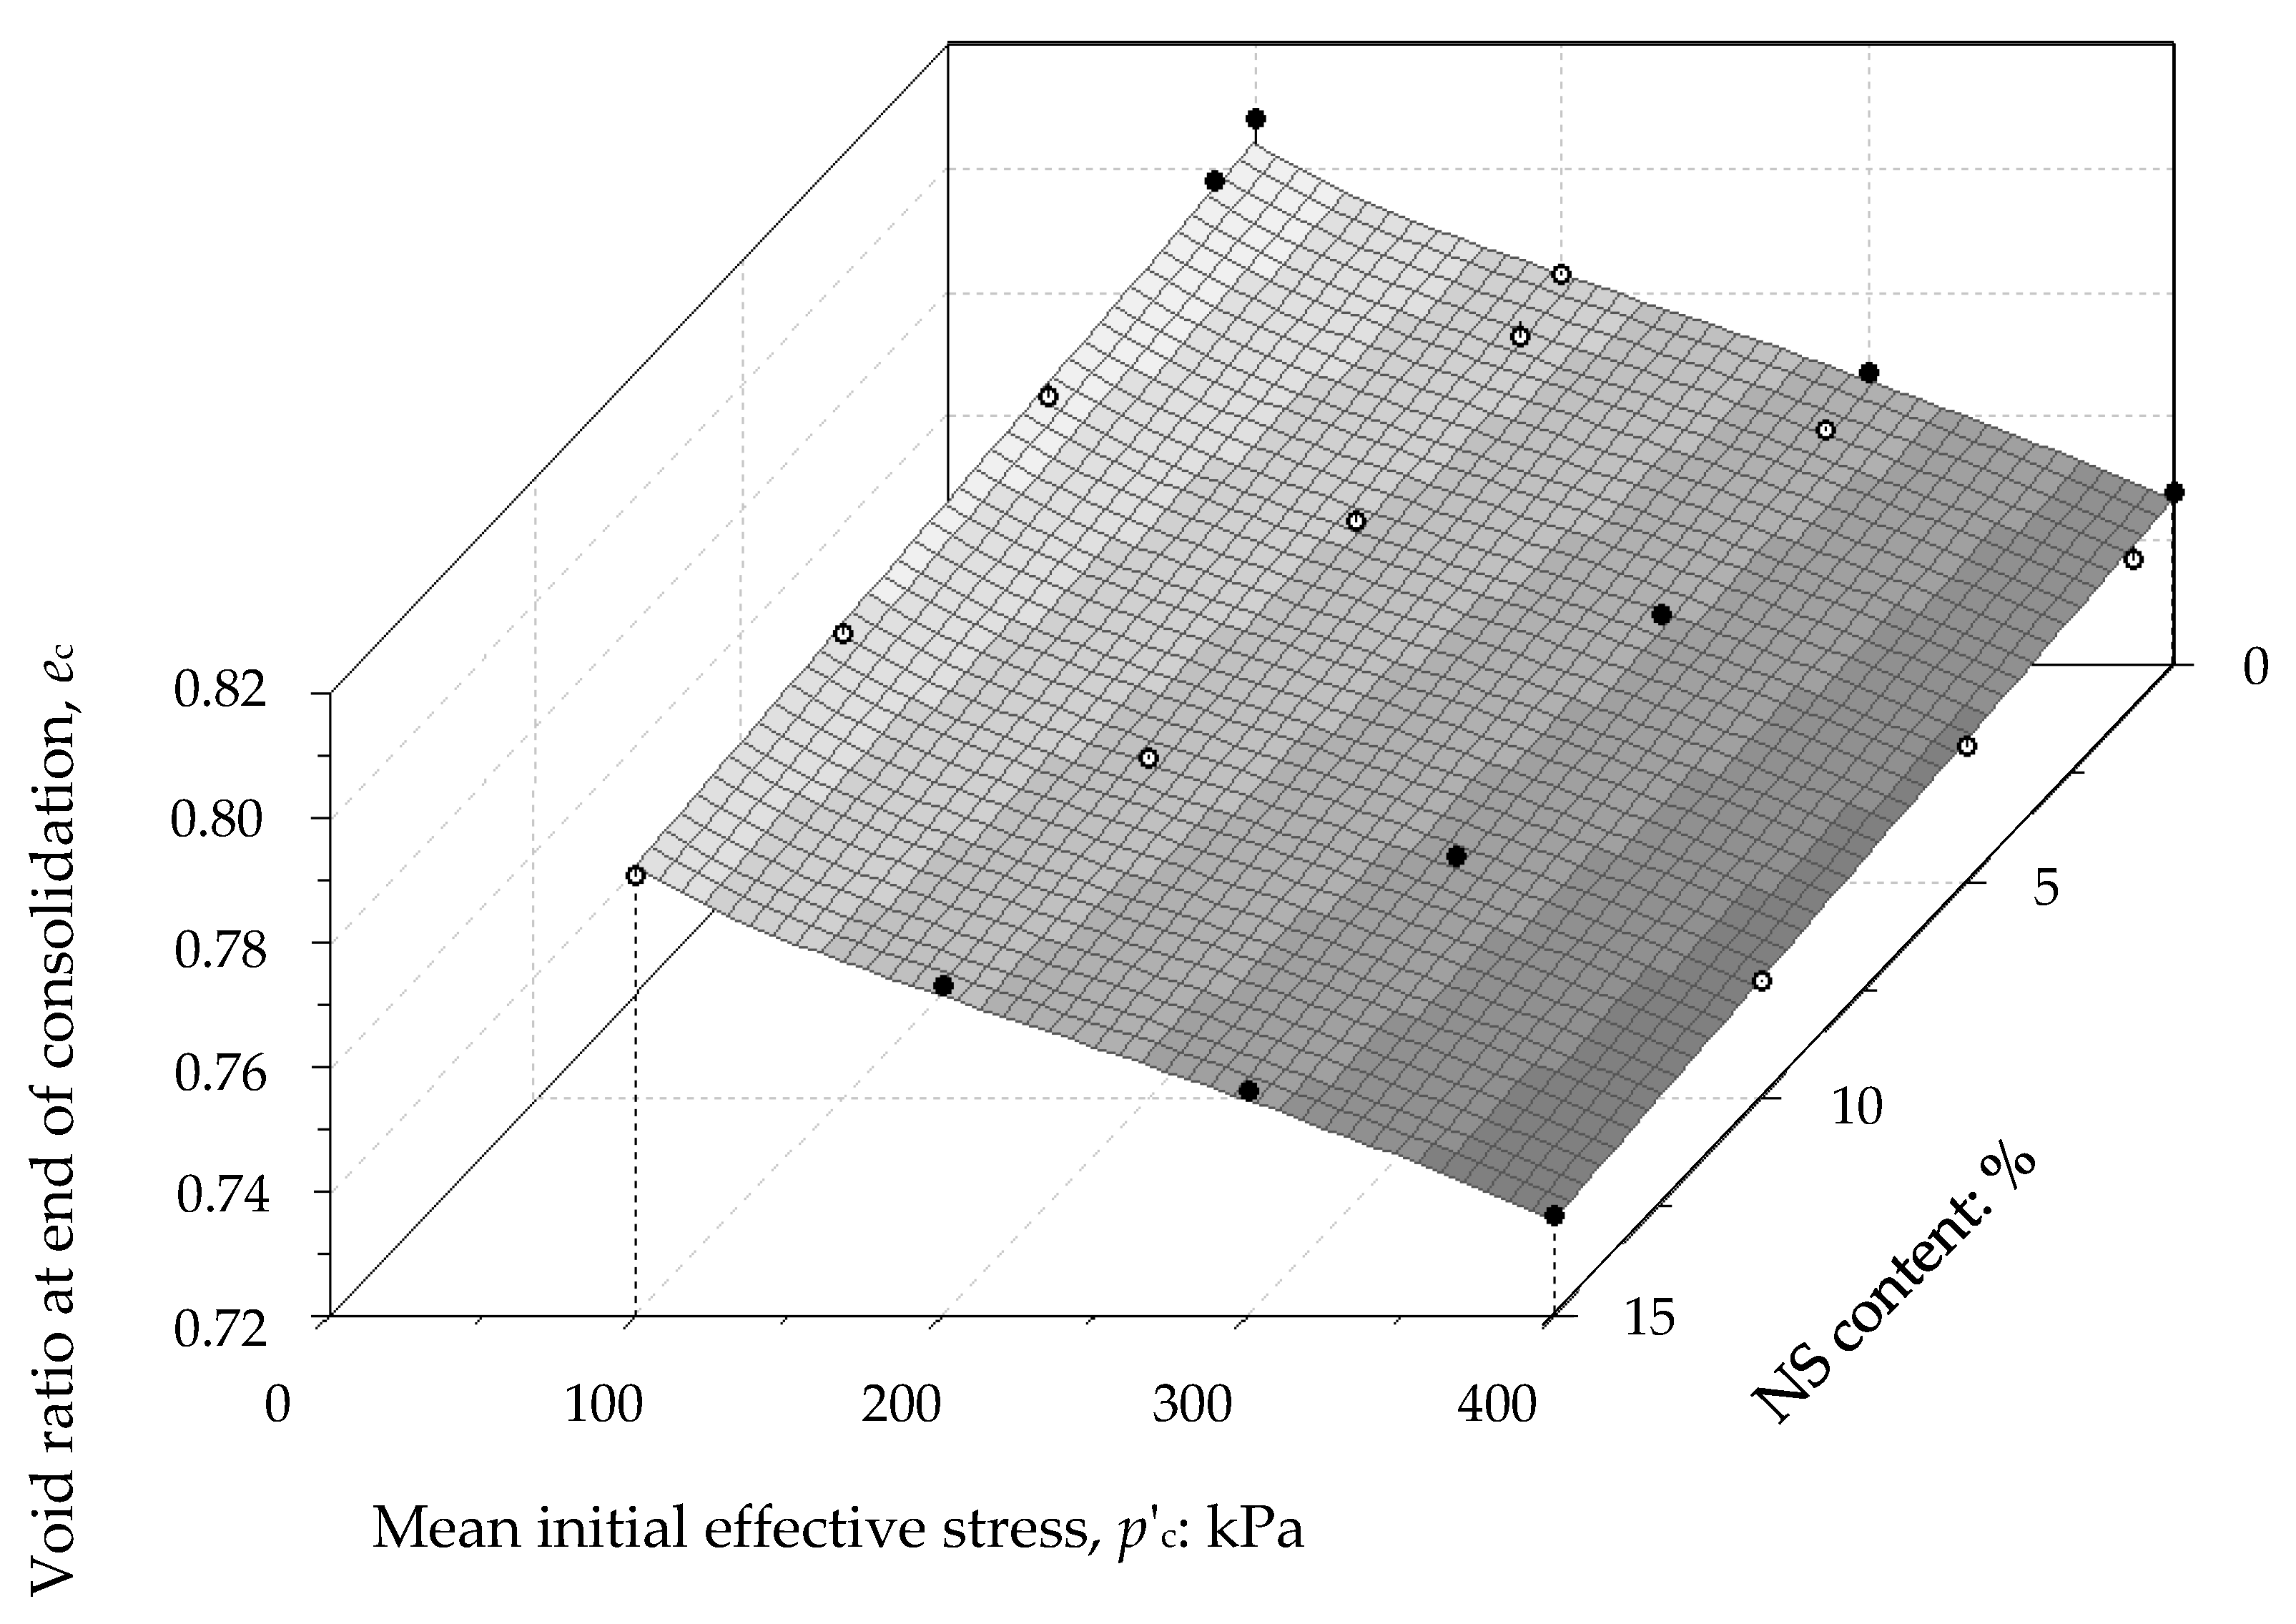
Two immediate observations are discussed here: (1) the variation in ec with p
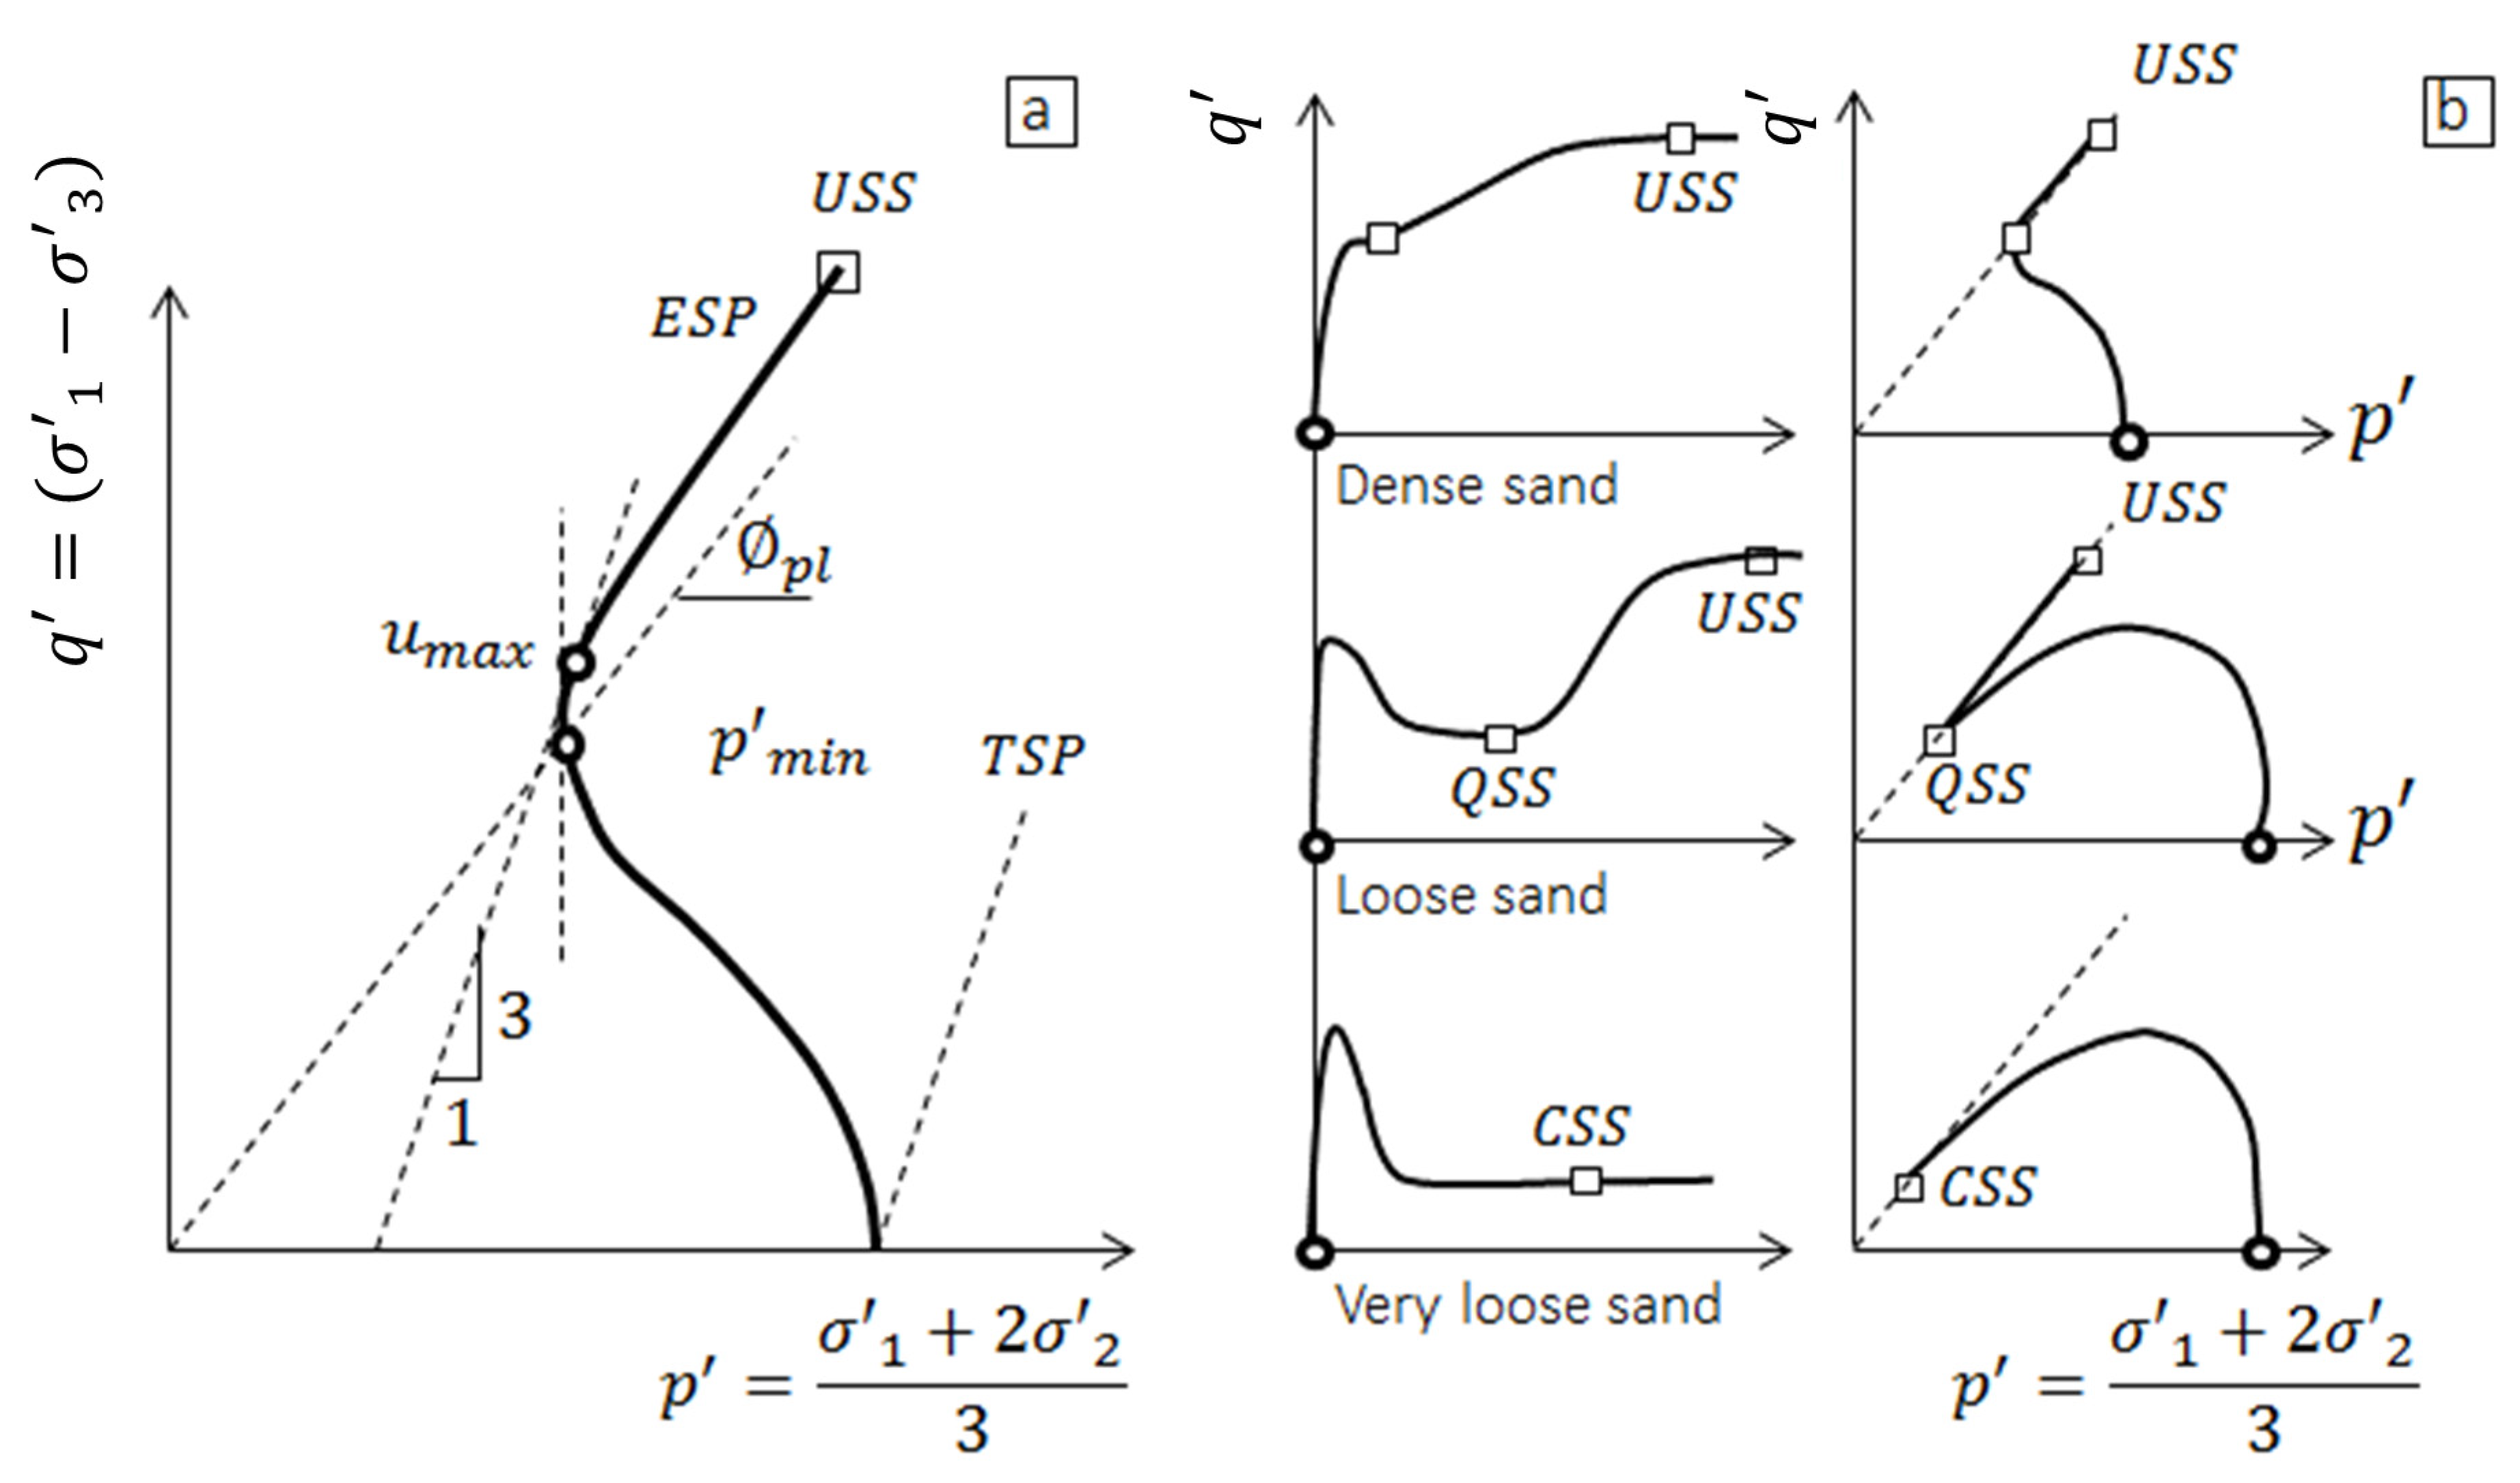
c was marginal for all test specimens, as one would expect for saturated granular soils; (2) for both base sand and binary mixtures, greater confining pressures diminished the strain-softening. These points collectively illustrate the significant control of confinement pressure on the post-yield behavior of saturated granular materials. The addition of colloidal NS to the F161 sand generally decreased the strain-softening response, as compared with the base sand at a nearly similar void ratio. To test this observation, the mean effective stress at phase transformation ( p PT ) is adopted here as a proxy parameter. That is, the phase transformation marks the transition from a structurally metastable state to a more stable state, when a local minimum shear strength is reached, and further straining increases the average number of sand particle-to-particle contacts. To demonstrate, the phase transformation ( p PT ) for the base sand and binary mixtures comprising 10% and 15% NS contents are compared. An initial effective stress (pc) of 200 kPa is adopted as it was found to produce the minimum variations of void ratio with NS content (
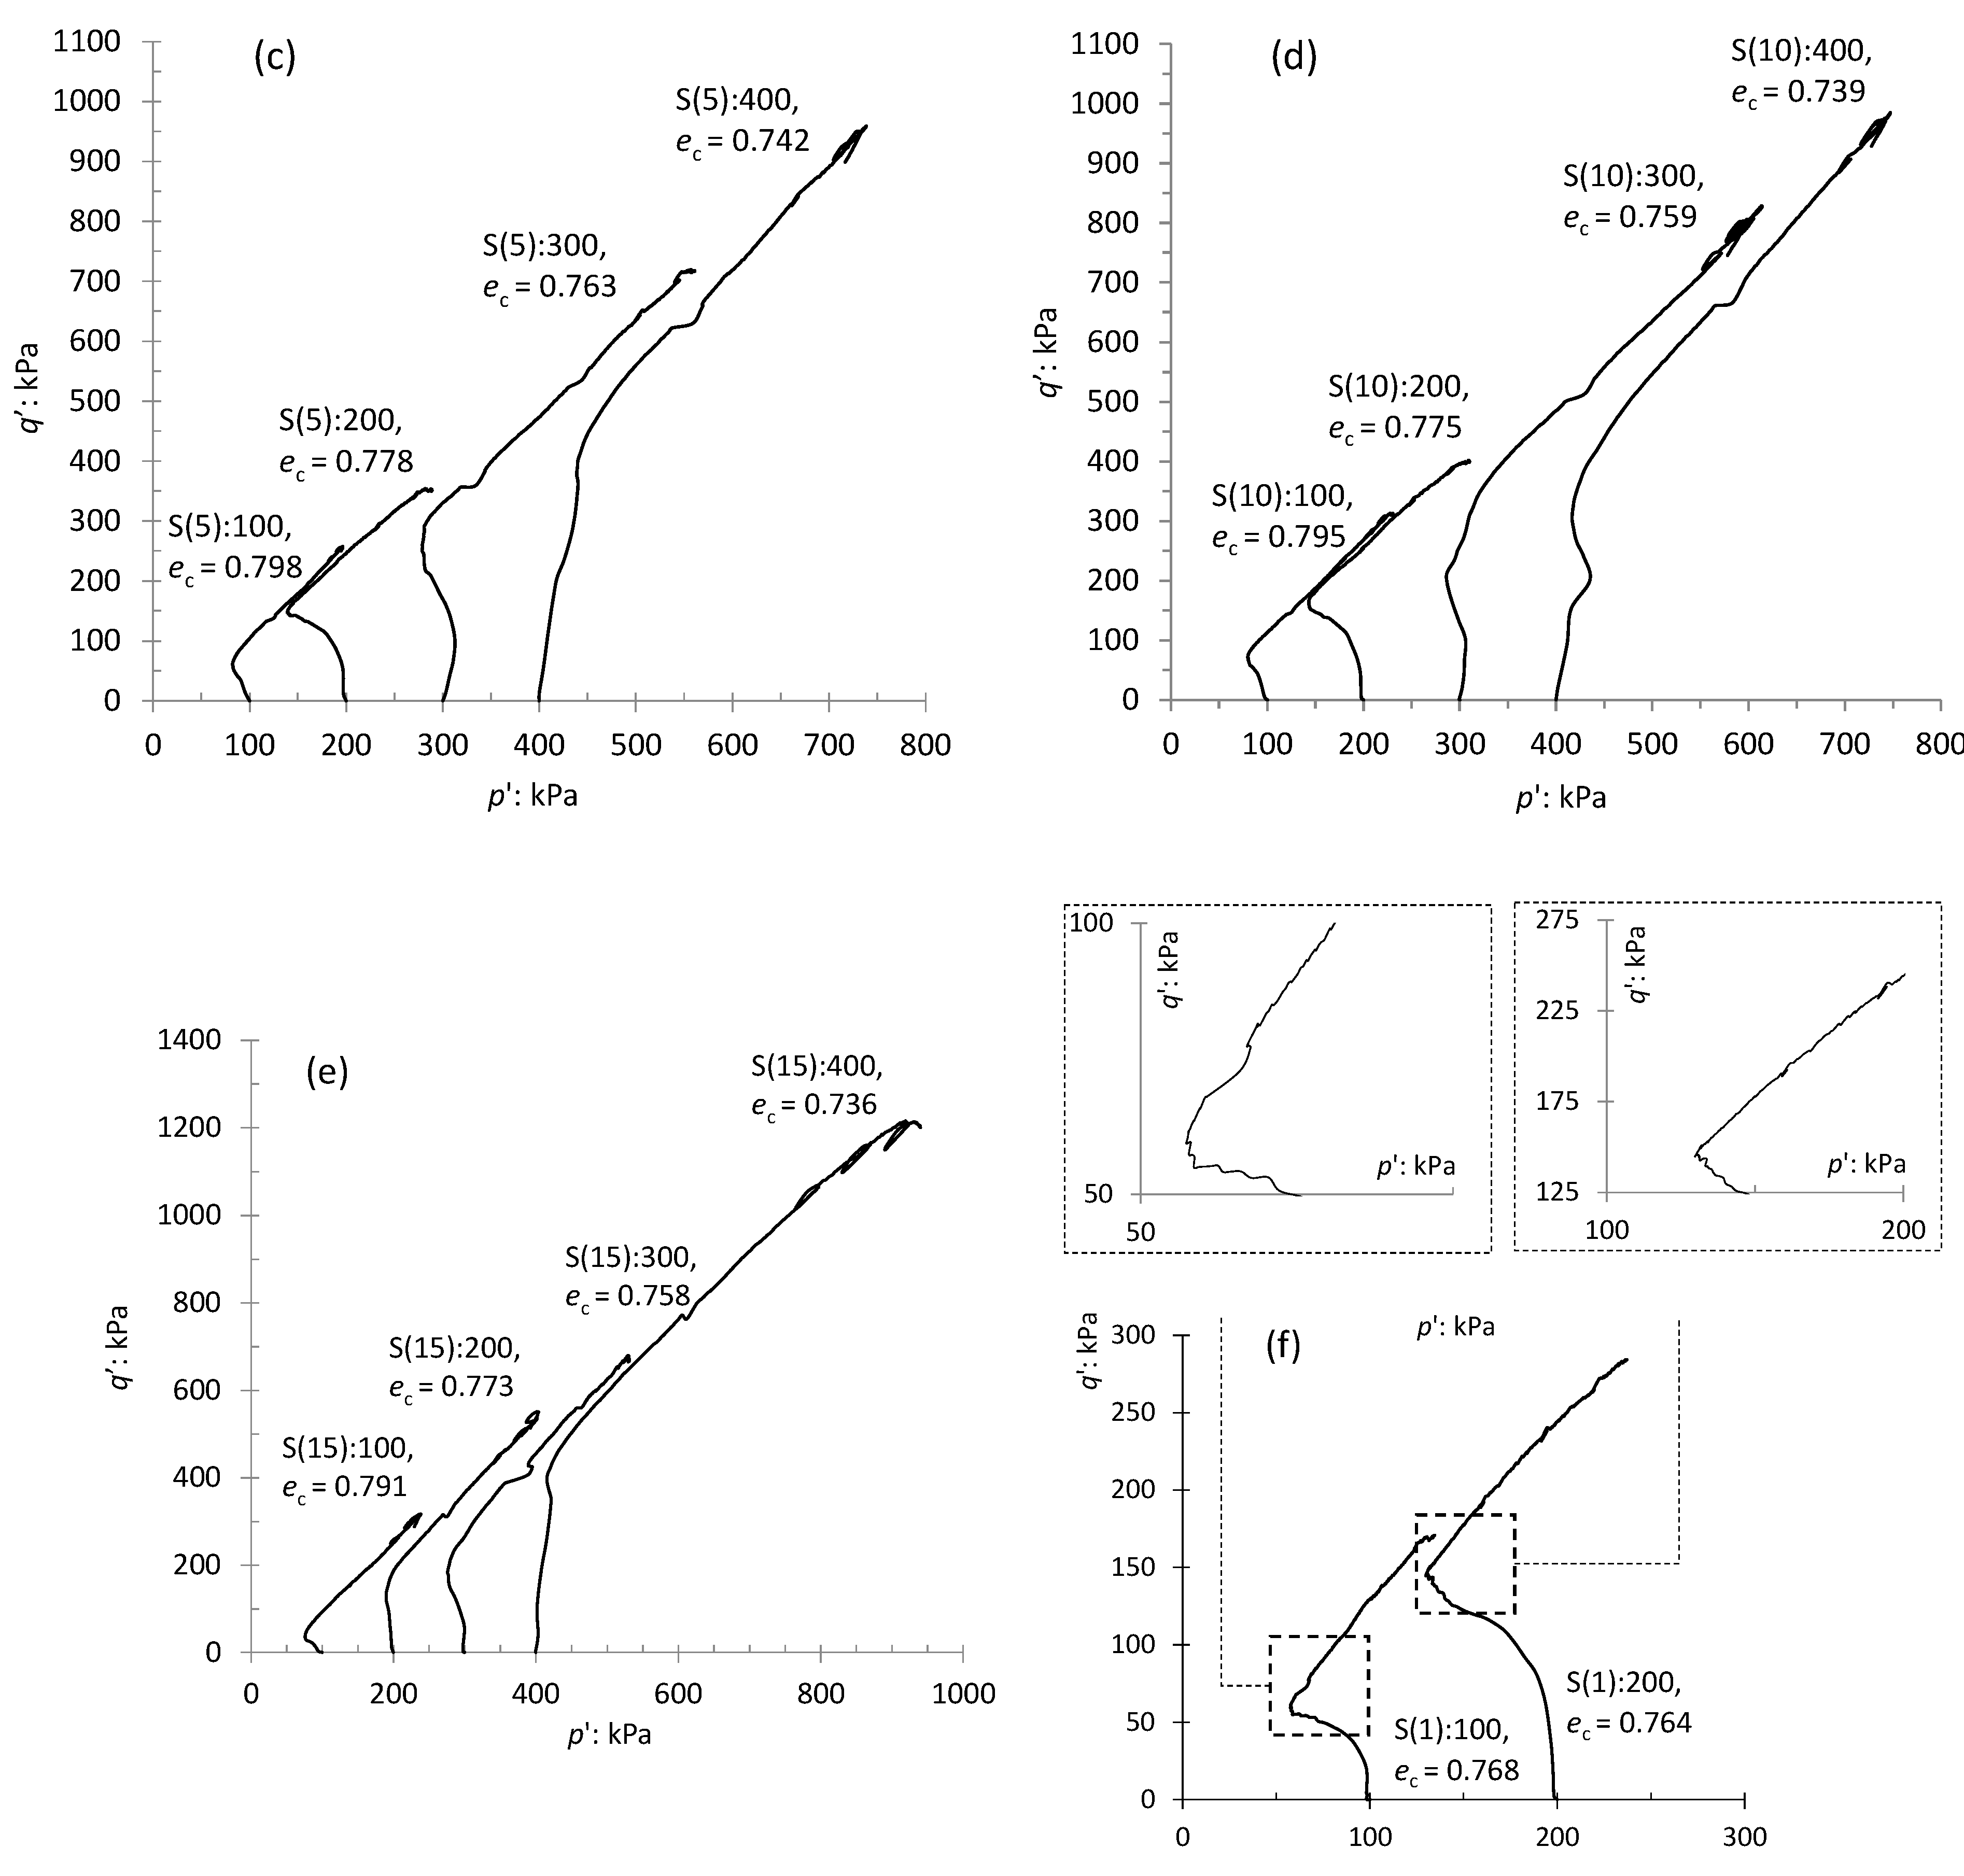
Figure 4). The post-consolidation void ratio values for specimens S(0):200, S(10):200 and S(15):200 were 0.783, 0.775, and 0.773, respectively. This marks a gentle but negligible decrease in void ratio upon grout treatment. With reference to Figure 6a, phase transformation was reached at a low p PT of 142 kPa for base sand, indicating a strong strain softening. For S(10):200 and S(15):200, p PT increased to 151, and 180 kPa, respectively (see Figure 6d,e), marking a much lower p PT p c , and hence relaxed strain-softening. Our findings indicate that grouting sand with NS leads to a gradual transformation of the base sand into a geocomposite possessing stiffer, more brittle, and more dilative stress-strain behavior. This transition appears to be controlled by the mean effective stress—that is, in Figure 6a–c, the strong strain softening in base sand for low p c (≤200 kPa) continues to appear for the 1–15% NS-treated sand specimens, but vanishes at greater p c levels. Referring to the characteristic stress path in Figure 5a, the transition footprint can be seen in the experimental q p traces presented in Figure 6b–c and in the q ε traces through the initial stage of shearing, with p c = 200 kPa, where binary mixtures with <5% NS content exhibited some clearly visible minor fluctuations in the stress paths (Figure 6a–b). These perturbations (Figure 6f) were less pronounced at the higher p c levels investigated. These volatilities could indicate a period of rapid interactions between the sand particles and rounded NS floc units, suggesting particle rearrangement and, as such, turmoil in inter-particle forces. This period lasted until the sand particles attained a more stable packing state.
Referring to Figure 7b, the perturbations in the q ε trace for specimen S(1):200 ceased at axial strain levels above 2.5% (i.e., >0.025 on the graph). Further, the q ε trace dips at approx. 2.5% axial strain, and the stress path changes direction (see Figure 6b), marking a state, at which the specimen achieves a local minimum shear strength ahead of strain-hardening. This transition is effectively an event that marks the most pronounced loss of sand particle-to-particle contacts. The subsequent strain-hardening period leads to an increase in the mean numbers of particle-to-particle contacts with increasing strain. Here, the 2.5% axial strain represents a transition point from an initial metastable to a more stable packing state. It will be shown later that the role of NS at this ‘threshold’ 200 kPa mean effective stress is optimum, resulting in maximum peak deviatoric stress.
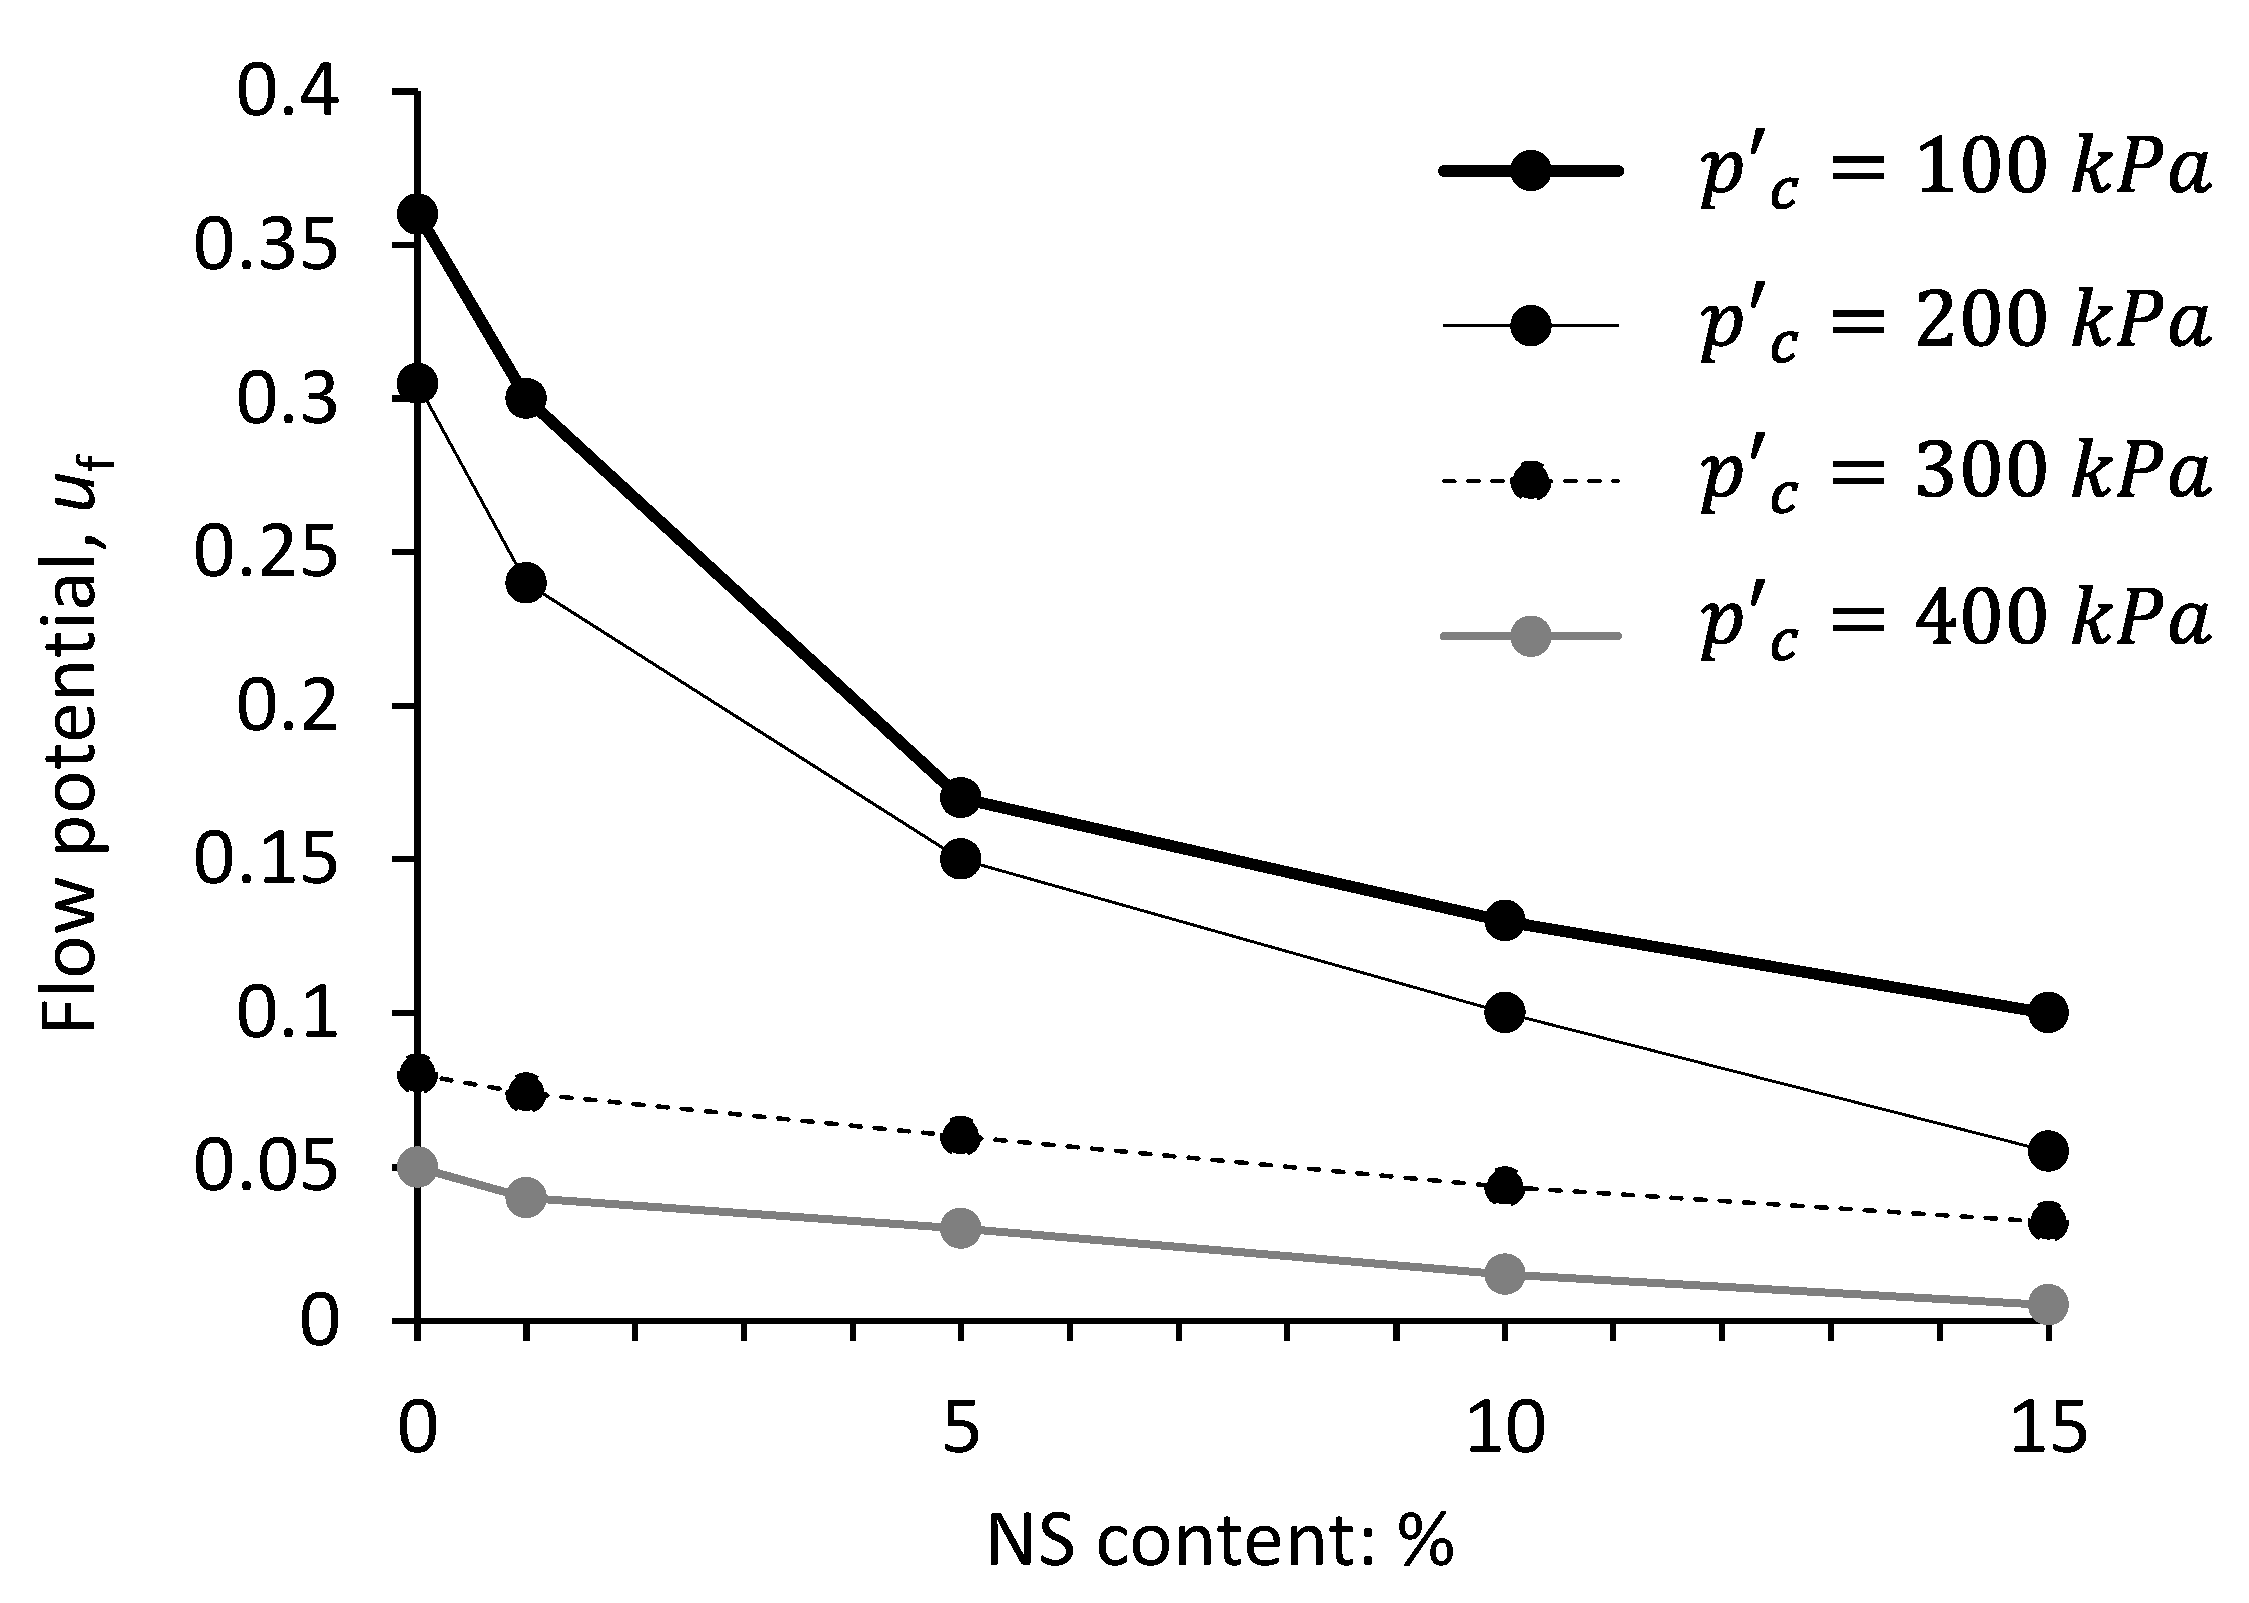
The observations on plastic volumetric behavior of the base and NS-treated sands are better described in quantified forms, which necessitates the definition of a state index. Flow potential ( u f ) is adopted here as an appropriate state index. Yoshimine and Ishihara [35] first suggested the use of u f , the maximum excess pore-water-pressure ratio, as a measure of softening. The u f index is controlled by stress conditions in the sand during both initial and shearing stages. Equation (3) formulates the flow potential as a function of p PT (mean effective stress at the PT point) and p c (mean isotropic effective confining pressure):
u f = 1 p PT p c
The variation of the flow potential with NS content is presented in Figure 8 for the base and modified sands. Relatively higher flow potential values were measured for base sand specimens under the lowest confining pressures investigated. Generally, the flow potential appears to be approx. indirectly proportional to NS content and the p c level.
The above findings are consistent with similar attempts (but with different chemical grout proppants employed) in the investigations by Gallagher [39], Rodríguez and Izarraras [40] and Towhata and Kabashima [41], and also where cement was used as additive in the studies by Clough et al. [42] and Saxena et al. [43]. As described earlier, NS treatment had minimal impact on the post-consolidation void ratio and packing state of the sand specimens but reduces strain-softening behavior.
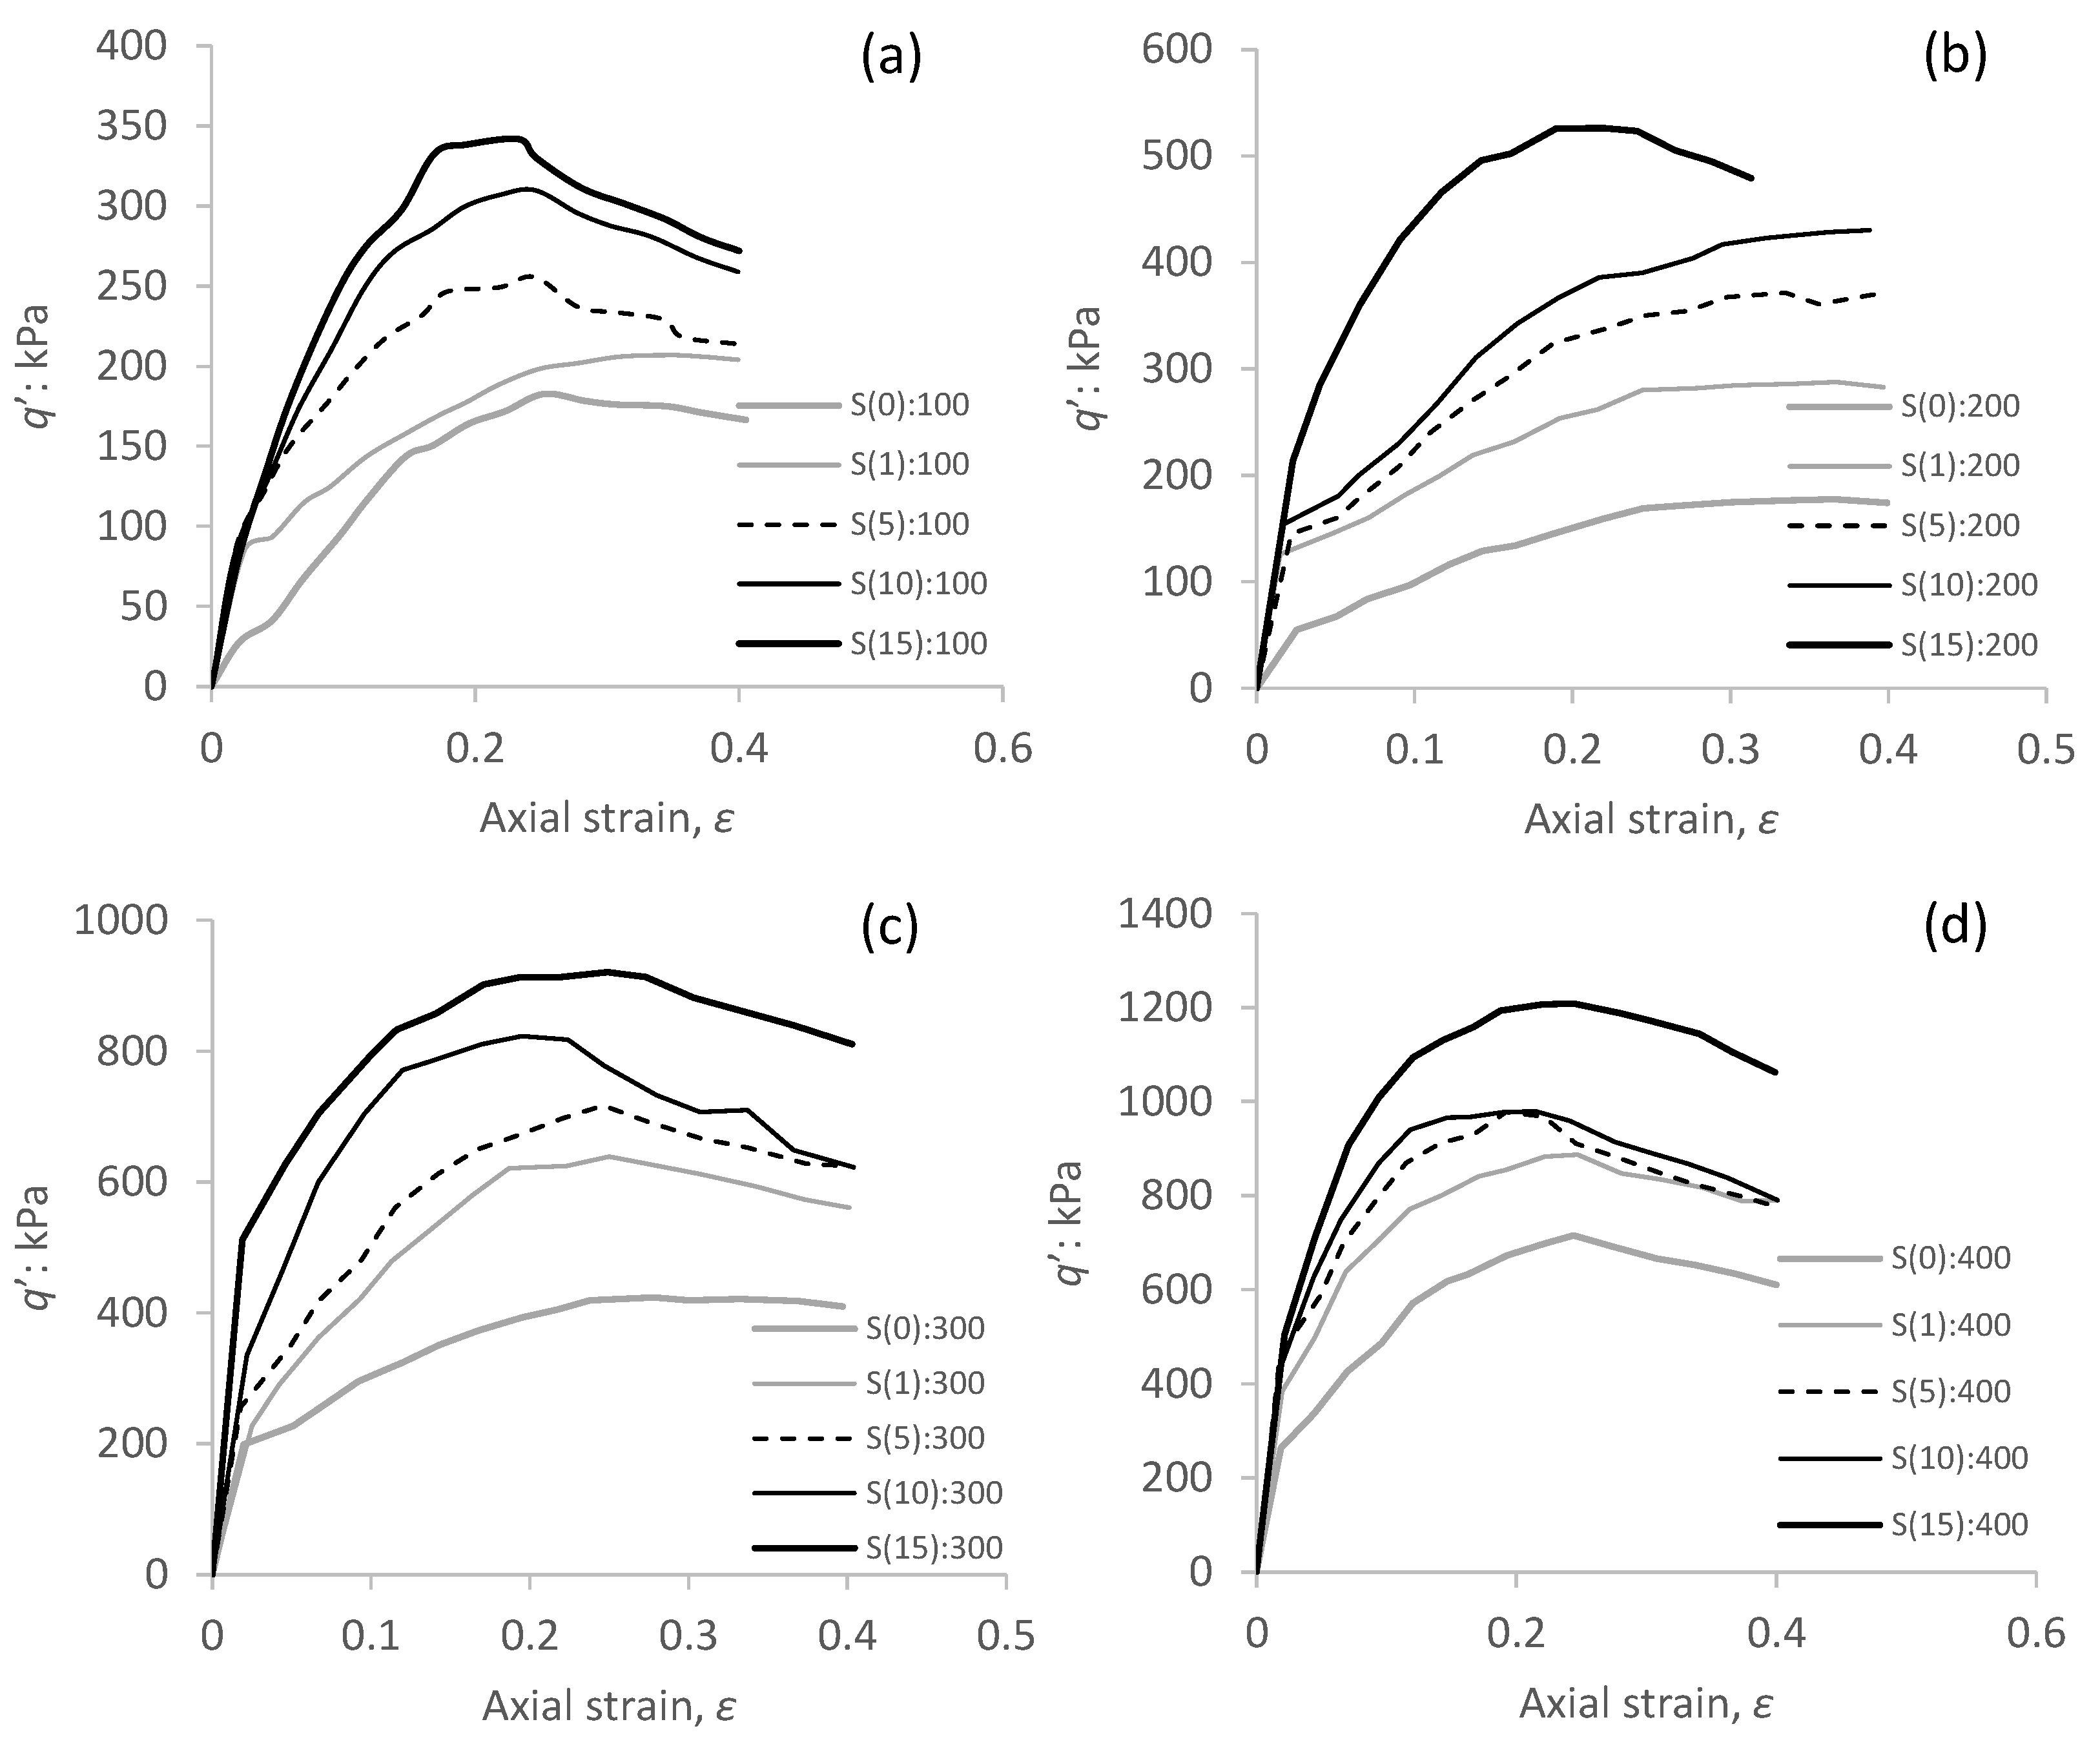
The q′– ε traces presented for the base and NS-treated sand specimens in Figure 7a–d indicate that the deviatoric stress at USS (ultimate steady state) increases with NS content and, furthermore, the specimens behave explicitly stiffer and exhibit a predominantly dilative response. This occurs on account of the increased bonding effect of NS flocs at sand particle level for greater NS content. It was argued earlier that silica bonding units begin to disrupt upon isotropic consolidation as the mean effective stress is increased beyond 200 kPa. In other words, particles are argued to have benefitted from maximum bonding for p c < 200 kPa. This seems to be a threshold mean effective stress and has its footprints on the stress path traces—that is, for p c > 200 kPa, the stress path traces in Figure 7a–d exhibit some erratic and sporadic fluctuations which are thought to be macro-scale reflections of frequent particle contact modifications. Upon shearing, and particularly at strain levels above the PT when particles are fully engaged, straining results in small movements of the interparticle spherical NS flocs. Sand grains frequently lose and re-establish contact as shear strains are built up. The fluctuations described first appeared for p c = 200 kPa and coincided with the PT, ahead of the strain softening.

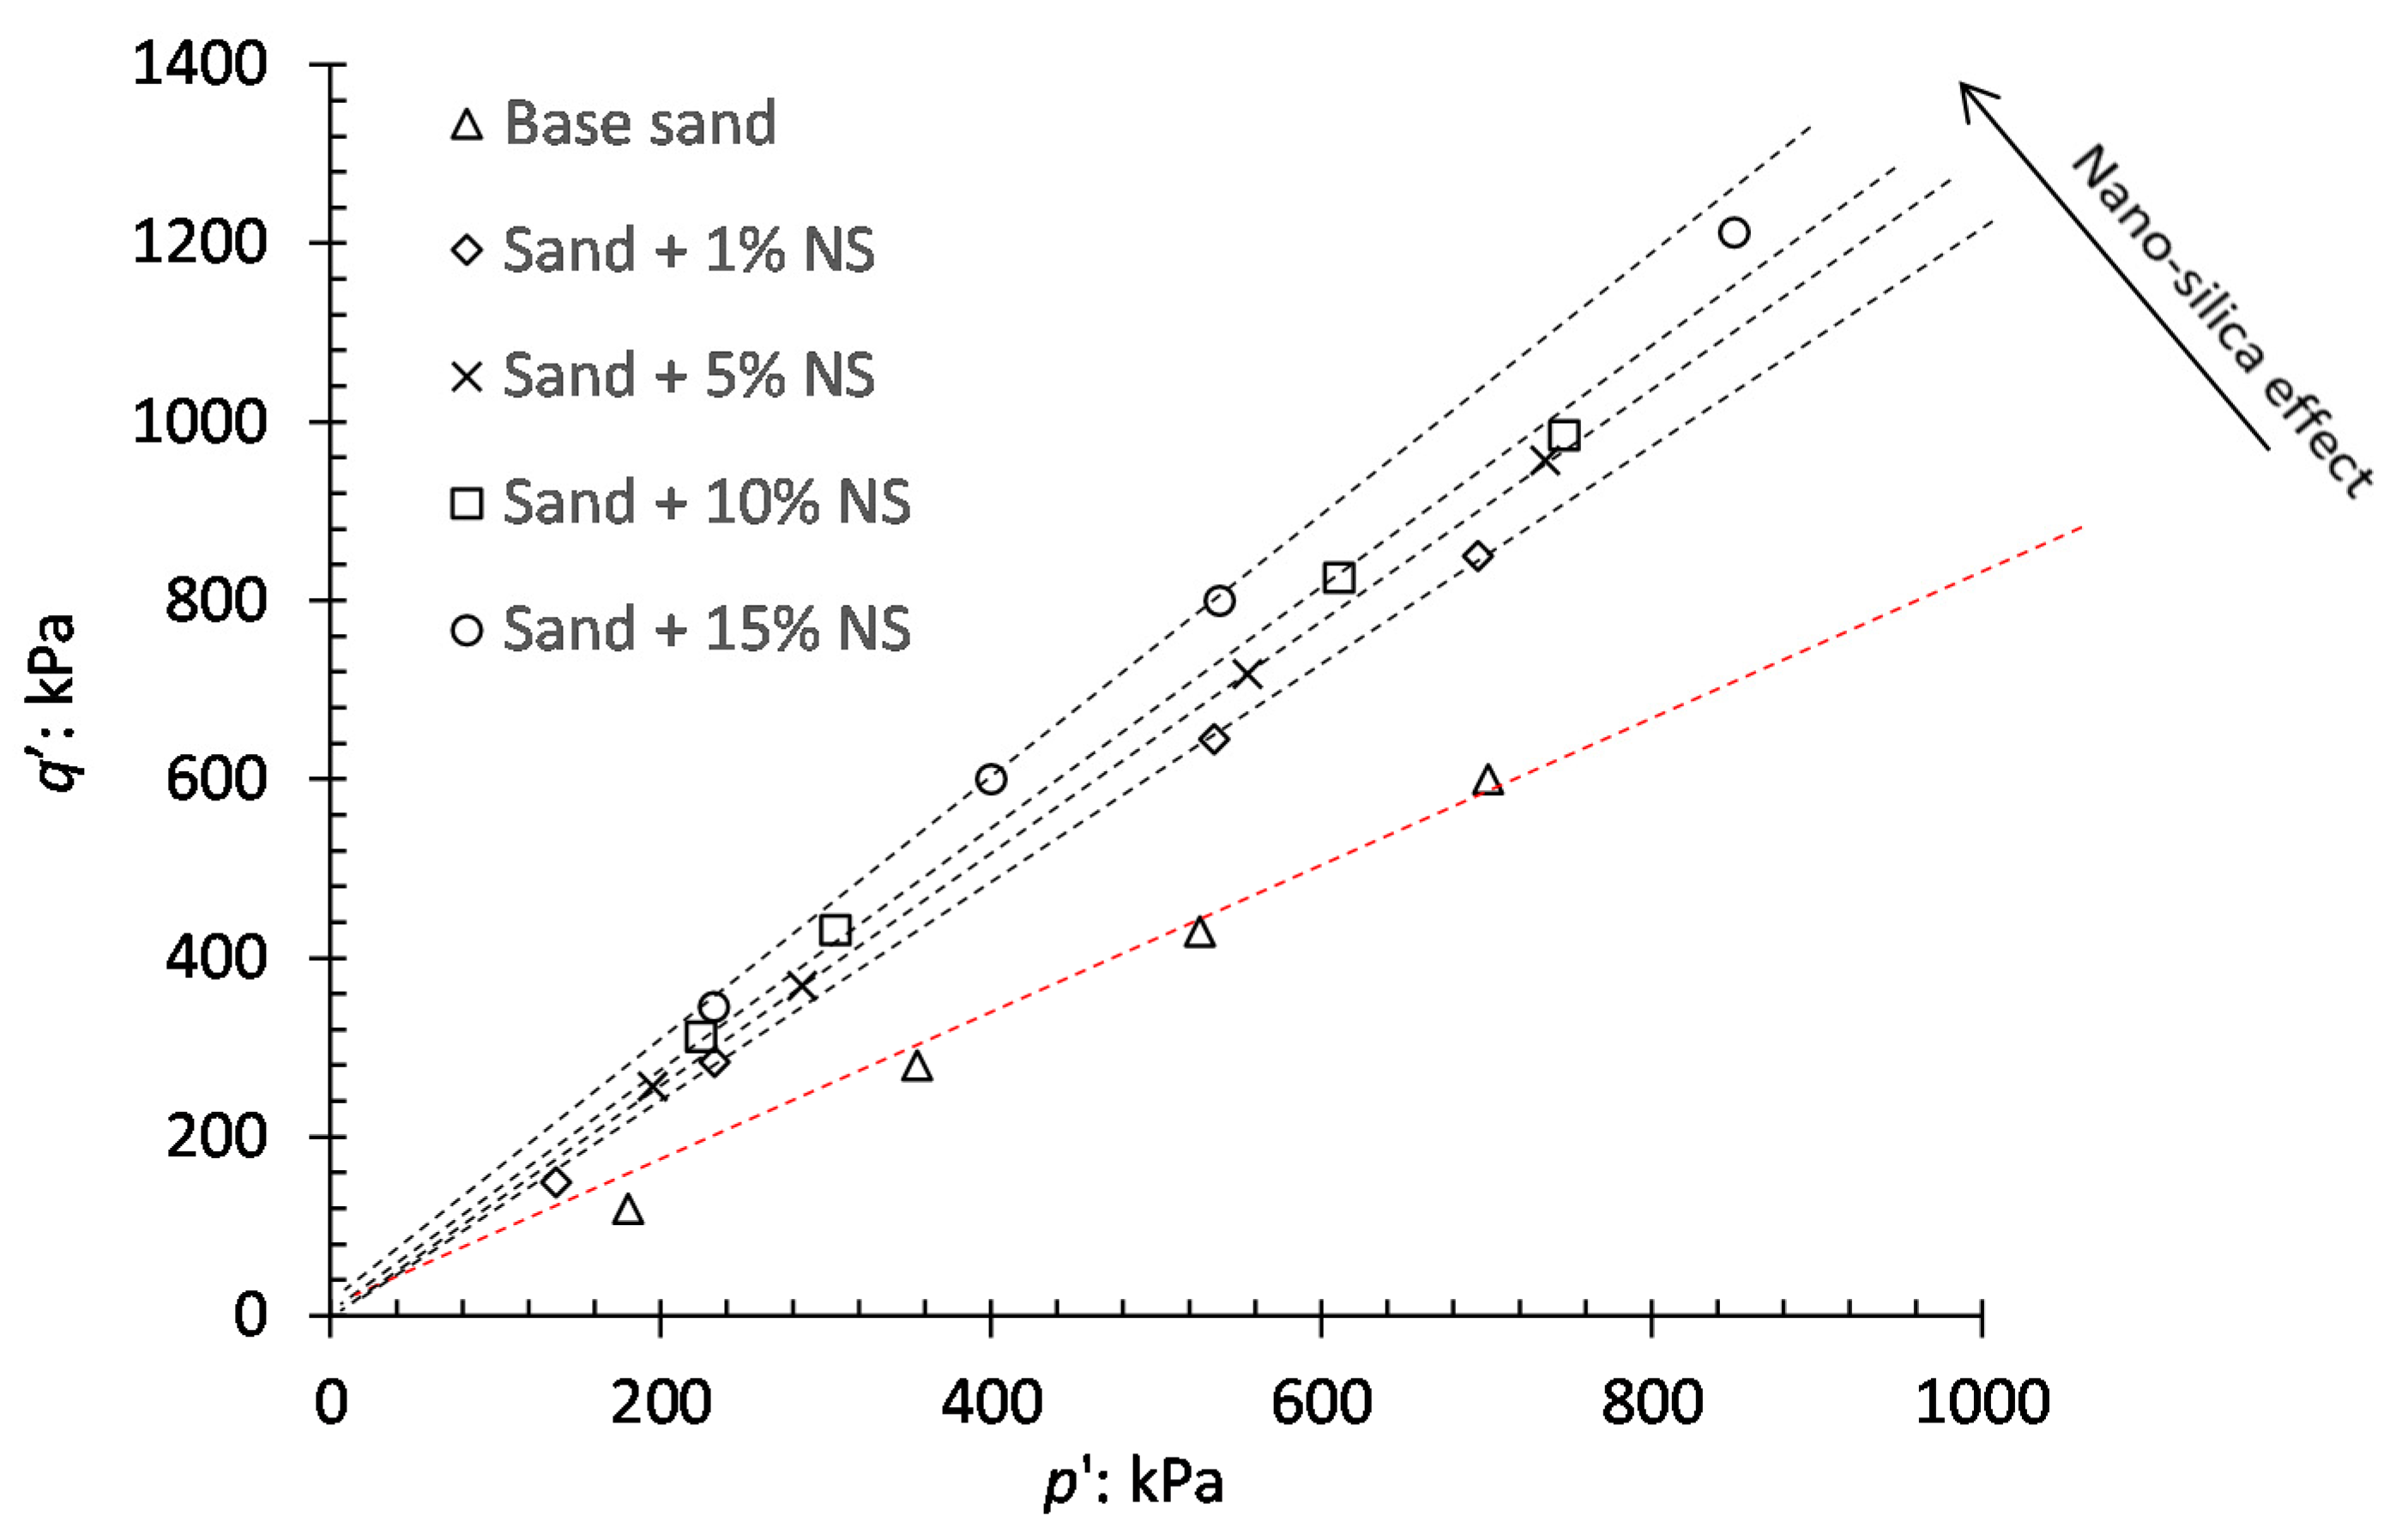
Sand Modification and Shear Strength

For the NS range of 0–15% investigated, greater NS content generally produced an increase in failure shear strength, q f . Treated sand isotropically consolidated at p c = 200 kPa experienced the greatest rise in q f , which is consistent with earlier discussions on the significance of p c = 200 kPa as the threshold confining pressure. By adding 15% NS, the q f for confining pressures of 100, 200, 300 and 400 kPa increase by 95%, 201%, 115% and 69%, respectively, compared to the untreated sand. At particle level, this is mainly due to improvements in first stage bonding (enhanced cohesion) that produces the enhanced deviatoric stress of the treated specimens. This observation is supported by computed relative improvements in failure apparent cohesion and effective friction angle ( c f , ϕ f ). In other words, compared to the base sand, the 1%, 5%, 10% and 15% NS contents mobilized greater c f of 73%, 250%, 450%, and 750%, respectively. Whereas, the corresponding improvements in ϕ f 
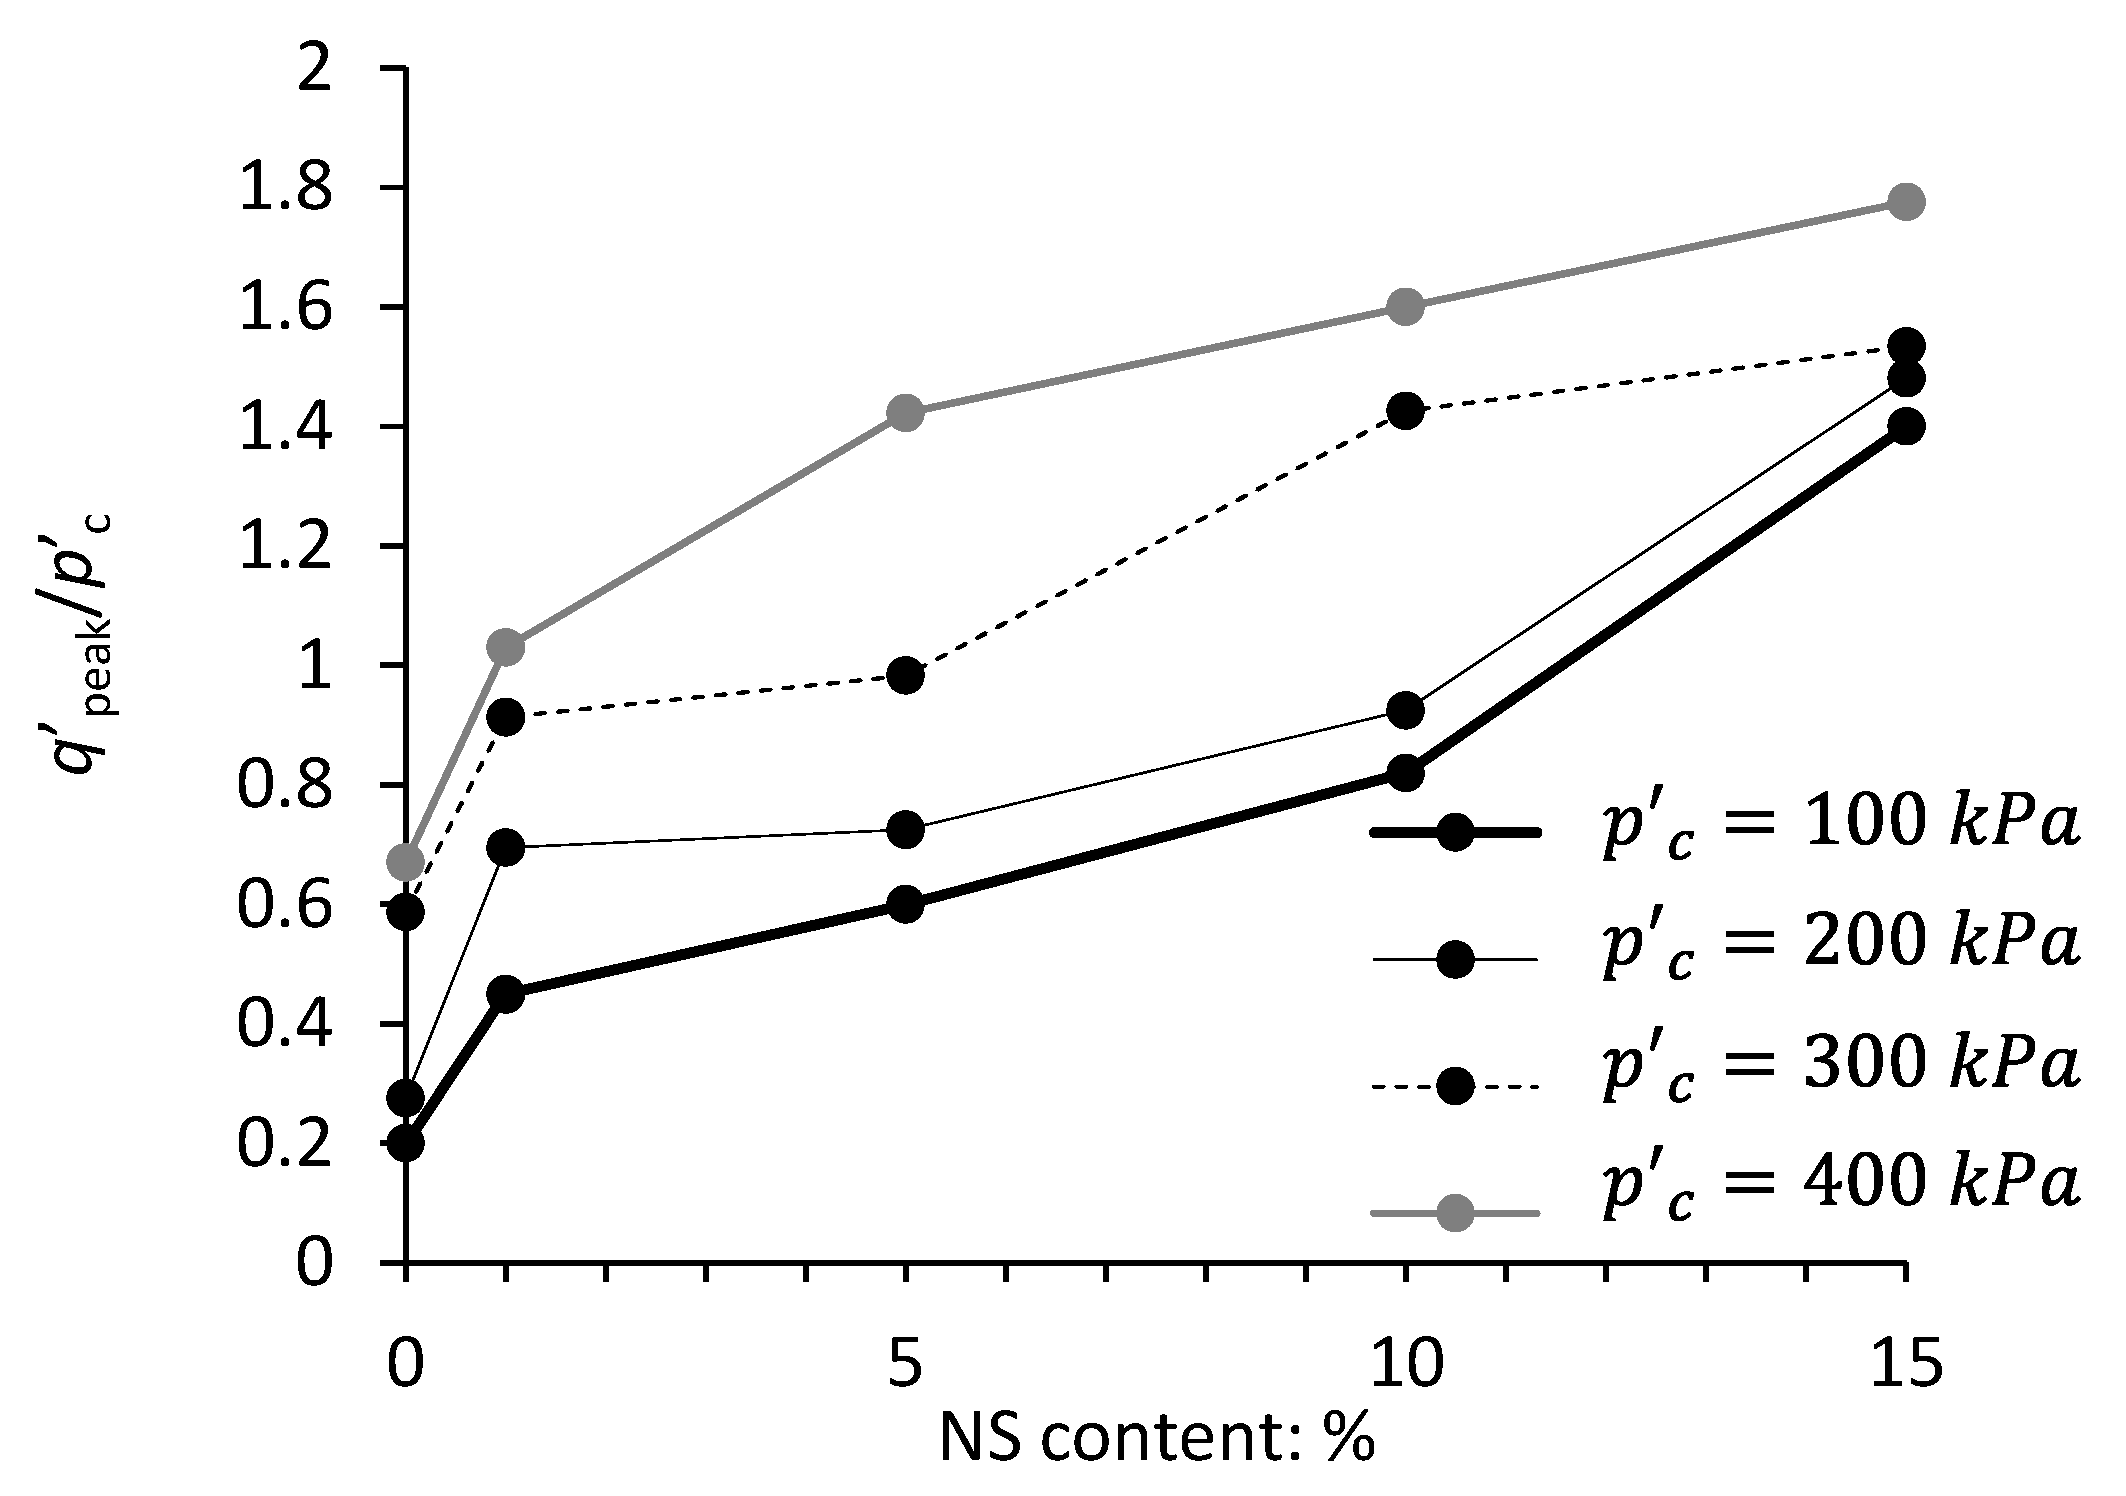
were limited to 5%. To better understand the relationship between mean isotropic effective confining pressure and peak strength, the normalized peak shear strength ( q peak / p c ) is plotted against NS content in Figure 9.
Referring to Figure 9, over the NS range of 0–15%, greater NS content produced an increase in q peak / p c , with maximum levels appearing at 15% NS for all confining pressure levels investigated. Similar findings have been reported by [44,45]. Note that the 15% NS content is lower than the threshold fines content beyond which the overall behavior of the binary mixture would be controlled by the fines. For < 15% NS content, however, the rounded silica flocs locate in between the sand particles to build an open packing on the 600 (loose) to 402 (fairly loose) packing transition route described earlier in the paper. The chains of sand and rounded silica flocs enjoy the generally enhanced coordination number (i.e., contact number per particle) and transmit greater levels of skeletal stresses.
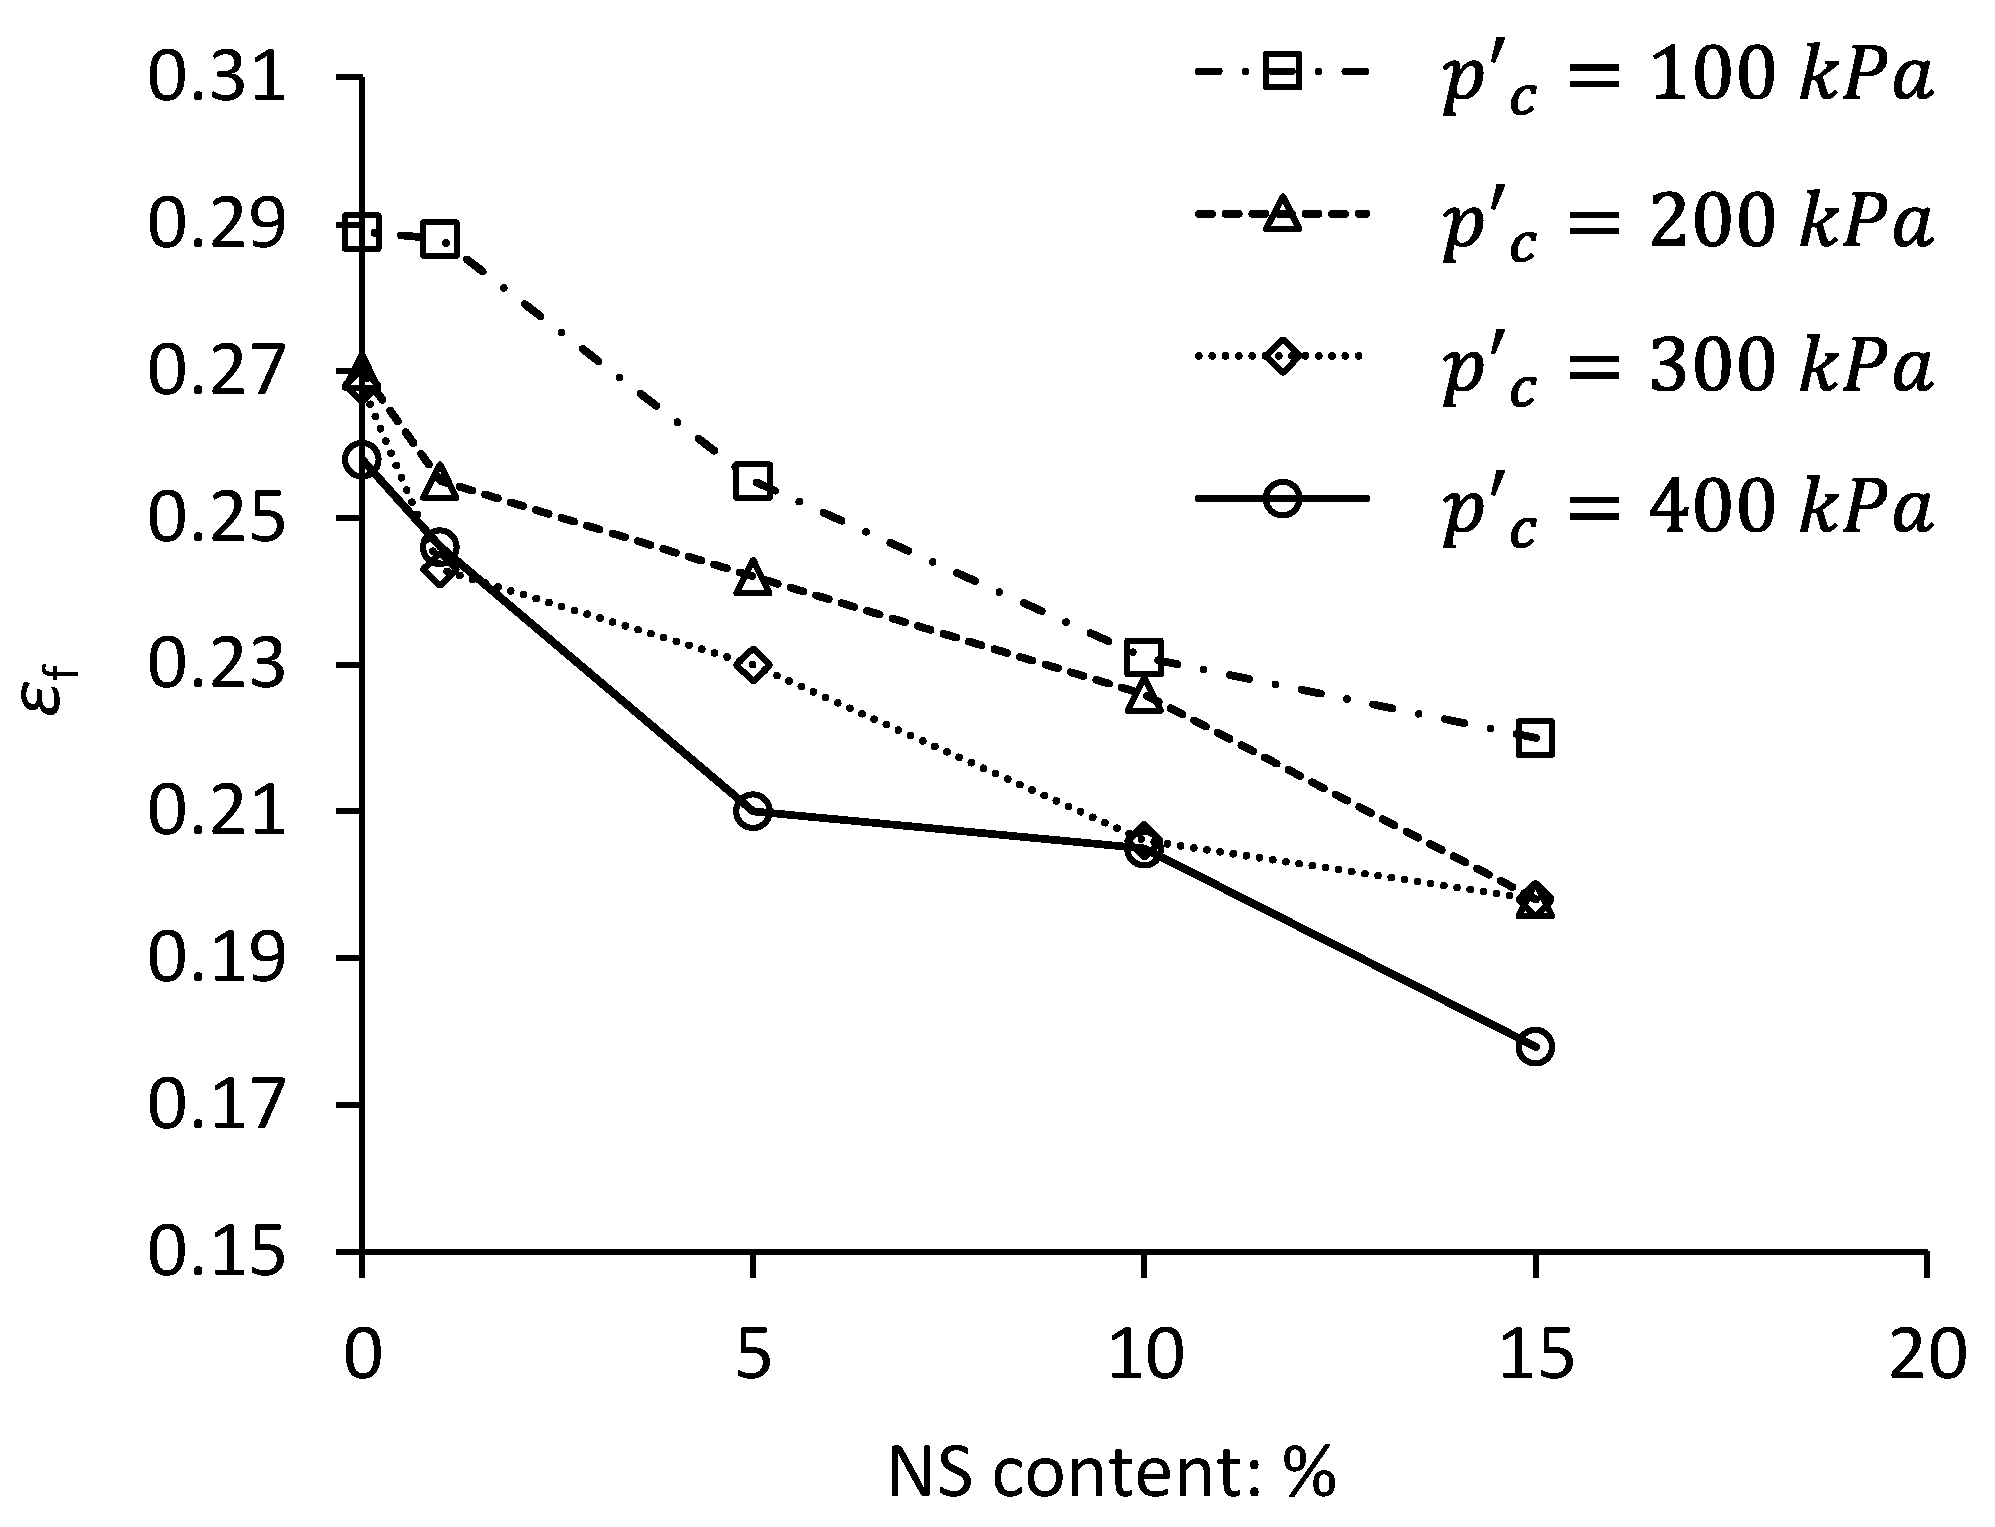
In Figure 10, axial strain at failure deviatoric stress ( ε f ) is plotted against NS content and indicates that strain at failure state decreased with increasing NS content for all confinement levels investigated. This confirms a more brittle dilative response for the treated sand compared to the base sand.
Failure strain also decreased with increasing mean effective stress ( p c ), with the maximum decrease occurring for 15% NS, while the largest recorded drop was for p c = 200 kPa. That is, compared to the base sand, ε f for the 15% NS-treated sand decreased by 24%, 36%, 35%, and 27% for p c = 100, 200, 300 and 400 kPa, respectively. This lends further evidence to the significance of micro-structural events that take place at the ‘threshold’ 200 kPa mean effective stress.
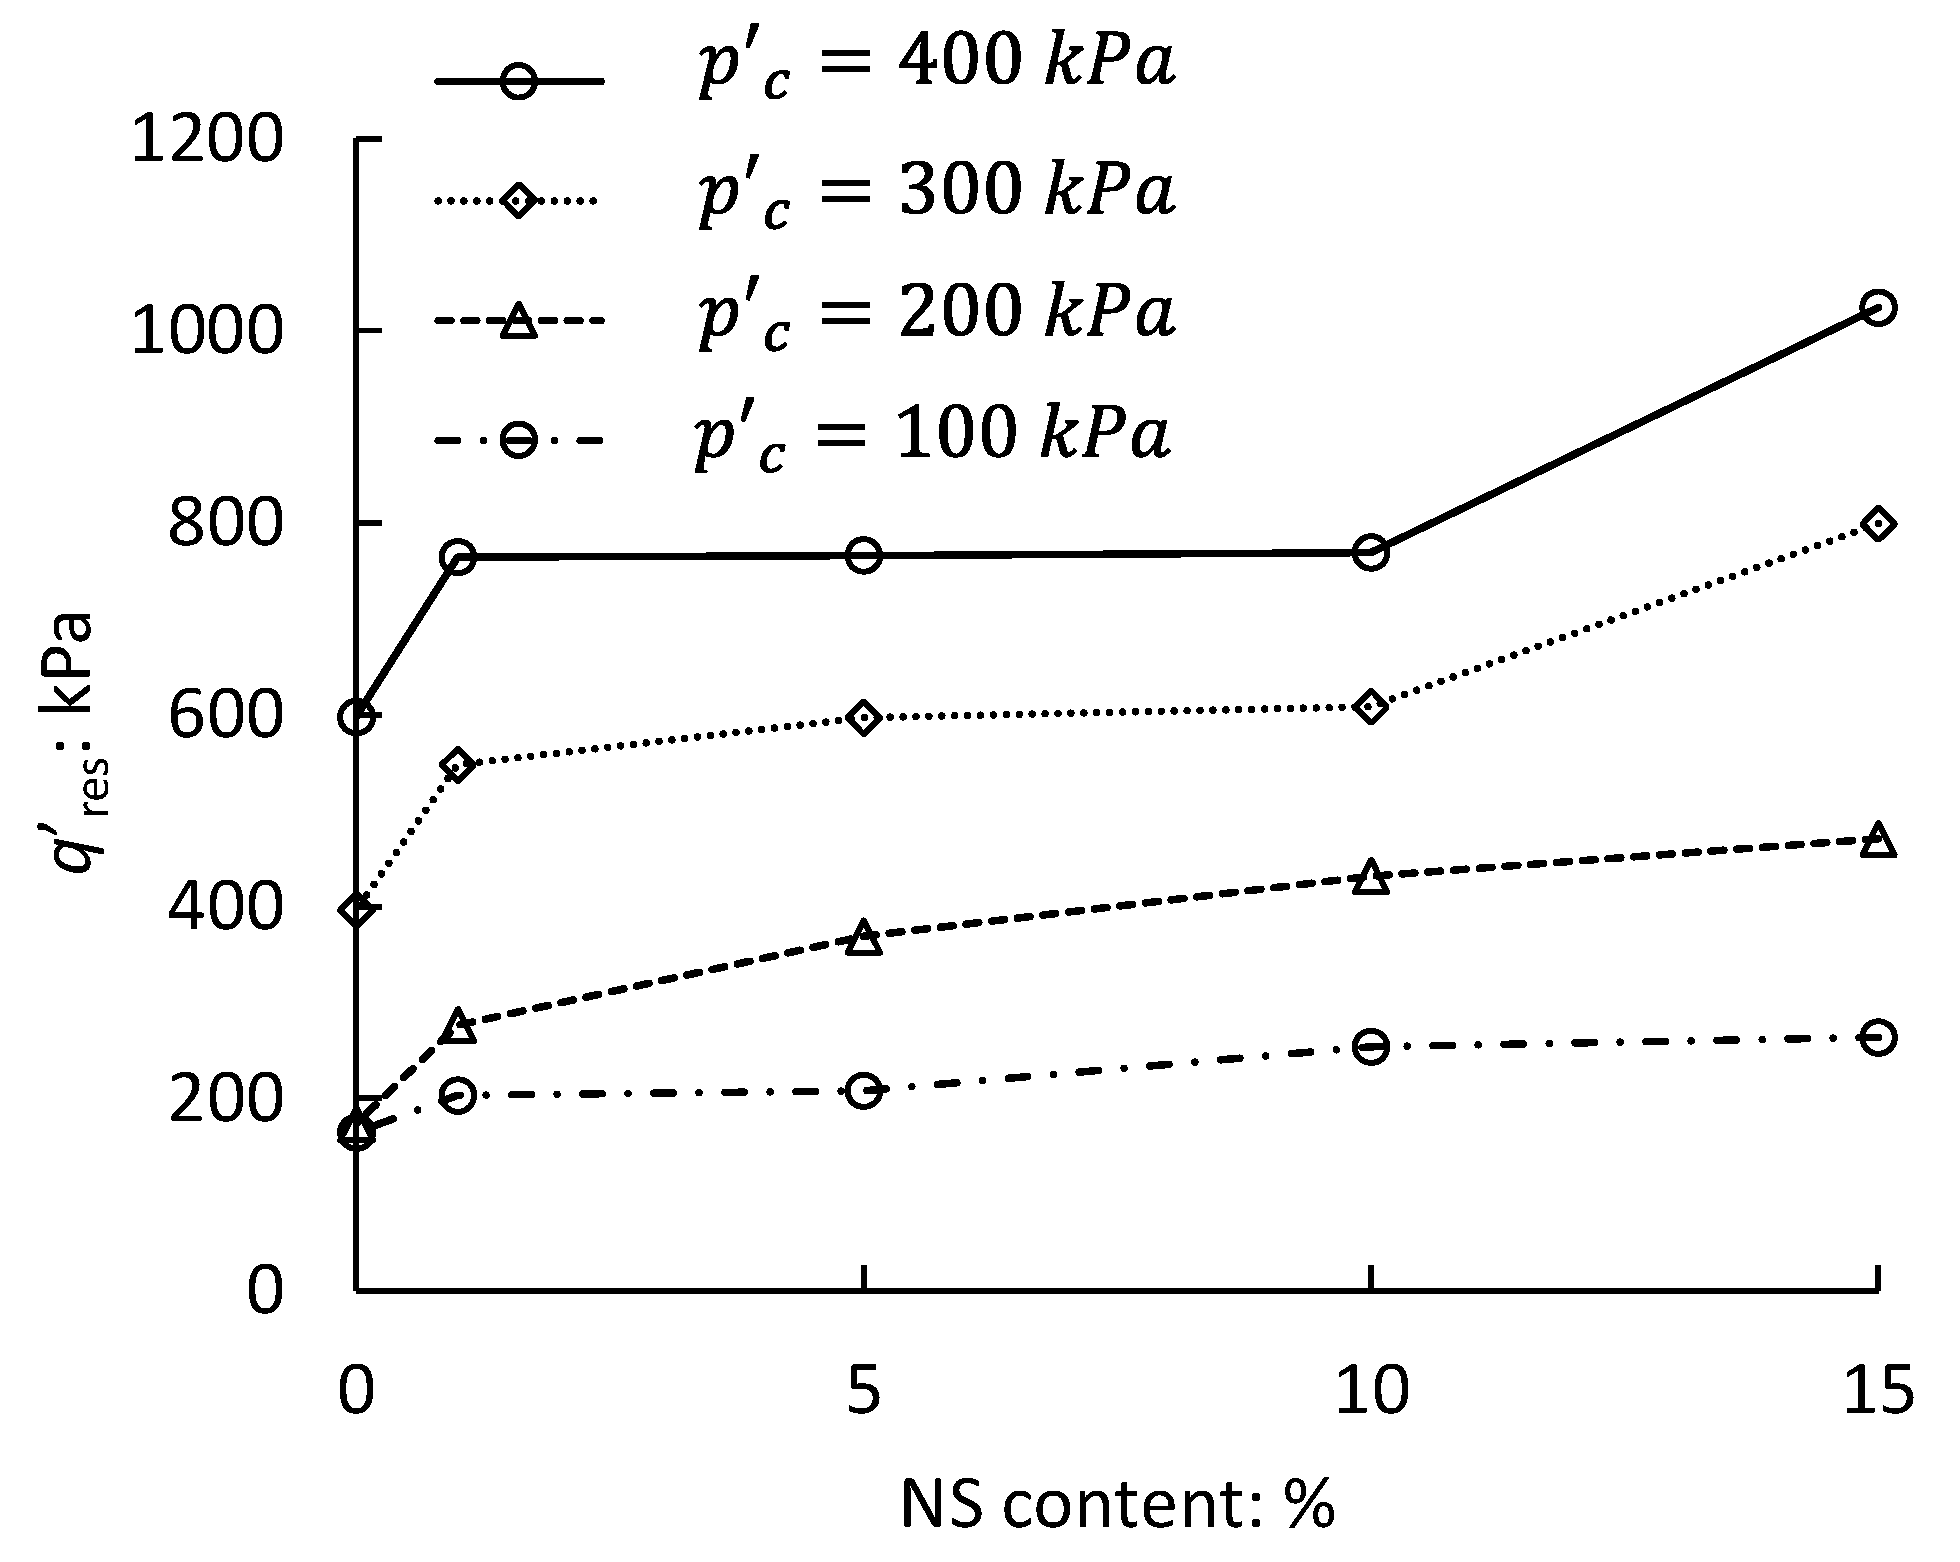
In Figure 11, residual deviatoric stress ( q res ) is plotted against NS content for the four mean effective confinement stress levels investigated. This figure indicates a gentle increase in q res for up to 10% NS, followed by a more marked increase for increasing NS content from 10% to 15%. As expected, confinement pressure has a clear direct impact on q res . Once the specimens are sheared beyond the PT point, silica flocs migrate and ‘stuff’ the macro-pore spaces, thereby providing support to direct sand particle-to-particle contact points. Such support allows sand asperities to carry greater levels of skeletal stresses and, as such, the soil develops greater levels of residual shear strength.
Overall, the experimental results presented in Figure 11 suggest that the effectiveness of fine inclusions in improving the residual shear strength for the investigated sand is limited to NS contents >10% and for p c ≥ 200 kPa. At p c = 200 kPa, treatment is most effective at 15% NS content.

4. CSSM Framework for Binary Mixtures

Critical state is an ultimate state of shearing where soil deforms continuously under constant volume and stress conditions [46]. In this section, a Critical State Soil Mechanics (CSSM) framework is developed for the base (F161) and 1–15% NS-treated sands. Table 6 lists the gradient (Mcs) of the critical state lines on q p plane (Figure 12), along with the critical state friction angle, ϕ cs (deduced using Equation (4)) for the base sand and four NS-treated sands.
M cs = 6   S i n   ϕ cs 3 S i n   ϕ cs                

Critical State Locus in q p Plane

Referring to Table 6 and Figure 12, addition of NS to the base sand produced substantial increases in M cs , although the variation of M cs for 1–15% NS content was marginal. Compared to the base sand, ϕ cs increased by 3.7° (i.e., increasing from 29.1° to 32.8°) for 15% NS addition, with a 2.9° increase achieved for NS content increasing from 1% to 15%.
However, NS appears to be a relatively more effective proppant than silica silt (that is, of similar mineralogy but with larger D50). As a means of comparison, our experimental results are contrasted with similar recent findings for two quarzitic angular to sub-rounded uniformly graded Toyoura and Fujian sands mixed with 0–15% angular silica silt. For these silty sand mixtures, Yang and Wei [4] showed a very modest (<2%) increase in ϕ cs. This example also demonstrates the significance of the particle shape and size comprising the fines content.
The non-intrinsic component of friction angle in granular materials ( ϕ g ) is dependent on particle interlocking and comprises of mobilized particle dilation ( ϕ d ) and particle re-arrangement/damage ( ϕ p ) contributions, with the former a function of confinement level and particle texture. As such, ϕ d is inversely proportional to void ratio and adopts a nominal zero value when void ratio reaches the critical (or constant volume) state. At critical state, the friction angle comprises the intrinsic mineral-controlled interparticle friction angle ( ϕ μ ) and a limited ϕ g (<6°) that largely depends on the levels of particle rearrangement and damage. Unlike silica silt, rounded NS flocs minimize the shearing-induced particle damage to sharp sand particle asperities by allowing neighboring sand particles to move over one another, thereby generating a dilative material response. Further, the relatively smaller mean size of the NS flocs leads to the development of higher levels of specific surface and a tendency of the sand particles to be finely coated. This provides additional support to sand particle edges and increases ϕ p . Collectively, these factors limit the ‘edge chipping’ effect, thereby increasing the magnitude of ϕ cs.
To better understand the effect of fines content, ϕ cs is plotted against NC content in Figure 13a. For consistency and comparison purposes, the general equation offered in Yang and Wei [4] for linear variation of ϕ cs with fines content (Equation (5)) is employed here,
ϕ cs   ( F c ) = k   F c + ϕ cs   ( F c = 0 )
where F c is the fines content and k is the gradient of the of ϕ cs   ( F c )   against   F c regression line.
For the F161 test sand, a k = 0.27 was determined (for a regression coefficient of 0.95). This is greater than reported k values of 0.05 and 0.12 for the Toyoura and Fujian sands, respectively, when mixed with crushed silica in the investigations by [4]. The mineralogical composition of the base F161, Toyoura and Fujian sands and their fines contents are similar. Variations in D50 and roundness (R) of these sands are marginal (refer to values listed in Figure 13a). As such, the main difference between these testing materials lies in the particle shapes and sizes of their fines content. That is, compared to the quarzitic crushed silica fines (D50 = 53.9 µm, R = 0.377) employed by Yang and Wei [4], the silica flocs produced from polymerized colloidal NS used in the present investigation had a D50 = 11.8 µm, R = 0.482 and S = 0.822 (i.e., much smaller and rounder than crushed silica). It is hypothesized that the greater sensitivity of ϕ cs to silica content seen for NS–sand mixtures could be either due to the rounder shape or due to smaller size of the NS flocs. To examine this further, ϕ cs is plotted against R com in Figure 13b, where R com (Equation (6)) is the roundness of the combined base sand and fines fraction,
R com = R S ( 1 F c ) + R F F c
where R S and R F are the roundness of the base sand and fines content, respectively, and F c is the fines content.
Figure 13b offers some interesting findings. When base Toyoura and Fujian sands are modified with silica silt, the shape (roundness) and hence origin of the silt particles appears to have no great influence on the ϕ cs magnitude, with only a marginal reduction in ϕ cs occurring for employing rounder silt particles in the binary mixture. However, when base F161 sand in modified with NS, the smaller size and rounder shape of the silica flocs have a substantial influence on the ϕ cs magnitude (see Figure 13b). That is, the NS additive used in the present investigation appears to have produced substantially higher sensitivity of ϕ cs to particle shape. Greater values of ϕ cs can be achieved when NS flocs adopt rounder shapes. Sphericity and roundness in NS precipitates directly correlate to the rate of silica precipitation in soil [47]. This can be achieved, either by introducing NS at elevated temperatures or using ‘adjusting’ salt solutions, as is the case in this investigation.

5. Commercial and Environmental Compatibility

The last 70 years have seen a rise in research and use of inorganic engineered nano-particle materials (ENMs) in electronics, automotive, aeronautical and construction industries [48]. Given the typically lighter, stronger and more energy efficient properties of ENMs, AECOM predicted that over 50% of building materials will contain nanomaterials by 2025 [49]. The share of nanotechnology in building materials, however, is generally likely to be smaller. This is mainly, due to the uncertainty and misinformation in relation to these materials, the confused definition of them across the construction industry and regional and national standards, current limited knowledge of them by constructional professionals, their uncertain environmental, toxicological and ecotoxicological implications [50], their likelihood of dissolution and spread into the environment and subsequent human exposure, difficulties in measurement and mitigations measures, and commercial viability. With the latter, among the 156 nano-enabled construction products developed, to-date [51], many fail to be converted into marketable products and have remained at early stages of development with little chance of commercial viability.
Over the past 50 years, NS has been broadly used in pharmaceutical, food, textile, printer toner, cosmetics, paint and coating (silane, siloxane and polysilazane), medical and drug products [50], and has scope to be used at industrial level as low-viscose grouts for ground improvement purposes, including compensation grouting for submerged excavations [52], permeation grouting for geological containment and storage of hazardous wastes, and corrective grouting in fractured rocks. In comparison with cement, NS grouts offer a control on the induction and gel time, and also better penetrability in finer soils. This, together with their suitable mechanical properties, allows their application to soil via non-disruptive low-gradient delivery [22]. The undrained mechanical properties of NS-treated sands were studied in previous sections. The economical and environmental viability of NS grout and their possible implications for application of a 5% solution in 1 L of saturated porous sand of 1530 kg/m3 bulk density is briefly discussed below.

5.1. Environmental Viability

Wang et al. [50] used probabilistic material flow modelling to study the possible environmental risks of NS in the environment. For the EU zone, they showed that the predicted environmental concentration (PEC) of NS in surface water ranges from 0.053–3.3 µg/kg, and as high as 60 µg/kg in shallow soils. For this estimation, they assumed that 10% of the total NS consumption—that is a modest 18,000 tonne/year—is released to the environment. From a toxicological perspective, dissolved silica is only toxic at concentrations well-above the solubility limit, in the hundreds of mg/L range [53]. From an ecotoxicological perspective, exposure of micro-organisms (e.g., 
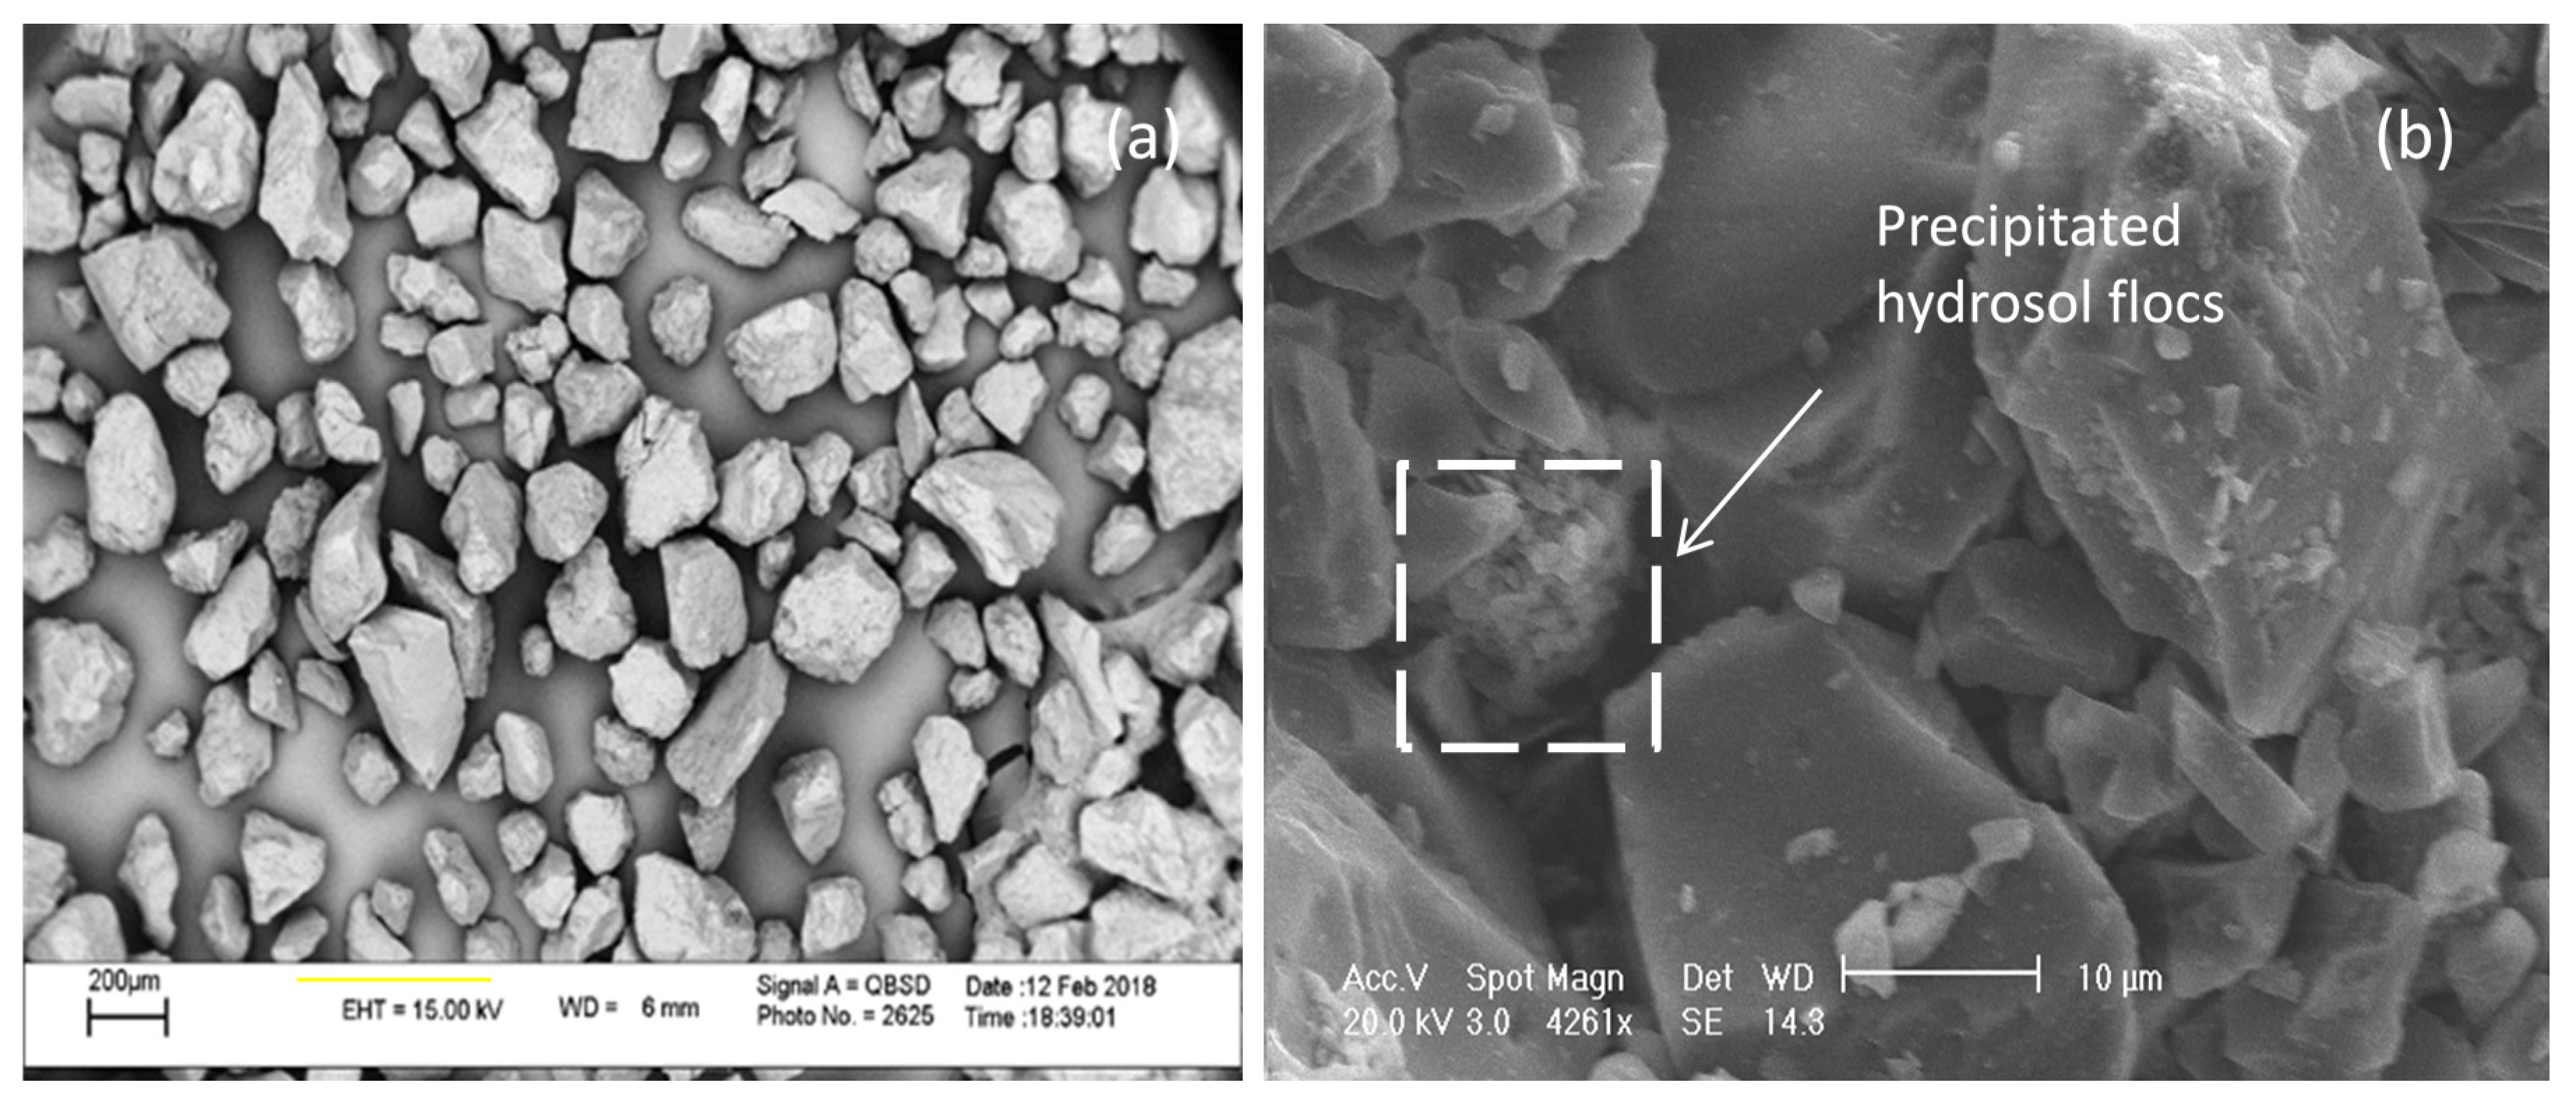
P. subcapitata, D. magna, …) to PECs above 0.4 g/L can lead to a nearly 50% mortality rate. For 5% NS concentration in typical saturated sandy soil, the PEC of nano-silica in soil totals around 76 g/L. As such, compared to traditional calcium-based proppants, NS is relatively less harmful and should impose no direct environmental risks to humans for controlled and contained groundwork applications; although the likely impacts on microorganisms need to be further established. Assadi-Langroudi [47] showed that synthetic amorphous silica (NS being a peculiar form of which) in granular soils appears in two different forms of dispersed coating units and sub-rounded flocs (precipitation conditions dependent). He showed that NS flocs with rounded globular (as seen in the present work-Figure 2b) or short tangled laminar shape are less likely to be dislocated by groundwater flow from the particle-level sites into the groundwater, thereby posing little environmental risk at strictly local levels (also see [54]).

5.2. Commercial Viability

NS has been used as additive in the concrete and insulation industries for over 30 years. Ultrafine powder (approximately 150 nm in size) silica fume and NS (5–100 nm in size) have been used in concrete to provide rapid strength gain, enhanced strength, better durability, and surface finish. Silica fumes are widely available in the UK and across the globe. Although, it is not often marketed as nanomaterials by manufacturers. These are expensive products and are only modestly adopted in commercial settings. In a smaller scale, NS is infrequently used as an insulator and in the form of silica aerogels. These are readily available on the market, but their broad use is blighted by their typically 6 to 10 times higher costs in comparison with traditional, but less efficient, insulation products [51].
In fractured rocks and soil, the main practical advantages of NS are high penetration capacity and a chance of controlling the gelling time and hence the penetration depth. For a 5% NS solution, treatment of each cubic meter of sandy soils (of a porosity of 35%) on average costs around US$ 60 [55]. This is relatively lower than the treatment costs incurred using other alternative non-cement-based grouts (that offer better penetrability than cement), including polyurethane, epoxy resin, acrylamide, methacrylate, acrylate, and sodium silica. For example, treatment of one cubic meter of sand with acrylamide, on average, costs around US$ 325. Apart from the higher cost, recent environmental leakage incidents (e.g., in Romeriksporten tunnel, Norway and Hallandsås tunnel, Sweden, reported in [56]) cast doubt on the suitability of these materials for permeation grouting.
NS is commercially available as low viscosity grout in gel state with a strict use-by-date. Examples are CemSyn manufactured in India, Meyco MP320 manufactured in Sweden and MP320T manufactured in Germany. The main difference between these commercial products is their silica content and particle specific surface area values [57].

6. Summary and Conclusions

Use of amorphous silica in modification of loose sands has received some attention. Although, limited understanding of the complex yield and post-yield responses of sand-NS mixtures continue to be barriers to more widespread application of the technique. The behavior of such binary mixtures is dependent on the base sand’s particle size and shape and initial packing state, the fines content and its particle size and shape properties, as well as the conditions (e.g., confinement level and silica precipitation rate) under which the fines are placed into the skeletal structure of the base sand. The fines content proportion must be limited so that the sand skeleton maintains overall control of the behavior of the binary mixture.
The presented bench-scale experimental work has added to the body of knowledge through a program of monotonic consolidated-undrained triaxial compression testing on medium-dense sub-angular fine sand in base form and after treatment with 1–15% NS solutions. With the main emphasis on post-yield response of the test materials, the findings from this work inform practitioners with an interest in using colloidal NS grout in remediation of distressed sandy earth systems/structures. Key findings based on the particular F161 sand investigated are:
  • The specimen preparation method employed successfully placed the NS grout into saturated metastable sand with marginal impact on the void ratio. As such, this demonstrated at bench scale the potential for proppant-less groundwork interventions.
  • Isotropic consolidation for p c ≤ 200 kPa produced limited sensitivity of void ratio to NS content, with minimum impact occurring for 200 kPa. That is, the interparticle forces mobilized under isotropic consolidation reached their maximum possible level for p c = 200 kPa.
  • Maximum failure and residual shear strengths mobilized for the NS-treated sand also occurred for p c = 200 kPa. Both strength parameters increased in magnitude with increasing NS content, largely on account of resulting greater apparent cohesion. NS-treated sand behaved stiffer, underwent reduced strain softening and experienced a predominantly dilative response. The increase in residual shear strength was gentle for NS contents of up to 10% and more pronounced as NS increased to 15%. The mixtures’ responses to undrained loading, and as such, are dependent on both confinement level and NS content, due to peculiar micro-mechanical events occurring at particle level.
  • Compared to silica silt, ϕ cs is sensitive to NS content (direct proportionality relationship). That is, the smaller-sized NS inclusions produced substantially higher sensitivity of ϕ cs to particle shape. Greater ϕ cs values are possible when adjustments are made for rapid precipitation of NS in sand. Quick precipitation produces rounder, more spherical-shaped NS flocs resulting in higher ϕ cs values.
  • Likely benefits of colloidal NS addition to metastable sand deposits include substantial preservation of soil drainage function for flood attenuation and in revitalizing soil life to balance their composition, thereby providing a much-improved ecosystem for biodiversity and opening up areas for green spaces where there may have been a lack of flora and fauna. This leads to improved wellbeing for all. Full-scale trails are required for field validation of the proposed approach.

Author Contributions

Conceptualization, S.G., A.A.-L., C.H., H.B.; data curation, S.G., T.G.; formal analysis, S.G.; funding acquisition, S.G., A.A.-L., C.H.; supervision, A.A.-L., C.H., H.B.; validation, S.G., B.C.O.; writing—original draft, S.G., A.A.-L., C.H., B.C.O.; writing—review and editing, S.G., A.A.-L., C.H., H.B., B.C.O. All authors have read and agreed to the published version of the manuscript.

Funding

The research was, in part, supported by the Higher Education Sprout Project, Ministry of Education, Taiwan, Headquarters of University Advancement to the National Cheng Kung University. The APC was funded by grant: 109-2636-E-006-016, Ministry of Sciences and Technology, Taiwan.

Acknowledgments

The lead author appreciates the Young Scholar Fellowship Program by the Ministry of Science and Technology, Taiwan: Grants: 109-2636-E-006-016 and 108-2636-E-006-003, from which, the APC was funded. The research was, in part, supported by the Higher Education Sprout Project, Ministry of Education, Taiwan, Headquarters of University Advancement to the National Cheng Kung University.

Conflicts of Interest

The authors declare no conflict of interest.

Abbreviations

Bpore pressure coefficient
cpeakpeak apparent cohesion
Cucoefficient of uniformity
Cccoefficient of curvature
Drrelative density
D10, D30, D60particle sizes corresponding to 10%, 30% and 60% dry masses passing, respectively
D50mean particle size
ecvoid ratio after isotropic consolidation stage
emaxmaximum void ratio
eminminimum void ratio
F c fines content
Gsspecific gravity
k gradient of the ϕ cs   ( F c )   against   F c regression line
Mcscritical state parameter
Nnumber of surficial features
pcmean effective stress at end of isotropic consolidation stage
qprincipal stress difference (= σ1σ3)
qpeakpeak deviatoric stress
qPTdeviatoric stress at phase transformation point
qUSSdeviatoric stress at ultimate steady state
qresresidual deviatoric stress
Rroundness
Rcomroundness of the combined base sand and fines fraction
RFroundness of the fines content
RSroundness of the base sand
riequivalent particle radius
rmax-inradius of the largest sphere inscribing the particle
rmin-cirradius of the smallest sphere circumscribing the particle
Ssphericity
ufmaximum excess pore-water-pressure ratio
εpeakpeak axial strain
ϕ cscritical state friction angle
ϕ dcontribution of particle dilation to mobilized effective friction angle
ϕ geffective friction angle in granular materials
ϕ pcontribution of particle rearrangement/damage to mobilized effective friction angle
ϕ peakpeak effective friction angle
ϕ μ intrinsic mineral-controlled interparticle friction angle
σ1major effective principal stress
σ3minor effective principal stress

References

  1. Casagrande, A. On liquefaction phenomena. Géotechnique 1971, 21, 197–202. [Google Scholar]
  2. Chu, J.; Leong, W.K.; Loke, W.L.; Wanatowski, D. Instability of loose sand under drained conditions. J. Geotech. Geoenviron. Eng. 2012, 138, 207–216. [Google Scholar] [CrossRef]
  3. Wood, M.D.; Belkheir, K.; Liu, D.F. Strain softening and state parameters for sand modelling. Géotechnique 1994, 44, 335–339. [Google Scholar] [CrossRef]
  4. Yang, J.; Wei, L.M. Collapse of loose sand with the addition of fines: The role of particle shape. Géotechnique 2012, 62, 1111–1125. [Google Scholar] [CrossRef] [Green Version]
  5. Kramer, S.L.; Seed, H.B. Initiation of soil liquefaction under static loading conditions. J. Geotech. Eng. 1988, 114, 412–430. [Google Scholar] [CrossRef]
  6. Sladen, J.A.; D’Hollander, R.D.; Krahn, J. The liquefaction of sands, a collapse surface approach. Can. Geotech. J. 1985, 22, 564–578. [Google Scholar] [CrossRef]
  7. Thevanayagam, S. Effect of fines and confining stress on undrained shear strength of silty sands. J. Geotech. Geoenviron. Eng. 1998, 124, 479–491. [Google Scholar] [CrossRef]
  8. Verdugo, R.; Ishihara, K. The steady state of sandy soils. Soils Found. 1996, 36, 81–91. [Google Scholar] [CrossRef] [Green Version]
  9. Lade, P.V.; Yamamuro, J.A.; Liggio, C.D., Jr. Effects of fines content on void ratio, compressibility, and static liquefaction of silty sand. Geomech. Eng. 2009, 1, 1–15. [Google Scholar] [CrossRef]
  10. Yamamuro, J.A.; Covert, K.M. Monotonic and cyclic liquefaction of very loose sands with high silt content. J. Geotech. Geoenviron. Eng. 2001, 127, 314–324. [Google Scholar] [CrossRef]
  11. Pitman, T.D.; Robertson, P.K.; Sego, D.C. Influence of fines on the collapse of loose sands. Can. Geotech. J. 1994, 31, 728–739. [Google Scholar] [CrossRef]
  12. Georgiannou, V.N. The undrained response of sands with additions of particles of various shapes and sizes. Géotechnique 2006, 56, 639–649. [Google Scholar] [CrossRef]
  13. Murthy, T.G.; Loukidis, D.; Carraro, J.A.H.; Prezzi, M.; Salgado, R. Undrained monotonic response of clean and silty sands. Géotechnique 2007, 57, 273–288. [Google Scholar] [CrossRef]
  14. Cheng, K.; Zhang, J.; Miao, Y.; Ruan, B.; Peng, T. The effect of plastic fines on the shear modulus and damping ratio of silty sands. Bull. Eng. Geol. Environ. 2019, 78, 5865–5876. [Google Scholar] [CrossRef]
  15. Li, Y. Effects of particle shape and size distribution on the shear strength behavior of composite soils. Bull. Eng. Geol. Environ. 2013, 72, 371–381. [Google Scholar] [CrossRef]
  16. Woo, S.I.; Salgado, R. Bounding surface modeling of sand with consideration of fabric and its evolution during monotonic shearing. Int. J. Solids Struct. 2015, 63, 277–288. [Google Scholar] [CrossRef]
  17. Kaga, M.; Yonekura, R. Estimation of strength of silicate grouted sand. Soils Found. 1991, 31, 43–59. [Google Scholar] [CrossRef] [Green Version]
  18. Zomorodian, S.M.A.; Soleymani, A.; O’Kelly, B.C. Improving erosion resistance of sand using nano-silica additive. Proc. Inst. Civ. Eng. Ground Improv. 2019, 172, 3–11. [Google Scholar] [CrossRef]
  19. Kodaka, T.; Ohno, Y.; Takyu, T. Cyclic shear characteristics of treated sand with colloidal silica grout. In Proceedings of the 16th International Conference on Soil Mechanics and Geotechnical Engineering, Osaka, Japan, 12–15 September 2005; pp. 401–404. [Google Scholar]
  20. Tsukamoto, Y.; Ishihara, K.; Umeda, K.; Enomoto, T.; Sato, J.; Hirakawa, D.; Tatsuoka, F. Small strain properties and cyclic resistance of clean sand improved by silicate-based permeation grouting. In Proceedings of the Soil Stress-Strain Behavior: Measurement, Modeling and Analysis, Geotechnical Symposium, Rome, Italy, 16–17 March 2006; pp. 503–511. [Google Scholar]
  21. Díaz-Rodríguez, J.A.; Antonio-Izarraras, V.M.; Bandini, P.; López-Molina, J.A. Cyclic strength of a natural liquefiable sand stabilized with colloidal silica grout. Can. Geotech. J. 2008, 45, 1345–1355. [Google Scholar] [CrossRef]
  22. Gallagher, P.M.; Pamuk, A.; Abdoun, T. Stabilization of liquefiable soils using colloidal silica grout. J. Mater. Civ. Eng. 2007, 19, 33–40. [Google Scholar] [CrossRef]
  23. Porcino, D.; Marcianò, V.; Granata, R. Static and dynamic properties of a lightly cemented silicate-grouted sand. Can. Geotech. J. 2012, 49, 1117–1133. [Google Scholar] [CrossRef]
  24. Spencer, L.M.; Rix, G.J. Small strain dynamic properties of colloidal silica gel and sand mixtures. In Proceedings of the Fourth International Symposium on Deformational Characteristics of Geomaterials, Atlanta, GA, USA, 22–24 September 2008; Burns, S.E., Mayne, P.W., Santamarina, J.C., Eds.; IOS: Amsterdam, The Netherlands, 2018; pp. 299–303. [Google Scholar]
  25. Zomorodian, S.M.A.; Shabnam, M.; Armina, S.; O’Kelly, B.C. Strength enhancement of clean and kerosene-contaminated sandy lean clay using nanoclay and nanosilica as additives. Appl. Clay Sci. 2017, 140, 140–147. [Google Scholar] [CrossRef]
  26. BSI. 1377-2. Methods of test for soils for civil engineering purposes. In Classification Tests; BSI: London, UK, 1990. [Google Scholar]
  27. Wadell, H. Volume, shape, and roundness of rock particles. J. Geol. 1932, 40, 443–451. [Google Scholar] [CrossRef]
  28. Agapoulaki, G.I.; Papadimitriou, A.G. Rheological properties of colloidal silica as a means for designing passive stabilization of liquefiable soils. In Proceedings of the 16th European Conference on Soil Mechanics and Geotechnical Engineering, Edinburgh, Scotland, 13–17 September 2015; Winter, M.G., Smith, D.M., Eldred, P.J.L., Toll, D.G., Eds.; Institution of Civil Engineers: London, UK, 2015; Volume 5, pp. 2331–2336. [Google Scholar]
  29. Dibben, S.C. A Microstructure Model for Collapsing Soils. Ph.D. Thesis, Nottingham Trent University, Nottingham, UK, 1998. [Google Scholar]
  30. Miller, H. Modelling the Collapse of Metastable Loess Soils. Ph.D. Thesis, Nottingham Trent University, Nottingham, UK, 2002. [Google Scholar]
  31. Zourmpakis, A. Factors Affecting Bonding in Loess Soils. Ph.D. Thesis, University of Birmingham, Birmingham, UK, 2005. [Google Scholar]
  32. Graton, L.C.; Fraser, H.J. Systematic packing of spheres with particular relation to porosity and permeability. J. Geol. 1935, 63, 785–909. [Google Scholar] [CrossRef]
  33. Assadi-Langroudi, A.; Ng’ambi, S.; Smalley, I. Loess as a collapsible soil: Some basic particle packing aspects. Quat. Int. 2018, 469, 20–29. [Google Scholar] [CrossRef]
  34. Lade, P.V.; Ibsen, L.B. A study of the phase transformation and the characteristic lines of sand behaviour. In Proceedings of the International Symposium on Deformation and Progressive Failure in Geomechanics, Nagoya, Japan, 4–7 October 1997; pp. 353–359. [Google Scholar]
  35. Yoshimine, M.; Ishihara, K. Flow potential of sands during liquefaction. Soils Found. 1998, 38, 189–198. [Google Scholar] [CrossRef] [Green Version]
  36. Robertson, P.K.; Wride, C.E.; List, B.R.; Atukorala, U.; Biggar, K.W.; Byrne, P.M.; Finn, W.D.L. The CANLEX project: Summary and conclusions. Can. Geotech. J. 2000, 37, 563–591. [Google Scholar] [CrossRef]
  37. Vaid, Y.P.; Sivathayalan, S. Fundamental factors affecting liquefaction susceptibility of sands. Can. Geotech. J. 2000, 37, 592–606. [Google Scholar] [CrossRef]
  38. Yoshimine, M.; Robertson, P.K.; Wride, C.E. Undrained shear strength of clean sands to trigger flow liquefaction. Can. Geotech. J. 1999, 36, 891–906. [Google Scholar] [CrossRef]
  39. Gallagher, P.M.; Mitchell, J.K. Influence of colloidal silica grout on liquefaction potential and cyclic undrained behavior of loose sand. Soil Dyn. Earthq. Eng. 2002, 22, 1017–1026. [Google Scholar] [CrossRef]
  40. Rodríguez, J.A.D.; Izarraras, V.M.A. Mitigation of liquefaction risk using colloidal silica stabilizer. In Proceedings of the 13th World Conference on Earthquake Engineering, Vancouver, BC, Canada, 1–6 August 2004. [Google Scholar]
  41. Towhata, I.; Kabashima, Y. Mitigation of seismically-induced deformation of loose sandy foundation by uniform permeation grouting. In Proceedings of the 15th International Conference on Soil Mechanics and Geotechnical Engineering, Earthquake Geotechnical Engineering Satellite Conference, Istanbul, Turkey, 24–25 August 2001; Ansal, A.M., Ed.; pp. 313–318. [Google Scholar]
  42. Clough, G.W.; Iwabuchi, J.; Rad, N.S.; Kuppusamy, T. Influence of cementation on liquefaction of sands. J. Geotech. Eng. 1989, 115, 1102–1117. [Google Scholar] [CrossRef]
  43. Saxena, S.K.; Reddy, K.R.; Avramidis, A.S. Liquefaction resistance of artificially cemented sand. J. Geotech. Eng. 1988, 114, 1395–1413. [Google Scholar] [CrossRef]
  44. Dano, C.; Hicher, P.Y.; Tailliez, S. Engineering properties of grouted sands. J. Geotech. Geoenviron. Eng. 2004, 130, 328–338. [Google Scholar] [CrossRef]
  45. Wang, Y.; Leung, S. Characterization of cemented sand by experimental and numerical investigations. J. Geotech. Geoenviron. Eng. 2008, 134, 992–1004. [Google Scholar] [CrossRef]
  46. Schofield, A.N.; Wroth, C.P. Critical State Soil Mechanics; McGraw Hill: Maidenhead, UK, 1968. [Google Scholar]
  47. Assadi-Langroudi, A. Micromechanics of Collapse in Loess. Ph.D. Thesis, University of Birmingham, Birmingham, UK, 2014. [Google Scholar]
  48. Keller, A.A.; McFerran, S.; Lazareva, A.; Suh, S. Global life cycle releases of engineered nanomaterials. J. Nanoparticle Res. 2013, 15, 1692. [Google Scholar] [CrossRef]
  49. AECOM. The Blue Book: Property and Construction Handbook International Edition; AECOM: Los Angeles, CA, USA, 2014. [Google Scholar]
  50. Wang, Y.; Kalinina, A.; Sun, T.; Nowack, B. Probabilistic modeling of the flows and environmental risks of nano-silica. Sci. Total Environ. 2016, 545, 67–76. [Google Scholar] [CrossRef] [PubMed]
  51. Jones, W.; Gibb, A.; Goodier, C.; Bust, P.; Song, M.; Jin, J. Nanomaterials in construction–what is being used, and where. Proc. Inst. Civ. Eng. Constr. Mater. 2019, 172, 49–62. [Google Scholar] [CrossRef] [Green Version]
  52. Funehag, J. Guide to Grouting with Silica Sol—For Sealing in Hard; BeFo Report 118; Rock Engineering Research Foundation: Stockholm, Sweden, 2012. [Google Scholar]
  53. Neal, C.; Neal, M.; Reynolds, B.; Maberly, S.C.; May, L.; Ferrier, R.C.; Smith, J.; Parker, J.E. Silicon concentrations in UK surface waters. J. Hydrol. 2005, 304, 75–93. [Google Scholar] [CrossRef]
  54. Donaldson, K.; Poland, C.A.; Murphy, F.A.; MacFarlane, M.; Chernova, T.; Schinwald, A. Pulmonary toxicity of carbon nanotubes and asbestos—Similarities and differences. Adv. Drug Deliv. Rev. 2013, 65, 2078–2086. [Google Scholar] [CrossRef]
  55. Zhao, M.; Liu, G.; Zhang, C.; Guo, W.; Luo, Q. State-of-the-Art of Colloidal Silica-Based Soil Liquefaction Mitigation: An Emerging Technique for Ground Improvement. Appl. Sci. 2020, 10, 15. [Google Scholar] [CrossRef] [Green Version]
  56. Sverdrup, L.E.; Kelley, A.E.; Weideborg, M.; Ødegård, K.E.; Vik, E.A. Leakage of chemicals from two grouting agents used in tunnel construction in Norway: Monitoring results from the tunnel Romeriksporten. Environ. Sci. Technol. 2000, 34, 1914–1918. [Google Scholar] [CrossRef]
  57. Shen, P.; Hankins, N.; Jefferis, S. Selection of colloidal silica grouts with respect to gelling and erosion behaviour. Geosciences 2017, 7, 6. [Google Scholar] [CrossRef] [Green Version]
Figure 1. Grading quality for F161 sand: (a) particle size distribution; (b) mode size distribution.
Applsci 10 05192 g001
Figure 2. Shape on secondary electron micrograms: (a) sub-angular F161 sand particles; (b) rounded hydrated amorphous NS flocs.
Applsci 10 05192 g002
Figure 3. Set up for preparation of grouted specimens and triaxial compression testing: (a) monotonic triaxial apparatus; (b) remolded specimen in double-split-type mold under small 15 kPa vacuum pressure applied at two points around perimeter; (c) NS-stabilized test specimen.
Applsci 10 05192 g003
Figure 4. Variation of packing state with nano-silica content in terms of post-consolidation.
Applsci 10 05192 g004
Figure 5. State transitions during undrained shearing of isotopically-consolidated triaxial specimens: (a) phase transformation state; (b) steady states ([35] with modifications).
Applsci 10 05192 g005
Figure 6. Stress path following undrained shear behavior: (a) base sand; (b) 1% NS; (c) 5% NS; (d) 10% NS; (e) 15% NS; (f) perturbations for 1% NS.
Applsci 10 05192 g006aApplsci 10 05192 g006b
Figure 7. Stress-strain traces for undrained triaxial compression of base and NS-treated sands isotropically consolidated for p c values of: (a)   100   kPa ; (b) 200   kPa ; (c) 300   kPa ; (d) 400   kPa .
Applsci 10 05192 g007
Figure 8. Variation of flow potential with nano-silica content.
Applsci 10 05192 g008
Figure 9. Variation of normalized peak shear strength with nano-silica content.
Applsci 10 05192 g009
Figure 10. Variation in axial strain at peak deviatoric stress with nano-silica content.
Applsci 10 05192 g010
Figure 11. Variation in residual deviatoric stress with nano-silica content.
Applsci 10 05192 g011
Figure 12. Critical states in q p plane for base and NS-treated sands.
Applsci 10 05192 g012
Figure 13. Variation of critical state friction angle with; (a) NS content; and (b) combined roundness of particles forming binary mixtures. Note: FS and TS, Fujian and Toyoura sands (Yang and Wei, 2012); F161, base sand for present investigation.
Applsci 10 05192 g013
Table 1. Grading, packing and shape parameters for F161 sand.
ParameterValue
R0.428
S0.604
D10: mm0.16
D30: mm0.21
D50: mm0.23
D60: mm0.28
Cu0.97
Cc1.78
Gs2.68
emin0.548
emax0.943
coefficient of uniformity; coefficient of curvature.
Table 2. Grading, packing, chemical and shape parameters for colloidal NS and silica floc.
ParameterValue
R0.482
S0.822
D50: nm11–16
Specific surface area: m2/g600–785
Bulk density: g/cm30.1
Real density: g/cm32.4
Viscosity: cP5.5
pH10
Purity: %99
Table 3. Chemical composition of colloidal NS.
ComponentFraction: wt.%
SiO233.96
Fe2O30.07
Al2O30.27
Na2O5.02
Cl0.35
P2O50.11
CaO0.07
MgO0.046
SO30.097
K2O0.12
LOI59.89
Table 4. Basic properties of test specimens.
Test IDpc: kPaNS: wt.%ecDr: %
S(0):10010000.80834
S(1):10010010.80535
S(5):10010050.79837
S(10):100100100.79538
S(15):100100150.79139
S(0):20020000.78341
S(1):20020010.78041
S(5):20020050.77842
S(10):200200100.77543
S(15):200200150.77343
S(0):30030000.76744
S(1):30030010.76545
S(5):30030050.76346
S(10):300300100.75947
S(15):300300150.75647
S(0):40040000.74849
S(1):40040010.74450
S(5):40040050.74251
S(10):400400100.73952
S(15):400400150.73653
Table 5. Testing program and steady states.
Test ID e c p c : kPa q f : kPa q p e a k : kPa q P T : kPa q U S S : kPa εf
S(0):1000.808100177.04435.8164.70.291
S(1):1000.805100208.68955.2203.60.288
S(5):1000.798100256.713570.3208.60.255
S(10):1000.795100312.117584.2254.30.231
S(15):1000.791100345.721891.3263.90.220
S(0):2000.783200182.655119.4173.30.270
S(1):2000.780200284.0139126.1276.90.255
S(5):2000.778200369.1145142.4369.10.242
S(10):2000.775200431.8185150.9431.80.226
S(15):2000.773200550.7310180.2470.90.198
S(0):3000.767300429.8176175.4396.50.268
S(1):3000.765300645.2274255.3548.10.243
S(5):3000.763300718.2295285.5596.60.230
S(10):3000.759300825.6428318.8608.50.206
S(15):3000.756300924.6460322.3798.50.198
S(0):4000.748400717.0268220.1597.80.258
S(1):4000.744400891.6412390.7764.70.246
S(5):4000.742400957.1569425.9766.20.210
S(10):4000.739400985.3640443.7769.20.205
S(15):4000.7364001212.5710475.11024.50.178
Table 6. Effect of NS on critical state parameters.
Soil IDNS: wt.%Mcs ϕ cs: Degree
S(0)01.1029.1
S(1)11.1929.9
S(5)51.2430.9
S(10)101.2932.1
S(15)151.3232.8

