Abstract
A high-speed, high-resolution swept-source optical coherence tomography (SS-OCT) is presented for focusing lens imaging and a k-domain uniform algorithm is adopted to find the wave number phase equalization. The radius of curvature of the laser focusing lens was obtained using a curve-fitting algorithm. The experimental results demonstrate that the measuring accuracy of the proposed SS-OCT system is higher than the laser confocal microscope. The SS-OCT system has great potential for surface topography measurement and defect inspection of the focusing lens.
1. Introduction
The radius of curvature (ROC) is a key parameter for focusing a lens. The measuring accuracy of the ROC is essential for the focusing intensity of the laser beam. One of the non-contact measuring methods commonly used in ROC measurement is the interferometer [1]. Spiridonov et al. introduced a ROC-measuring system for spherical mirrors that can easily obtain high measurement-accuracy at reasonable cost [2]. Anand et al. measured the ROC and other optical parameters by means of a digital holographic interferometer that compared the wavefront from the test lens with a digitally inserted plane wavefront while changing the incident angle of this digital wavefront [3]. Lawall et al. incorporated concave mirror into plano-concave Fabry–Perot cavity to measure ROC by using the principle of multi-beam interference [4]. Sun et al. demonstrated a differential radius-measuring system to perform high-precision ROC measurement through the interference-length measuring technology [5]. Wang et al. proposed a differential confocal self-collimation decentration measurement method, which can obtain ROC of optical element by using the differential confocal to precisely identify the center and vertex positions of the tested lens surface [6]. However, the interferometer has also some disadvantages, such as complicated structure and high cost. Moreover, the measuring accuracy is directly related to the focusing sensitivity. The measurement repeatability is unstable. If optical element is fixed, the ROC measurement will be restricted because of the limited propagating light. The laser confocal microscope has measuring advantages in ROC measurement with high measuring repeatability. Unfortunately, the inner structure cannot be detected with this method.
Optical coherence tomography (OCT) is a non-contact, non-invasive optical imaging technique with high resolution. OCT can find the 1D depth image, 2D cross-sectional image and 3D topography by measuring the backscatter light of different depth in the sample using the low-coherence interferometry principle [7]. OCT has been widely used in ophthalmic imaging, medical endoscopy, cell and material detection [8,9,10,11,12,13,14]. It can provide the cross-sectional images of samples in vivo with micron scale resolution. OCT was first, performed in time–domain OCT, which called TD-OCT [15,16]. Fourier-domain OCT (FD-OCT) have attracted more attention than TD-OCT because of its high sensitivity, high signal-to-noise rate and high imaging speed. There are two implementations of the FD-OCT, spectral domain OCT (SD-OCT) and swept-source OCT (SS-OCT). A broadband light source and a spectrometer were used in SD-OCT system. A swept-source, a common photoelectric detector and high-speed data acquisition card were used in SS-OCT system. Compared with SD-OCT, SS-OCT can reach real-time measurement because of its high imaging speed [17,18,19,20,21,22].
SS-OCT is a nondestructive detection method which is suitable for measurement the ROC of optical element with high accuracy, which can get the 1D depth image and the 2D cross-sectional image simultaneously. In this study, the SS-OCT system was set up to measure the ROC of focusing lens, which can perfectly avoid the limitations of traditional measurement methods. Furthermore, it can also get the real-time images of the contour of the ROC.
2. Principle and Systems
2.1. Principle of OCT
OCT generates images by measuring the intensity of the interference light between the backscattering light from the sample and the reference mirror. The interference spectrum detected by the single-point detector can be expressed as the function of the wave number [23].
where Pr is the intensity of the light returned from the reference arm to the detector, Ps is the intensity of the light irradiated to the sample, k(t) = 2π/λ(t) is the wave number changing with time, is the sample depth coordinate, r(z) and ϕ(z) representing the amplitude and phase of the reflection coefficient in the depth direction of the sample, respectively, Г(z) is the coherence function of the light source. In Equation (1), the first two terms are noises. The last term is a superposition of cosine components of different frequencies containing sample axial depth information. It represents the interference spectrum between the reference arm and the different depths of the sample. According to Wiener–Khinchin theorem, the depth information of the object can be reconstructed by performing the inverse Fourier transform of the interference spectrum.
2.2. OCT System
The experimental setup of SS-OCT is represented schematically in Figure 1. It mainly consists of a laser swept-source, a Michelson interferometer, a balanced detector, two-axis Galvano mirror and a data acquisition device.
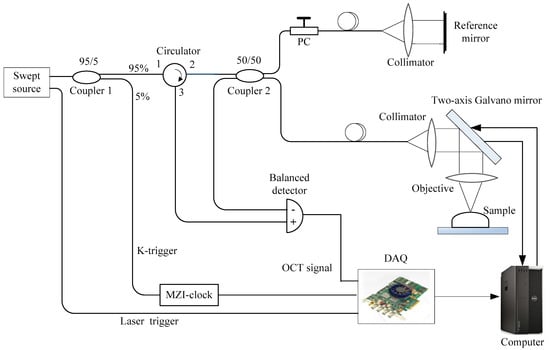
Figure 1.
Experimental setup of swept-source optical coherence tomography (SS-OCT). PC—polarization controller; DAQ—data acquisition card; MZI—Mach–Zehnder interferometer.
The swept-source (SL1310V1-10048, Thorlabs) used in the system has a sweep frequency of 100 kHz, central wavelength of 1.3 μm and -3 dB bandwidth of 80 nm. Its averaged output power is 25 mW. One output from the swept-source as a trigger signal is directly connected to the data acquisition card to control the data acquisition when the laser sweeps. The other output from the swept-source is lead to a 5/95 coupler 1 (1310 nm, Thorlabs), and then divided to two parts. The beam with 95% of the total power is introduced into a fiber-based Michelson interferometer comprising a circulator and a 50/50 coupler 2. The beam with 5% of the total power is connected to the MZI-clock (INT-MZI-1300, Thorlabs) where k-trigger is obtained for external clock generation. One output of the coupler 2 is attached to sample arm which comprises a fiber collimator lens (36 mm focal length, Thorlabs) and two-axis Galvano mirror (OCTP-1300NR, Thorlabs). The other output of the coupler 2 is attached to a reference arm which comprises identical collimator lens and a silver-plated mirror. The lights from the sample arm and the reference arm re-coupled by coupler 2, and then interferes when the optical path difference (OPD) is smaller than coherence length. The spectral interference signal is detected by an InGaAs balanced detector (PDB47C, Thorlabs). The voltage is lead to data acquisition card (ATS9350, Alazar) with sampling rate of 500-Msamples/s. The signal processing procedure is performed by PC (T7810, Dell) with 32 GB storage memory and a LabVIEW program.
2.3. K-trigger
According to the principle of SS-OCT, the depth information ∆z of the sample can be obtained by the inverse Fourier transform of the wave number k. However, the interference spectrum is sampled in linear wavelength domain. If the inverse Fourier transform is directly applied on the interference spectrum, the axial resolution degrades because of the nonlinear relationship between wavelength and wave number [24,25,26]. In order to improve axial resolution of the system, the resampling procedure in linear frequency domain is essential for the OCT images.
Figure 2 shows a schematic diagram of k-trigger signal. The optical signal is divided into two optical paths with different path lengths by a 50/50 coupler 1. The interference signal occurs in the 50/50 coupler 2 and recorded by the dual balanced detector, then is transmitted into data acquisition card. The signals from the balanced detection can be expressed as follows [27,28].
where is the spectral envelope of the incident light, k[ti] is wave number corresponding the time instant of the i–th sample point, n is the refractive index of the fiber, ∆L is the optical path difference (OPD) of two optical paths.

Figure 2.
Schematic diagram of k-trigger signal.
The spectrum X(k) can be obtained by performing the discrete Fourier transforms (DFT) of the signal PMZI(ti), then spectrum Z(k) can be expressed as
The analytic signal z(t) is obtained by inverse DFT of Z(k), which contains the phase information of the wave numbers. The analytic signal i–th and (i+1)-th can be expressed as
In addition,
Then the adjacent phase difference ∆φi can be obtained as
The average phase difference Φ can be expressed as
The phase of the equalization in the wave number can be obtained as
The interference spectrum and the k-rigger calibration signal are acquired synchronously by the DAQ card. The sampling points of k-trigger corresponding to the sampling points of interference spectrum are obtained simultaneously. Then, the equal phase calibration about OCT interference spectrum in wave number domain can be obtained. The k-trigger signal of the sampling point can be expressed as a function of phase. The interference signal can also be expressed as a function of corresponding phase approximately because of the same sampling time.
Assuming the interference spectrum signal can be expressed by a function ƒ(θ) which is corresponding to the phase of the sampling point, where θ is the demodulation phase of the k-trigger sampling point, the linear interpolation of the interference spectrum at equal-phase point ƒ() can be expressed as
where, is the equalization phase, .
With the above proposed method, the interference spectrum in linear wave number domain can be obtained. A plane mirror is placed at the zero optical path difference to get the axial resolution. The measured axial resolution of the SS-OCT system is 9.3 μm.
3. Results
The imaging experiment was performed on a laser focusing lens used in the laser projector to measure the ROC of the focusing lens. A focusing lens with a ROC of 1.25 mm was used for the measuring sample. The charge coupled device (CCD) image and the surface profile of the Laser focusing lens are shown in Figure 3. The measurement area is 2.4 × 3.0 mm as shown in Figure 3a.
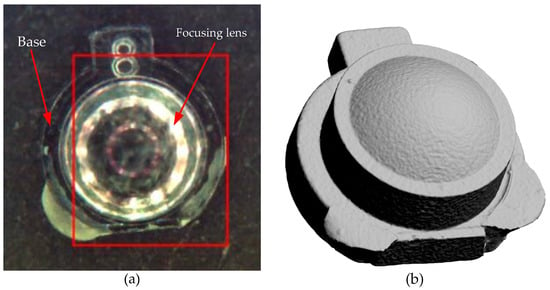
Figure 3.
The images of the focusing lens. (a) CCD image; (b) surface profile.
The laser confocal microscope (LEXT OLS4000, Olympus) with objective lens MPLAPON50X (NA = 0.95, Olympus), 1X optical zoom and field of view is 256 × 256 μm was used to measure ROC of the sample. Figure 4 shows the profile image of the laser focusing lens measured by the laser confocal microscope.
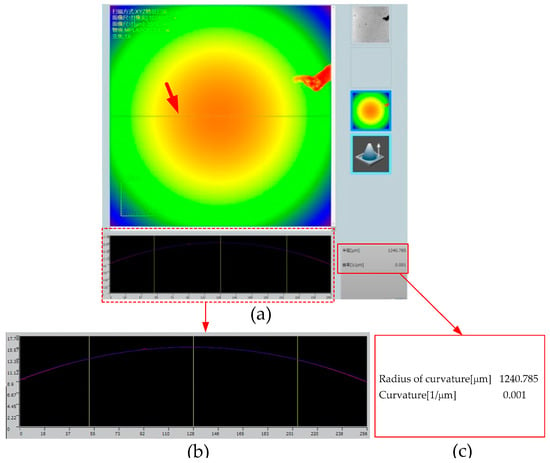
Figure 4.
Profile image was measured by the laser confocal microscope.
The experiment was performed on the laser focusing lens, which measured position was marked by the horizontal line at the central of image as shown in Figure 4a. The profile curve is shown in Figure 4b. From Figure 4c, we can get the ROC of 1.2408 mm.
The imaging experiments were then performed by the proposed SS-OCT system. Figure 5 shows the 2D OCT images at different location of the focusing lens.
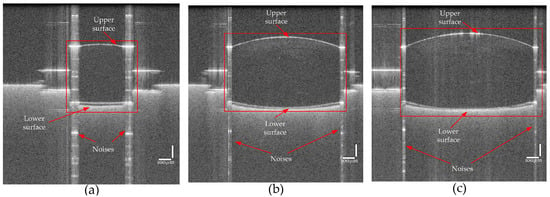
Figure 5.
Two-dimensional optical coherence tomography (OCT) images of the focusing lens with different location. Figure 5 shows the two-dimensional optical coherence tomography images at different location of the focusing lens were performed by the proposed SS-OCT system. The profile curve and the inner structure of the focusing lens were obtained and shown in red rectangle. The light lines at the top and down in red rectangle represent the upper surface and the lower surface of the focusing lens, respectively. The light lines occur at the boundary when the refractive index changes suddenly. A series of straight lines on the left and right sides in the red rectangle are noises caused by strong light reflection from the two edge of the focusing lens. From Figure 5a–c, the length of the upper curve gradually increases with the position changes. Figure 5c is the two-dimensional optical coherence tomography image of the center location of the focusing lens. We can get the ROC value of the lens from Figure 5c.
From Figure 5, we can see the profile curve and the inner structure of the focusing lens. The light lines in Figure 5 represent the upper surface and the lower surface of the focusing lens, respectively. The light lines occurred at the boundary when the refractive index changed suddenly. A series of straight lines in Figure 5 were noises caused by strong light reflection from the two edge of the focusing lens. From Figure 5a–c, the length of the upper curve gradually increased with the position changes. Figure 5c is the 2D OCT image of the center of the focusing lens. We can get the ROC value of the lens from Figure 5c.
The OCT images were first grayed by using the function of “rgb2gray” in MatLab R2015b (MathWorks, United States). Second, the function of “medfilt2”, “imopen” and “bwareaopen” were used for filter morphologic openings to remove all small, connected objects from the binary image. Finally, the fitting curve was obtained using the function of “polyfit” and “polyval”, as shown in Figure 6.
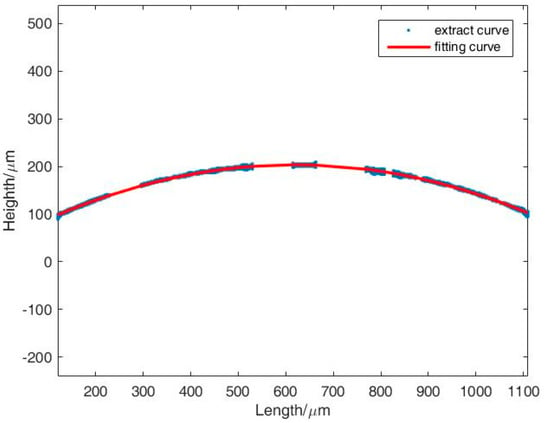
Figure 6.
Graph of fitting curve.
In Figure 6, the blue points were retrieved from the curve of the OCT image and the red curve is the fitting curve. We can get the ROC of the focusing lens from the curve. The discontinuity part of the curve was removed because of the noise impact during the image processing. A circle fitting was adopted and the fitting function F can be expressed as
where x, y, is the circle center coordinates, respectively; x1, y1, represents the offset of the circle center coordinates relative to the zero coordinate, respectively; r is the radius of circle. The function of “nlinfit” was employed to get the optimal solution when F = 0. Moreover, then, we can get the measuring result of ROC.
Measurement accuracy is usually expressed numerically by measures of imprecision, such as standard deviation, variance or coefficient of variation under the specified conditions of measurement. For SS-OCT system, we used standard deviation to evaluate the measurement capability. Different measurements were performed by the same SS-OCT system under the same environment and background noise, the value of ROC after the curve fitting with the same software program as shown in Table 1.

Table 1.
Standard deviation of measurement by SS-OCT.
From Table 1, the maximum positive and negative deviations of the relative errors are 2.9% and −2.19%, respectively. The standard deviation was 0.0247 mm, which was caused by the random error of the measurement and the error of the curve fitting algorithm. The curve fitting error can be reduced by improving the image quality and accuracy. The mean value of seven measurements was 1.2479 mm, which was approximately the standard value of 1.25 mm. This means that the major error was the random error of the measurement. The random error can be compensated by multiple measurements. The experimental results show that the measuring accuracy of the proposed SS-OCT system was higher than the laser confocal microscope.
4. Conclusions
In this study, we introduced a SS-OCT system to measure the ROC of a focusing lens. A k-domain uniform algorithm was adopted to improve the axial resolution of the SS-OCT system. The 2D OCT images of the focusing lens with high resolution were obtained, and the ROC of the focusing lens was obtained from the images. The measuring accuracy was higher than laser confocal microscope. The SS-OCT system has high accuracy and high efficiency for ROC measurement. Moreover, the SS-OCT system has high stability and high repeatability. It has potential for optical lens measurement and nondestructive defect testing, especially in micro optical lens.
Author Contributions
Conceptualization, H.Z. and P.J.; methodology, Y.Q. and P.J.; validation, P.J.; Data analysis, P.J. and Y.Q.; writing, P.J.; supervision, H.Z. and Y.Q. All authors have read and agreed to the published version of the manuscript.
Funding
This research was funded by the Natural Science Foundation of China, Grant Number 61575157, the Scientific Research Program of Shaanxi Provincial Education Department, Grant Number 18JK0280 and Weinan Research Project, Grant Number ZDYF-JCYJ-100.
Conflicts of Interest
The authors declare no conflicts of interest.
References
- Malacara, D. Optical Shop Testing, 3rd ed.; A John Wiley & Sons, lnc.: New York, NY, USA, 2007; pp. 820–823. [Google Scholar]
- Spiridonov, M.; Toebaert, D. Simple yet accurate noncontact device for measuring the radius of curvature of a spherical mirror. App. Opt. 2006, 45, 6805–6811. [Google Scholar] [CrossRef]
- Anand, A.; Chhaniwal, V.K. Measurement of parameters of simple lenses using digital holographic interferometry and a synthetic reference wave. App. Opt. 2007, 46, 2022–2026. [Google Scholar] [CrossRef] [PubMed]
- Sun, R.D.; Qiu, L.R.; Yang, J.M.; Zhao, W.Q. Laser differential confocal radius measurement system. App. Opt. 2012, 51, 6275–6281. [Google Scholar] [CrossRef] [PubMed]
- Lawall, J.R. High resolution determination of radii of curvature using fabry-perot interferometry. Meas. Sci. Technol. 2009, 20, 45302. [Google Scholar] [CrossRef]
- Wang, X.H.; Qiu, L.R.; Ge, H.; Wang, Y.; Zhao, W.Q. Differential confocal self-collimation method for high-accuracy measurements of lens decentration. Opt. Express. 2020, 28, 12058–12070. [Google Scholar] [CrossRef]
- Luo, M.; Zhong, S.C. Non-Contact Measurement of Small-Module Gears Using Optical Coherence Tomography. App. Sci. 2018, 8, 2490. [Google Scholar] [CrossRef]
- Huang, D.; Swanson, E.A.; Lin, C.P.; Schuman, J.S.; Stinson, W.G.; Chang, W.; Hee, M.R.; Flotte, T.; Gregory, T.K.; Pullafito, C.A.; et al. Optical coherence tomography. Science. 1991, 254, 1178–1181. [Google Scholar] [CrossRef] [PubMed]
- Cha, Y.M.; Han, J.H. High-Accuracy Retinal Layer Segmentation for Optical Coherence Tomography Using Tracking Kernels Based on Gaussian Mixture Model. IEEE J. Sel. Top. Quantum Electron. 2014, 20, 32–41. [Google Scholar]
- Li, X.; Li, J.; Joe, J.; Ma, T.; Liang, S.; Zhang, J.; Dilbahar, M.; Aidan, R.; Sari, M.; Matthew, B.; et al. Integrated IVUS-OCT Imaging for Atherosclerotic Plaque Characterization. IEEE J. Sel. Top. Quantum Electron. 2014, 20, 7100108. [Google Scholar]
- Moore, E.D.; Mcleod, R.R. Phase-sensitive swept-source interferometry for absolute ranging with application to measurements of group refractive index and thickness. Opt. Express. 2011, 19, 8117–8126. [Google Scholar] [CrossRef][Green Version]
- Sticker, M.; Pircher, M.; Götzinger, E.; Sattmann, H.; Fercher, A.F.; Hitzenberger, C.K. En face imaging of single cell layers by differential phase-contrast optical coherence microscopy. Opt. Lett. 2002, 27, 1126–1128. [Google Scholar] [CrossRef]
- Bashkansky, M.; Iii, D.L.; Pujari, V. Subsurface detection and characterization of Hertzian cracks in Si3N4 balls using optical coherence tomography. NDT&E Int. 2001, 34, 547–555. [Google Scholar] [CrossRef]
- Wang, L.; Xiong, Q.; Ge, X.; Bo, E.; Xie, J.; Liu, X.; Yu, X.; Wang, X.; Wang, N.; Chen, S.; et al. Cellular resolution corneal imaging with extended imaging range. Opt. Express. 2019, 27, 1298–1309. [Google Scholar] [CrossRef] [PubMed]
- Swanson, E.A.; Huang, D.; Lin, C.P.; Puliafito, C.A.; Hee, M.R.; Fujimoto, J.G. High-speed optical coherence domain reflectometry. Opt. Lett. 1992, 17, 151–153. [Google Scholar] [CrossRef] [PubMed]
- Drexler, W.; Morgner, U.; Kärtner, F.X.; Pitris, C.; Boppart, S.A.; Li, X.D.; Ippen, E.P.; Fujimoto, J.G. In vivo ultrahigh-resolution optical coherence tomography. Opt. Lett. 1999, 24, 1221–1223. [Google Scholar] [CrossRef] [PubMed]
- Lexer, F.; Hitzenberger, C.K.; Fercher, A.F.; Kulhavy, M. Wavelength-tuning interferometry of intraocular distances. Appl. Opt. 1997, 36, 6548–6553. [Google Scholar] [CrossRef]
- Choma, M.A.; Sarunic, M.V.; Yang, C.; Izatt, J.A. Sensitivity advantage of swept source and fourier domain optical coherence tomography. Opt. Express. 2003, 11, 2183–2189. [Google Scholar] [CrossRef] [PubMed]
- Boer, J.F.D.; Cense, B.; Park, B.H.; Pierce, M.C.; Bouma, B.E. Improved signal-to-noise ratio in spectral-domain compared with time-domain optical coherence tomography. Opt. Lett. 2003, 28, 2067–2069. [Google Scholar] [CrossRef]
- Joseph, A.; Izatt, J.; Hee, M.; Owen, G.M.; Swanson, E.A.; Fujimoto, J.G. Optical coherence microscopy in scattering media. Opt. Lett. 1994, 19, 590–592. [Google Scholar]
- Leitgeb, R.; Hitzenberger, C.K.; Fercher, A.F. Performance of fourier domain vs. time domain optical coherence tomography. Opt. Express. 2003, 11, 889–894. [Google Scholar]
- Dorrer, C.; Belabas, N.; Likforman, J.P.; Joffre, M. Spectral resolution and sampling issues in fourier transform spectral interferometry. J. Opt. Soc. Am. B 2013, 17, 1795–1802. [Google Scholar] [CrossRef]
- Chang, S.D.; Mao, Y.X.; Flueraru, C.; Sherif, S. Optical coherence tomography: Technology and Applications. Proc. SPIE 2009, 7156, 715606. [Google Scholar]
- Davis, A.M.; Choma, M.A.; Izatt, J.A. Heterodyne swept-source optical coherence tomography for complete complex conjugate ambiguity removal. J. Biomed. Opt. 2005, 10, 064005. [Google Scholar] [CrossRef]
- Ren, J.; Gille, H.K.; Wu, J.; Yang, C. Ex vivo optical coherence tomography imaging of collector channels with a scanning endoscopic probe. Investig. Ophthalmol. Vis. Sci. 2011, 52, 3921–3925. [Google Scholar] [CrossRef] [PubMed]
- Huber, R.; Wojtkowski, M.; Fujimoto, J.G.; Jiang, J.Y.; Cable, A.E. Three-dimensional and c-mode oct imaging with a compact, frequency swept laser source at 1300 nm. Opt. Express. 2006, 13, 10523–10538. [Google Scholar] [CrossRef] [PubMed]
- Xi, J.F.; Li, H.; Li, J.S.; Li, X.D. Generic real-time uniform K-space sampling method for high-speed swept-source optical coherence tomography. Opt. Express. 2010, 18, 9511–9517. [Google Scholar] [CrossRef] [PubMed]
- Wu, T.; Ding, Z.H.; Wang, L.; Chen, M.H. Spectral phase based k-domain interpolation for uniform sampling in swept-source optical coherence tomography. Opt. Express. 2011, 19, 18430–18439. [Google Scholar] [CrossRef] [PubMed]
© 2020 by the authors. Licensee MDPI, Basel, Switzerland. This article is an open access article distributed under the terms and conditions of the Creative Commons Attribution (CC BY) license (http://creativecommons.org/licenses/by/4.0/).