Improved Epidemic Dynamics Model and Its Prediction for COVID-19 in Italy

Abstract
1. Introduction
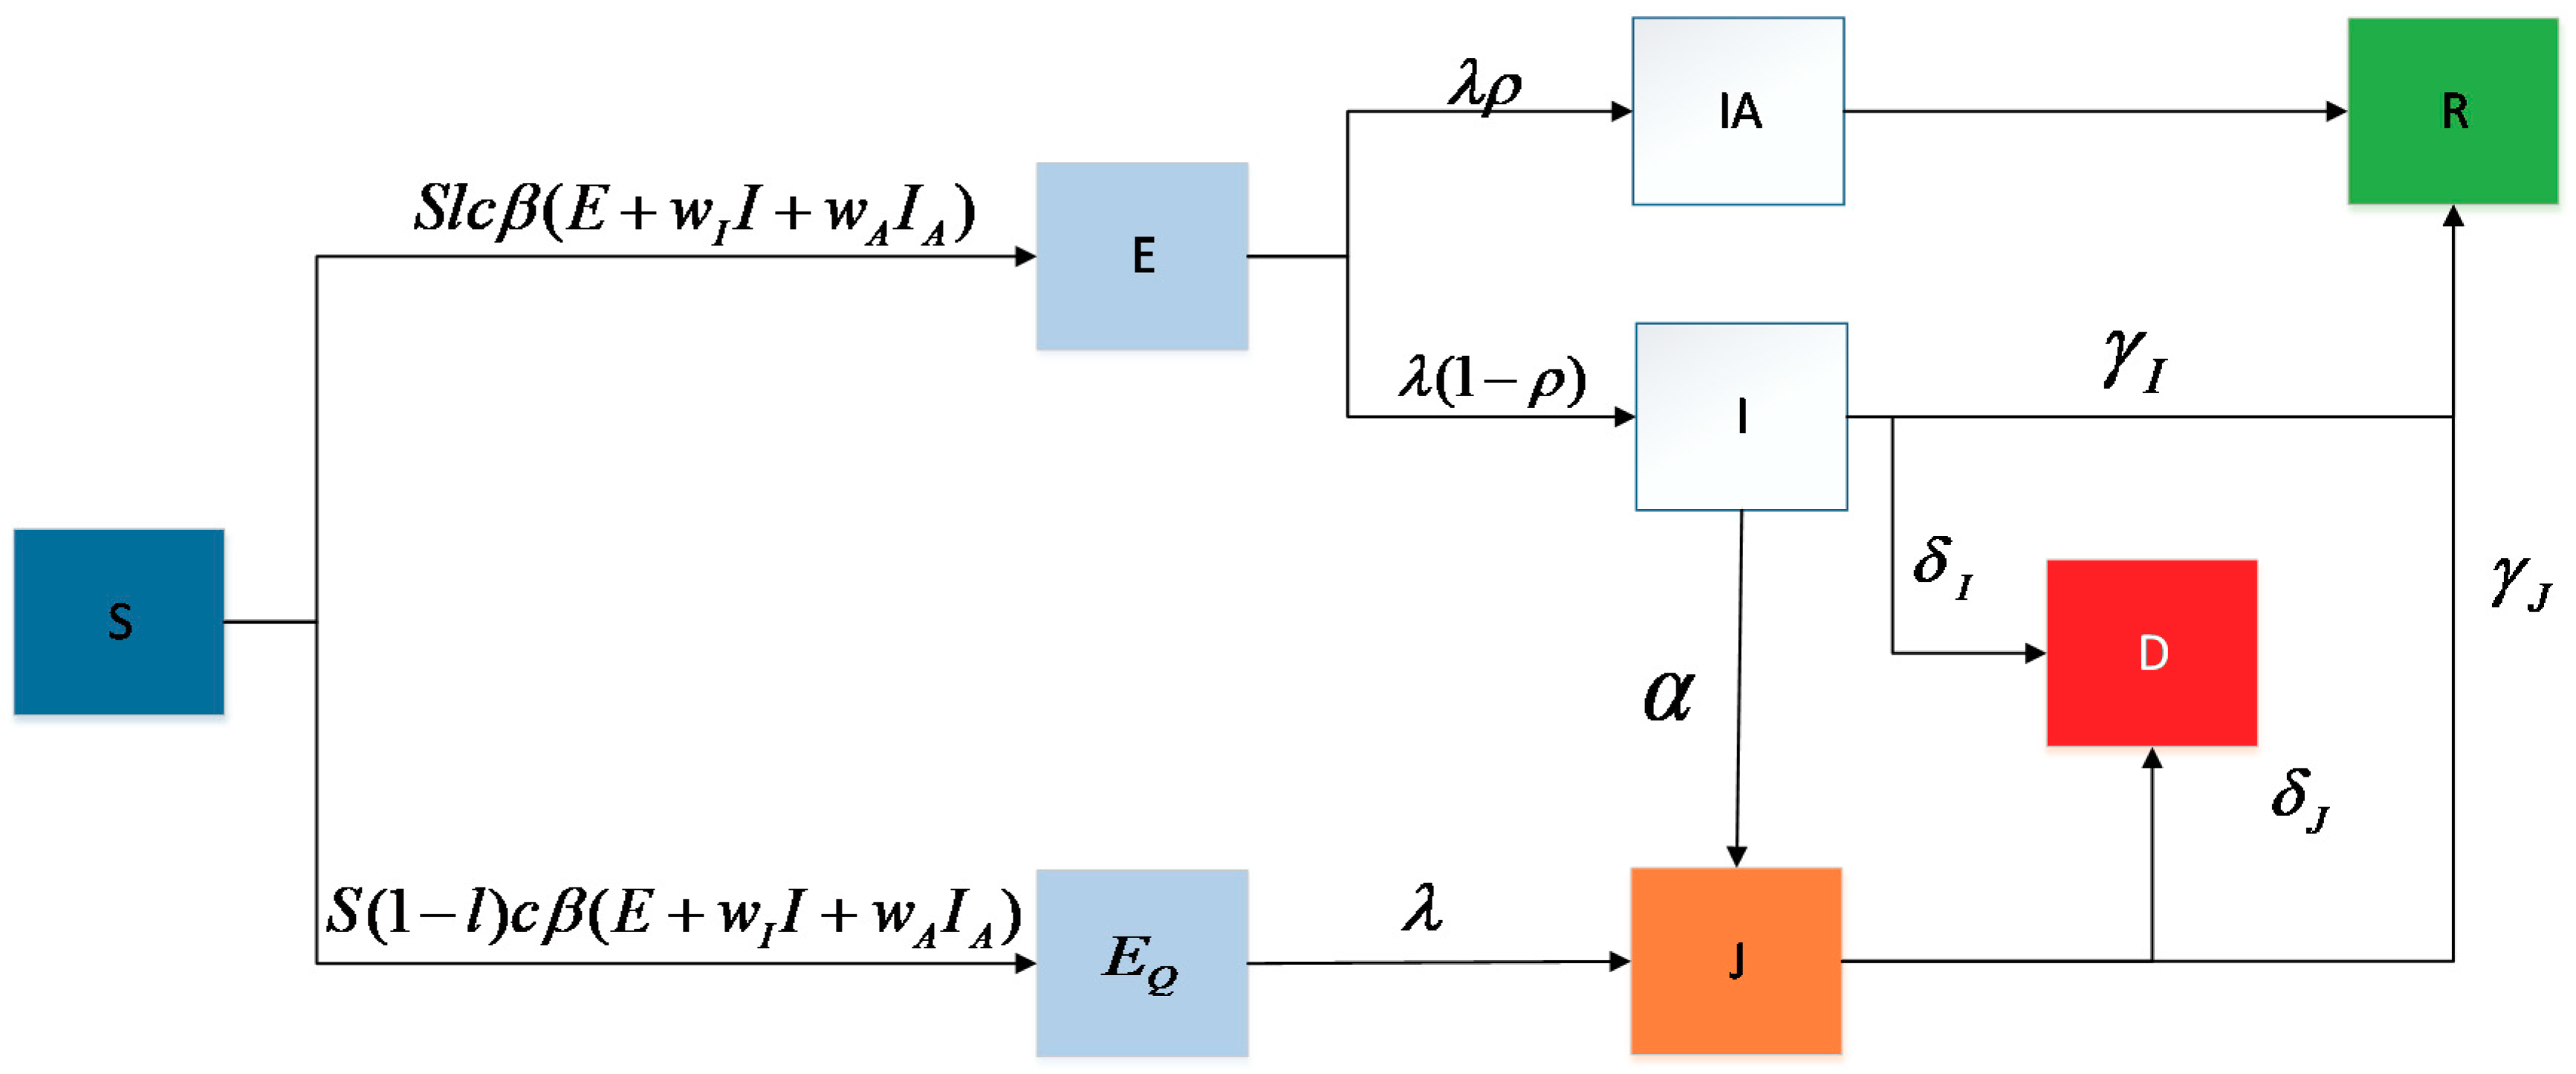
2. SEIR_QJD Model
- Infection: Every primary case (including , , and status) with infectiousness will transmit the virus to its secondary cases at time ; that is, if a primary case contacts a susceptible individual, the susceptible individual will be infected with a certain probability.
- Quarantine: Due to the government’s prevention and control measures (suspension, work stoppages, restrictions on the diagnosed individuals, etc.) and people’s self-precautionary awareness (self-isolation), each individual in status and will be isolated. Note: we assume that the quarantined individuals cannot contact the susceptible ones; namely, it is not contagious.
- Symptom Onset: Individuals in states will become symptomatic after the infectious incubation period and will transition to states and at the rate of .
- Recovery: Individuals in states and will recover at rates of and , respectively.
- Death: Individuals in states and will die at rates of and , respectively. Note: as the mortality rates of asymptomatic and mild-symptomatic individuals are extremely low, the death of asymptomatic infections is not included.
3. Estimation of Model Parameters
4. Empirical Analysis
5. Discussion
Author Contributions
Funding
Conflicts of Interest
Appendix A

| Date | Incidence | Cumulative incidence | Prevalence | Date | Incidence | Cumulative incidence | Prevalence |
|---|---|---|---|---|---|---|---|
| 15 February 2020 | 0 | 3 | 3 | 24 April 2020 | 3021 | 192,994 | 106,527 |
| 16 February 2020 | 0 | 3 | 3 | 25 April 2020 | 2357 | 195,351 | 105,847 |
| 17 February 2020 | 0 | 3 | 3 | 26 April 2020 | 2324 | 197,675 | 106,103 |
| 18 February 2020 | 0 | 3 | 3 | 27 April 2020 | 1739 | 199,414 | 105,813 |
| 19 February 2020 | 0 | 3 | 3 | 28 April 2020 | 2091 | 201,505 | 105,205 |
| 20 February 2020 | 1 | 4 | 4 | 29 April 2020 | 2086 | 203,591 | 104,657 |
| 21 February 2020 | 17 | 21 | 19 | 30 April 2020 | 1872 | 205,463 | 101,551 |
| 22 February 2020 | 55 | 76 | 75 | 1 May 2020 | 1965 | 207,428 | 100,943 |
| 23 February 2020 | 48 | 124 | 121 | 2 May 2020 | 1900 | 209,328 | 100,704 |
| 24 February 2020 | 105 | 229 | 222 | 3 May 2020 | 1389 | 210,717 | 100,179 |
| 25 February 2020 | 93 | 322 | 311 | 4 May 2020 | 1221 | 211,938 | 99,980 |
| 26 February 2020 | 78 | 400 | 385 | 5 May 2020 | 1075 | 213,013 | 98,467 |
| 27 February 2020 | 250 | 650 | 588 | 6 May 2020 | 1444 | 214,457 | 91,528 |
| 28 February 2020 | 238 | 888 | 821 | 7 May 2020 | 1,401 | 215,858 | 89,624 |
| 29 February 2020 | 240 | 1128 | 1049 | 8 May 2020 | 1327 | 217,185 | 87,961 |
| 1 March 2020 | 566 | 1694 | 1577 | 9 May 2020 | 1,083 | 218,268 | 84,842 |
| 2 March 2020 | 342 | 2036 | 1835 | 10 May 2020 | 802 | 219,070 | 83,324 |
| 3 March 2020 | 466 | 2502 | 2263 | 11 May 2020 | 744 | 219,814 | 82,488 |
| 4 March 2020 | 587 | 3089 | 2706 | 12 May 2020 | 1402 | 221,216 | 81,266 |
| 5 March 2020 | 769 | 3858 | 3296 | 13 May 2020 | 888 | 222,104 | 78,457 |
| 6 March 2020 | 778 | 4636 | 3916 | 14 May 2020 | 992 | 223,096 | 76,440 |
| 7 March 2020 | 1247 | 5883 | 5061 | 15 May 2020 | 789 | 223,885 | 72,070 |
| 8 March 2020 | 1492 | 7375 | 6387 | 16 May 2020 | 875 | 224,760 | 70,187 |
| 9 March 2020 | 1797 | 9172 | 7985 | 17 May 2020 | 675 | 225,435 | 68,351 |
| 10 March 2020 | 977 | 10,149 | 8514 | 18 May 2020 | 541 | 225,886 | 66,553 |
| 11 March 2020 | 2313 | 12,462 | 10,590 | 19 May 2020 | 813 | 226,699 | 65,129 |
| 12 March 2020 | 2651 | 15,113 | 12,839 | 20 May 2020 | 665 | 227,364 | 62,752 |
| 13 March 2020 | 2547 | 17,660 | 14,955 | 21 May 2020 | 642 | 228,006 | 60,960 |
| 14 March 2020 | 3497 | 21,157 | 17,750 | 22 May 2020 | 652 | 228,658 | 59,322 |
| 15 March 2020 | 3590 | 24,747 | 20,603 | 23 May 2020 | 669 | 229,327 | 57,752 |
| 16 March 2020 | 3233 | 27,980 | 23,073 | 24 May 2020 | 531 | 229,858 | 56,594 |
| 17 March 2020 | 3526 | 31,506 | 26,062 | 25 May 2020 | 300 | 230,158 | 55,300 |
| 18 March 2020 | 4207 | 35,713 | 28,710 | 26 May 2020 | 397 | 230,555 | 52,942 |
| 19 March 2020 | 5322 | 41,035 | 33,190 | 27 May 2020 | 584 | 231,139 | 50,966 |
| 20 March 2020 | 5986 | 47,021 | 37,860 | 28 May 2020 | 593 | 231,732 | 47,986 |
| 21 March 2020 | 6557 | 53,578 | 42,681 | 29 May 2020 | 516 | 232,248 | 46,175 |
| 22 March 2020 | 5559 | 59,137 | 46,638 | 30 May 2020 | 416 | 232,664 | 43,691 |
| 23 March 2020 | 4790 | 63,927 | 50,418 | 31 May 2020 | 355 | 233,019 | 42,097 |
| 24 March 2020 | 5249 | 69,176 | 54,030 | 1 June 2020 | 178 | 233,197 | 41,367 |
| 25 March 2020 | 5210 | 74,386 | 57,521 | 2 June 2020 | 318 | 233,515 | 39,893 |
| 26 March 2020 | 6153 | 80,539 | 62,013 | 3 June 2020 | 321 | 233,836 | 39,297 |
| 27 March 2020 | 5959 | 86,498 | 66,414 | 4 June 2020 | 177 | 234,013 | 38,429 |
| 28 March 2020 | 5974 | 92,472 | 70,065 | 5 June 2020 | 518 | 234,531 | 36,976 |
| 29 March 2020 | 5217 | 97,689 | 73,880 | 6 June 2020 | 270 | 234,801 | 35,877 |
| 30 March 2020 | 4050 | 101,739 | 75,528 | 7 June 2020 | 197 | 234,998 | 35,262 |
| 31 March 2020 | 4053 | 105,792 | 77,635 | 8 June 2020 | 280 | 235,278 | 34,730 |
| 1 April 2020 | 4782 | 110,574 | 80,572 | 9 June 2020 | 283 | 235,561 | 32,872 |
| 2 April 2020 | 4668 | 115,242 | 83,049 | 10 June 2020 | 202 | 235,763 | 31,710 |
| 3 April 2020 | 4585 | 119,827 | 85,388 | 11 June 2020 | 379 | 236,142 | 30,637 |
| 4 April 2020 | 4805 | 124,632 | 88,274 | 12 June 2020 | 163 | 236,305 | 28,997 |
| 5 April 2020 | 4316 | 128,948 | 91,246 | 13 June 2020 | 346 | 236,651 | 27,485 |
| 6 April 2020 | 3599 | 132,547 | 93,187 | 14 June 2020 | 338 | 236,989 | 26,274 |
| 7 April 2020 | 3039 | 135,586 | 94,067 | 15 June 2020 | 301 | 237,290 | 25,909 |
| 8 April 2020 | 3836 | 139,422 | 95,262 | 16 June 2020 | 210 | 237,500 | 24,569 |
| 9 April 2020 | 4204 | 143,626 | 96,877 | 17 June 2020 | 328 | 237,828 | 23,925 |
| 10 April 2020 | 3951 | 147,577 | 98,273 | 18 June 2020 | 331 | 238,159 | 23,101 |
| 11 April 2020 | 4694 | 152,271 | 100,269 | 19 June 2020 | -148 | 238,011 | 21,543 |
| 12 April 2020 | 4092 | 156,363 | 102,253 | 20 June 2020 | 264 | 238,275 | 21,212 |
| 13 April 2020 | 3153 | 159,516 | 103,616 | 21 June 2020 | 224 | 238,499 | 20,972 |
| 14 April 2020 | 2972 | 162,488 | 104,291 | 22 June 2020 | 221 | 238,720 | 20,637 |
| 15 April 2020 | 2667 | 165,155 | 105,418 | 23 June 2020 | 113 | 238,833 | 19,573 |
| 16 April 2020 | 3786 | 168,941 | 106,607 | 24 June 2020 | 577 | 239,410 | 18,655 |
| 17 April 2020 | 3493 | 172,434 | 106,962 | 25 June 2020 | 296 | 239,706 | 18,303 |
| 18 April 2020 | 3491 | 175,925 | 107,771 | 26 June 2020 | 255 | 239,961 | 17,638 |
| 19 April 2020 | 3047 | 178,972 | 108,257 | 27 June 2020 | 175 | 240,136 | 16,836 |
| 20 April 2020 | 2256 | 181,228 | 108,237 | 28 June 2020 | 174 | 240,310 | 16,681 |
| 21 April 2020 | 2729 | 183,957 | 107,709 | 29 June 2020 | 126 | 240,436 | 16,496 |
| 22 April 2020 | 3370 | 187,327 | 107,699 | 30 June 2020 | 142 | 240,578 | 15,563 |
| 23 April 2020 | 2646 | 189,973 | 106,848 |
References
- World Health Organization (WHO). Statement on the Second Meeting of the International Health Regulations (2005) Emergency Committee Regarding the Outbreak of Novel Coronavirus (2019-nCoV). Available online: https://www.who.int/news-room/detail/30-01-2020-statement-on-the-second-meeting-of-the-international-health-regulations-(2005)-emergency-committee-regarding-the-outbreak-of-novel-coronavirus-(2019-ncov) (accessed on 1 July 2020).
- World Health Organization (WHO). Coronavirus Disease (COVID-19) Outbreak Situation. Available online: https://who.sprinklr.com/region/euro/country/it (accessed on accessed on 1 July 2020).
- Singanayagam, A.; Glanville, N.; Girkin, J.L.; Ching, Y.M.; Marcellini, A.; Porter, J.D.; Toussaint, M.; Walton, R.P.; Finney, L.J.; Aniscenko, J.; et al. Corticosteroid suppression of antiviral immunity increases bacterial loads and mucus production in COPD exacerbations. Nat. Commun. 2018, 9, 1–16. [Google Scholar] [CrossRef] [PubMed]
- Onder, G.; Rezza, G.; Brusaferro, S. Case-Fatality Rate and Characteristics of Patients Dying in Relation to COVID-19 in Italy. JAMA 2020, 323, 1775–1776. [Google Scholar] [CrossRef] [PubMed]
- Italian Ministry of Health. Available online: http://www.salute.gov.it/portale/home.html (accessed on 1 July 2020).
- Chang, S.L.; Piraveenan, M.; Pattison, P.; Prokopenko, M. Game theoretic modelling of infectious disease dynamics and intervention methods: A review. J. Biol. Dyn. 2020, 14, 57–89. [Google Scholar] [CrossRef] [PubMed]
- Chang, S.L.; Piraveenan, M.; Prokopenko, M. The Effects of Imitation Dynamics on Vaccination Behaviours in SIR-Network Model. Int. J. Environ. Res. Public Health 2019, 16, 2477. [Google Scholar] [CrossRef] [PubMed]
- Tang, B.; Wang, X.; Li, Q.; Bragazzi, N.L.; Tang, S.; Xiao, Y.; Wu, J. Estimation of the Transmission Risk of the 2019-nCoV and Its Implication for Public Health Interventions. J. Clin. Med. 2020, 9, 462. Available online: https://ssrn.com/abstract=3525558 (accessed on 24 January 2020). [CrossRef] [PubMed]
- Yan, Y.; Chen, Y.; Liu, K.J.; Luo, X.Y.; Xu, B.X.; Jiang, Y.; Cheng, J. Modeling and prediction for the trend of outbreak of NCP based on a time-delay dynamic system. Sci. Sin. Math. 2020, 50, 385–392. (In Chinese) [Google Scholar] [CrossRef]
- Wu, J.T.; Leung, K.; Leung Gabriel, M. Nowcasting and forecasting the potential domestic and international spread of the 2019-nCoV outbreak originating in Wuhan, China: A modelling study. Lancet 2020, 395, 689–697. [Google Scholar] [CrossRef]
- Wei, Y.Y.; Lu, Z.Z.; Du, Z.C.; Zhang, Z.J.; Zhao, Y.; Shen, S.P.; Wang, B.; Hao, Y.T.; Chen, F. Fitting and forecasting the trend of COVID-19 by SEIR(+ CAQ) dynamic model. Zhonghua liu xing bing xue za zhi Zhonghua liuxingbingxue zazhi 2020, 41, 470–475. [Google Scholar] [PubMed]
- Wang, X.; Tang, S.Y.; Chen, Y.; Feng, X.M.; Xiao, Y.N.; Xu, Z.B. When will be the resumption of work in Wuhan and its surrounding areas during COVID-19 epidemic? A data-driven network modeling analysis. Sci. Sin. Math. 2020, 50, 1–10. (In Chinese) [Google Scholar] [CrossRef]
- Chang, S.L.; Harding, N.; Zachreson, C.; Cliff, O.; Prokopenko, M. Modelling transmission and control of the COVID-19 pandemic in Australia. arXiv 2003, arXiv:2003.10218. [Google Scholar]
- State Council Information Office of the People’s Republic of China. State Council Information Office Holds Press Conference on Joint Prevention and Control of Pneumonia Outbreak with New Coronavirus Infection. 2020; (In Chinese). Available online: http://www.scio.gov.cn/xwfbh/xwbfbh/wqfbh/42311/42478/index.htm (accessed on accessed on 1 July 2020).
- Zhang, Y.; You, C.; Cai, Z.; Sun, J.; Hu, W.; Zhou, X.H. Prediction of the COVID-19 outbreak based on a realistic stochastic model. medRxiv 2020. [Google Scholar] [CrossRef]


| Parameter | Definitions | Search Range | Estimated Mean Value |
|---|---|---|---|
| The initial value of susceptible individuals | |||
| The probability of incubation individuals being detected | |||
| The contact rate between susceptible and incubation individuals (roughly estimated by ) | |||
| Adjustment coefficient of with the government’s lockdown measures | |||
| Adjustment coefficient of with the government lifting the blockade | |||
| The infectiousness of symptomatic individuals relative to incubation ones | |||
| The speed of individuals from exposed to infected, which is the reciprocal of the incubation period | |||
| The proportion of asymptomatic individuals among all infected ones | |||
| The diagnosed speed of symptomatic individuals | |||
| The recovery rate of infected individuals | |||
| The recovery rate of diagnosed individuals | 0.01887 | ||
| The mortality rate of infected and diagnosed individuals |
| Region | Evaluation Index | Distribution Range |
|---|---|---|
| Italy | The estimated deviation in the past 30 days. (%) | −0.33~0.20% |
| The estimated deviation in the past 60 days. (%) | −1.73~0.20% | |
| The estimated deviation in the past 90 days. (%) | −1.73~2.95% |
© 2020 by the authors. Licensee MDPI, Basel, Switzerland. This article is an open access article distributed under the terms and conditions of the Creative Commons Attribution (CC BY) license (http://creativecommons.org/licenses/by/4.0/).
Share and Cite
Wang, H.; Xu, K.; Li, Z.; Pang, K.; He, H. Improved Epidemic Dynamics Model and Its Prediction for COVID-19 in Italy. Appl. Sci. 2020, 10, 4930. https://doi.org/10.3390/app10144930
Wang H, Xu K, Li Z, Pang K, He H. Improved Epidemic Dynamics Model and Its Prediction for COVID-19 in Italy. Applied Sciences. 2020; 10(14):4930. https://doi.org/10.3390/app10144930
Chicago/Turabian StyleWang, Han, Kang Xu, Zhongyi Li, Kexin Pang, and Hua He. 2020. "Improved Epidemic Dynamics Model and Its Prediction for COVID-19 in Italy" Applied Sciences 10, no. 14: 4930. https://doi.org/10.3390/app10144930
APA StyleWang, H., Xu, K., Li, Z., Pang, K., & He, H. (2020). Improved Epidemic Dynamics Model and Its Prediction for COVID-19 in Italy. Applied Sciences, 10(14), 4930. https://doi.org/10.3390/app10144930