Article

Cyst Detection and Motion Artifact Elimination in Enface Optical Coherence Tomography Angiograms

1
Department of Electrical, Computer and Biomedical Engineering, University of Pavia, 27100 Pavia, Italy
2
Eye Clinic, University Hospital Maggiore della Carità, 28100 Novara, Italy
3
University Eye Clinic, San Giuseppe Hospital, IRCCS MultiMedica, 20123 Milan, Italy
4
Department of Clinical Sciences and Community Health, University of Milan, 20122 Milan, Italy
5
Department of Health Science, University East Piedmont “A. Avogadro”, 28100 Novara, Italy
*
Author to whom correspondence should be addressed.
Appl. Sci. 2020, 10(11), 3994; https://doi.org/10.3390/app10113994
Submission received: 7 May 2020 / Revised: 1 June 2020 / Accepted: 8 June 2020 / Published: 9 June 2020
(This article belongs to the Special Issue Computer-aided Biomedical Imaging 2020: Advances and Prospects)

Abstract

:

Featured Application

Cysts detection in the retina is of crucial importance for the correct evaluation of microvascular impairment in patients with macular edema on images acquired by optical coherence tomography angiography. We describe a fully automatic method for cysts detection able to compensate for the presence of motion artifacts.

Abstract

The correct detection of cysts in Optical Coherence Tomography Angiography images is of crucial importance for allowing reliable quantitative evaluation in patients with macular edema. However, this is a challenging task, since the commercially available software only allows manual cysts delineation. Moreover, even small eye movements can cause motion artifacts that are not always compensated by the commercial software. In this paper, we propose a novel algorithm based on the use of filters and morphological operators, to eliminate the motion artifacts and delineate the cysts contours/borders. The method has been validated on a dataset including 194 images from 30 patients, comparing the algorithm results with the ground truth produced by the medical doctors. The Jaccard index between the algorithmic and the manual detection is 98.97%, with an overall accuracy of 99.62%.

1. Introduction

Optical Coherence Tomography Angiography (OCT-A) is a relatively new imaging technique, introduced in ophthalmology for a non-invasive evaluation of patients affected by different retinal disorders. In particular, OCT-A has been recently used for a detailed evaluation of capillary networks at different levels of depth, in vascular, inflammatory and degenerative diseases of the retina and the choroid [1,2,3,4]. Images acquired by commercially available OCT-A instruments are represented in gray scale, where pixels can have values ranging from 0 to 255. The presence of signal, i.e., detected blood flow, is associated with the white color, while the absence of signal (due to non-perfused areas and the presence of cysts and/or artifacts) appears as a dark color.
Limited data exist in the literature on the use of OCT-A in patients with Macular Edema (ME) [5,6,7,8,9], a condition that consists of fluid accumulation in the central retina (macula), with a consequent increase in retinal thickness [10]. Cystoid macular edema (CME) is a specific subtype of ME, characterized by the presence of well-defined, intra-retinal, optically empty spaces on structural OCT (cysts) [11]. On OCT-A, cystoid spaces have been described as oblong areas, devoid of signal, appearing black on enface OCT-A angiograms, that can displace retinal vessels [12]. The presence of intra-retinal cysts can make it difficult to perform a correct evaluation of microvascular changes occurring in ME, and in particular the quantification of areas of retinal reduced/non-perfusion, as black areas corresponding to cysts could be easily mistaken for dark areas of non-perfusion in automatic analyses [12]. Therefore, a need exists to find new methods of image analysis, able to exclude artifacts due to the presence of intra-retinal cysts, in order to obtain a more accurate quantification of microvascular impairment. Software implemented in commercially available OCT-A instruments only allows the manual delineation of the margins of the cysts; thus, the development of an automatic method to detect and exclude intra-retinal cysts would be of much help in the analysis of OCT-A images. Moreover, it would allow an automatic quantification of the total area occupied by the cysts in different retinal layers (useful in monitoring the response to different treatment options).
Another important issue in the analysis of OCT-A images is the presence of motion artifacts (consequences of even small movements of the eye); typical motion artifacts are represented by line defects, with losses of detail and image distortions [13]. Even if the currently available software techniques largely compensate for these types of artifacts, they can still be a problem in patients with low visual acuity, poor fixation or poor cooperation. Even in this case, the development of an automatic method for removing motion artifacts would be useful in the analysis of OCT-A images.
In the present paper, a novel and automatic method for cyst detection in both the superficial and deep capillary plexuses (SCP and DCP), based on filters and morphological operations, is reported. The same method also aimed to remove motion artifacts, if present. The method has been tested on a wide dataset, and the results have been compared with the ground truths provided by expert medical doctors. The proposed method achieves an accuracy of 99.62%.

2. Materials and Methods

2.1. Image Acquisition

A total of 194 OCT-A images, of both the SCP and DCP of 30 patients with CME and non-proliferative diabetic retinopathy, and with or without motion artifacts, were included in the analysis. Each patient was evaluated at the baseline and after 6 months. Inclusion criteria for the study were: male or female ≥ 18 years of age with center-involving cystoid macular edema and good quality imaging. The study adhered to the tenets of the Declaration of Helsinki and was approved by the institutional Ethics Committee (CE123 2017); each patient agreed to participate in the study and signed a written informed consent.
OCT-A images were taken using a commercially available swept-source instrument after pupil dilation. The device used was the swept-source DRI OCT/OCT-A Triton Plus (Topcon Medical Systems Europe, Milano, Italy). This instrument has a wavelength of 1050 nm and a scanning speed of 100,000 A-scans/second. Image processing relies on a motion contrast measure named OCT-A Ratio Analysis (OCTARA). OCT-A maps covering the central 3 mm × 3 mm macular area were acquired for each subject at each follow-up visit. All images were carefully reviewed to check automatic segmentation of the different plexuses. Poor quality images were excluded from the analysis, with the exception of motion artifacts presence.
The SCP slab was segmented between the inner limiting membrane (ILM) +2.6 μm and the inner plexiform layer (IPL)/inner nuclear layer (INL) +15.6 μm; the DCP slab was segmented between IPL/INL +15.6 μm and IPL/INL +70.2 μm.
Original OCT-A images were exported with a resolution of 320 × 320 pixels (9.4 μm lateral resolution).
The diagnosis of ME was made by means of fundus examination, performed by the ophthalmologist expert in retinal disorders (S.V.), and structural OCT, performed with the same instrument as OCT-A on the same day by a trained ophthalmologist (C.T.). On OCT, a 6-mm radial scan (consisting of 12 scans 15° apart) centered on the fovea was acquired.

2.2. Cyst Detection and Motion Artifacts Elimination Algorithm

As discussed in the Introduction section, discrimination of the cysts from surrounding tissue based only on the gray level values on OCT-A angiograms is not easily achievable, since they can be similar, in particular in cases where non-perfused areas are present. Some considerations could be made regarding the different morphology of the dark elements. Concerning the cysts, they appear as a group of contiguous black pixels of different and sometimes irregular shape, that can displace retinal vessels because of a mechanical effect on surrounding tissue. Non-vascularized areas, on the other hand, were described as dark regions as well, but with some internal signal noise (white pixels) and delimited by capillaries [13]. Motion artifacts appear as horizontal black bands.
However, even these considerations could not be enough to correctly differentiate dark elements on OCT-A angiograms. Therefore, in the present paper, a novel approach was developed and tested to detect intra-retinal cysts and motion artifacts using the structural information from the same slab used to image the blood flow in the SCP and DCP. Figure 1 shows the SCP and DCP flow and structural enface images obtained with the adopted acquisition system.
Figure 2 shows two enface structural SCP and DCP images of the same patient with macular edema. The former (Figure 2A) represents an enface structural SCP image with cysts but without motion artifacts, while the latter (Figure 2B) represents an enface structural DCP image with cysts and a motion artifact in the inferior part of the image, highlighted by a red box. Some of the biggest and most visible cysts in the two images are highlighted by blue boxes.
In order to identify the cysts and to compensate for the potential presence of motion artifacts in enface flow OCT-A images, the authors developed a novel algorithm based on filters and morphological operations, which uses information of corresponding structural enface images of the SCP and DCP OCT-A slabs. In order to be used in the clinical practice, the algorithm should not be heavy from the computational point of view, allowing a fast analysis of the OCT-A images. Algorithm 1 shows the main steps of the proposed method. The algorithm has been developed in Matlab R2019a, MathWorks, Natick, MA, using the Image Processing Toolbox.
Algorithm 1Cysts detection and motion artifacts elimination.
Input:Img—enface structural OCT-A grayscale image
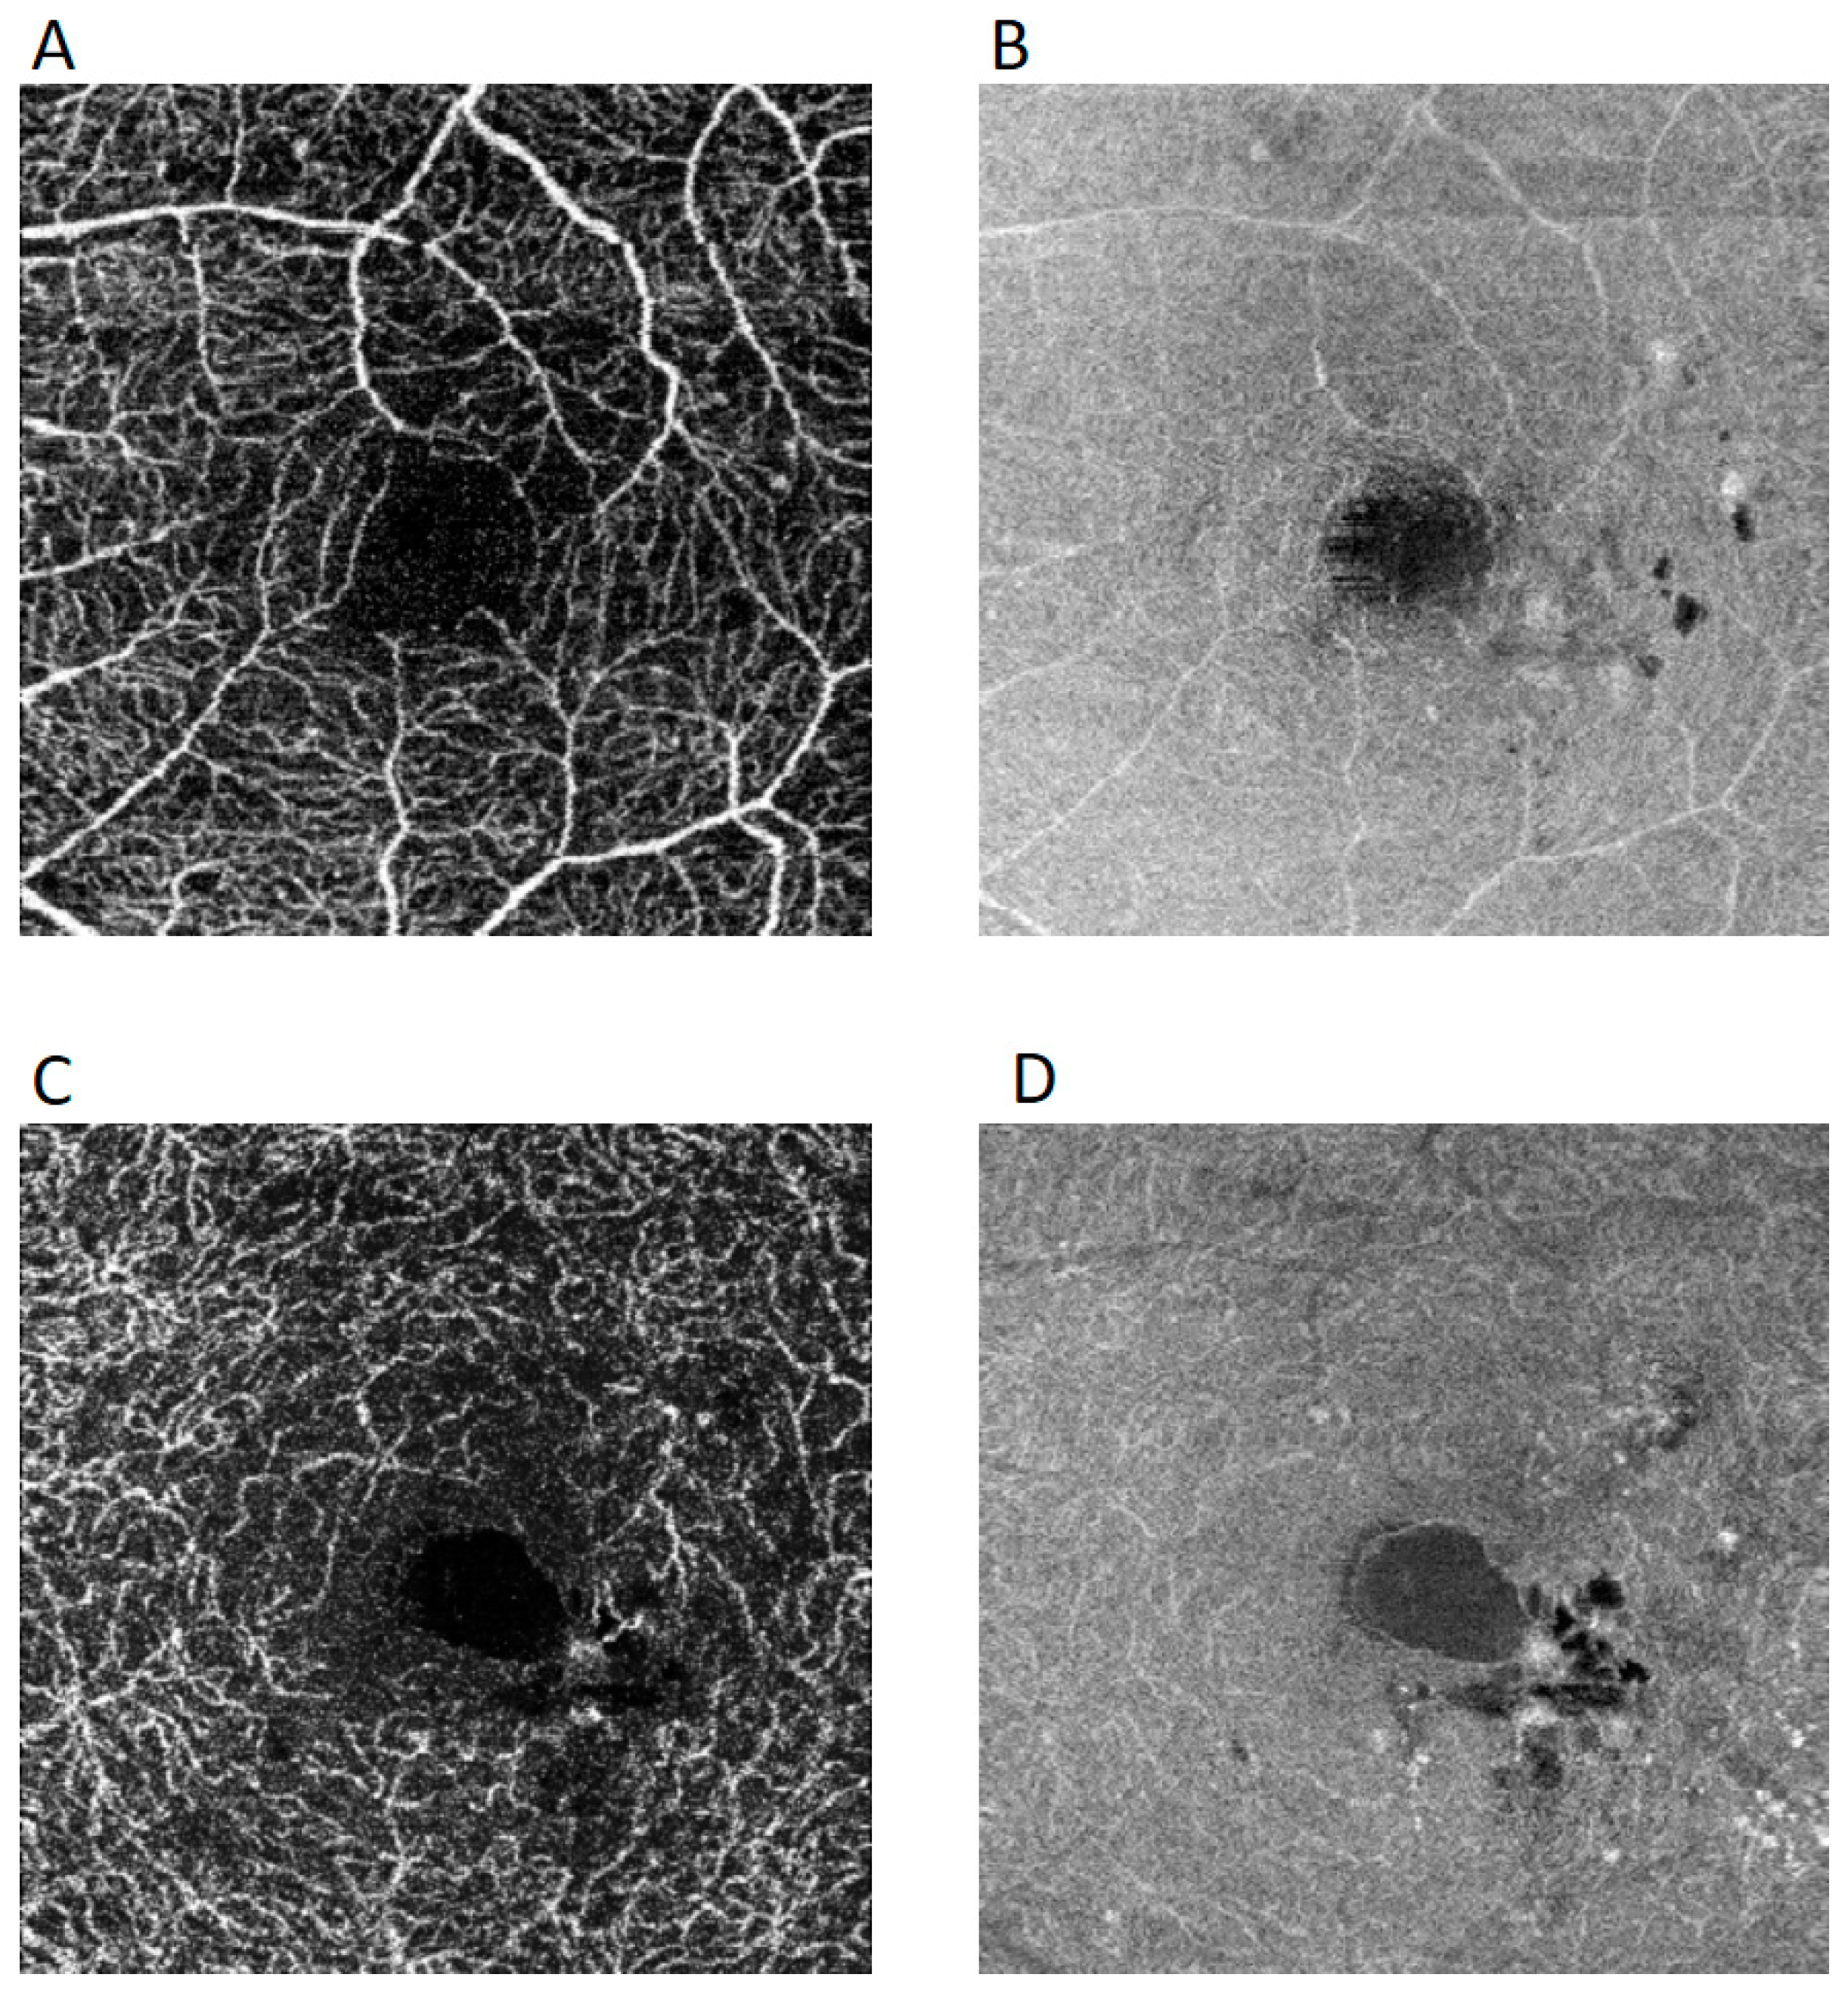
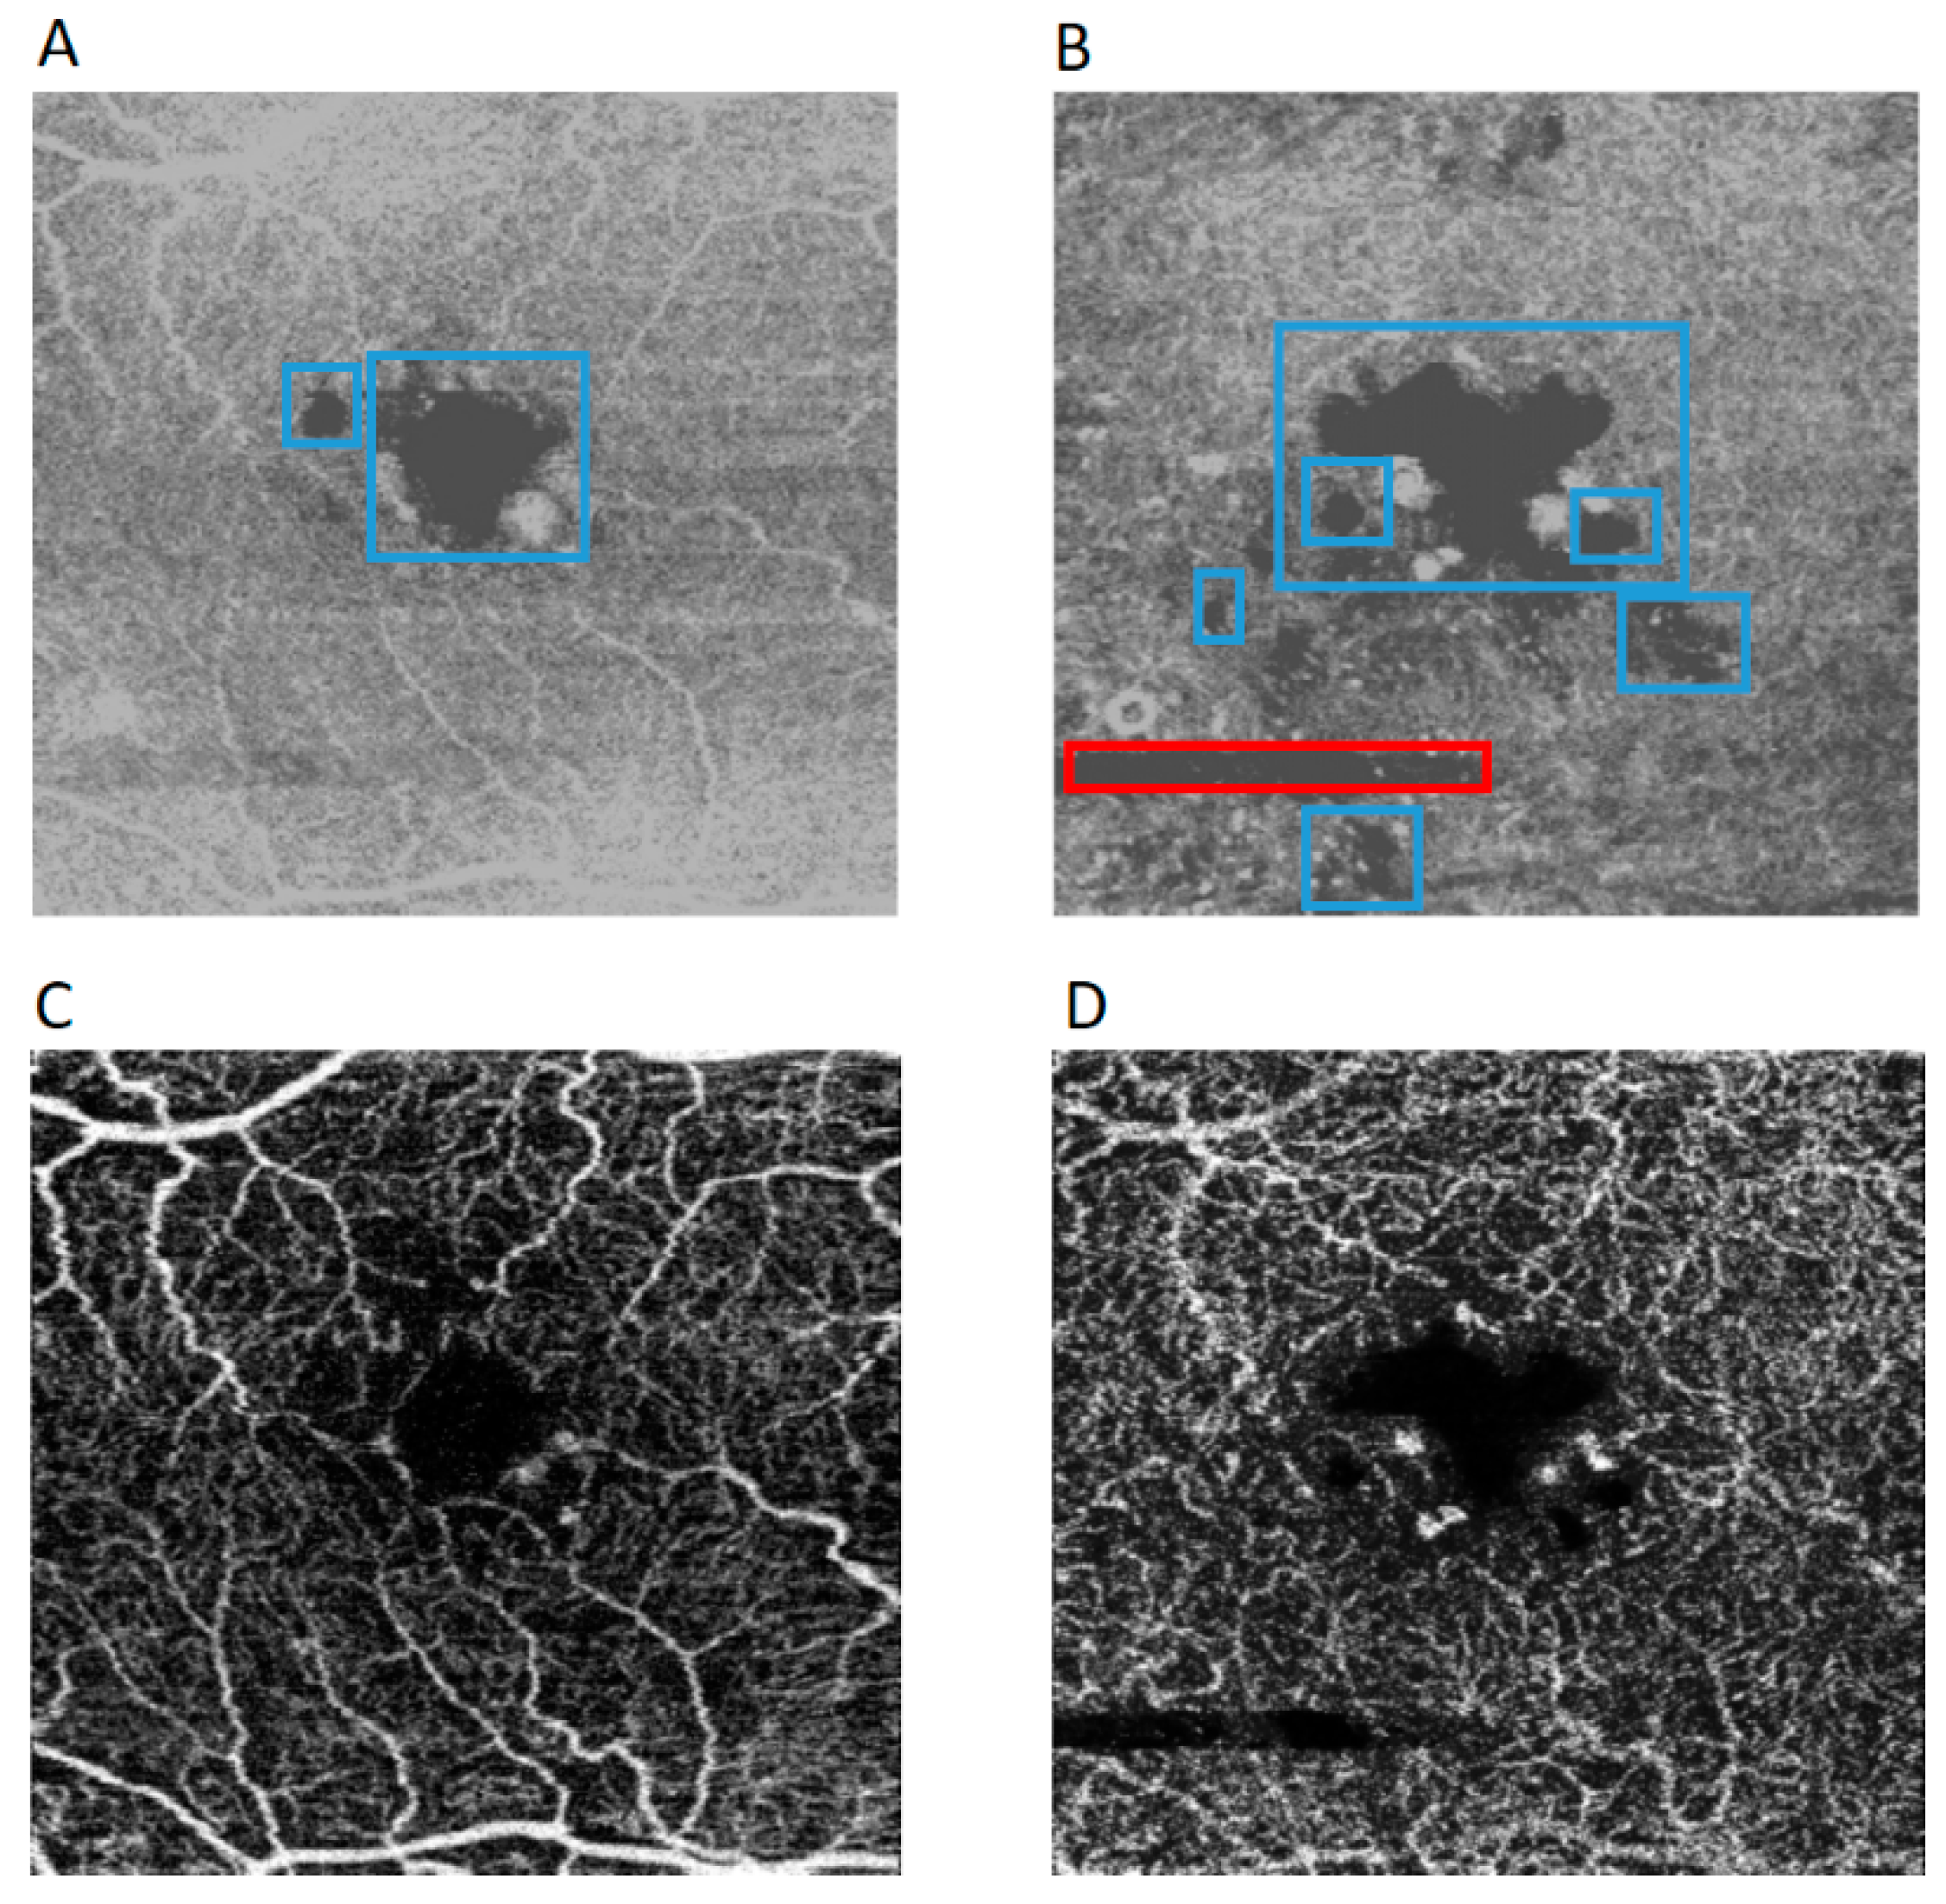
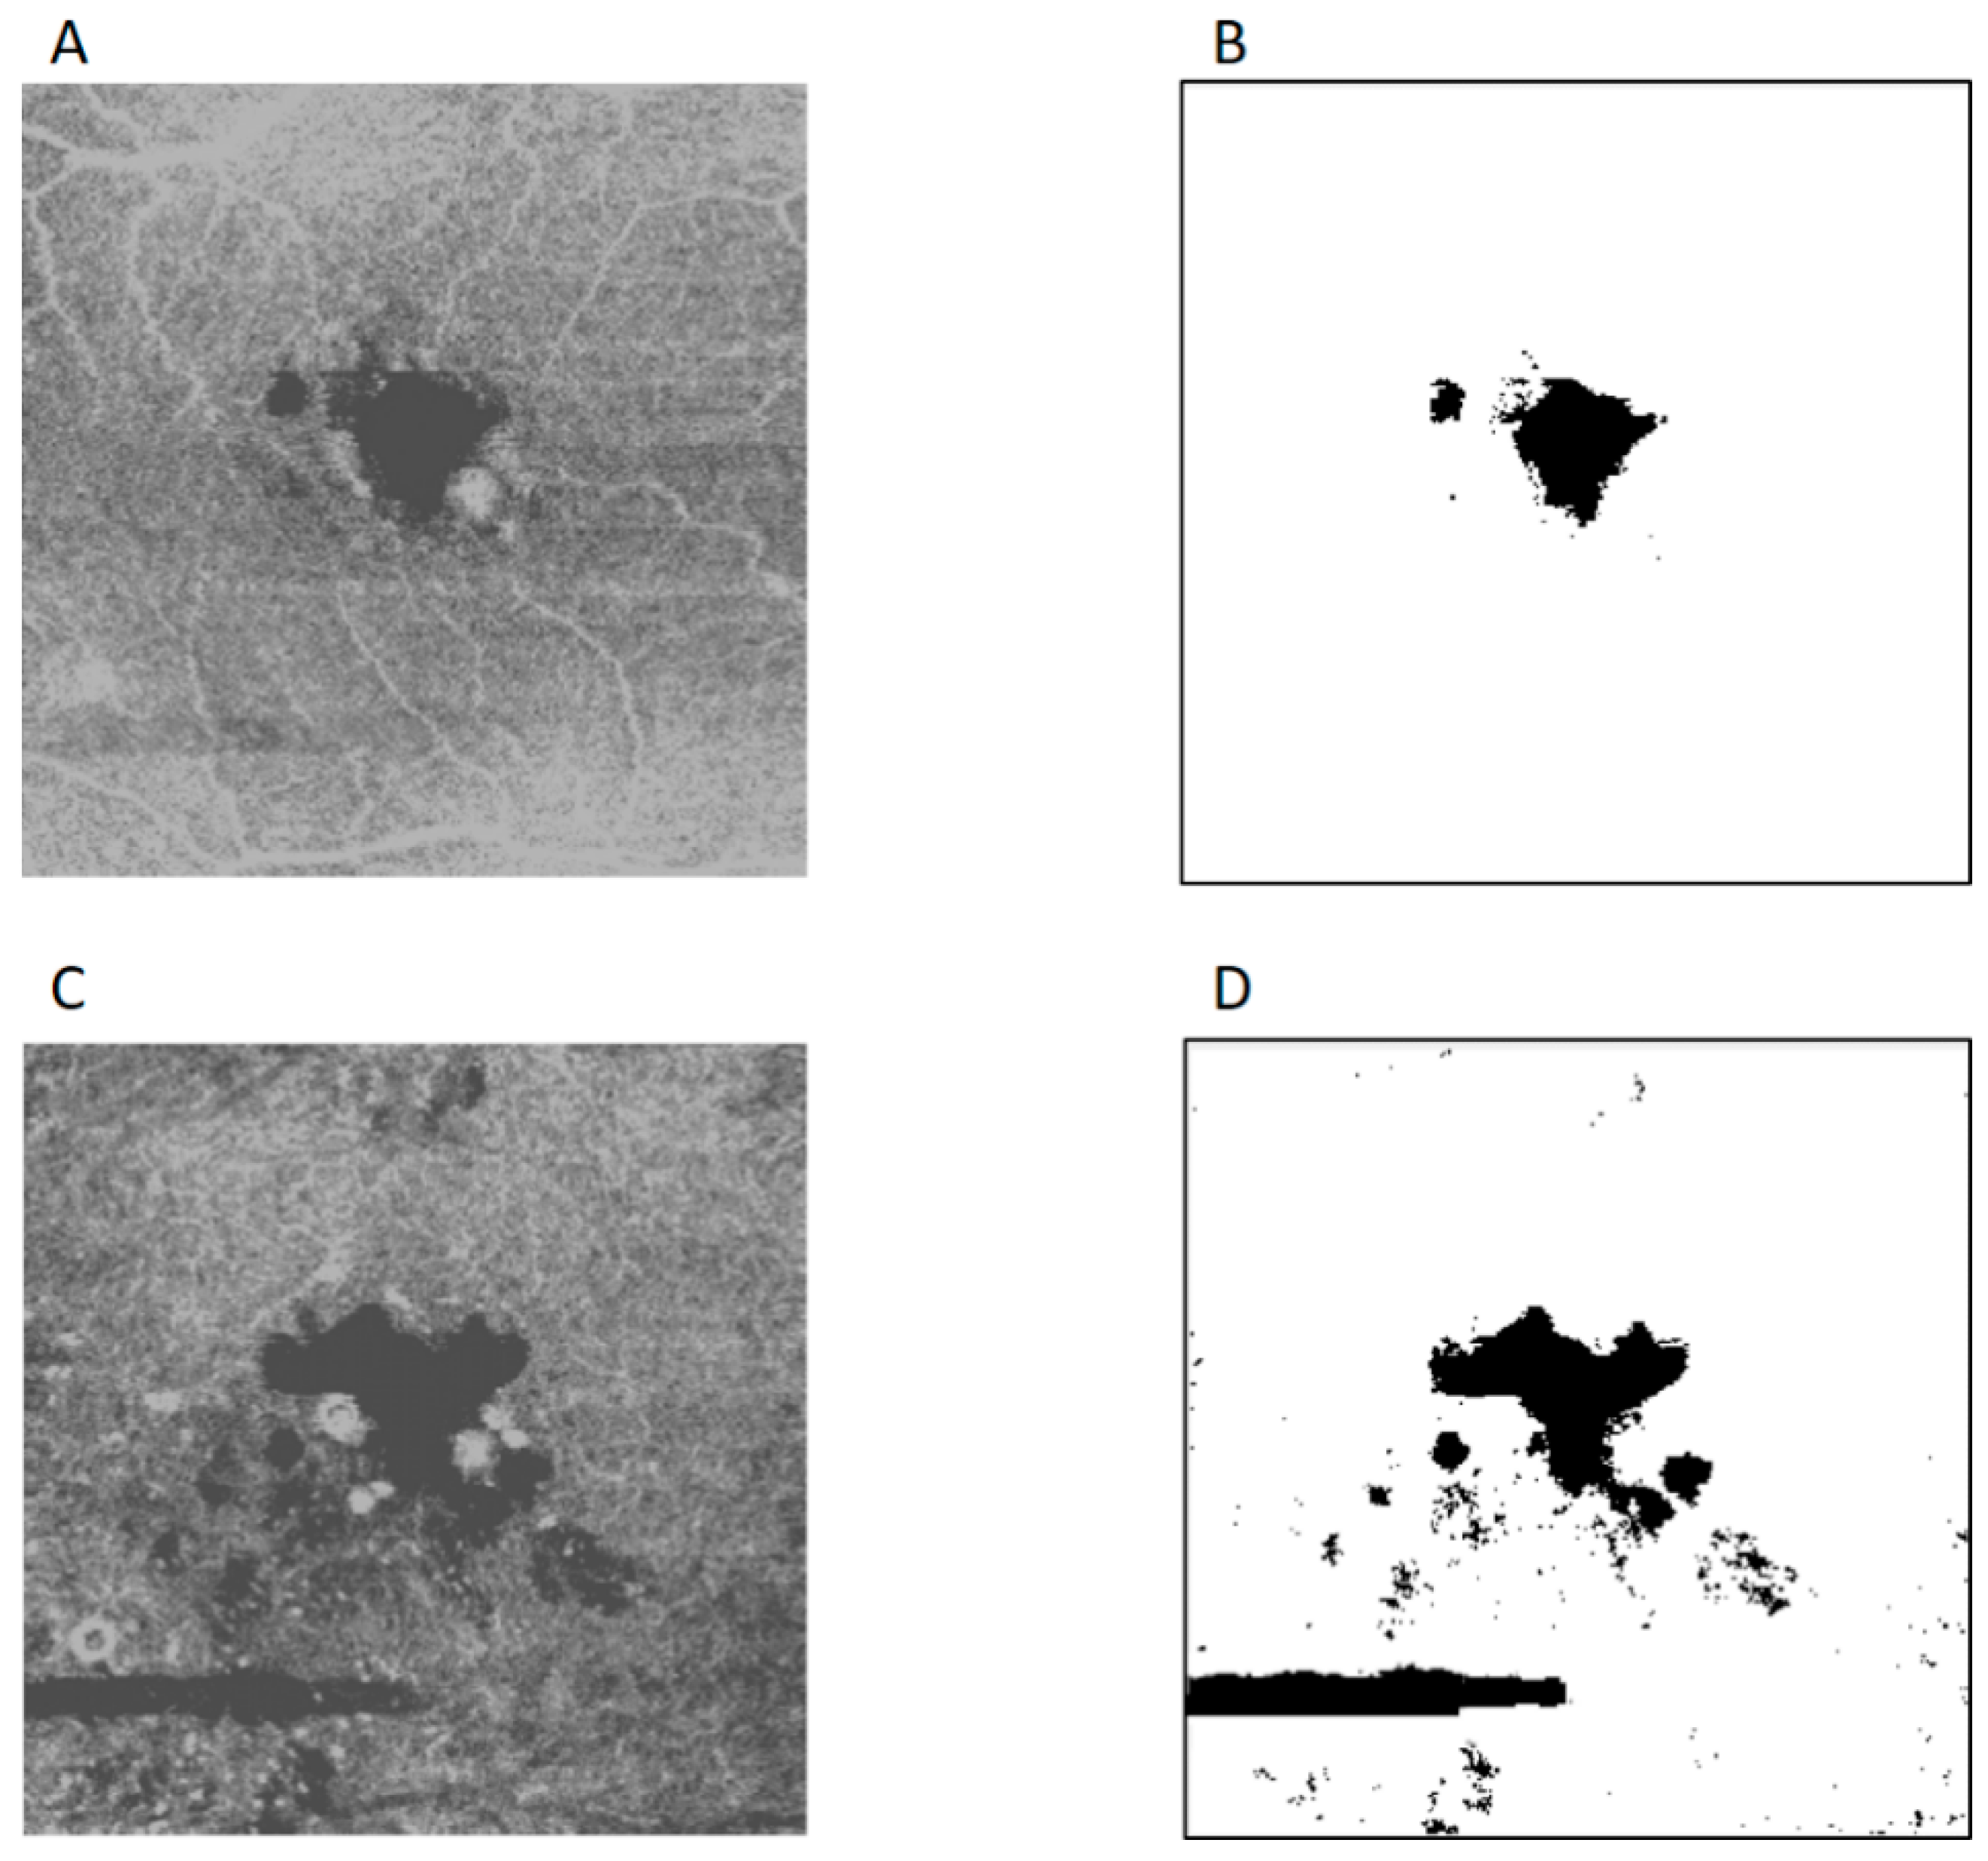
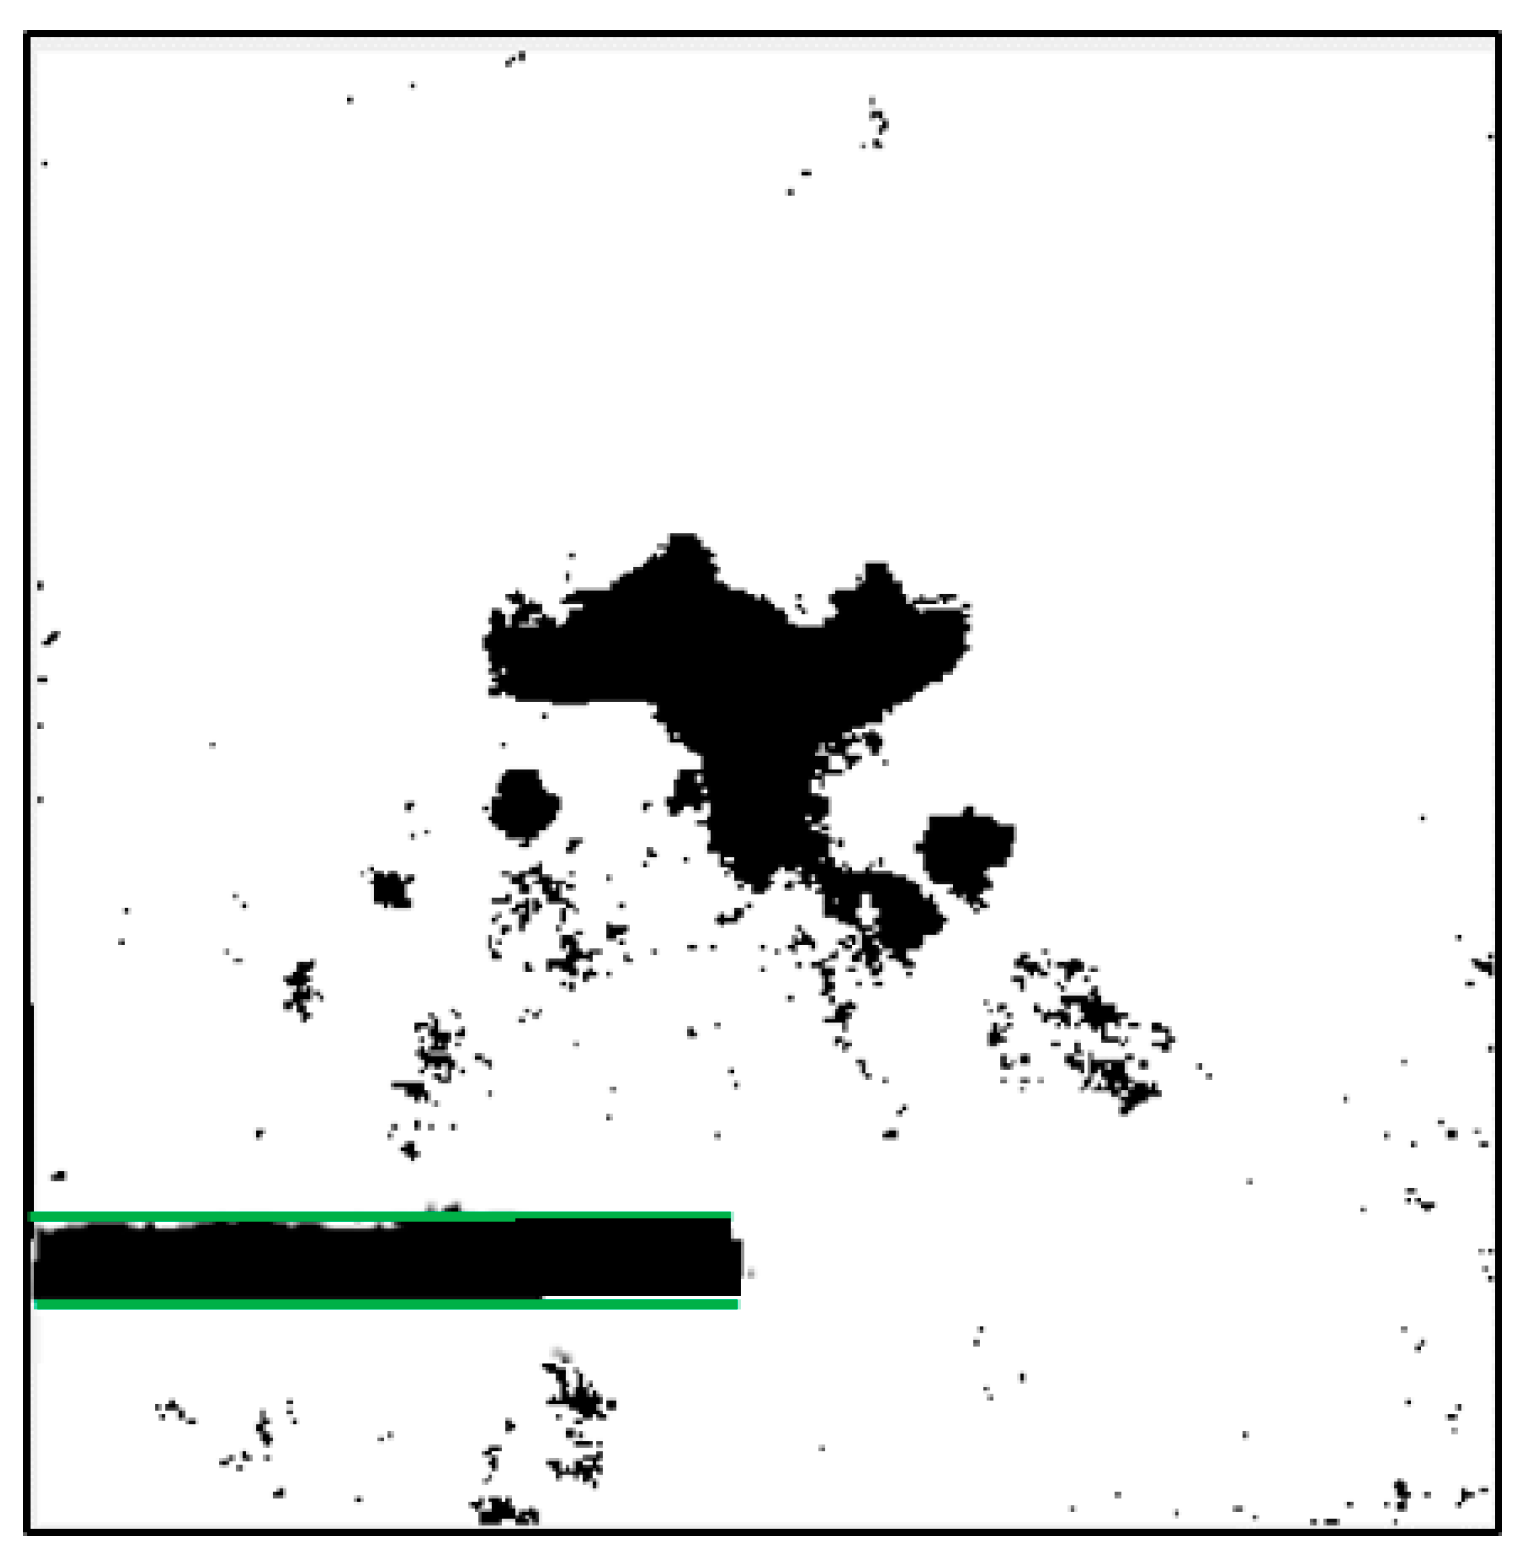
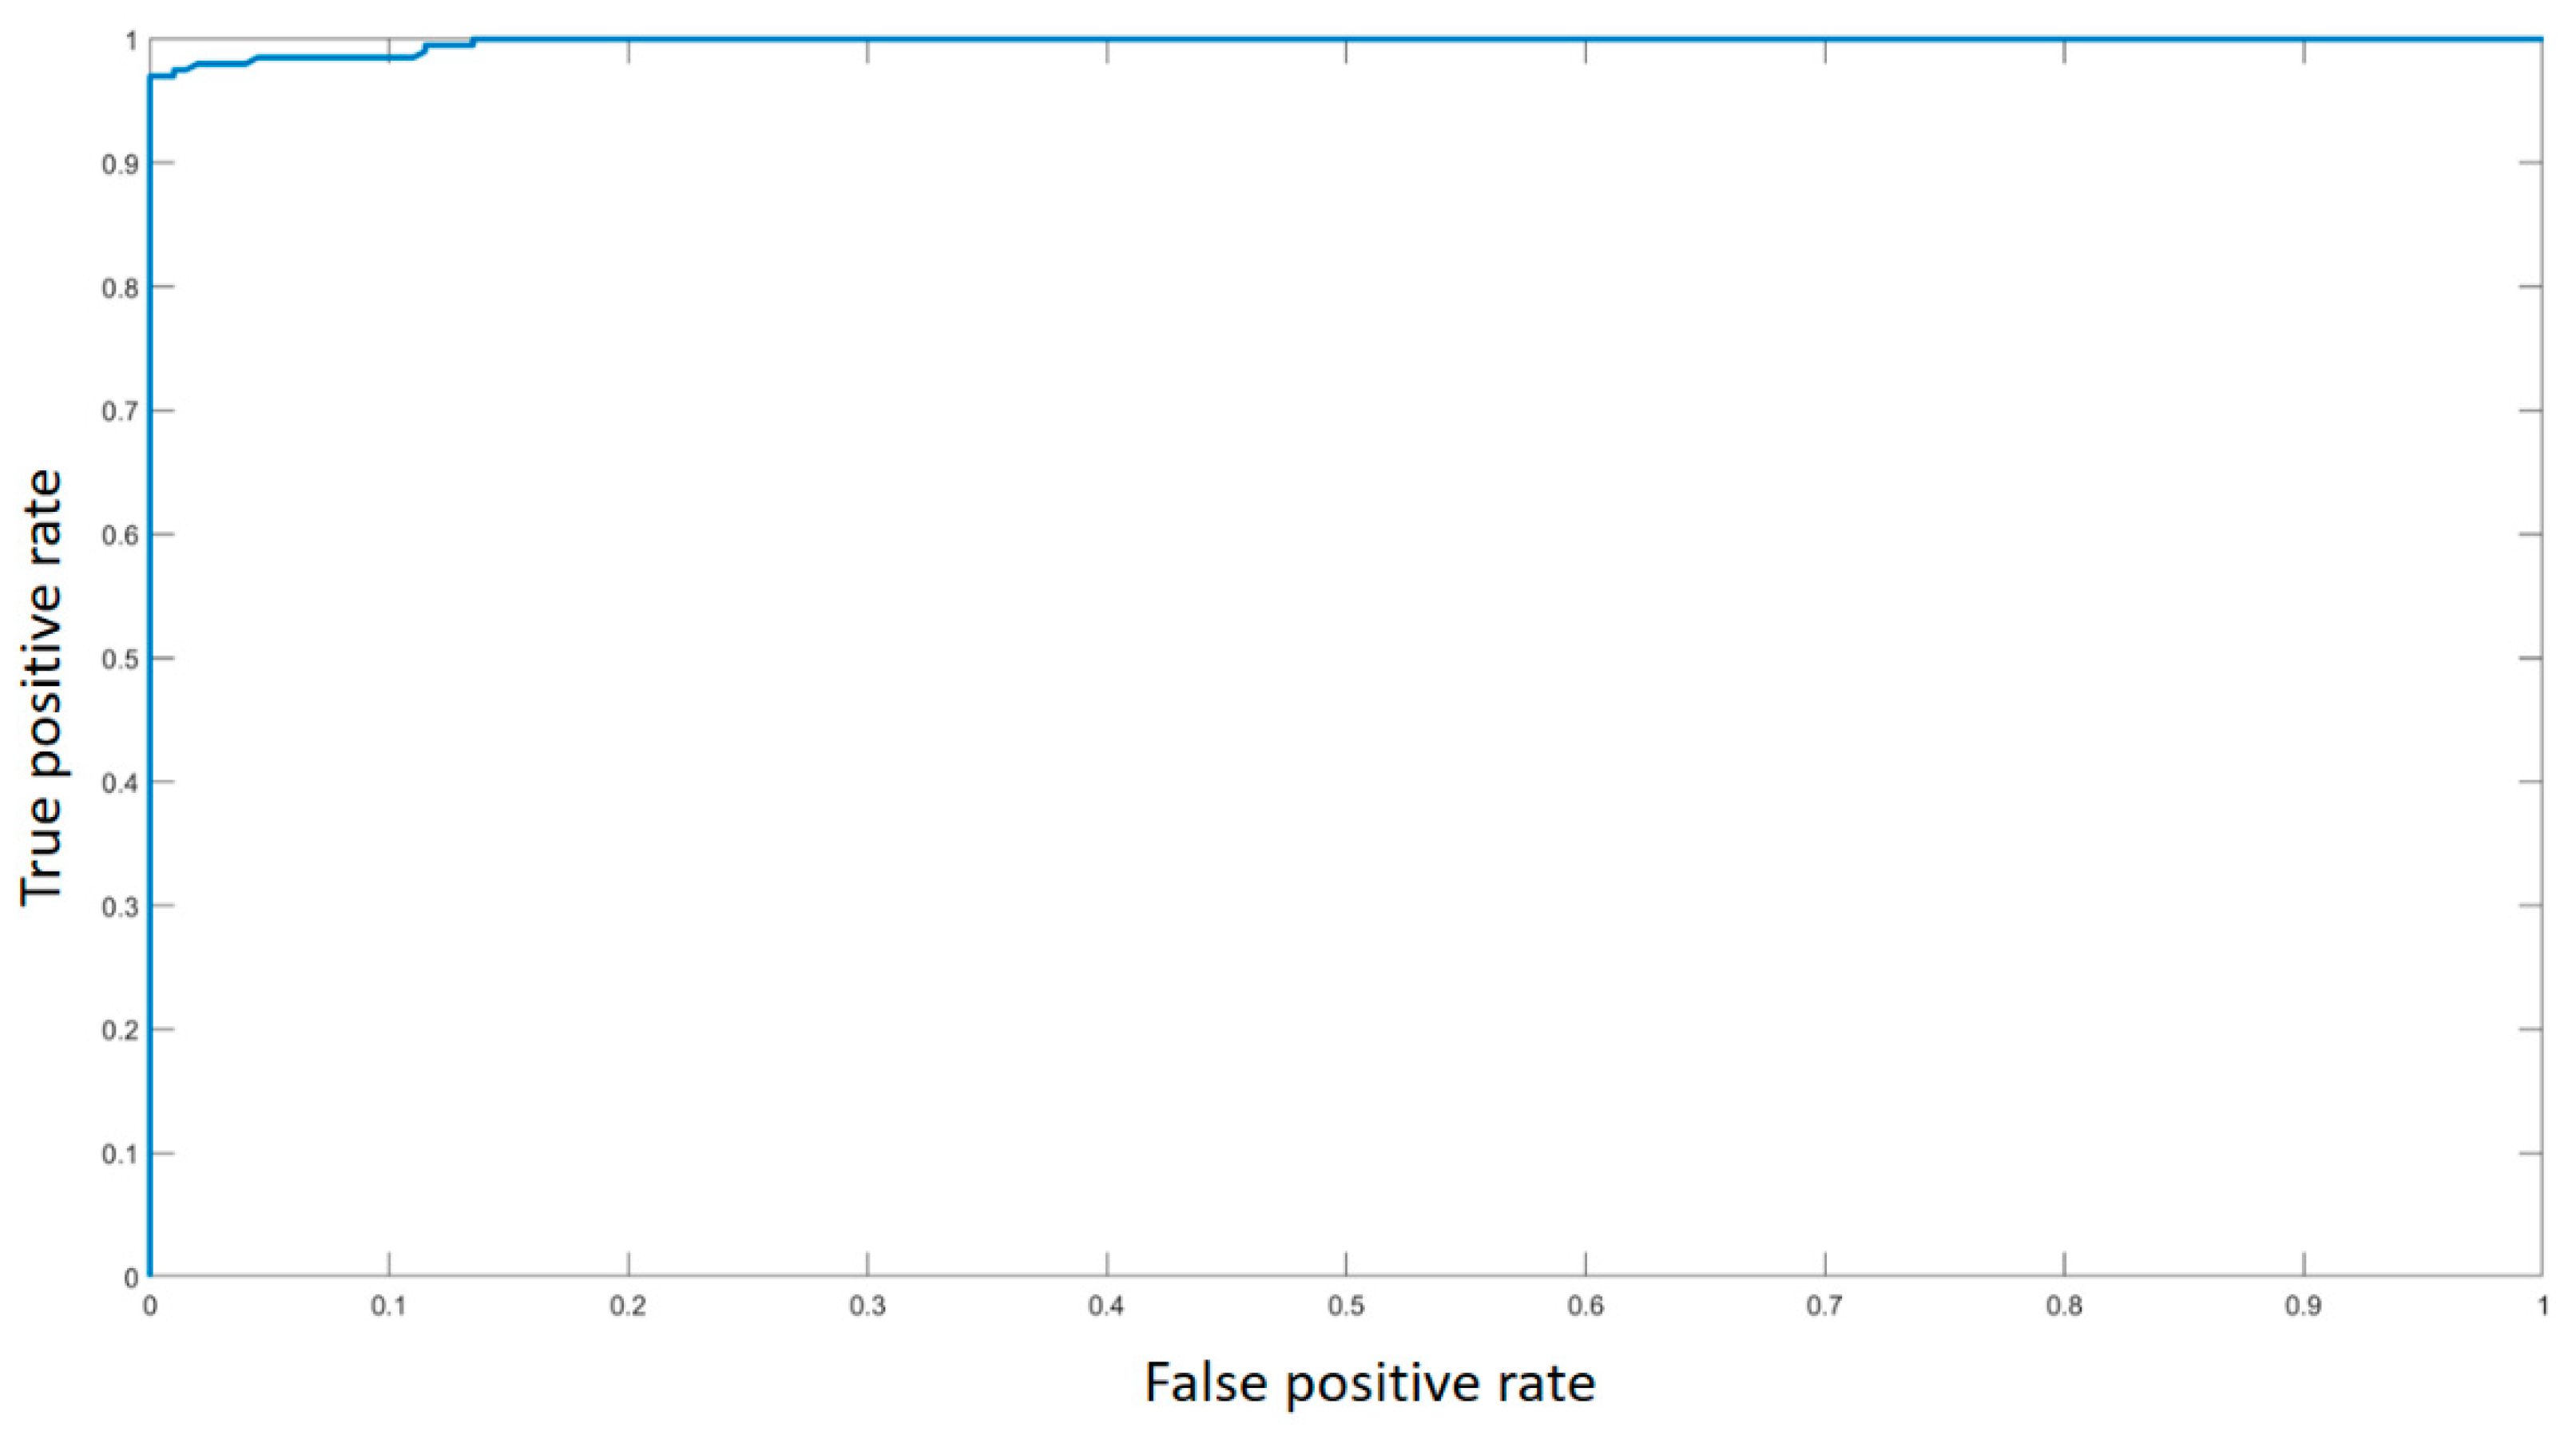
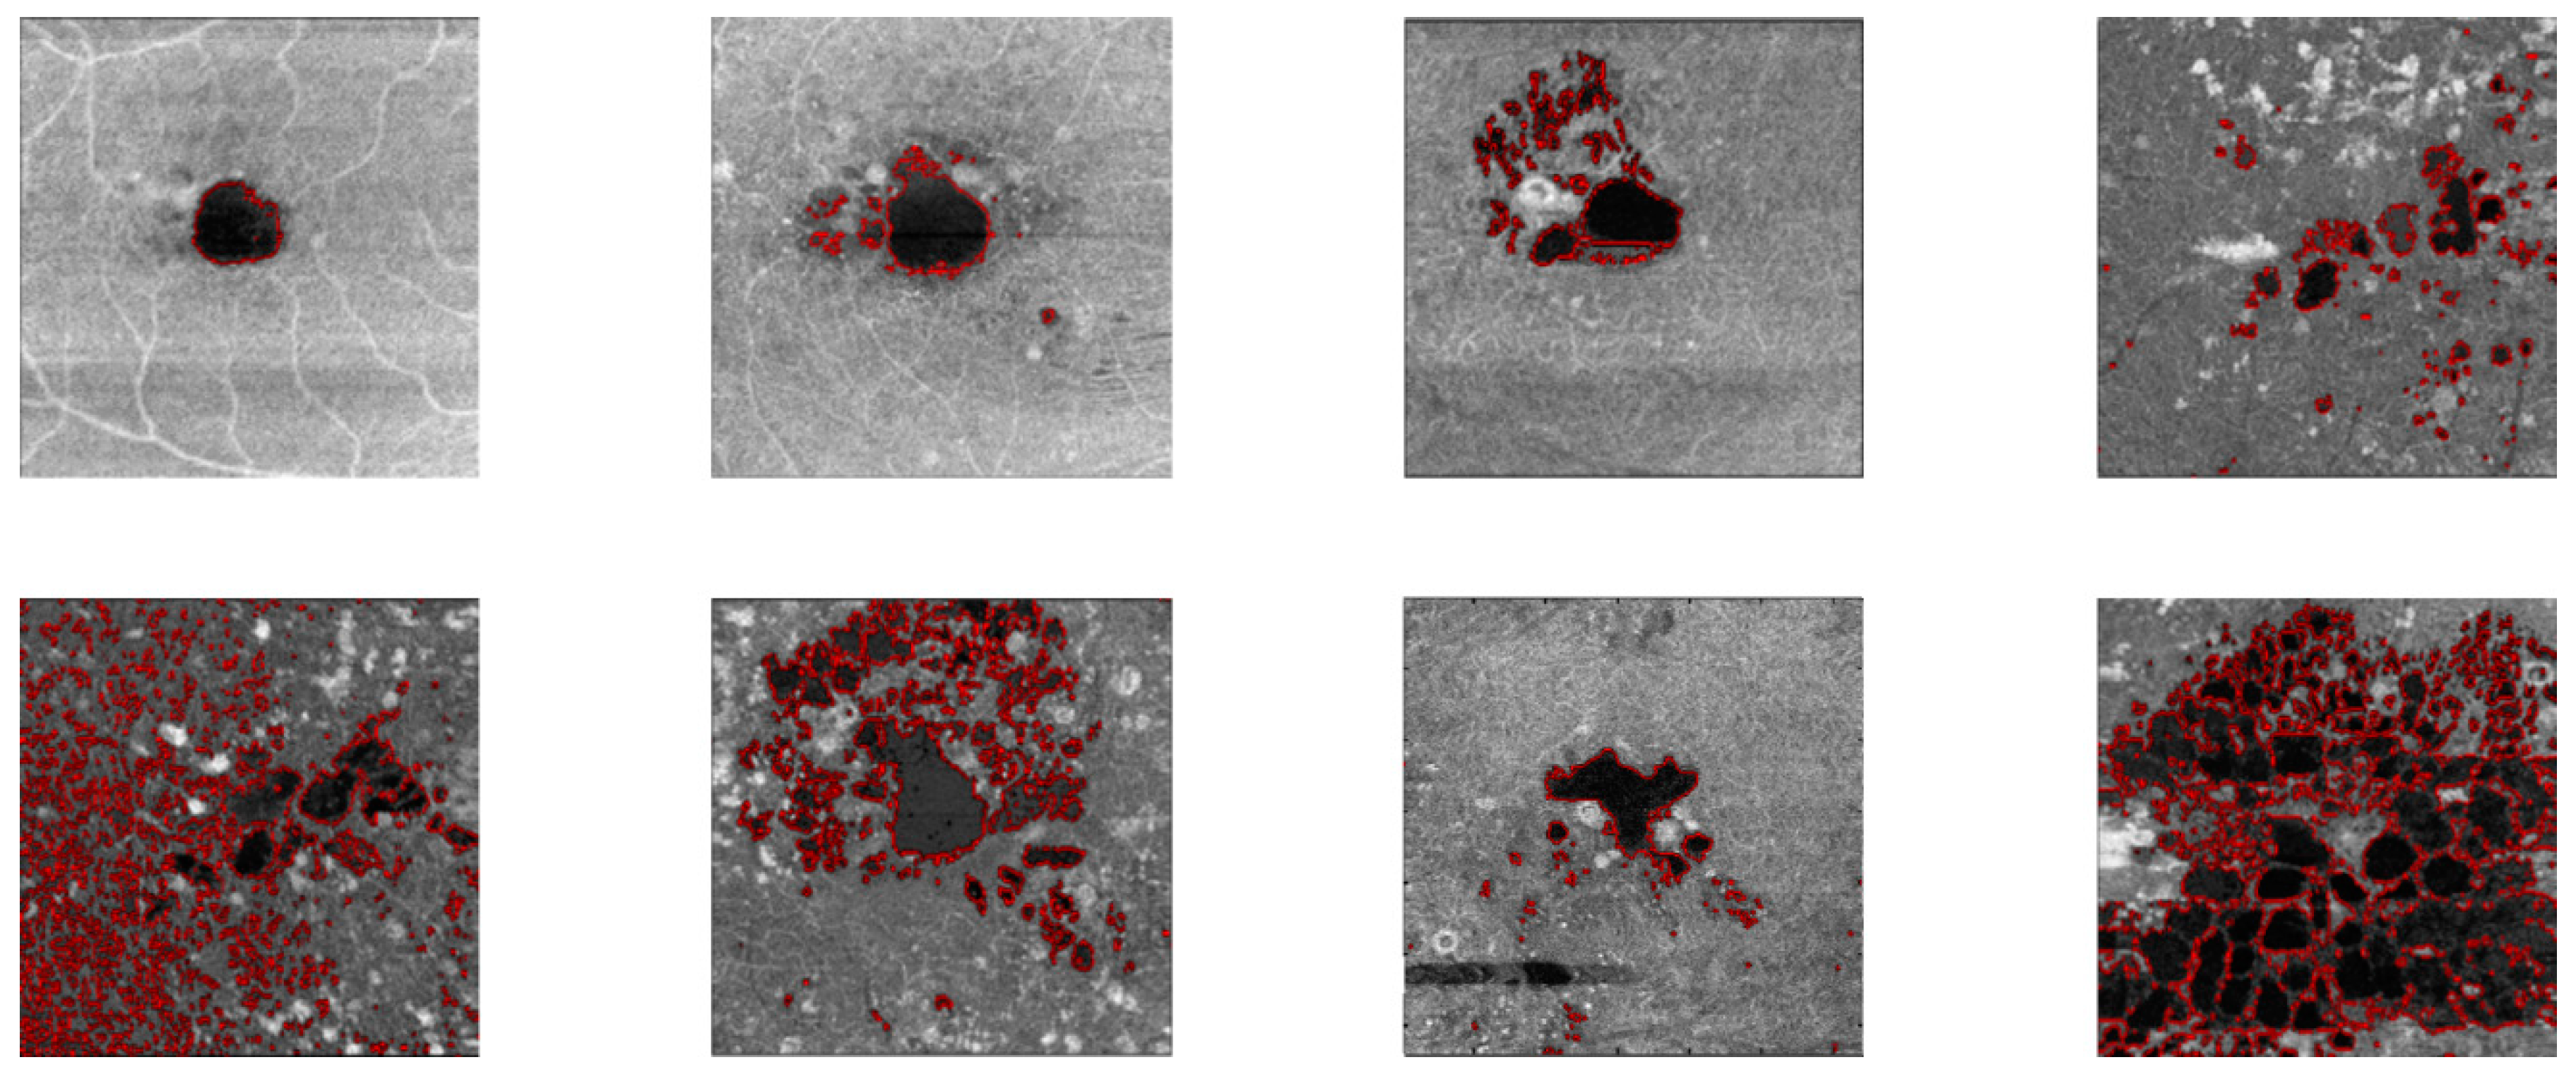
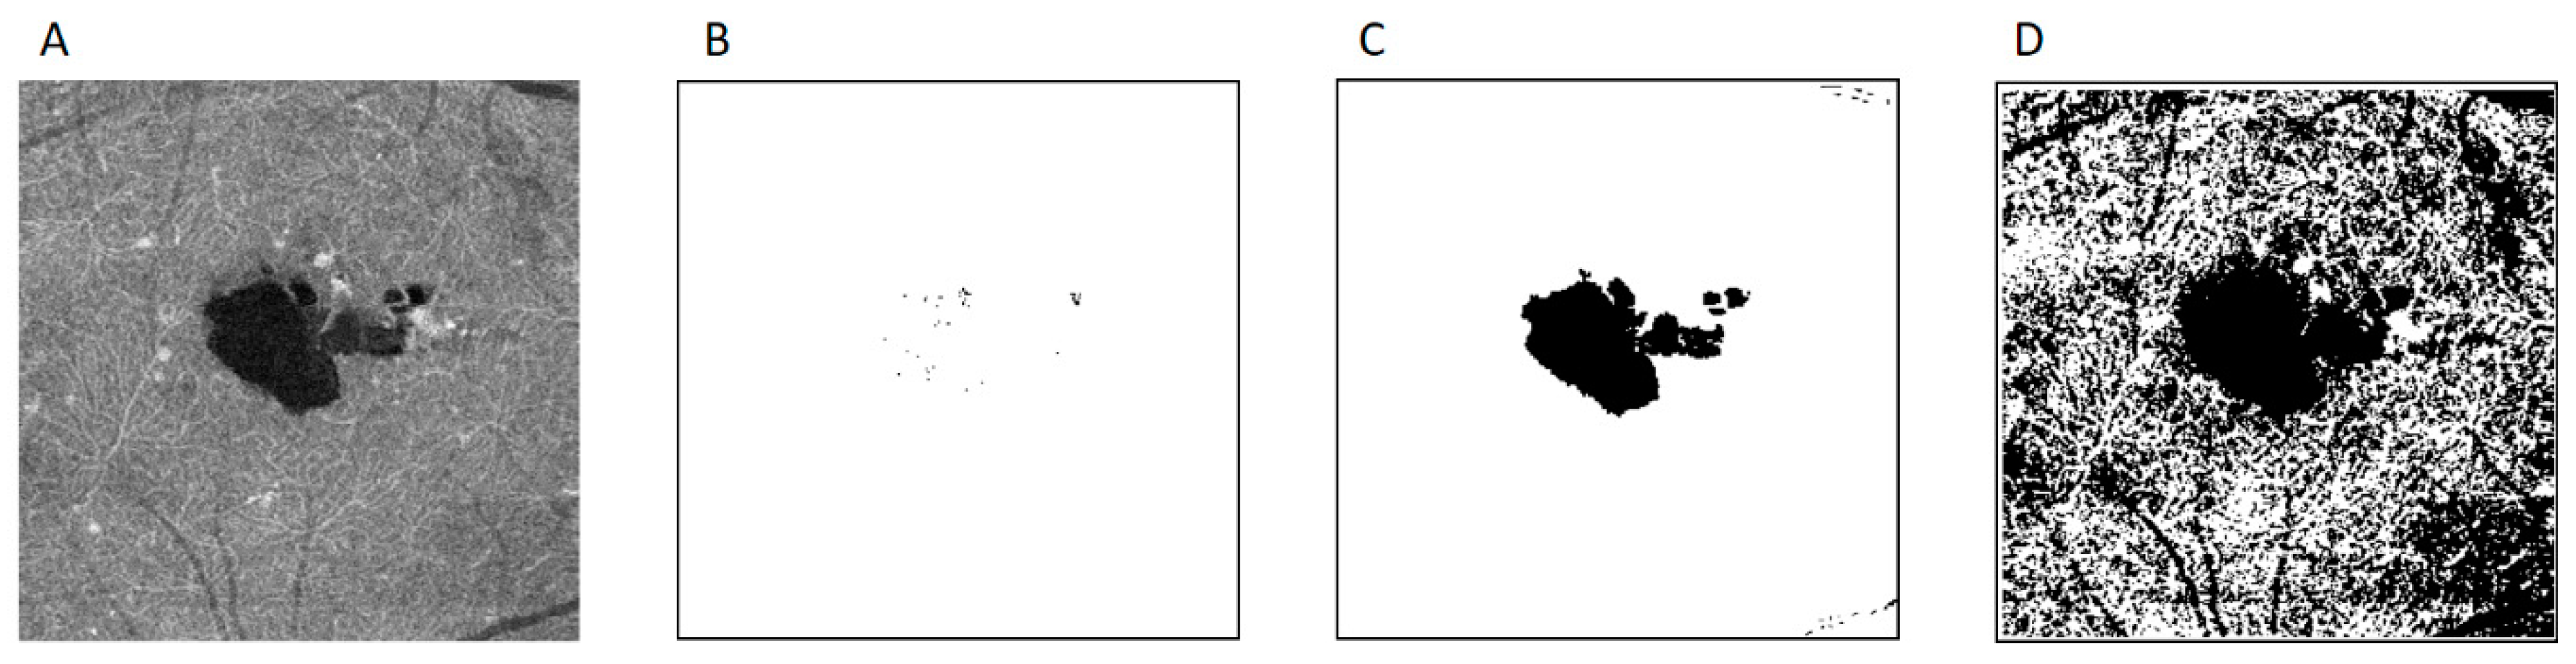
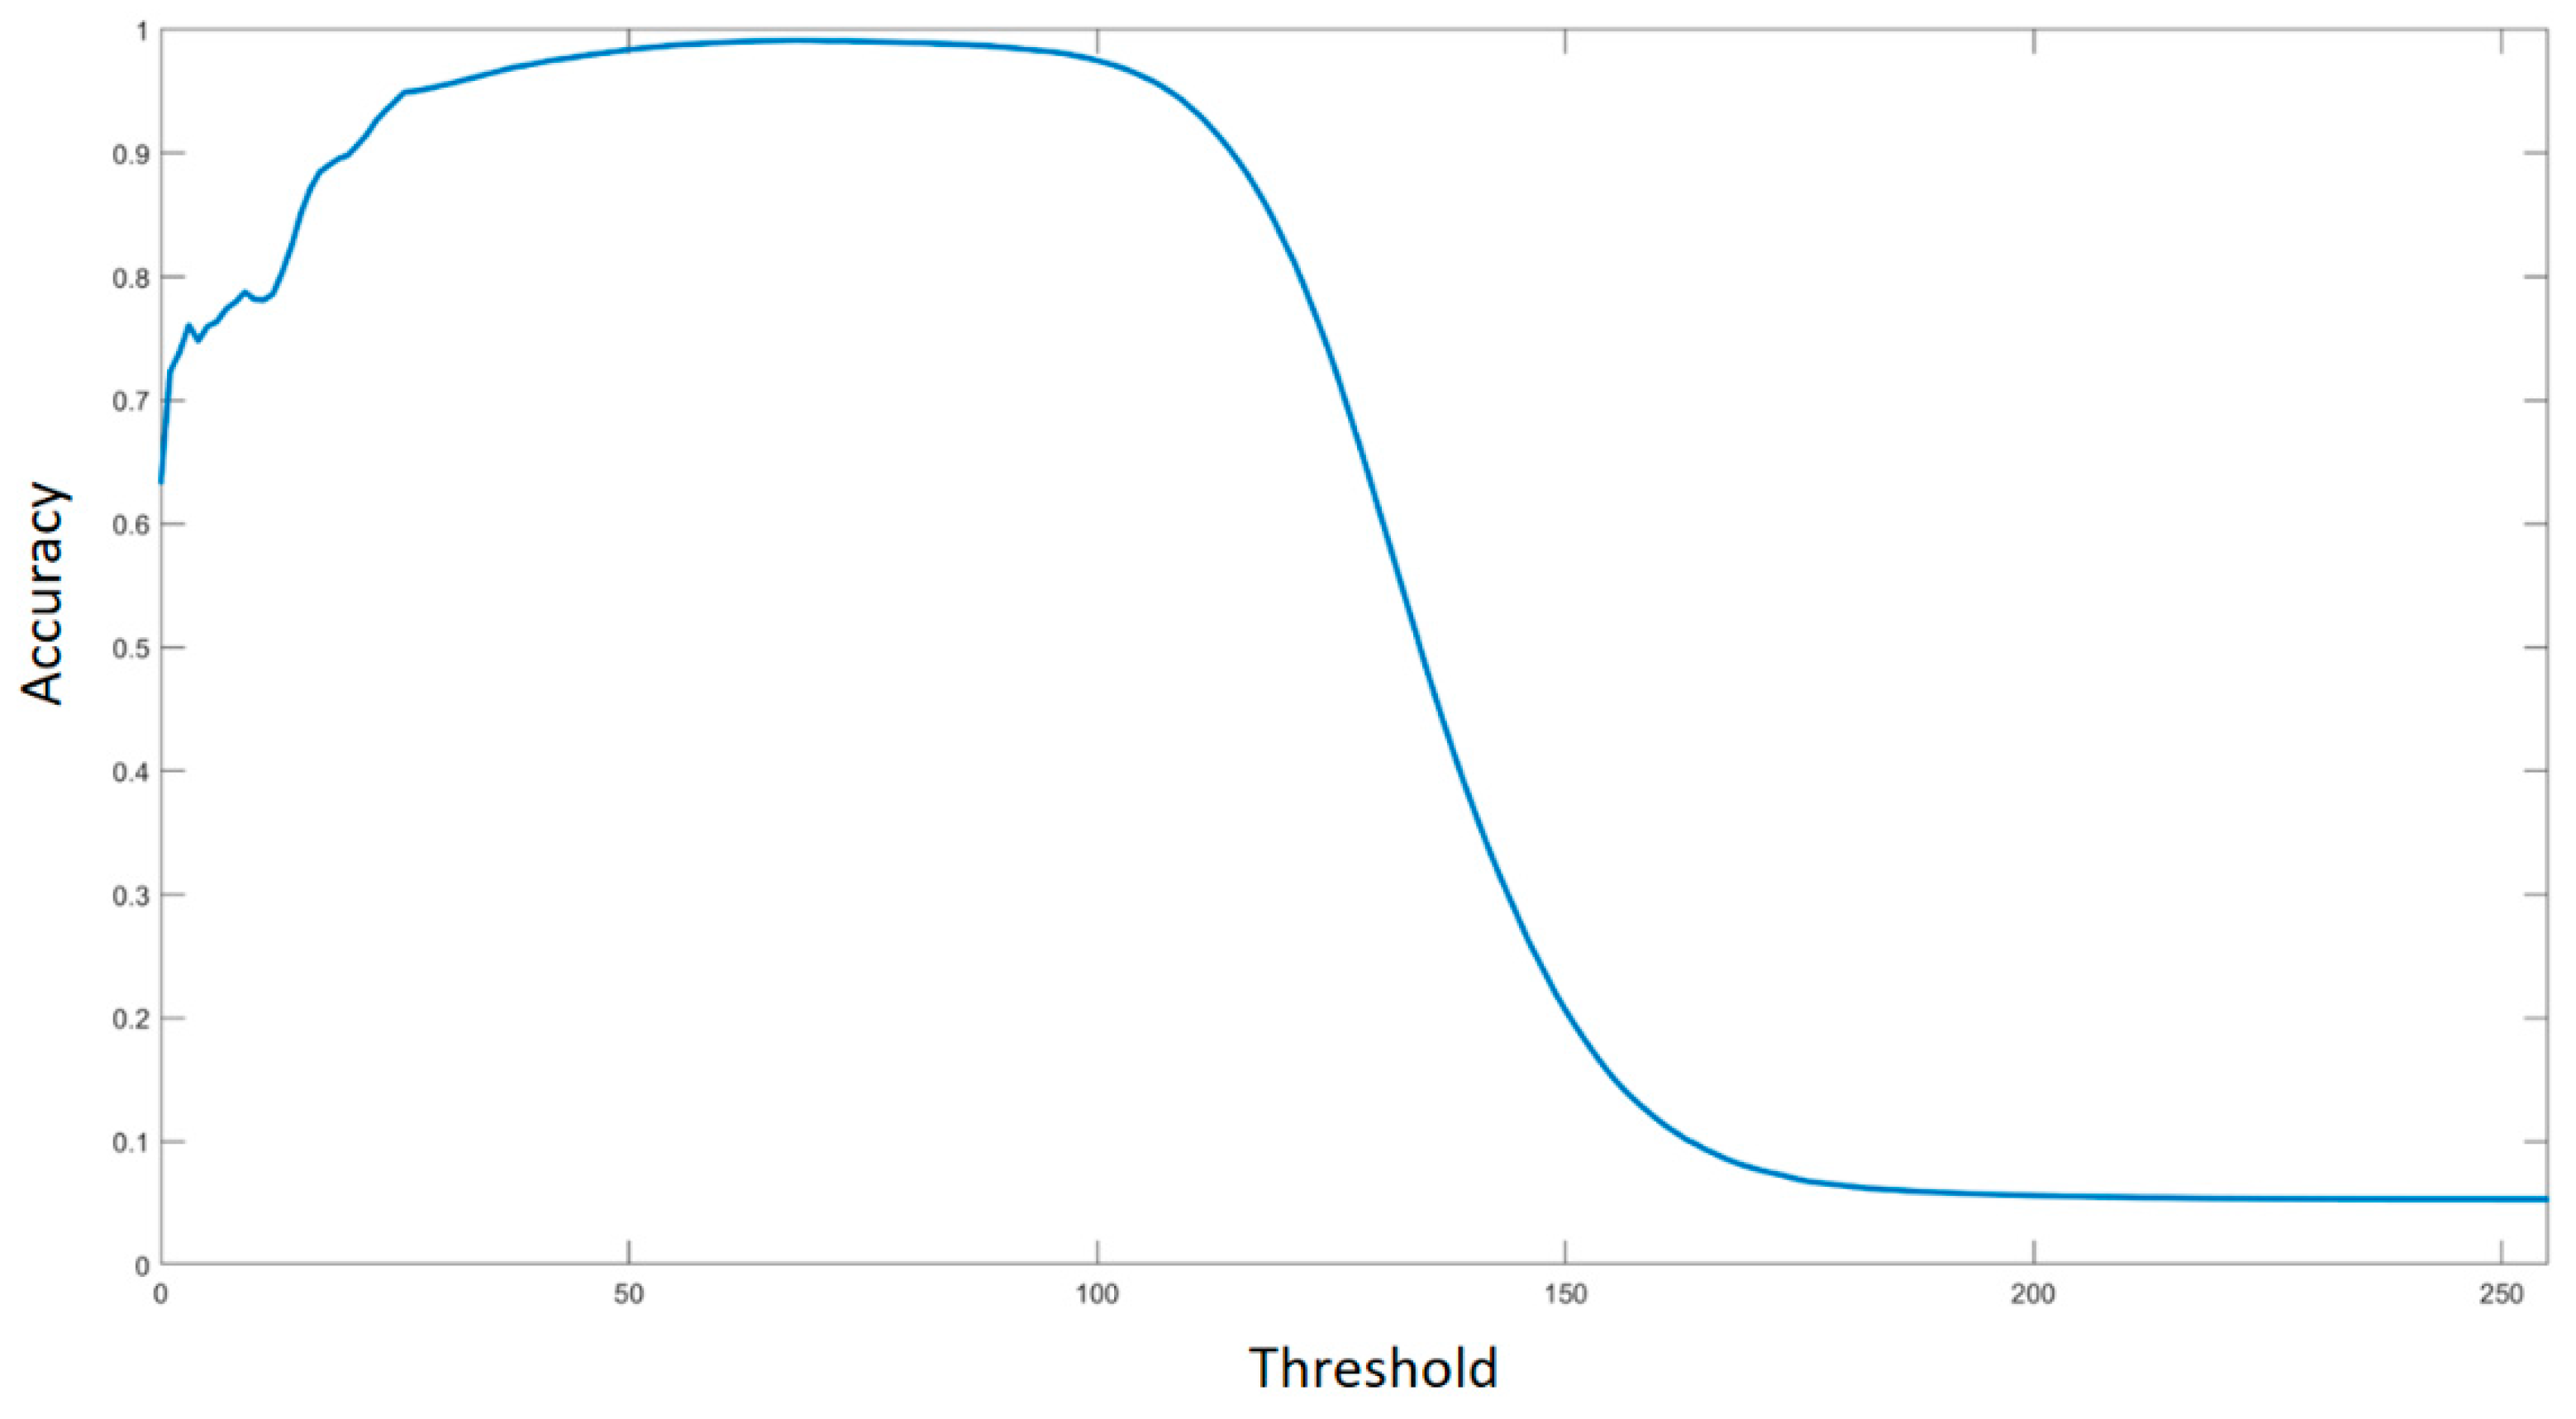
  • Img_gauss = perform Gaussian filtering on Img
  • Bin = binarize Img_gauss
  • bin_er = perform erosion on bin with the structuring element
  • bin_dil = perform dilation on bin_er with the structuring element
  • bin_canny = apply Canny filter to bin_dil
  • lines = apply Hough transform to bin_canny
  • for eachlineinlines
  • if slope(line) < 85 or length(line) < 100
  • Delete line from lines
  • end if
  • end for
  • iflines has two or more elements
  • cysts = delete horizontal bands between the horizontal lines in bin_dil
  • else
  • cysts = bin_dil
  • end if
  • area = count black pixels in cysts and multiply for the single pixel area
Output:cysts—a binary image showing the detected cysts, area—the total area of the cysts
The proposed algorithm starts filtering the image with a 2-D Gaussian filter kernel (line 1), characterized by a standard deviation of 0.5 and a dimension of 5 × 5. This filter has been chosen since it is typically used in OCT-A imaging where it has been demonstrated to be a computationally efficient solution to reduce the noise. Moreover, this filter is widely used in applications targeted at detecting the edges/contours of different objects [14,15,16]. In fact, the Gaussian filter has a low-pass response, which attenuates high frequency signal components. This step can be seen as a pre-processing phase needed to better extract the features from the images.
The filtered image is then binarized (line 2) in order to identify the areas related to the cysts and the motion artifacts, since, as previously mentioned, they are characterized by dark pixels. In this case, the algorithm binarizes the image on the basis of a global threshold, which has been chosen after evaluating the results of different experiments. In particular, the best results are achieved when the threshold is calculated with Otsu’s method, which computes the threshold value by minimizing the intraclass variance of the thresholded black and white pixels. Appendix A shows an example of how a different threshold value impacts the final classification.
The next step concerns the elimination of isolated pixels, eventually due to noise. This task is performed by applying an image erosion followed by an image dilation with a suitable structuring element (lines 3–4). In this case, the structuring element has been chosen after several experiments, which indicated a square of size 2 × 2 as the best structuring element. The output produced by these phases is shown in Figure 3, considering as input the same images shown in Figure 2.
By analyzing the outputs shown in Figure 3, it is possible to distinguish between two main cases. In the first case, when the input image does not present motion artifacts, the output of the first two phases is sufficient to correctly identify the cyst area (Figure 3B). On the other hand, if the input image contains a motion artifact, the output does not highlight just the cysts, since the motion artifact also appears as a black area. To identify and remove these artifacts, the algorithm searches the horizontal long lines which characterize the superior and inferior edges of the motion artifact, employing the Canny filter (line 5) to enhance the detection quality [17]. This filter searches for local maxima in the image gradient, which is computed using a second derivative of the Gaussian filter. The authors chose this filter since it performs non-maximum suppression on the image gradient, in order to delete spurious edges. The remaining maximum values in the gradient images are then processed with the double threshold method [18]. Finally, the edges are tracked through the hysteresis method.
The obtained image is then elaborated through the Hough transform (line 6), which finds all the line-shaped edges. However, this does not mean that all those edges are related to a motion artifact. In fact, some cysts can have edges with shapes similar to a line, and can be identified by the Hough transform as lines. In order to avoid the misclassification of these edges, authors performed several experiments in order to identify suitable thresholds, to discriminate between the edges related to the motion artifacts and those related to the cysts. In particular, the characteristics that can discriminate between two kinds of edges are the slope and the length of the lines. Analyzing the dataset, authors noticed that motion artifacts are horizontal bands that occupy almost one third of the image. Therefore, we defined suitable thresholds for the line’s slope and length. In particular, the images analysis showed that the shortest motion artifact extends for approximately 1 mm of length, while the longest one extends for the whole image length (3 mm). Therefore, authors chose to set the length threshold to 1 mm, which is one third of the image length.
Only the lines with the correct slope and lengths are considered as motion artifact edges (lines 7–11). An example of typical edges in a motion artifact is shown in Figure 4, where the lines obtained with the proposed method are highlighted in green.
At this point, the algorithm checks if the previous step has found edges related to motion artifacts. If it has, the motion artifacts are eliminated from the image by the forcing to the white value of the pixel included between the edges. Otherwise, no modifications are applied to the image (lines 12–16).
The final step of the algorithm computes the total area of the cysts, by counting the number of black pixels and multiplying it by the spatial resolution of a single pixel.
Finally, the black and white images obtained by the proposed method can be used as masks for the enface flow images, in order to correctly evaluate microvascular parameters such as perfusion density (PD). The exclusion of these areas from the computation of PD is of crucial importance, since they can be erroneously identified as areas without vascularization, resulting in an underestimation of PD.
For the methodology validation, authors visualized the intermediate results of all the algorithm steps. These intermediate results have been also used to perform fine-tuning on the different parameters, whose values have been given in the previous section.
Medical doctors have validated the results in terms of cyst-delineation and motion artifact-removing. For all the analyzed images, the cysts’ borders where correctly delineated. Moreover, all the motion artifacts were correctly identified and removed.
The considered dataset includes both images where the cysts are clearly visible and easy to delineate, and images where the cysts are big and with a complex geometry. The proposed algorithm has been validated also for images containing complex geometries.
The quality of the detection has also been quantitatively evaluated, by comparing the ground truth maps produced by the expert medical doctors with the results of the proposed method. Authors adopted different indexes to evaluate the detection. In particular, the Jaccard index has been adopted to measure how the detection performed by the proposed method is similar to the medical doctor’s analysis. The index is defined by Equation (1):
J ( A , B ) = | A B | | A B |
where A is the ground truth produced by the medical doctor, while B is the output of the algorithm.
The cyst detection has also been evaluated in terms of Sensitivity, Specificity, Accuracy, Precision and F1 score, defined by Equations (2)–(6):
S e n s i t i v i t y = T P T P + F N
S p e c i f i c i t y = T N T N + F P
A c c u r a c y = T P + T N T P + T N + F P + F N
P r e c i s i o n = T P T P + F P
F 1 s c o r e = 2 T P 2 T P + F P + F N
where T P are the true positives, F N the false negatives, F P the false positives, and finally T N are the true negatives. In this case, a T P is a pixel, identified by both the medical doctor (MD) and the proposed method, as a cyst, while a T N is a pixel classified as not a cyst by the MD and the algorithm. On the other hand, a F P is a pixel classified as not a cyst by the MD but identified as a cyst by our method. Finally, a F N is a pixel identified as a cyst by the MD but classified as not a cyst by our algorithm.

3. Results

The proposed method has been tested on a wide dataset, consisting of 194 images acquired from 30 different patients with macular edema, including both images with and without motion artifacts (about 27%).
The values of sensitivity, specificity, accuracy and precision are reported in Table 1.
The values shown in Table 1 clearly highlight the effectiveness of the proposed method, which is always capable of correctly detecting the cysts’ margins excluding the motion artifacts.
The effectiveness of our algorithm is also shown by the Receiver Operating Characteristic (ROC) curve reported in Figure 5.
Figure 6 shows some images where the cysts’ edges delineated by the proposed algorithm are highlighted in red, and in this way shows how the proposed method is capable of correctly delineating the cysts’ borders. In the third image of the second row, a motion artifact is present. As highlighted by the red borders, the motion artifact is excluded from the cyst detection.
The computational complexity of the proposed algorithm has been evaluated by measuring the processing times taken by the Matlab script. The test has been conducted on a PC with an Intel i7-6700 CPU, working at 3.40 GHz and equipped with 32 GB of RAM. Considering the worst case, i.e., when the motion artifacts compensation is performed, the processing time is always lower than 100 ms. This time is negligible if compared to the duration of a typical OCT-A acquisition, which lasts about 15 s. Moreover, if the patient is affected by low visual acuity, tremors or dementia, the exam duration is longer, and there is a higher probability of motion artifacts in the acquired image. However, this does not change the maximum time needed by the proposed algorithm. Therefore, the proposed algorithm is real-time compliant.

4. Discussion

In the present paper, a novel algorithm, able to successfully delineate cysts’ contours and motion artifacts on enface structural images of both SCP and DCP slabs, is described. Experiments have been conducted considering different images, in some cases affected by motion artifacts. The cysts present in the images were of different sizes and shapes, in order to ensure that the proposed methodology produces correct results in different scenarios.
The instrument used in the present study can acquire images covering an area of 3 mm × 3 mm or of 6 mm × 6 mm. In both cases, the image has a size of 320 × 320 pixels. Therefore, considering an area of 3 mm × 3 mm ensures the acquisition of more details than capturing a 6 mm × 6 mm area. For this reason, authors tested the proposed method on images covering a 3 mm × 3 mm area. Moreover, a previous work [19] reported that the instrument used in this study is able to detect even early microvascular impairment. However, this algorithm can be easily applied to images of different sizes and obtained with different OCT-A instruments.
In the literature, different approaches have been proposed for cyst detection on both OCT and OCT-A images.
As for OCT, Wilkins et al. [20] proposed a method based on the cascade application of retinal layer segmentation, median filtering, signal-to-noise ratio balancing, bilateral filtering, thresholding, boundary tracing and the rejection of false positives. The authors claimed to correctly delineate cyst borders. However, the authors validated their methodology with images acquired from only 16 patients [20], while in the present work we consider a larger dataset, which includes 194 images from 30 different patients. Finally, the authors did not report any result about computational complexity or processing time. Another interesting work was published by Gonzàlez et al. [21]; in this paper, cyst detection was performed through watershed segmentation. In this case as well, the considered dataset included only 30 images [21]. Moreover, the computational complexity is not reported. A recent work by Gopinath et al. adopted convolutional neural networks to delineate the cyst margin on OCT images [22]. The work considered three different datasets, acquired from four different commercial devices. The datasets were divided into training and test sets, each one including 15 training and 15 testing volumes. The authors reported some limitations related to the detection of small cysts. In fact, the convolutional neural network is not capable of detecting small cysts. It is also important to consider that the use of a convolutional neural network requires a labelled dataset and long training times. Finally, the computational complexity of the method is not reported.
About all these works, it is important to highlight that they adopted OCT imaging, not OCT-A; therefore, a direct comparison with the proposed method cannot be performed.
As for OCT-A, De Carlo et al. [12] were the first to try to differentiate intra-retinal cysts from non-perfused areas in SCP and DCP OCT-A images using a Spectral Domain instrument. Based on their results, they concluded that intra-retinal cysts can be seen as black oblong areas, completely devoid of signal, whereas non-perfused areas were described as dark regions with some internal noise and surrounded by capillaries [12]. In fact, all the images with retinal cysts evaluated in the present study have the characteristics described by De Carlo et al. [12]. Therefore, the authors feel quite confident in excluding the presence of relevant ischemic areas in the macular region.
Kashani et al. [23] later described a new OCT-A feature called suspended scattering particles in motion (SSPiM), appearing as an extravascular signal of flow on OCT angiograms and thought to be related to the motion of particles within intra-retinal fluid, being considered a marker of cysts. Recently, Parravano et al. [24] compared the appearance of cysts and non-perfused areas in images obtained with two different OCT-A devices, a Spectral Domain device and a Swept Source device. In their study, the authors integrated data of OCT-A angiograms and corresponding B-scan OCT with flow, in order to differentiate non-perfused areas and cysts, and for the detection of SSPiM. While they confirmed that dark regions could correspond either to non-perfused areas or cysts with both instruments, they reported that both features could have some internal signal, and interestingly this internal signal (SSPiM) was more frequently associated with cysts than with non-perfused areas.
All the previously mentioned studies have as their main focus the identification of intra-retinal cysts and non-perfused areas based on clinical expertise, with the objective of finding specific qualitative characteristics that could help in their differentiation. In the present paper, the proposed algorithm for cyst detection has the advantage of defining, precisely and automatically, the borders of the cysts, making this method suitable for quantitative analyses.
To the best of our knowledge, this is the first work using enface structural SCP and DCP images to detect intra-retinal cysts and motion artifacts, building a sort of “map” to be used as a mask on enface flow corresponding images in order to remove these elements from the computation of perfusion parameters. In the past, a method aimed at compensating for signal attenuation in the choriocapillaris OCT-A slab, caused by defects of the retinal pigmented epithelium and Bruch’s membrane, by using the corresponding enface structural images, was developed and validated by Zhang et al. [25]. However, this method does not take into account the presence of cysts and/or motion artifacts.

5. Conclusions

This paper presented a novel methodology for cyst borders detection, including an original motion artifacts compensation technique for OCT-A images. The method has been validated on a dataset consisting of 194 images acquired from 30 patients, larger than what is typically found in the literature. The algorithm is able to correctly identify the cysts’ borders, eliminating the motion artifacts that could alter the results. Moreover, the results are produced in about 100 ms, which is a negligible time if compared to the duration of a typical OCT-A exam, even when considering healthy and collaborative patients.
To the best of the authors’ knowledge, the use of enface structural images for cyst detection together with the elimination of motion artifacts, in order to avoid an erroneous cyst border delineation, has not been adopted before. Moreover, the proposed method does not need a labelled dataset, since it is not based on supervised learning techniques. It is also important that the effort to produce a labelled dataset to use as a training set is not negligible.
Future research will be focused on the integration of this method in more complex analysis, in order to exclude the area related to the cysts from vascularization or flow-voids computations. Moreover, further studies would be needed to evaluate an algorithm to distinguish between cysts and non-perfusion areas.

Author Contributions

Conceptualization, S.V. and C.T.; methodology, S.V., C.T., E.T.; software, E.T.; validation, C.T., S.V. and E.T.; writing—original draft preparation, E.T. and C.T.; writing—review and editing, F.L. S.V., P.N. S.D.C.; supervision, F.L. All authors have read and agreed to the published version of the manuscript.

Funding

This research received no external funding.

Conflicts of Interest

The authors declare no conflict of interest.

Appendix A

In this section, the authors give additional information on the global threshold effect on the final classification. Figure A1 shows the impact of three different thresholds on an enface structural image.
Figure A1A shows the original enface structural image after the Gaussian filter. The result of the binarization with a threshold lower than the optimal one is shown in Figure A1B. It is clear that a low threshold has the effect of deleting from the binary image part of the cyst; therefore, the final classification of this image will lead to wrong margin detection. Figure A1C shows the binarized image when the optimal threshold is adopted. In this case, it is possible to observe how the cysts are present in this binary image. Moreover, in the upper and in the lower right corners there are some black pixels related to big blood vessels. Those pixels will be eliminated by the erosion and dilation steps of the algorithm. Finally, Figure A1D shows the effect of a threshold greater than the optimal one. It is possible to see that, in this case, a lot of pixels not belonging to the cysts are present in the image.
Figure A1. The impact of different thresholds on the binarization. (A) The original enface structural image. (B) The binarized image with a threshold lower than the optimal one. (C) The binarized image with the optimal threshold. (D) The binarized image with a threshold greater than the optimal one.
Applsci 10 03994 g0a1
To further show the impact of the choice of the global threshold on the final classification, Figure A2 reports the effect of the threshold value on the total accuracy of the algorithm.
Figure A2. The impact of the global threshold on the total accuracy of the algorithm.
Applsci 10 03994 g0a2
Figure A2 clearly shows that the choice of the global threshold has a crucial role in the overall accuracy.

References

  1. Bhanushali, D.; Anegondi, N.; Gadde, S.G.K.; Srinivasan, P.; Chidambara, L.; Yadav, N.K.; Roy, A.S. Linking retinal microvasculature features with severity of diabetic retinopathy using optical coherence tomography angiography. Investig. Ophthalmol. Vis. Sci. 2016, 57, 519–525. [Google Scholar] [CrossRef] [PubMed]
  2. Vujosevic, S.; Muraca, A.; Gatti, V.; Masoero, L.; Brambilla, M.; Cannillo, B.; Villani, E.; Nucci, P.; De Cillà, S. Peripapillary microvascular and neural changes in diabetes mellitus: An oct-angiography study. Investig. Ophthalmol. Vis. Sci. 2018, 59, 5074–5081. [Google Scholar] [CrossRef] [PubMed] [Green Version]
  3. Kim, K.; Kim, E.S.; Yu, S.Y. Optical coherence tomography angiography analysis of foveal microvascular changes and inner retinal layer thinning in patients with diabetes. Br. J. Ophthalmol. 2018, 102, 1226–1231. [Google Scholar] [CrossRef] [PubMed]
  4. Ting, D.S.W.; Tan, G.S.W.; Agrawal, R.; Yanagi, Y.; Sie, N.M.; Wong, C.W.; Yeo, I.Y.S.; Lee, S.Y.; Cheung, C.M.G.; Wong, T.Y. Optical coherence tomographic angiography in type 2 diabetes and diabetic retinopathy. JAMA Ophthalmol. 2017, 135, 306–312. [Google Scholar] [CrossRef] [PubMed]
  5. Lee, J.; Moon, B.G.; Cho, A.R.; Yoon, Y.H. Optical coherence tomography Aangiography of DME and its Aassociation with anti-VEGF treatment response. In Proceedings of the Ophthalmology; Elsevier Inc.: Amsterdam, The Netherlands, 2016; Volume 123, pp. 2368–2375. [Google Scholar]
  6. Toto, L.; D’Aloisio, R.; Di Nicola, M.; Di Martino, G.; Di Staso, S.; Ciancaglini, M.; Tognetto, D.; Mastropasqua, L. Qualitative and quantitative assessment of vascular changes in diabetic macular edema after dexamethasone implant using optical coherence tomography angiography. Int. J. Mol. Sci. 2017, 18, 1181. [Google Scholar] [CrossRef] [PubMed]
  7. Mastropasqua, R.; D’Aloisio, R.; Di Nicola, M.; Di Martino, G.; Lamolinara, A.; Di Antonio, L.; Tognetto, D.; Toto, L. Relationship between aqueous humor cytokine level changes and retinal vascular changes after intravitreal aflibercept for diabetic macular edema. Sci. Rep. 2018, 8, 16548. [Google Scholar] [CrossRef] [PubMed]
  8. Vujosevic, S.; Gatti, V.; Muraca, A.; Brambilla, M.; Villani, E.; Nucci, P.; Rossetti, L.; De Cilla’, S. Optical coherence tomography angiography changes after subthreshold micropulse yellow laser in diabetic macular edema. Retina 2020, 1, 312–321. [Google Scholar] [CrossRef] [PubMed]
  9. Vujosevic, S.; Toma, C.; Villani, E.; Muraca, A.; Torti, E.; Florimbi, G.; Leporati, F.; Brambilla, M.; Nucci, P.; De Cilla’, S. Diabetic macular edema with neuroretinal detachment: OCT and OCT-angiography biomarkers of treatment response to anti-VEGF and steroids. Acta Diabetol. 2020, 57, 287–296. [Google Scholar] [CrossRef] [PubMed]
  10. Munk, M.; Sacu, S.; Huf, W.; Sulzbacher, F.; Mittermüller, T.; Eibenberger, K.; Rezar, S.; Bolz, M.; Kiss, C.; Simader, C.; et al. Differential diagnosis of macular edema of different pathophysiologic origins by spectral domain optical coherence tomography. Retina 2014, 34, 2218–2232. [Google Scholar] [PubMed]
  11. Otani, T.; Kishi, S.; Maruyama, Y. Patterns of diabetic macular edema with optical coherence tomography. Am. J. Ophthalmol. 1999, 127, 688–693. [Google Scholar] [CrossRef]
  12. De Carlo, T.E.; Chin, A.T.; Joseph, T.; Baumal, C.R.; Witkin, A.J.; Duker, J.S.; Waheed, N.K. Distinguishing diabetic macular edema from capillary nonperfusion using optical coherence tomography angiography. Ophthalmic Surg. Lasers Imaging Retin. 2016, 47, 108–114. [Google Scholar] [CrossRef] [PubMed] [Green Version]
  13. Spaide, R.F.; Fujimoto, J.G.; Waheed, N.K. Image artifacts in Optical coherence tomography angiography. Retina 2015, 35, 2163–2180. [Google Scholar] [CrossRef] [PubMed]
  14. Deng, G.; Cahill, L.W. Adaptive Gaussian filter for noise reduction and edge detection. In Proceedings of the IEEE Nuclear Science Symposium & Medical Imaging Conference, San Francisco, CA, USA, 31 October–6 November 1993; IEEE: Piscataway, NJ, USA, 1994; pp. 1615–1619. [Google Scholar]
  15. Hsiao, P.Y.; Chen, C.H.; Chou, S.S.; Li, L.T.; Chen, S.J. A parameterizable digital-approximated 2D Gaussion smoothing filter for edge detection in noisy image. In Proceedings of the IEEE International Symposium on Circuits and Systems, Island of Kos, Greece, 21–24 May 2006; pp. 3189–3192. [Google Scholar]
  16. Direkoglu, C.; Nixon, M.S. Image-based multiscale shape description using gaussian filter. In Proceedings of the 6th Indian Conference on Computer Vision, Graphics and Image Processing, ICVGIP 2008, Bhubaneswar, India, 16–19 December 2008; pp. 673–678. [Google Scholar]
  17. Ding, L.; Goshtasby, A. On the canny edge detector. Pattern Recognit. 2001, 34, 721–725. [Google Scholar] [CrossRef]
  18. Song, R.; Zhang, Z.; Liu, H. Edge connection based Canny edge detection algorithm. Pattern Recognit. Image Anal. 2017, 27, 740–747. [Google Scholar] [CrossRef]
  19. Vujosevic, S.; Toma, C.; Villani, E.; Gatti, V.; Brambilla, M.; Muraca, A.; Ponziani, M.C.; Aimaretti, G.; Nuzzo, A.; Nucci, P.; et al. Early detection of microvascular changes in patients with diabetes mellitus without and with diabetic retinopaty: Comparison between different swept-source OCT-A Instruments. J. Diabetes. Res. 2019, 2019, 2547216. [Google Scholar] [CrossRef] [PubMed] [Green Version]
  20. Wilkins, G.R.; Houghton, O.M.; Oldenburg, A.L. Automated segmentation of intraretinal cystoid fluid in optical coherence tomography. IEEE Trans. Biomed. Eng. 2012, 59, 1109–1114. [Google Scholar] [CrossRef] [PubMed] [Green Version]
  21. Gonzalez, A.; Remeseiro, B.; Ortega, M.; Penedo, M.G.; Charlon, P. Automatic cyst detection in OCT retinal images combining region flooding and texture analysis. In Proceedings of the CBMS 2013—26th IEEE International Symposium on Computer-Based Medical Systems, Porto, Portugal, 20–22 June 2013; pp. 397–400. [Google Scholar]
  22. Gopinath, K.; Sivaswamy, J. Segmentation of Retinal Cysts from Optical Coherence Tomography Volumes Via Selective Enhancement. IEEE J. Biomed. Heal. Informatics 2019, 23, 273–282. [Google Scholar] [CrossRef] [PubMed] [Green Version]
  23. Kashani, A.H.; Green, K.M.; Kwon, J.; Chu, Z.; Zhang, Q.; Wang, R.K.; Garrity, S.; Sarraf, D.; Rebhun, C.B.; Waheed, N.K.; et al. Suspended Scattering Particles in Motion: A Novel Feature of OCT Angiography in Exudative Maculopathies. Ophthalmol. Retin. 2018, 2, 694–702. [Google Scholar] [CrossRef] [PubMed]
  24. Parravano, M.; Costanzo, E.; Borrelli, E.; Sacconi, R.; Virgili, G.; Sadda, S.V.R.; Scarinci, F.; Varano, M.; Bandello, F.; Querques, G. Appearance of cysts and capillary non perfusion areas in diabetic macular edema using two different OCTA devices. Sci. Rep. 2020, 10, 1–9. [Google Scholar] [CrossRef] [PubMed]
  25. Zhang, Q.; Zheng, F.; Motulsky, E.H.; Gregori, G.; Chu, Z.; Chen, C.L.; Li, C.; De Sisternes, L.; Durbin, M.; Rosenfeld, P.J.; et al. A novel strategy for quantifying choriocapillaris flow voids using swept-source OCT angiography. Investig. Ophthalmol. Vis. Sci. 2018, 59, 203–211. [Google Scholar] [CrossRef] [PubMed] [Green Version]
Figure 1. 3 mm × 3 mm OCT-A images of the left eye of a patient with center-involving CME. (A) Original enface flow SCP image and (B) corresponding enface structural image; (C) Original enface flow DCP image and (D) corresponding enface structural image. OCT-A = optical coherence tomography angiography; CME = cystoid macular edema; SCP/DCP = superficial/deep capillary plexus.
Applsci 10 03994 g001
Figure 2. Example of two enface structural and two enface flow SCP and DCP images. (A) SCP image containing only cysts. (B) DCP image containing both cysts and a motion artifact. The biggest cysts are highlighted by blue boxes, while the motion artifact by a red box. (C) enface flow image corresponding to the enface structural image A. (D) enface flow image corresponding to the enface structural image B.
Applsci 10 03994 g002
Figure 3. Inputs and outputs of the first two phases. (A) An image containing only cysts. (B) The resulting binarized images after erosion and dilation. (C) An image containing both cysts and a motion artifact. (D) The resulting binarized image after erosion and dilation.
Applsci 10 03994 g003
Figure 4. Edges of the motion artifact detected through the proposed method. The lines obtained with the proposed thresholding method are highlighted in green.
Applsci 10 03994 g004
Figure 5. ROC curve for the proposed method.
Applsci 10 03994 g005
Figure 6. Enface structural OCT-A images with the edges found by the proposed method highlighted. In the third image from the left in the second row, it is possible to see that the motion artifact is not detected as cyst margins.
Applsci 10 03994 g006
Table 1. Performance of the proposed method.
IndexValue [%]
J ( A , B ) 98.97
S e n s i t i v i t y 99.49
S p e c i f i c i t y 90.64
A c c u r a c y 99.62
P r e c i s i o n 99.47
F 1 s c o r e 99.48

