Article

Retrofit Fatigue Cracked Diaphragm Cutouts Using Improved Geometry in Orthotropic Steel Decks

1
School of Civil Engineering, Changsha University of Science & Technology, Changsha 410114, China
2
Institute for Infrastructure and Environment, Heriot-Watt University, Edinburgh EH10 4NZ, UK
3
Civil Engineering and Geosciences, Delft University and Technology, 2600 AA Delft, The Netherlands
*
Authors to whom correspondence should be addressed.
Appl. Sci. 2020, 10(11), 3983; https://doi.org/10.3390/app10113983
Submission received: 11 April 2020 / Revised: 31 May 2020 / Accepted: 3 June 2020 / Published: 8 June 2020
(This article belongs to the Section Civil Engineering)

Abstract

:
Diaphragm cutouts are set to release redundant constraints and hence reduce weld fatigue at the connection of U-ribs to diaphragms in orthotropic steel decks. However, most fatigue cracks which originate from the edge of cutouts are in fact detected in the diaphragms. Therefore, a retrofit technology on cracked cutouts at the diaphragm is proposed and applied to the orthotropic steel box girder of a suspension bridge. Firstly, the stress concentration on the cutout is analyzed through refined finite element analyses. Furthermore, the fatigue cracked cutouts are retrofitted by changing their geometrical parameters. Thereafter, an optimized geometry and the size of diaphragm cutouts were confirmed and applied in the rehabilitation of a suspension bridge. On-site wheel load tests were carried out before and after retrofitting of the diaphragm cutout. The stress distributions along the edges of the cutouts and at the side of a diaphragm were measured under a moving vehicle. The stress spectra at two critical locations on the edge of a cutout was obtained under longitudinally and laterally moving vehicles. Finally, the fatigue life of the cutouts is assessed by the modified nominal stress method. The analytical and test results indicate that the wheel loads on the deck transmit stress to the diaphragms through the U-ribs, during the load transmission process, the stress flow is obstructed by diaphragm cutouts, resulting in local stress concentrations around the cutouts. In addition, the overall size of the cutouts should be small, but the radius of the transition arc should be large, thus the stress flow will not be obviously obstructed. After the retrofitting of the cutouts by improved geometry, the maximum stress decreases by 87.6 MPa, which is about 40% of the original stress. The equivalent constant amplitude stress is reduced by 55.2% when the lateral position of the wheel loads is taken into consideration. Based on the stresses obtained by finite element analysis (FEA) and experimental tests, the fatigue lives of the original cutouts are 1.7 and 4.9 years, respectively, which increase to 78.1 and 155.5 years, respectively, after the cutouts were retrofitted, which indicates that the improved geometry and retrofit technology can enhance the fatigue performance and extend the fatigue life of diaphragm cutouts with fatigue cracks.

1. Introduction

Orthotropic steel decks (OSDs) are widely used in cable supported bridges and girder bridges due to their light weight and the short onsite construction time [1,2,3]. However, several types of fatigue cracks occur at the edges of added holes and at welded joints in OSD bridges [4,5,6]. In particular, the types of cracks that originate from the edges of diaphragm cutouts at the connections of U-ribs to diaphragms account for 42.3% to 85.5% of the total number of fatigue cracks in OSDs [4,5,6,7,8,9,10]. The lack of timely and essential retrofits causes these cracks to elongate and propagate throughout the entire diaphragm, which decreases the serviceability of OSDs, and hence reduces the service life and safety of these bridges.
Conventional repair and retrofit technology of fatigue damages in steel structures include the stop-hole method [11,12,13], weld repair method [14,15,16], reinforcement with steel/carbon fiber reinforced polymer(CFRP) plates method [17,18,19,20,21], concrete overlay methodology [22], etc. These methods are common in fatigue reinforcement engineering projects of OSDs. However, removing short cracks by enlarging and optimizing the geometry of the cutout is a fast and effective method of mitigating fatigue damage; such a process excises short cracks around diaphragm cutouts and simultaneously reduces stress concentrations [7,23]. In addition, partial or complete removal of long fatigue cracks around diaphragm cutouts is often necessary before diaphragm rehabilitation by bolting or bonding with steel plates near the cutouts. Therefore, the geometry of diaphragm cutouts is very important for effective fatigue repair.
The effectiveness of fatigue retrofits of diaphragm cutouts is often determined by the maximum concentration stress [23,24,25]. The cycling stresses and the magnitudes of stress amplitude lead to fatigue failure [26,27,28,29], which is also reflected in the “safe life” design [30,31,32]. It has been incorporated in the AASHTO LRFD code (AASHTO 2017), Eurocode 3 (“Design of steel structures”), and other specifications, where the S-N curve and similar algorithm of diaphragm cutouts are given based on nominal stress or hot spot stress [33,34]. Another local stress method, named the effective notch stress approach, is adopted in the recommendations of the international institute of welding (IIW) as an alternative method.
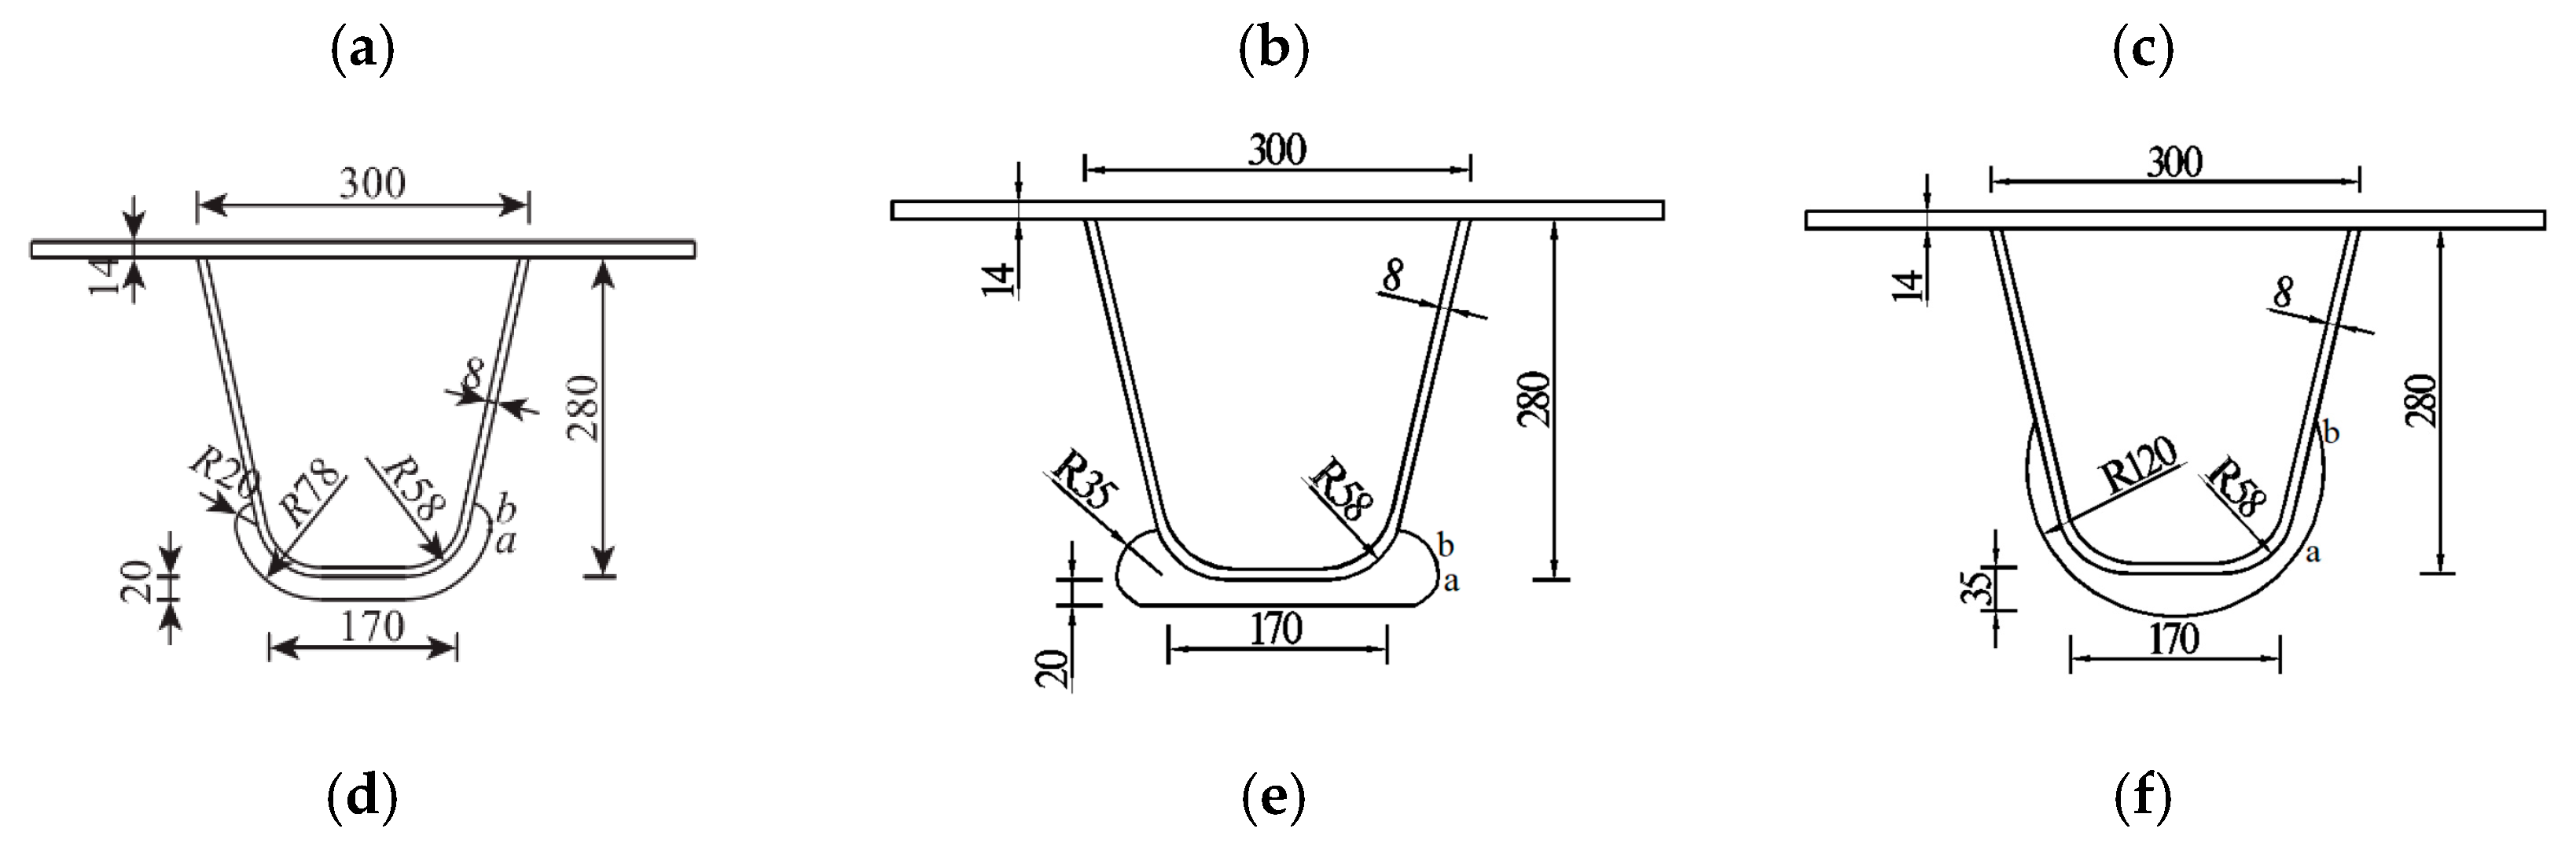
To improve the fatigue life of diaphragm cutouts, several normative documents and experiences suggest some typical cutout geometries for newly built bridges. Six typical diaphragm cutouts are shown in Figure 1 that include the cutout in highway bridge (Type I) and cutout in railway bridge (Type II) in Eurocode 3, AASHTO cutout (Type III), Japanese standard cutout (Type IV), the cutouts used in the Williamsburg bridge in US and the Humen bridge in China (Type V), and the large radius cutout (Type VI). Comparative studies have been carried out for these typical cutout geometries. In these studies, the rib spacing is often set constant at 600 mm, which is the most commonly-used value. The values of the upper width of the U rib and the depth are often 300 and 280 mm, respectively. The deck plate and rib thicknesses were taken into consideration in some research, but the results showed that the above parameters have a slight influence. Several typical diaphragm cutouts have been studied to compare their stress state. They found that the stress concentration regions are located at the free edges of diaphragm cutouts, and the geometry and size of diaphragm cutouts are vital parameters affecting the maximum principal stress [35,36]. Ju et al. [37] investigated the effect of the diaphragm cutout height on the stress distribution and the max-principal stress of typical diaphragm cutouts. Furthermore, the cutout radius, diaphragm thickness, and the position of longitudinal ribs were taken into consideration, which affect the stress distribution and concentration around the diaphragm cutouts, due to the effects of bending and shearing, in-plane supports, asymmetrical loading, and relative longitudinal deformations [38,39]. Based on studies conducted with cutout types (I), (II), (III), and (V), in which the spacing and thickness of diaphragms were taken into consideration, it was concluded that the design of the geometric dimensions of diaphragm cutouts has a great influence on the fatigue performance of the diaphragms [40,41,42]. However, previous studies were only limited to typical diaphragm cutouts in newly built bridges. Little research has been conducted on the retrofitting of diaphragm cutouts in as-built bridges that have developed fatigue cracks using atypical geometries.
Diaphragm cutout retrofitting in as-built bridges should consider the geometry of the original shape, and the improved geometries generally are not the typical cutout type recommended by the related specifications. When changing the shape of diaphragm cutouts by cutting and grinding methods, the maximum stress of the diaphragm cutouts with a radius of 35 mm was reduced by 54.6% [5]. Another scheme shows that based on the crack length, the fatigue stress can be reduced by 20–29% if the cracks were cut using a combination of straight and arc sections [42]. In these above methods, stress reduction differs mainly because of the different cutting shapes used for the fatigue cracks in diaphragm cutouts. Given that the cutout geometry used to repair as-built bridges is different from that in newly built bridges, the retrofitting mechanisms and the actual effects of cutout repairs need to be analyzed and verified.
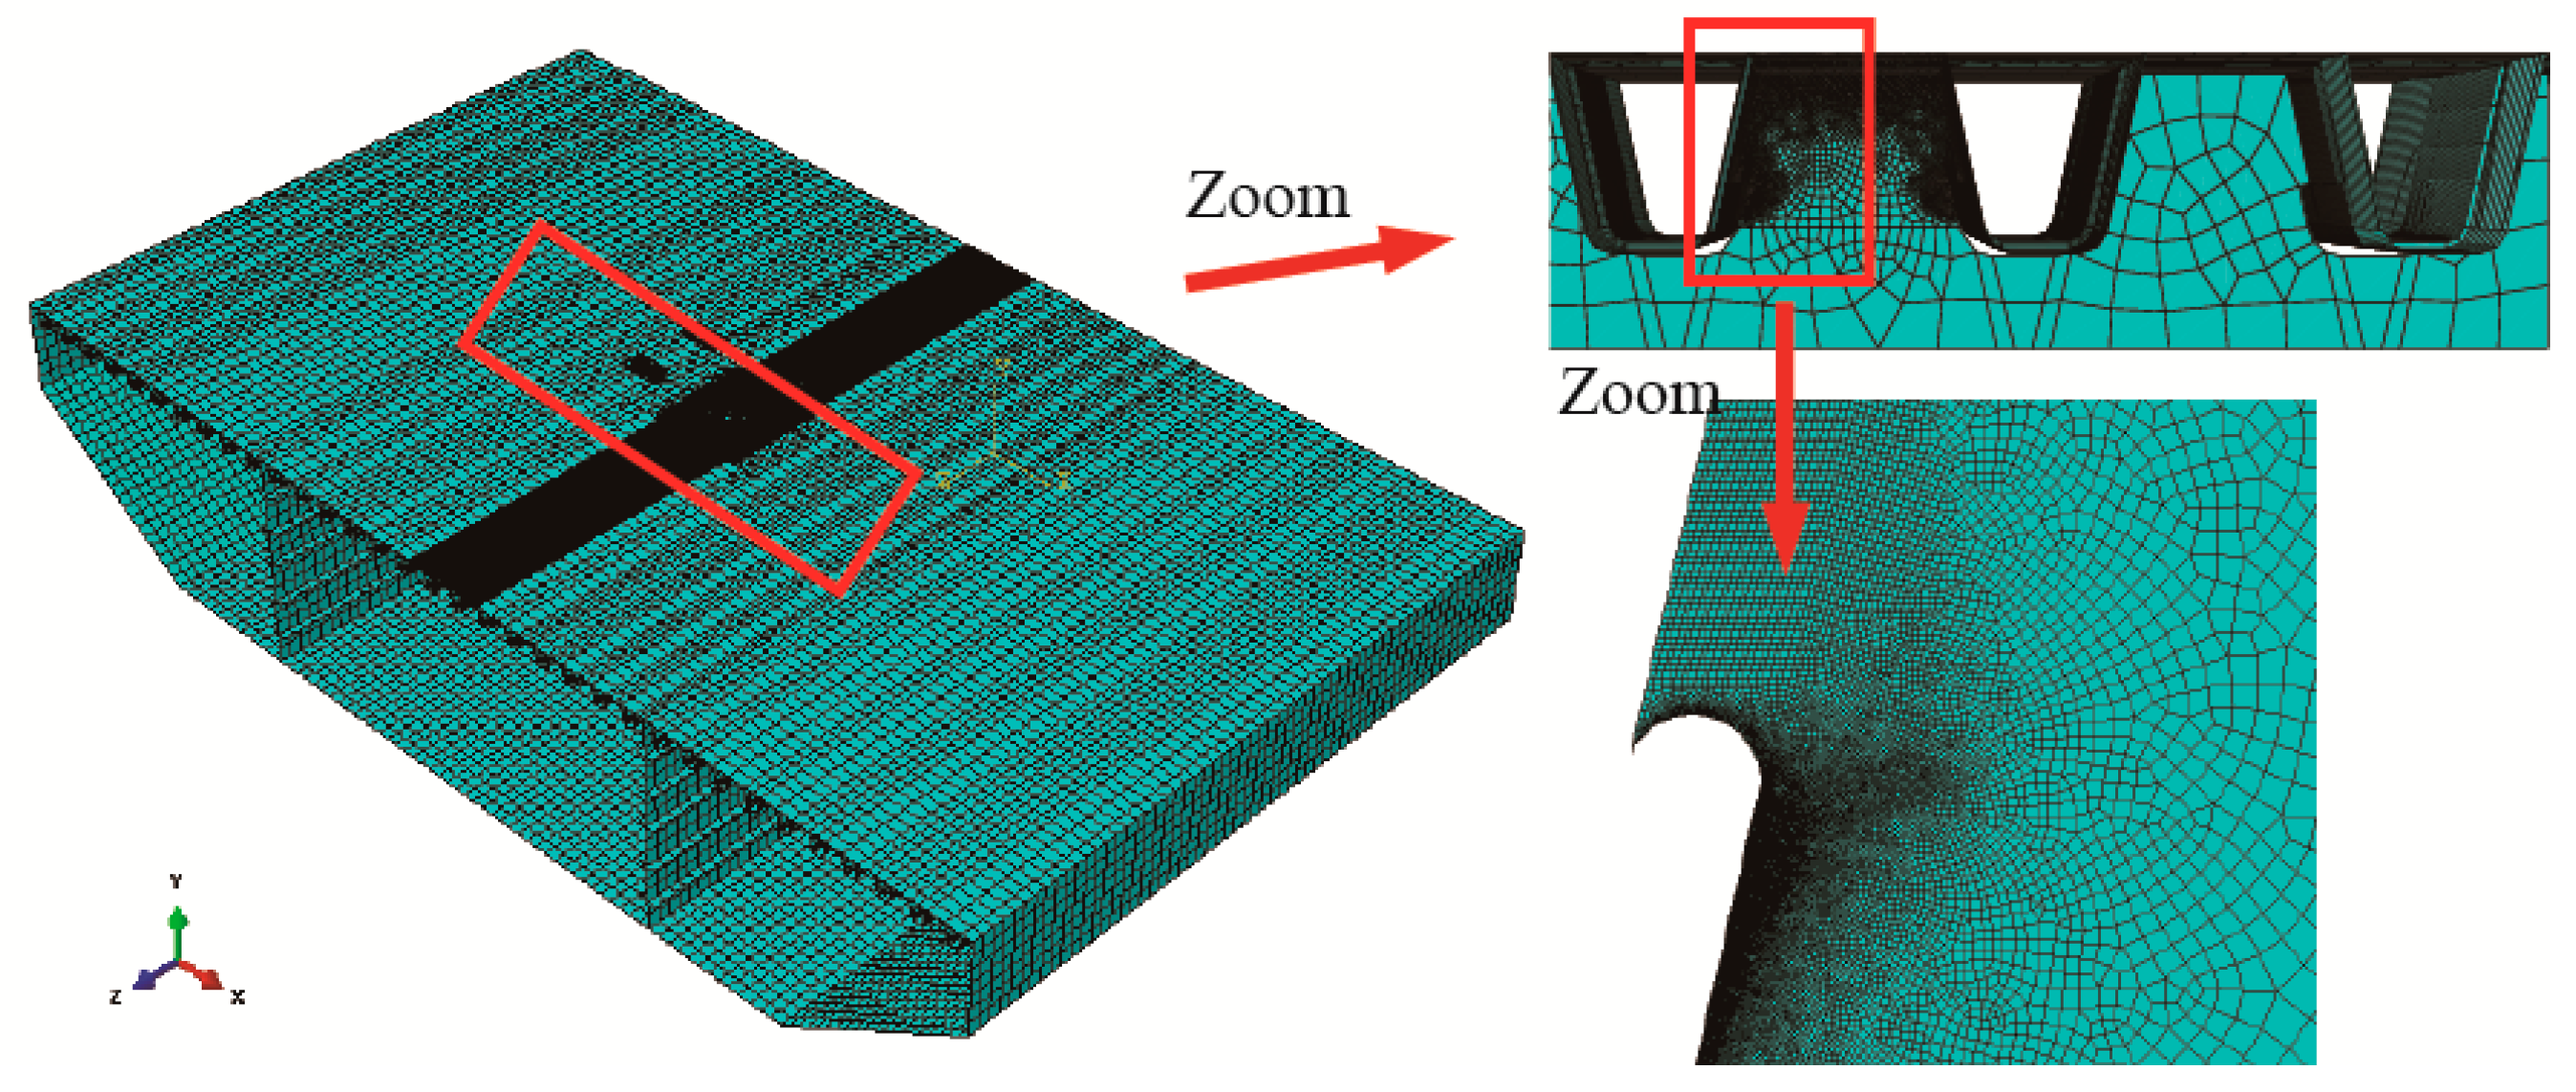
This paper explores the stress concentration mechanisms around diaphragm cutouts using stress flow methods, based on an OSD in a suspension bridge that had developed fatigue cracks during its service period, after nine years of operation. Thereafter, some principles of optimization and retrofitting strategies of diaphragm cutouts were proposed to reduce stress concentration and eliminate short fatigue cracks. Repair schemes were designed on the basis of these optimization principles, and were carried out at a test segment of OSD with a length of 30 m in this bridge. Wheel loads were applied with standard trucks and stresses were measured during loading test on this bridge. The stress state on the original and retrofitted diaphragm cutouts were compared and analyzed. The retrofitting mechanisms and experimental data presented in this study can provide reference in the rehabilitation of OSDs with diaphragm cutout cracks.

2. Outline of Retrofitted Bridge

2.1. Fatigue Cracks around Diaphragm Cutouts

A self-anchored suspension bridge opened to traffic in December 2006, having an overall length of 680 m and a main span of 350 m. Steel box girders with OSDs were used in this suspension bridge to reduce weight and enhance stability. Figure 2 shows a cross section of OSD box girder with five traffic lanes. The spacing between the transverse diaphragms are 3.0 m, and the thickness of the diaphragms is 10 mm, except for the diaphragms at the hangers is 12.0 mm.
The U-ribs run through each diaphragm, and cutouts are made at the cross position on the diaphragm. The radius of the diaphragm cutout is 10.0 mm; the arc segment connects with the U-rib. A conventional structure and size was used at the connection of each U-rib to the diaphragm, such that the spacing between the U-ribs is 600 mm, the width of the upper U-ribs is 300 mm, the width of the lower bottom plate is 170 mm, the height of U-ribs is 280 mm, the thickness of the U-ribs is 8 mm, and the radius of the internal arc between the web and the lower bottom plate is 5 t, where t is the thickness of U-rib. The details of U-ribs and cutout on diaphragm are shown in Figure 3a.
The detection of the cracks was performed on the OSD at anywhere of the whole bridge by manual inspection, especially focus on the potential cracking position, such as diaphragm cutouts, connection between U-rib and top plate, and so on. In 2015, 141 fatigue cracks were detected around the diaphragm cutouts in this bridge by manual inspection. Among them, there are 20 weld fatigue cracks originating from the connections of diaphragm and U-ribs, and another 121 parent material fatigue cracks originate from the free edges of the diaphragm cutouts. The number of fatigue cracks in free edges account for 85.8% of the total number, and is much more than other locations, and hence need effective rehabilitation. These cracks originated at the intersections of the arc segments (r = 10 mm) and the straight segments of the diaphragm cutouts, as shown in Figure 3b. The length, inclination and position of such cracks are shown in Figure 3a, and the corresponding data are listed in Table 1.

2.2. Repair Schemes for Diaphragm Cutout Cracks

According to the fatigue condition around the diaphragm cutouts, several research and design companies jointly proposed four types of repair schemes. Scheme 1: for diaphragms without cracks and with the crack lengths less than 25 mm, the method of thermal cutting combined with edge-corner grinding can be adopted to optimize the shapes of the diaphragm cutouts, thus to remove cracks and reduce stress intensity factors simultaneously, as shown in Figure 4a. Different types of thermal cutting methodology, such as flame cutting and plasma cutting, used in crack repair engineering will result in different defects on surface and residual stresses, so a mini-type plasma cutting machine was used in this rehabilitation engineering to reduce its effect. Scheme 2: for diaphragms with crack lengths greater than 25 mm, larger cutout geometries combining straight and arc segment have been suggested to remove cracks and enhance fatigue resistance, as shown in Figure 4b. Scheme 3: for diaphragm sections whose area is excessively weakened, steel plates can be added for reinforcement, as shown in Figure 4c. Scheme 4: when considering the differences in crack lengths and inclination, it is recommended that the cutouts should be optimized on the basis of the shape in scheme 1, and then steel plates are added for reinforcement, as shown in Figure 4d.

3. Geometry Optimization

3.1. Diaphragm Cutout Stress Concentration

An finite element analysis (FEA) model was created using the software ABAQUS (V6.13) to calculate the stresses of a steel box girder between two adjacent hangers with a length of 12.0 m, width of 20.4 m, and a height of 3.5 m. The thickness of the deck, U-rib and diaphragm are 16, 8 and 10 mm, respectively. Shell elements are used to model the steel box girder including all components, such as OSDs, diaphragms, webs and so on. The quadrilateral shell element (S4R) is used to enhance computational accuracy and reduce calculation time. Due to the large stress gradients around the diaphragm cutouts, the mesh size of the shell element is refined to 0.2 mm around the cutouts; the element size in other location is 0.3 m. The length-width ratio and distortion of shell elements are checked by the ABAQUS software to ensure mesh quality and accuracy of calculations. The finite element model is shown in Figure 5.
Some assumptions of the finite element analysis need to be emphasized: (1) the effects of geometric and material nonlinearities are ignored; (2) the hangers on the steel box girder are simplified as rigid supports without considering the effects of elastic and plastic deformations; (3) the effects of residual stresses around cutouts that result from the welded joints between the U-rib and the diaphragm are considered to be small and not considered, since the initiation of the fatigue cracks is located relatively far from the welds; (4) the permanent load or internal residual stresses due to hyperstatic behavior will result in permanent stress in OSD, especially at the weld joints. These permanent stresses will change the R ratio of stress spectrums and hence affect their fatigue lives. In this paper, we ignore the influence of these two effects and just focus on the stress range of different diaphragm cutouts due to standard fatigue vehicle. Except for the above assumptions, the calculations presented in this paper conform to the scope of EN 1993-1-9 in Eurocode 3 (“Design of steel structures”).
The stress range and fatigue life of cutouts were obtained from the fatigue loading mode III in Eurocode 3. However, the axial weights of middle and rear axles were increased to 140 kN in loading tests and in FEA, to account for the influence of overloading in actual traffic. The contact length and width of the wheel load are 0.3 and 0.7 m in the longitudinal and transversal directions, respectively. Figure 6 presents the relative position between the axles (wheel load locations) and the diaphragm, at which the maximum stress at the edge of diaphragm cutout was obtained by finite element analysis. Therefore, the load case where the middle and rear axles are located on either side of the diaphragm is deemed to be the most unfavorable.
The stress contour at the diaphragm cutout under the most unfavorable load case, calculated by FEA, is shown in Figure 7. Two stress concentration areas appear at the edge of the diaphragm cutout, which are marked as zone A and zone B. The maximum Mises stress at zone A is 154.2 MPa, and the maximum value of the principal compressive stress in this zone is minus 155.9 MPa. An on-site inspection of the bridge showed that all the fatigue cracks of the diaphragm were initiated from these zones, and that is in good agreement with the calculated results. Due to the stress concentration in zone A, where the stress is obviously larger than that in other areas, the corresponding large stresses result in fatigue cracks. It should be emphasized that although the principal compressive stress rarely causes fatigue cracks per the theory of linear-elastic fracture mechanics. However, the residual tensile stress from thermal cutting makes such cracks possible; furthermore, out-of-plane deformations and distortions of the diaphragm cutout accelerates the process of fatigue initiation and propagation. Therefore, to enhance the fatigue life for diaphragms with cutouts, the goal is to reduce the stress concentration in zone A.

3.2. Discussion on Stress Concentrations

To reduce the stress concentration in zone A of the diaphragm, a stress flow method is used. According to stress flow theory, there are certain criteria for drawing the paths of stress flows. Firstly, stress flows do not disappear in a mechanical system due to obstructions, which, in fact, lead to stress flow concentrations. Secondly, stress flows tend to follow the shortest paths and the second derivative of these paths is continuous. When the direction of stress flow turns sharply, the stress flow becomes highly dense at the corner, as shown in Figure 8, which results in concentrated stress.
The vectors of the major principal stresses are shown in Figure 9a, under the most unfavorable wheel load case on OSDs. Since the stress concentration is in zone A, the vectors of the major principal stresses are concentrated around the diaphragm cutout; the vector direction near the U-rib is 45° and is tangential to the arc near the cutout. The transmission path and direction of stress flow can be described as follows: the wheel load acting on the bridge deck is mainly transmitted to the diaphragm in the form of shear stress through the U-rib, as displayed by the black arrows in Figure 9b. The process of the local stress flow diffusion at the diaphragm cutout is blocked due to the cutout, and as a consequence, the stress flow follows the principles of shortest path, resulting in a high stress concentration, at the diaphragm cutout, as shown in Figure 9b.
Through the above stress flow analysis, the methods of reducing the stress concentration effect in zone A of the diaphragm cutout are suggested as follows: (1) reduce the obstruction to stress flow by the diaphragm cutout under wheel loads, and (2) diminish the directional change of stress flow around the diaphragm cutout. Therefore, more research needs to be conducted to optimize the geometry of diaphragm cutouts to reduce the stress flow concentration, which includes the optimization of the arc radius, the length of the straight segment, and the inclination angle of the straight segment.

3.3. Optimization of Diaphragm Cutouts with Fatigue Cracks

The cutout geometry can be represented by three parameters r, l and β, as shown in Figure 10, where, r is the radius of the upper arc segment, l is the length of the upper line segment that connects the upper arc segment to the U-rib, and β is the inclined angle between the upper line segment and the x-axis; the inclined angle is positive when it is in the first quadrant, and is negative when it is in the fourth quadrant. The entire geometrical shape of the cutout is also affected by the geometries of several other parts, such as the lower arc segment and the lower line segment. However, they have little effect on the stresses at the critical locations of the diaphragm.
The finite element model depicted in Figure 5 and the most unfavorable load case were used to calculate and analyze the concentrated stress in the diaphragm cutout area, with different parameters r, l and β. Zone A is located at the edge of the diaphragm cutout, which is a planar structure, and hence the direction of the major principal stress is tangential to the arc, while the other two principal stresses are very small. Therefore, geometry optimization was carried out based on the major principal stresses reported in this paper.
When the straight-line length l = 10 mm and the included angle β = 0°, the arc radius r increases from 10 to 40 mm, and the major principal stresses at zone A decrease with an increase in the diaphragm cutout radius, as shown in Figure 11a. The principal stress increased obviously when the arc radius is small, as radius increasing, the reduction degree gradually decreased. Due to the increase in the arc radius, the stress concentration effect is weakened, which is beneficial in improving the fatigue life of the diaphragm cutout. Therefore, the larger the arc radius, the better it is for reducing stress concentrations, and it is recommended that the arc radius should be not less than 30 mm.
When the arc radius r = 30 mm and the included angle β = 0°, an increase in the straight segment l from 10 to 40 mm causes a linear increase in the major principal stresses of zone A, as shown in Figure 11b. When the radius of the cutout arc is maintained constant, the hole of the cutout becomes larger due to the elongation of the straight section, which in turn obstructs the diffusion of the stress flow near the cutout and leads to an increase in the major principal stresses. Therefore, it is not suitable to set the straight-line segment at the upper cutouts, and smaller diaphragm cutouts are more favorable.
When the straight line l = 20 mm and the arc radius r = 30 mm, the increase in peak stresses are accelerated as the inclined angle of the line segment increases from −60° to 0 as shown in Figure 11c. Since the radius of the diaphragm cutout is constant, the stress concentration effects are approximately equal, and the increase of the peak stresses are mainly caused by the obstruction of stress flows due to the different included angles. The direction of transmission of the stress flows are inclined downwards, as shown in Figure 9b. Therefore, the included angle of the straight segment should be less than 0°.
In conclusion, the geometry optimization principles of diaphragm cutouts can be summarized as follows: (1) the radius r of diaphragm cutouts should be large; (2) the geometrical size of diaphragm cutouts should be small; and (3) the included angle of U-ribs should be small (a negative value is considered small). In other words, the shape of the cutouts should avoid obstructing the stress flows.

4. Retrofitting and Loading Test

4.1. Diaphragm Cutout Retrofit in Suspension Bridge

Fatigue crack rehabilitation was carried out on this suspension bridge, and diaphragm cutout retrofit technology was adopted to repair the cutouts with fatigue cracks in the OSDs. For diaphragms without cracks or with cracks whose length is less than 25 mm, the scheme of hot cutting combined with corner grinding was adopted to optimize the shape of the diaphragm cutouts by cutting off short cracks, hence improving the fatigue behavior. According to principle 1, for diaphragms with cracks whose length is less than 25 mm, the arc radius was optimized as 35 mm. In addition, according to principle 2, no straight-line segments were set. In order to avoid cutting the original welds, the angles could only be maintained at the original angle of 60° (principle 3 could not be satisfied). The original and retrofitted diaphragm cutouts are shown in Figure 12.

4.2. Wheel Loading

Wheel loading tests were carried out at 96# diaphragm and 105# diaphragm having a thickness of 10 mm, where it is susceptible to diaphragm fatigue damages. The 96# diaphragm did not show cracks, while the 105# diaphragm had 22 and 25 mm cracks between U-ribs 17# and 18#, respectively. The truck runs twice for the 96# diaphragm before retrofitting of cutouts and runs once for the 96# and 105# diaphragms after the cutouts are retrofitted. So, the stresses in these figures are the average value of the two loading tests.
The test truck has 3 axles, with the axle weight of 70, 140 and 140 kN for front-axle, middle-axle and rear axle respectively. The space between the middle-axle and rear axle is 1.35 m, and between the front-axle and middle-axle is 4.6 m. Only the static wheel load test was adapted, as it is hard to match the wheel location and the strain relatively under moving conditions.
To locate the wheel load on the deck, the total station was used to measure the distance between wheel locations, bridge suspenders and weld joints; and the wheel locations were marked, as shown in Figure 13. The test zone was between U-ribs 17#, 18# and 19#, where the diaphragm cutouts are marked as C1, C2 and C3, respectively, as shown in Figure 14a. When the test was carried out, two traffic lanes were kept in service and three traffic lanes were closed, to enable access to the experimental site, as shown in Figure 2.
Wheel load tests included a lateral loading program and a longitudinal loading program. The lateral loading program had 11 loading cases, as shown in Figure 14a. During the lateral movement, the longitudinal position of the rear axle was located at L4. In the longitudinal loading program, which included 17 loading cases, the experimental vehicle was moved across the diaphragms A, B, C and D successively, along the longitudinal direction, as shown in Figure 14b. During the longitudinal loading program, the lateral position of the left wheel load was located at the T5 position.
Before the rehabilitation and retrofit, wheel loads and stress tests were carried out twice at the 96# diaphragm to reduce test errors. After the retrofit was done, as shown in Figure 12, the cracks around the cutouts were removed and the cutout geometry was optimized in the 105# diaphragm. The wheel loads and stress tests were carried out at the 96# diaphragm and 105# diaphragm, respectively.

4.3. Stress Measurment

Strain gauges were bonded to the surface of the diaphragm and cutouts, details of the strain gauges arrangement are shown in Figure 15. The strain values of these measure points were obtained by TDS 530, and then the tested stresses ranges were calculated based on a linear elastic hypothesis. Unidirectional strain gauges of size 2 × 1 mm were used to measure the unidirectional stresses along the edges of the cutouts, and three-direction rosette gauges of size of 2 × 1 mm were selected to obtain the normal stresses and principal stresses along the profile of the diaphragm. Temperature compensation gauges were adhered to unstressed steel plates near the tested cutouts to measure the approximate temperature. The quality of the strain gauges was checked before the tests to ensure the accuracy of measurements. The strain gauge arrangement is described as follows:
(1) Cutout gauges: Strain gauges were arranged at the free edges of the cutouts C1, C2 and C3, at 5 critical locations, including zone A, zone B, the center of the oblique line, the lower arc of the cutout, and the symmetric center of cutout. Details of the strain gauges arrangement is shown in Figure 15a,b.
(2) Diaphragm gauges: Strain gauges were arranged on the side of the diaphragm near the C1 cutout, based on three characteristic lines, including the horizontal line at the arcing point, a line at the 45° direction located 5 mm from the arcing point, and a straight line parallel to the U-rib web at a distance of 10 mm, as shown in Figure 15c,d. The first row of strain gauges was installed 20 mm from the edge of the diaphragm cutout, and the second-row of strain gauges were installed 80 mm from the cutout edge. The locations of the strain gauges installed around the original cutout at the 96# diaphragm and the retrofitted cutout at 105# diaphragm are shown in Figure 15e,f.

5. Results and Discussion

5.1. Stress Distribution Along the Edge of Diaphragm Cutouts

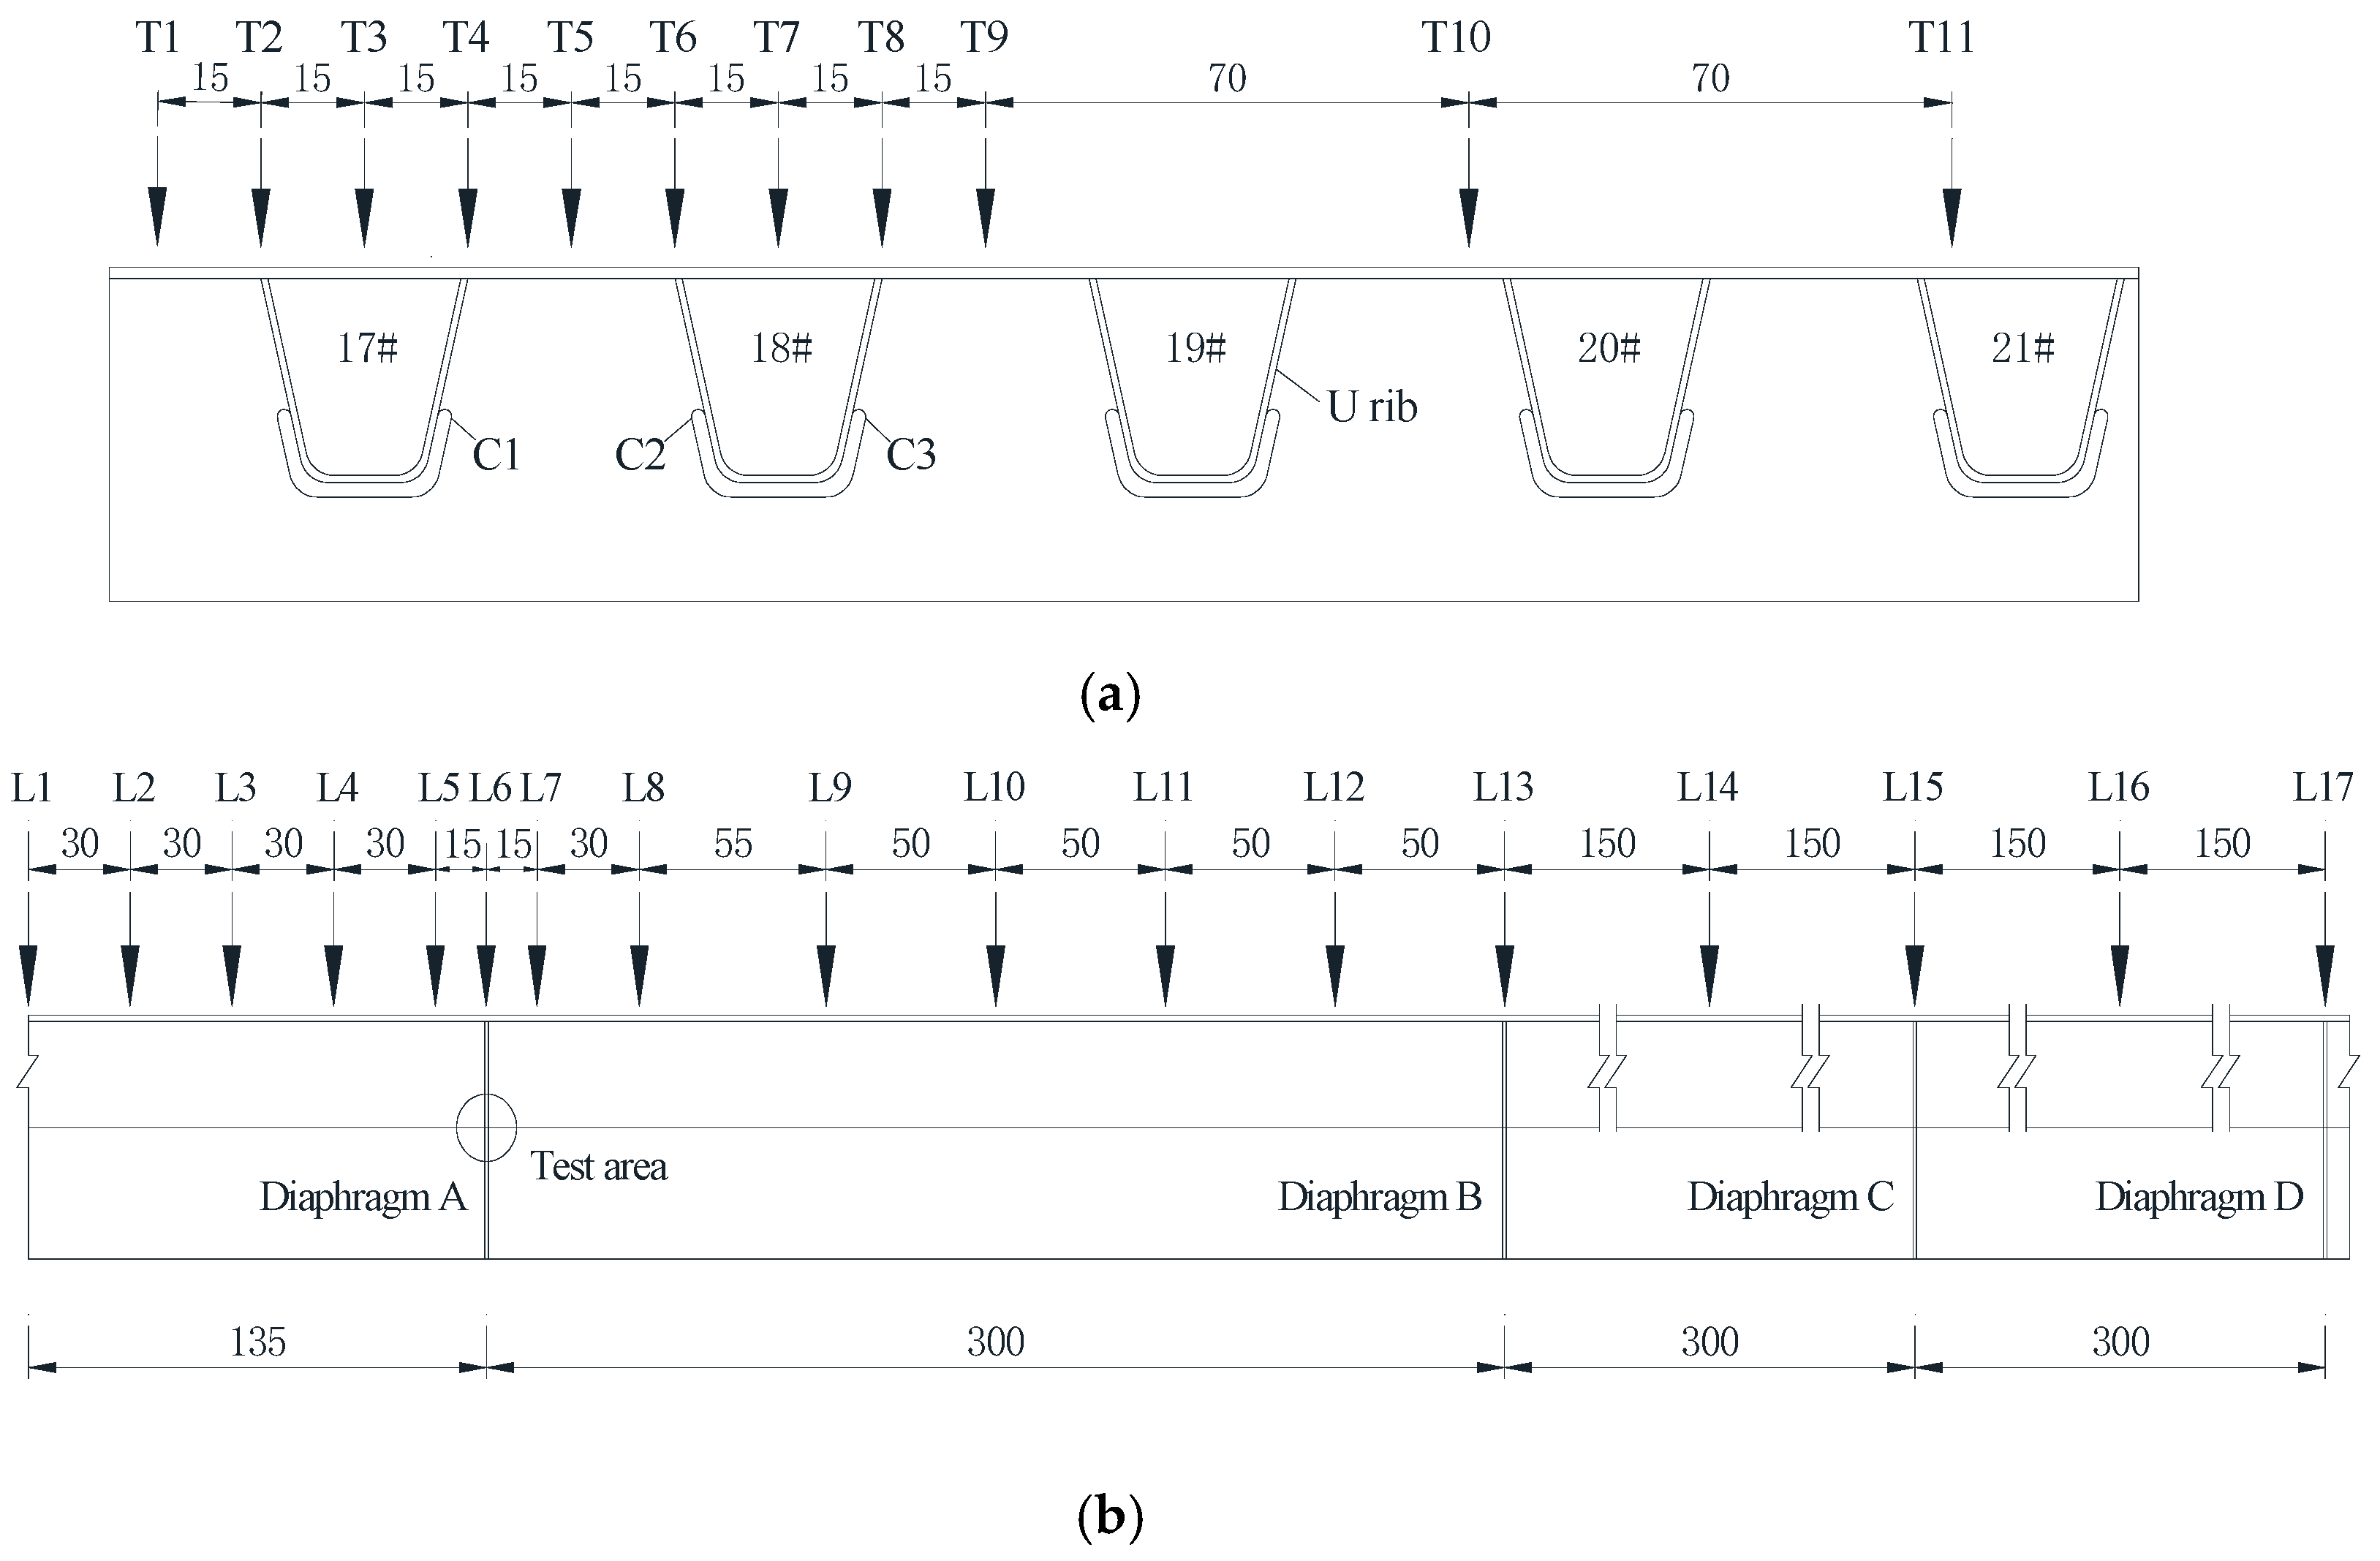
The test results of two typical longitudinal loading cases, at locations L3 and L10 in Figure 14b, are presented and analyzed to verify the effects of geometry optimization of cutouts and summarize the stress distributions along the edges of diaphragm cutouts. In the load case L3, the central axis and the rear axis were located on either side of the test diaphragm at equal spacing (0.75 m). The out-of-plane moment of the diaphragm is equal to zero, and the in-plane forces within the diaphragm are transmitted mainly from the U-ribs as shear forces. The maximum stress was recorded in zone A around the diaphragm cutout for this load case, and its stress distribution is shown in Figure 16. In the load case L10, the center of the rear axle is 1.5 m away from the diaphragm and is located midway between the two diaphragm plates. From the test and FEA results, it can be found that:
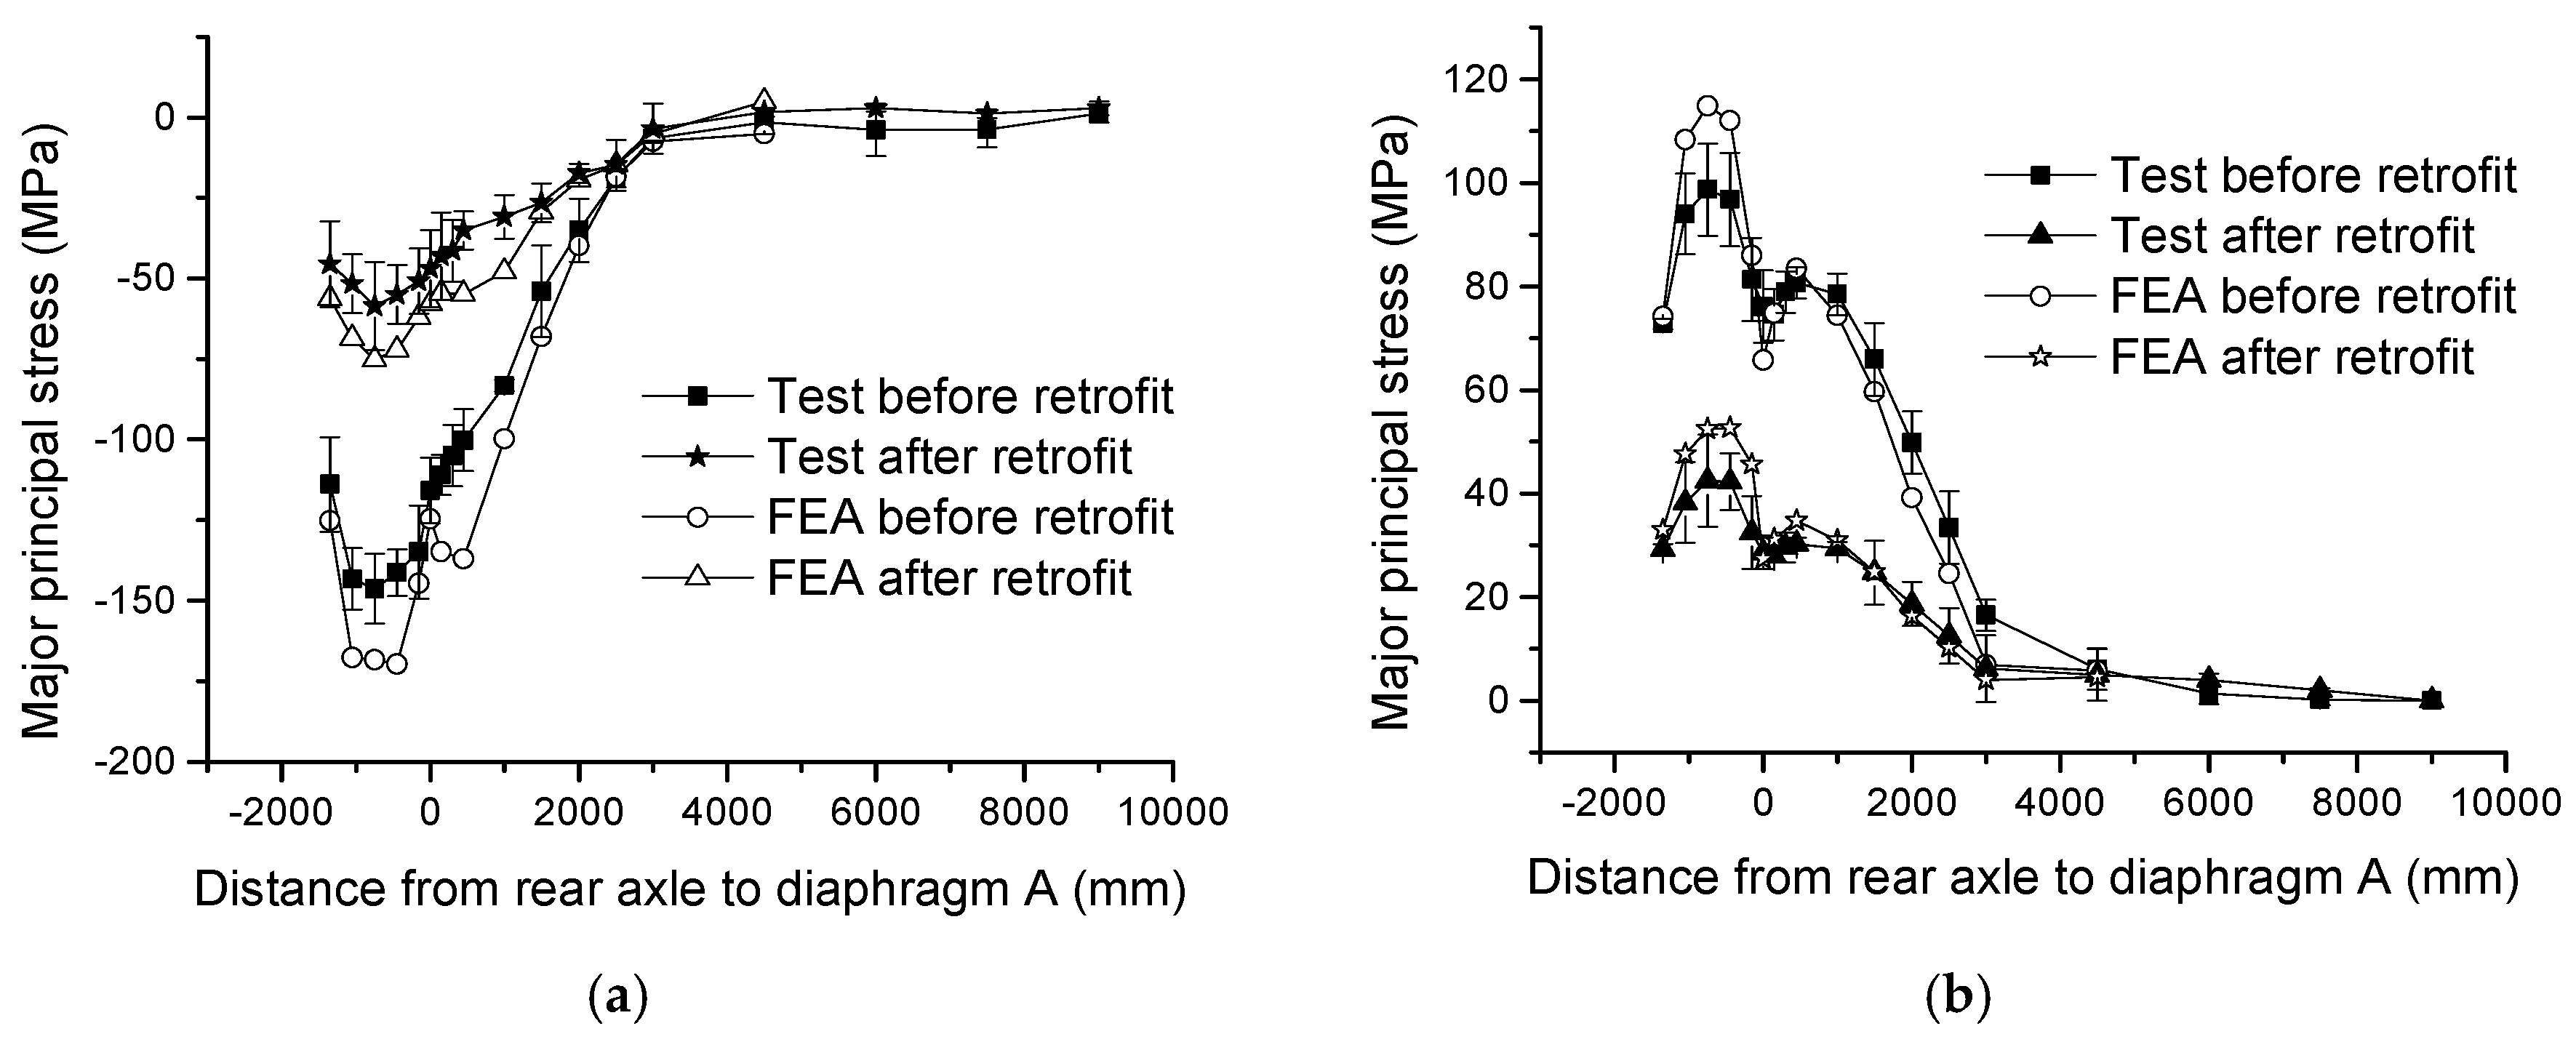
(1) The experimental data is in good agreement with the FEA results, in terms of the stress distributions. The experimental data from several stress gauges, such as those at locations 5 and 6, are less than the corresponding maximum stress in FEA, because the stress values obtained by strain gauges is the mean value over a strain gauge’s length of 2 mm. The comparison indicates that large stress concentrations occur under vehicular loads leading to fatigue cracks around diaphragm cutouts.
(2) The maximum principal stress measured in zone A, which is at cutouts C1 and C2, is –146.8 MPa for the load case L3, before the diaphragm cutout was retrofitted. The tested stress after retrofitting is −58.5 MPa, and the stress range is reduced by 59.9%. For the load case L10, the stress range decreases by 55.5%, as shown in Figure 16b, which indicates that the optimization of diaphragm cutouts can effectively reduce the stress range in zone A and hence improve fatigue life.
(3) The maximum tensile stress measured in zone B at cutouts C1 and C2 is 96.2 MPa before the retrofitting of the diaphragm cutout for the load case L3. The tested stress after retrofitting is minus 42.7 MPa, and the stress range is reduced by 55.6%. For the load case L10, the stress amplitude decreases by 47.4%, indicating that the optimization of diaphragm cutouts can also effectively reduce the stress range in zone B and improve fatigue life.
(4) The stress around cutout C3, which is 600 mm from cutout C1, is much smaller, because the influence of the wheel load in the transverse region is limited around the location of a U-rib. It is also observed that the stress reduction of zone A and zone B in cutout C3 is minus 35.2 MPa after retrofitting, which is about half the stress before retrofitting.
(5) Except for the gauges located in zone A and zone B, the gauges at other locations along the edge of diaphragm cutouts were less affected by cutout retrofitting; since the vehicular load induced stress is small at these locations the potential fatigue damage may not take place.

5.2. Stress Spectra due to a Longitudinally Moved Vehicle

The stress spectra of zone A and zone B for the standard vehicle tests are presented in Figure 17. The stresses in these figures are the average value and the error bars reflect the deviations from the average value.
(1) Under longitudinal wheel loading, the value of the maximum stress obtained from the tests is generally less than the FEA value, and the difference is less than 12.5%. Considering that it is difficult to experimentally capture the maximum stress at the locations of the strain gauges, the error is within an allowable range.
(2) For the longitudinal loading, the measured stresses in zone A are all compressive stresses. The maximum compressive stress measured before retrofit is 146.2 MPa with a measurement error of 10.8 MPa. In comparison, the maximum compressive stress measured after retrofit is 58.6 MPa with a measurement error of 13.6 MPa. The maximum reduction in stress is 87.6 MPa, at the location L3. The maximum stress reduction ratio is 58.4%, at the location L5.
(3) The measured stresses in zone B under various longitudinal movement conditions are tensile stresses. The maximum tensile stress measured before retrofit is 95.8 MPa with a measurement error of 8.6 MPa, while the maximum measured stress after retrofit is 42.4 MPa with a measurement error of 6.2 MPa. The maximum reduction in stress is 53.4 MPa, at the location L3. The maximum stress reduction ratio was 62.5%, at the location L11.
(4) The principal compressive stress is large, when the deck is subjected to the load cases L2, L3 and L4. For these cases, the central axis is located at the front of the diaphragm and the rear axis is located at the back of the diaphragm simultaneously. The wheel load does not directly act on the upper part of the diaphragm. Because the wheel load acting on the bridge deck is mainly transmitted to the diaphragm through the U-ribs.

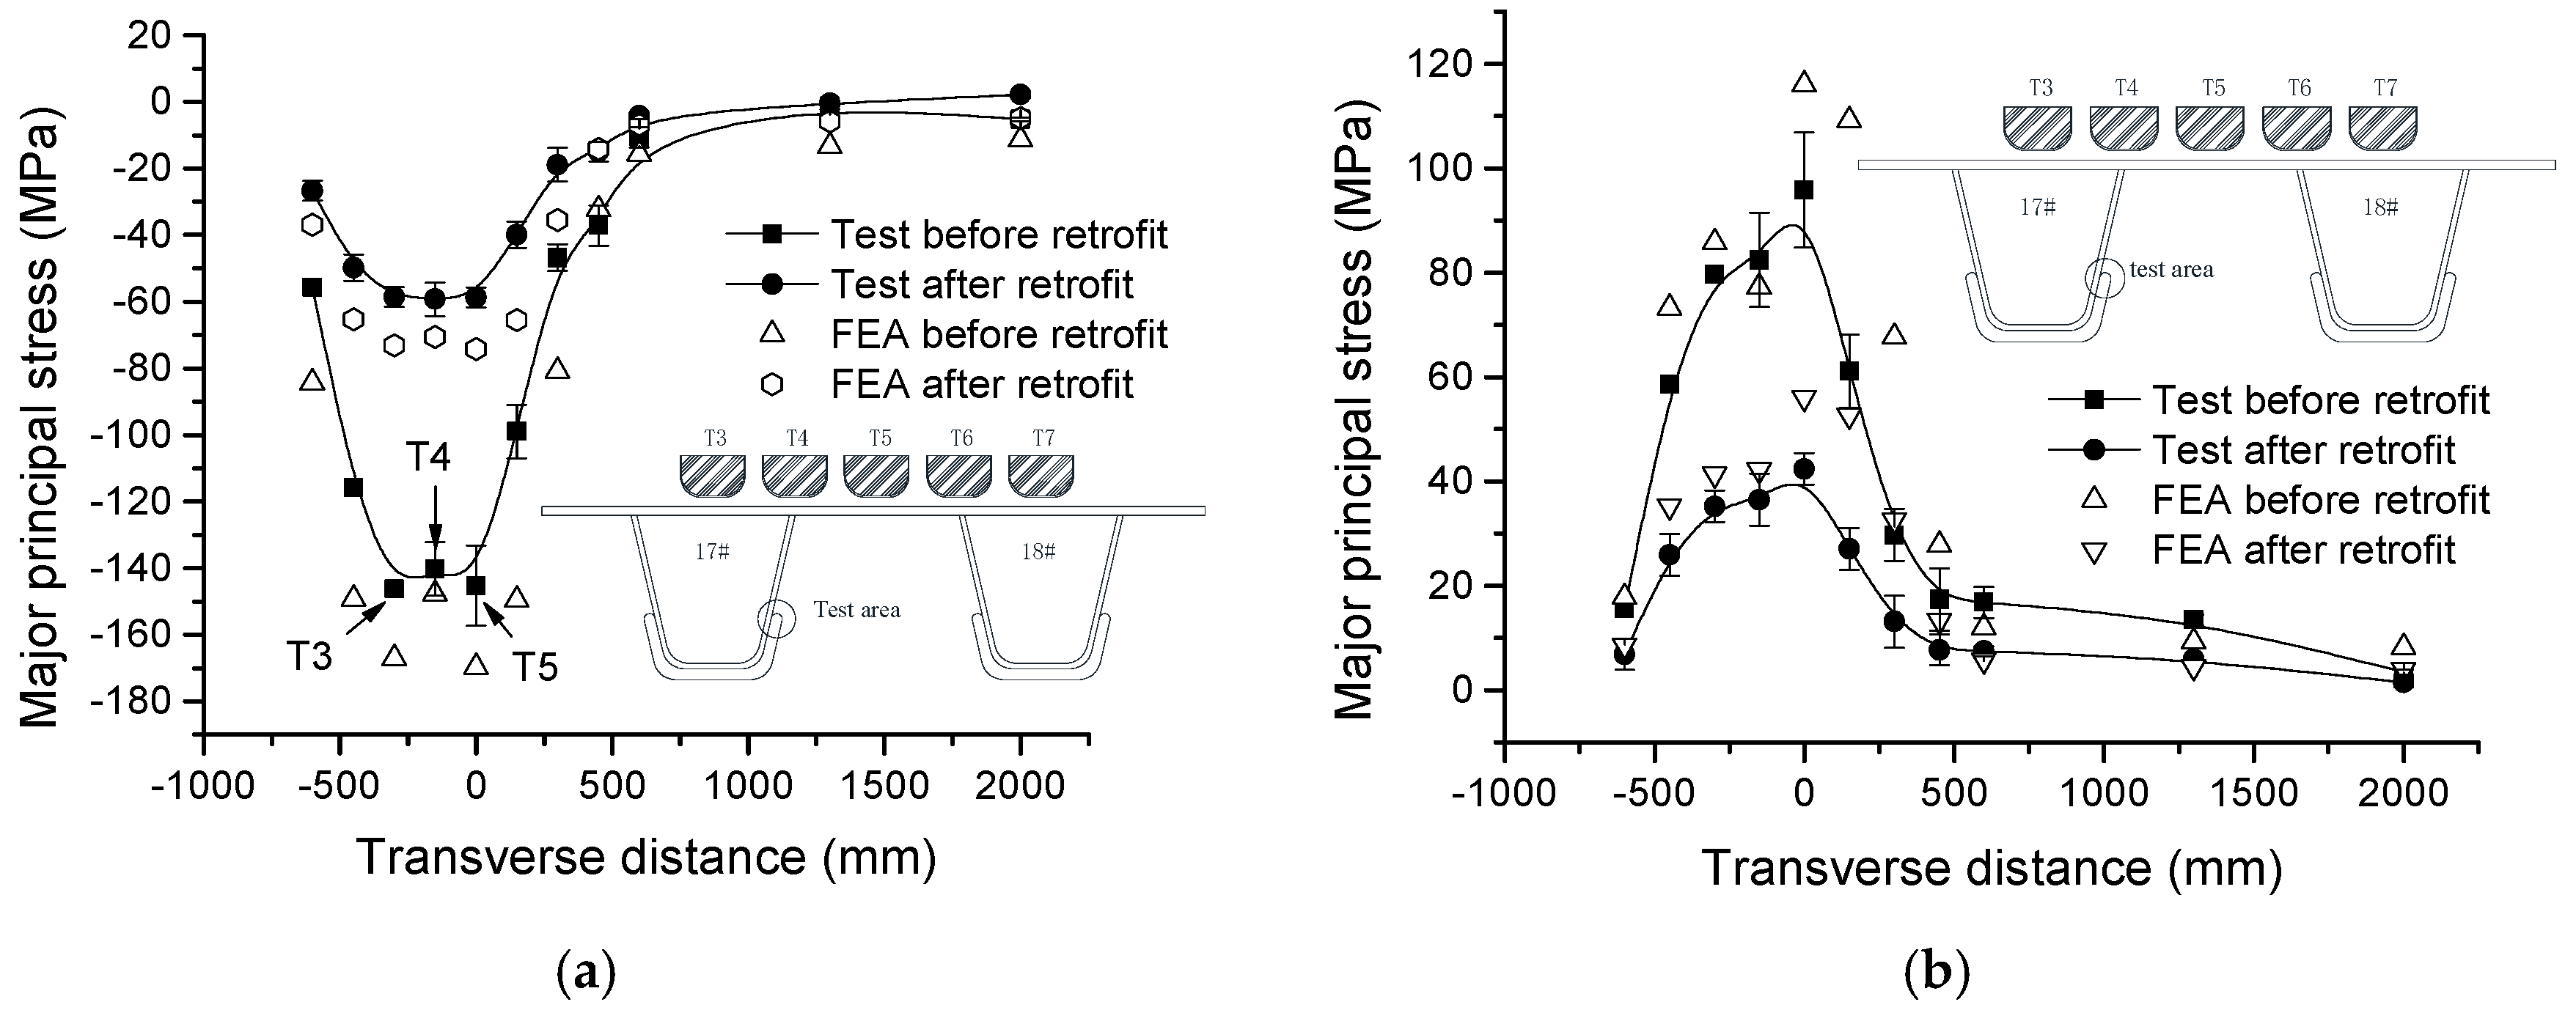
5.3. Stress Spectra due to a Transversally Moved Vehicle

For the lateral loading, the measured stress and FEA results of zone A and zone B are shown in Figure 18. The origin of the transverse coordinate is located at T5, and the transverse distance in Figure 18 indicates the distance of the left wheel from T5.
(1) When the lateral position of the wheel load is directly above the test diaphragm cutout, the stress at zone A is relatively large. The stress is greatest when the wheel load is at T3 and T5. After the retrofit, the stress amplitude in zone A decreases by 58.7%.
(2) The stresses in zone B are tensile stresses, which are related to the shape of the diaphragm cutout. When the wheel load is applied at T5, the value of the stress at the measuring point 5 is the maximum one. The stress decreases significantly when the wheel load is far away from the measuring point 5.
(3) According to Eurocode 3, when the fatigue loading model III is used for checking the locally stressed components, the lateral probability of the wheels in the lane should be considered. The spacing between the loading areas 1, 2(3) and 4(5) is 100 mm, and the probability of occurrence at each line is respectively 7%, 18% and 50% according to Eurocode 3 (“Design of steel structures”). The equivalent constant amplitude stress with transverse probability distribution is reduced to 55.2% and 51.8% respectively.

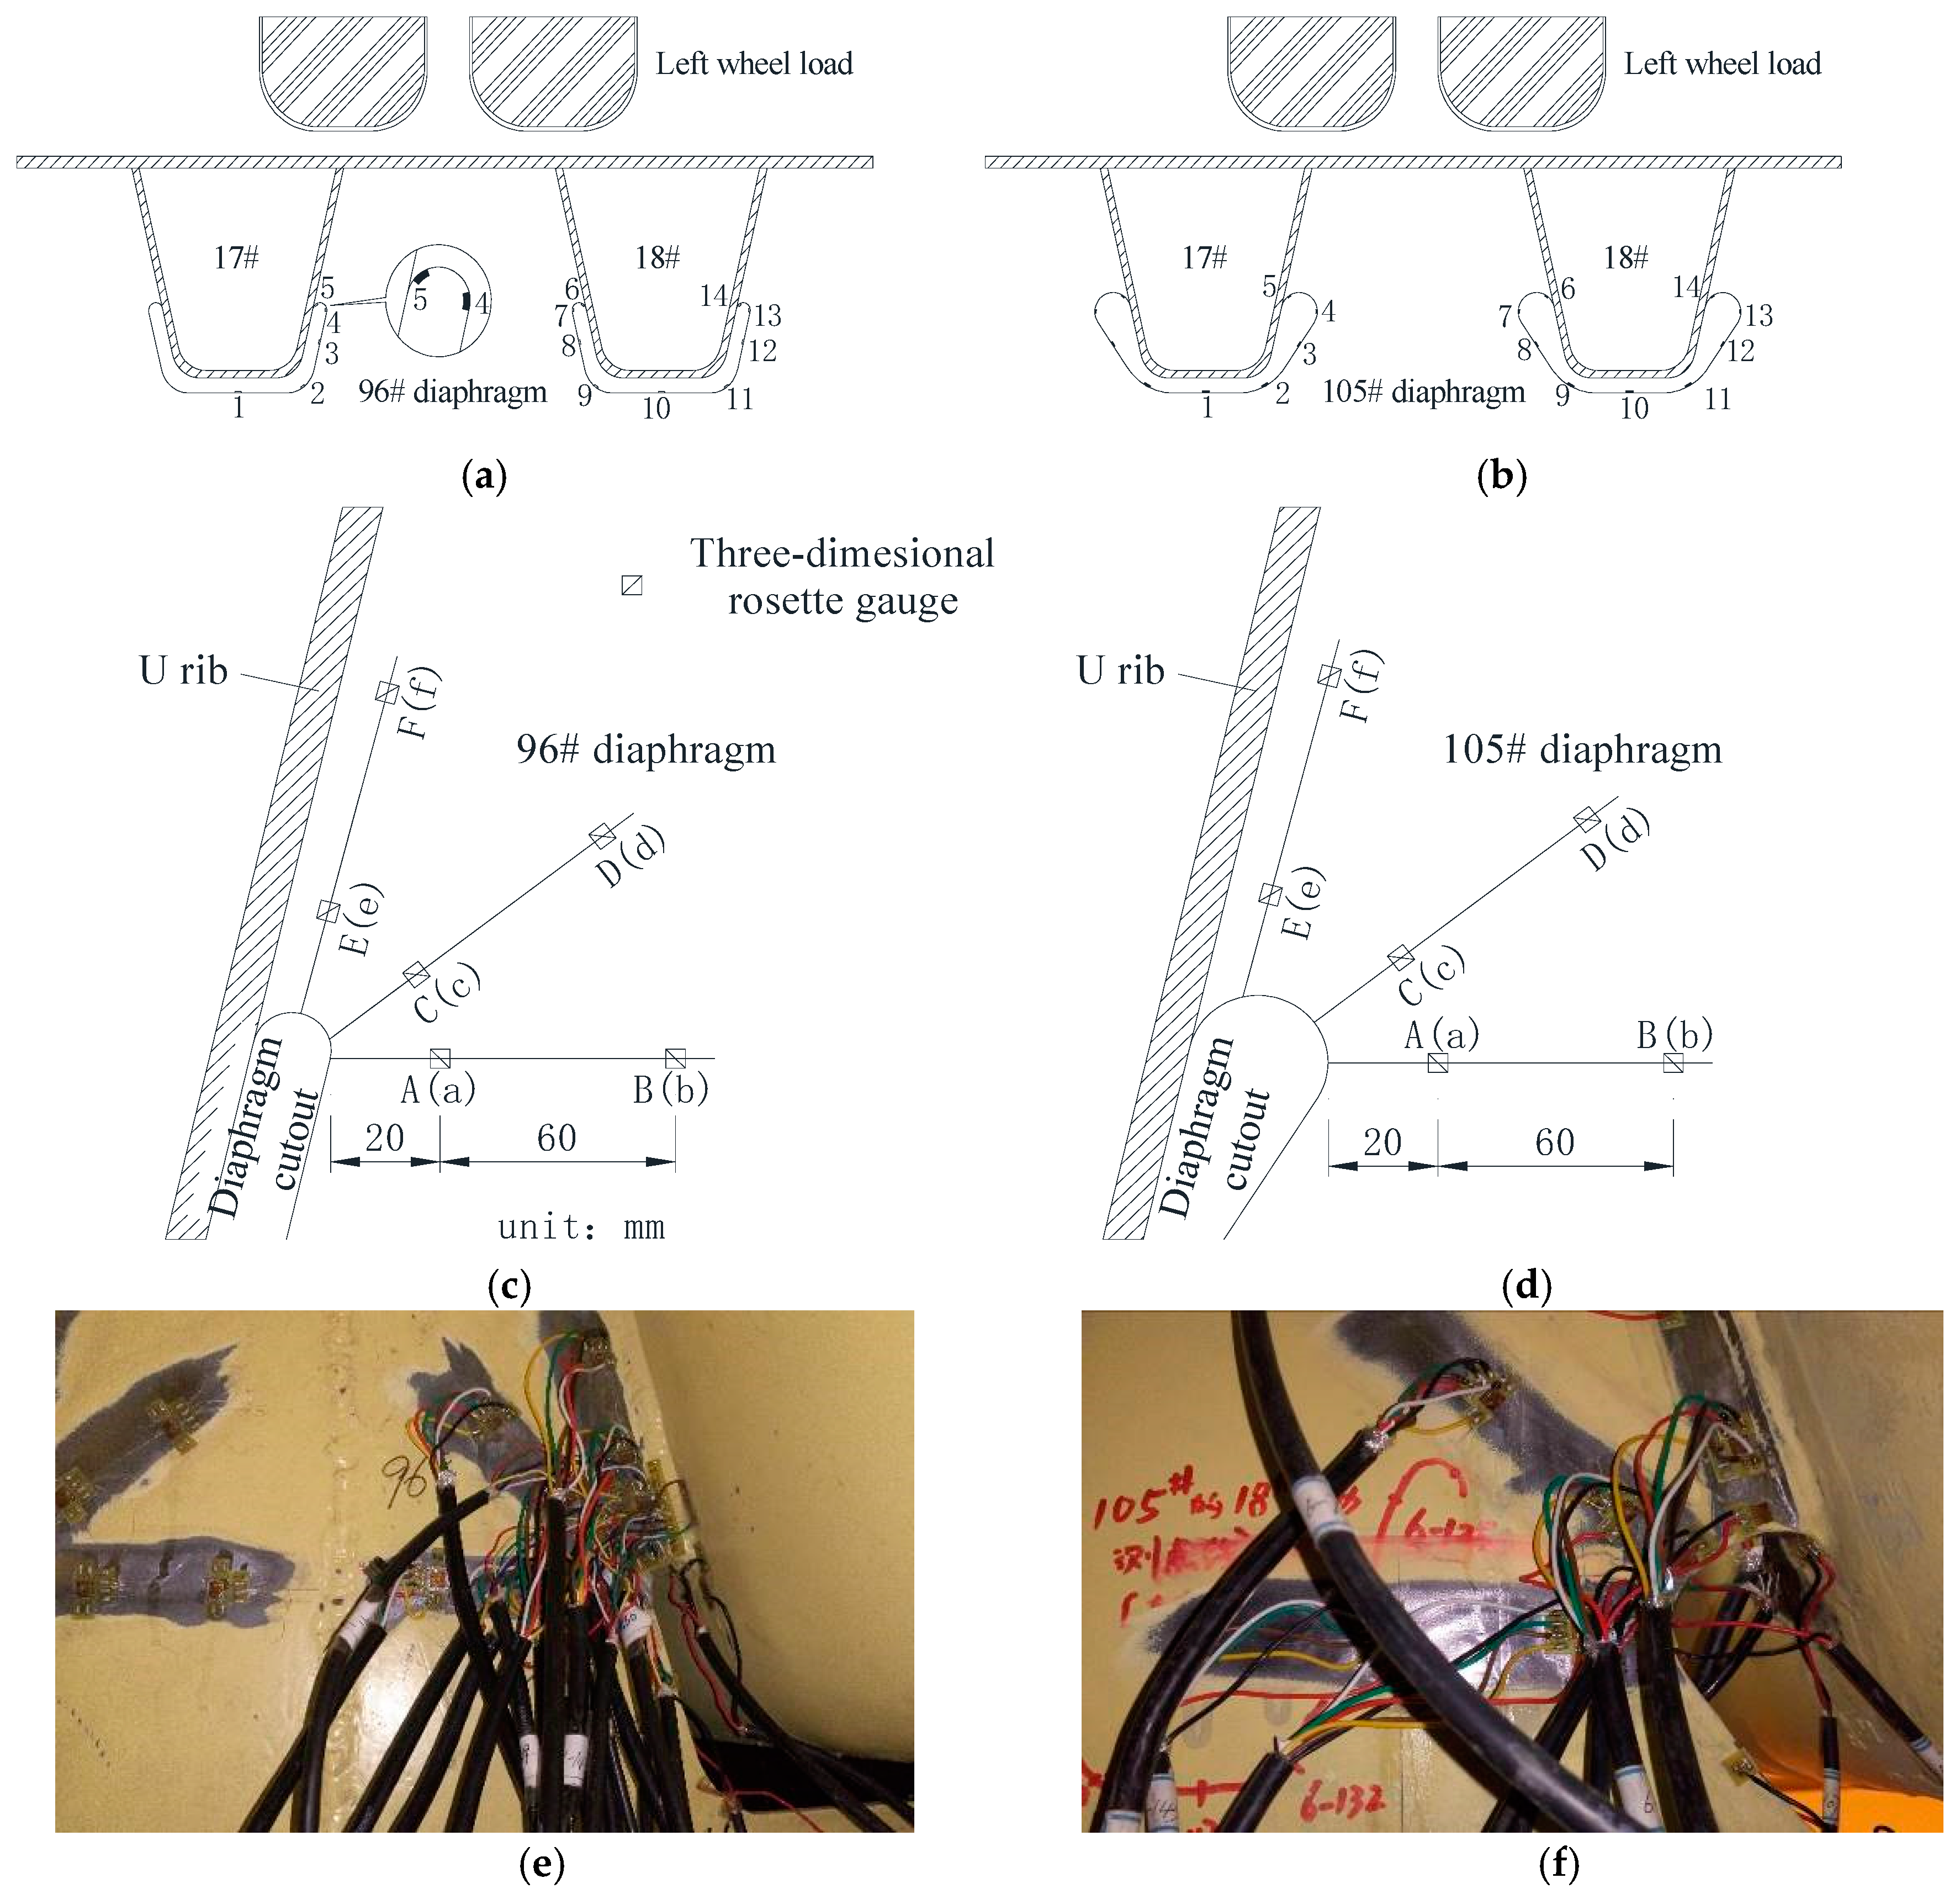
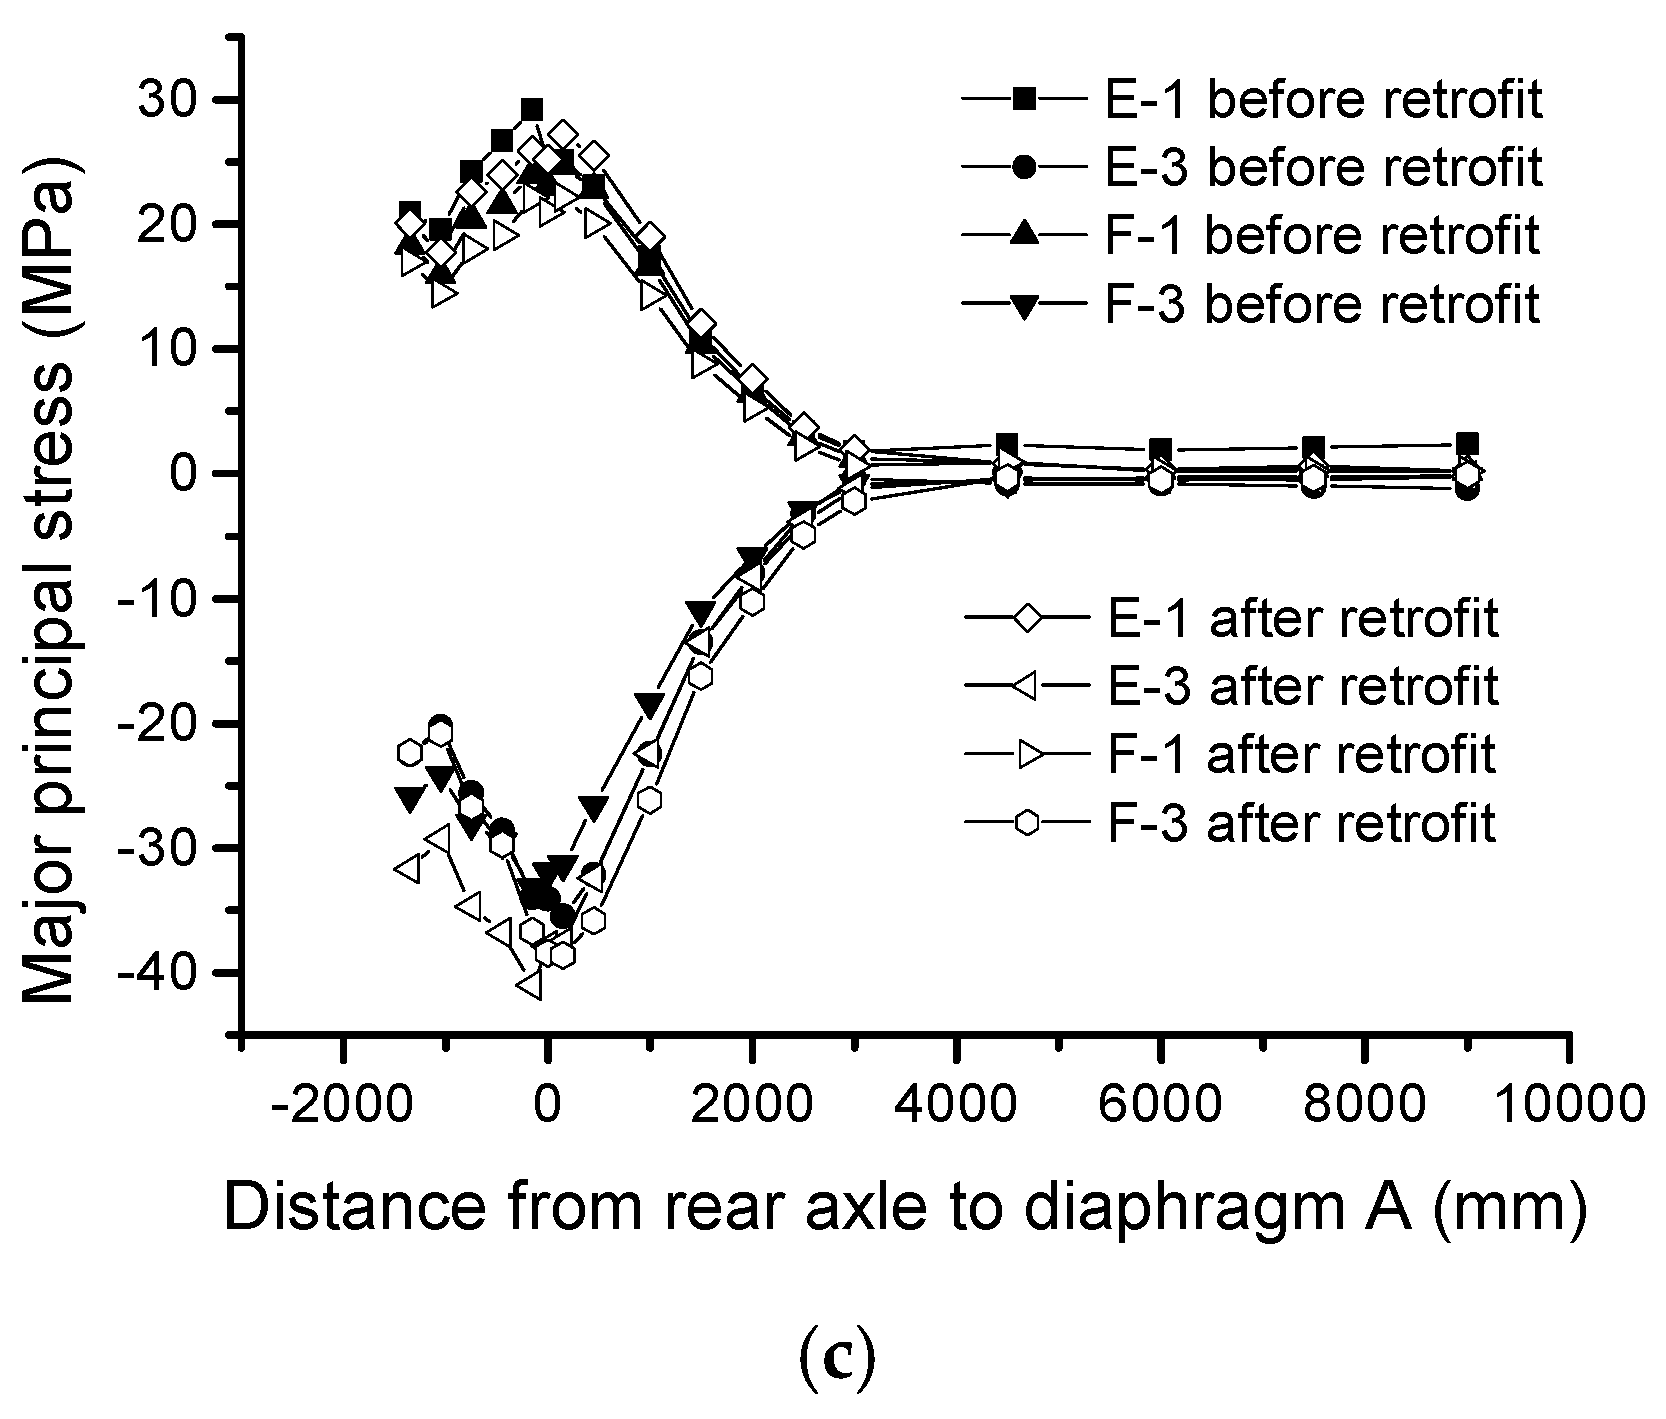
5.4. Principal Stresses around Diaphragm Cutouts

Principal stresses were acquired by three-direction rosette gauges arranged at the side of the diaphragm, 20 and 80 mm away from the edge of the diaphragm cutout. The measurements from the rosette gauges on both sides of the diaphragm were averaged. Figure 19a–c shows the test data along the horizontal line, 45° directional line and parallel U-rib web line, respectively. The abbreviations A-1 and A-3 represent the first and the third principal stresses of gauge A.
Figure 19a shows that at measuring points A and B, the third principal stresses after retrofit are generally larger than those before retrofit, and the maximum stress at the measuring point B increases by 6.4%. It shows that increasing the diaphragm cutout weakens the sectional area of the diaphragm, leading to the increase in stress in the diaphragm, but this increment in stress is small, and could not result in new fatigue cracks. The third principal stresses at the measuring points before and after the retrofit are large, and the first principal stresses are small, indicating that this is an area of primarily compressive stress, and the direction of the principal stress is vertically downward. The stress at point A near the diaphragm cutout is greater than that at point B, and the third principal stress difference at the location of peak stress is about 15 MPa, indicating that the stress concentration effect of the incision does occur but is not significant. After the retrofit of the diaphragm cutout, the stress concentration effect of the incision is reduced.
According to the data presented in Figure 19b, the third principal stress (C-3) of measuring point C before the retrofit is larger than that after the retrofit. The effect of stress concentration on the diaphragm cutout before reinforcement on the measuring point C is greater than the effect of the change in the cross-sectional area of the diaphragm, thus causing an increase in the average stress. Increasing the radius of the diaphragm cutout can effectively reduce the stress concentration effect in the area around the diaphragm cutout. The third principal stress at the measuring point C after retrofit is larger than that at the measuring point D, and the maximum difference between the stress curves is about 10 MPa. The stress gradient between measurement point C and measurement point D after retrofit is 166.6 MPa/m. Before the retrofit, the stress gradient between point C and point D was 283.3 MPa/m. The results show that the stress gradient on the diaphragm can be effectively reduced with diaphragm cutout optimization.
The data in Figure 19c demonstrates that before and after the diaphragm cutouts were retrofitted, the change in stress of the diaphragm near the U-rib is small, which does not affect the fatigue performance of the weld joint between the diaphragm and U-rib. Therefore, the stress concentration effect of the diaphragm cutout has little effect at this position. The first and third principal stresses at the measurement points of the diaphragm in the direction parallel U-ribs are almost equal, but in opposite direction.

5.5. Fatigue Life Assessment of Diaphragm Cutouts

The cutout retrofit method of hot cutting combined with edge-corner grinding causes residual tensile stress, which affects the stress ratio of the wheel load induced stress spectrum. But the stress ratio has little effect on the fatigue life of the whole steel structure, since fatigue life is mainly related to stress amplitude. Therefore, the effect of residual cutting stress on fatigue life is ignored in this paper.
In Eurocode 3 (“Design of steel structures” (Parts 1–9)), the fatigue analysis method named the Vierendeel-model is presented to calculate the fatigue life of diaphragm cutouts, which ignores the effect of the cutout geometry. Therefore, it is not suitable to evaluate the fatigue life of cutouts in this paper. Another approximate assessment method is mentioned in Eurocode 3, in which the modified nominal stress is used to evaluate fatigue life for a geometric discontinuity that has not been considered in the classification of a particular construction detail. Therefore, the construction detail No. 4 in Parts 1–9 of Eurocode 3 (details in Table 8.1 of Eurocode 3) with the detail category 140 is selected for the following two reasons: firstly, both methods involve fatigue crack initiation at the cutting edge, as shown in Figure 3; secondly, the direction of crack propagation is perpendicular to the direction of principal stress. The modified nominal stress is defined as the nominal stress multiplied by the stress concentration factor. Therefore, the modified nominal stress around diaphragm cutout can be used to evaluate fatigue life based on the construction detail No. 4.
The modified nominal stress ranges in zone A, that considers the lateral probability distributions of five-wheel positions, is defined as follows:
Δ σ P = 0.5 × σ 1 3 + 0.18 × σ 2 3 + 0.18 × σ 3 3 + 0.07 × σ 4 3 + 0.07 × σ 5 3 3
where σ i is the modified nominal stress range in zone A, which is caused by the fatigue loads with a standard vehicle, and takes into account the local stress magnification in relation to detail geometry, that is not included in the reference curves.
The ultimate state equation of the relation between fatigue strength and modified nominal stress range is represented as follows based on a series of S-N-curves, which correspond to typical detail categories.
γ Ff Δ σ E 2 = Δ σ C γ Mf
where: γ Ff and γ Mf are the partial factors for equivalent constant amplitude stress ranges and fatigue strength, respectively, and set as 1.0 for design security and were not taken into consideration in fatigue life prediction in this research; Δ σ C is the reference value of the fatigue strength at 2 million cycles, which is 140 for constructional detail No. 4; Δ σ E 2 is the value of modified nominal stress range subjected to 2 million cycles, which be determined as follows:
Δ σ E 2 = λ 1 λ 2 λ 3 λ 4 Δ σ P
λ 1 is the damage effect factor, which takes the fatigue model III and the length of the influence line into consideration, and the value is 1.85 for diaphragm cutouts.
λ 2 is the traffic flow factor for fatigue model III, which considers the daily traffic volume.
λ 2 = ( 0.95 × 365 × p × N y 0.5 × 10 6 × j ) 1 x
λ 3 is the design life effect factor, which is directly related to fatigue life.
λ 3 = ( t 100 ) 1 x
λ 4 is the multi-lane effect coefficient, the value is 1 for fatigue model III.
In the above equations, t is the fatigue life in years, j is the total number of traffic lanes, Ny is the daily traffic volume on one box girder, and p is the ratio of heavy traffic to total traffic, which is assumed to be 40% for highways in case of a lack of statistical data. When the modified nominal stress ranges of the detail No. 4 are greater than 103.1 MPa, the x is 3; otherwise the x is 5 in the above equations.
Substituting Equations (1), (2), (4) and (5) into Equation (3), we obtain Equation (6) as follows.
t 100 = 0.5 × 10 6 × j 0.95 × 365 × p × N y ( Δ σ C γ Mf γ Ff λ 1 λ 4 Δ σ P ) x
According to the statistics of WIM for this suspension bridge, the average daily traffic of a steel box girder was 45,900 in 2016. The fatigue life t (in units of year) can be obtained, and the calculation process and results are presented in Table 2.
The evaluated fatigue life of diaphragm cutouts in this bridge is 1.7 years from FEA and 4.9 years from test stress data before the cutouts were retrofitted, based on the daily traffic in the year 2016. However, the predicted fatigue life increases to 78.1 years from FEA and 155.5 years from test stress data after the diaphragm cutouts were retrofitted. The fatigue life increased by 46.0 and 31.4 times based on the FEA and test stress data, respectively. These evaluated results indicate that proposed retrofitting technology is suitable for fatigue damage rehabilitation in zone A at diaphragm cutouts and the optimized geometry used to increase fatigue life has a beneficial effect on diaphragm cutouts.

6. Conclusions

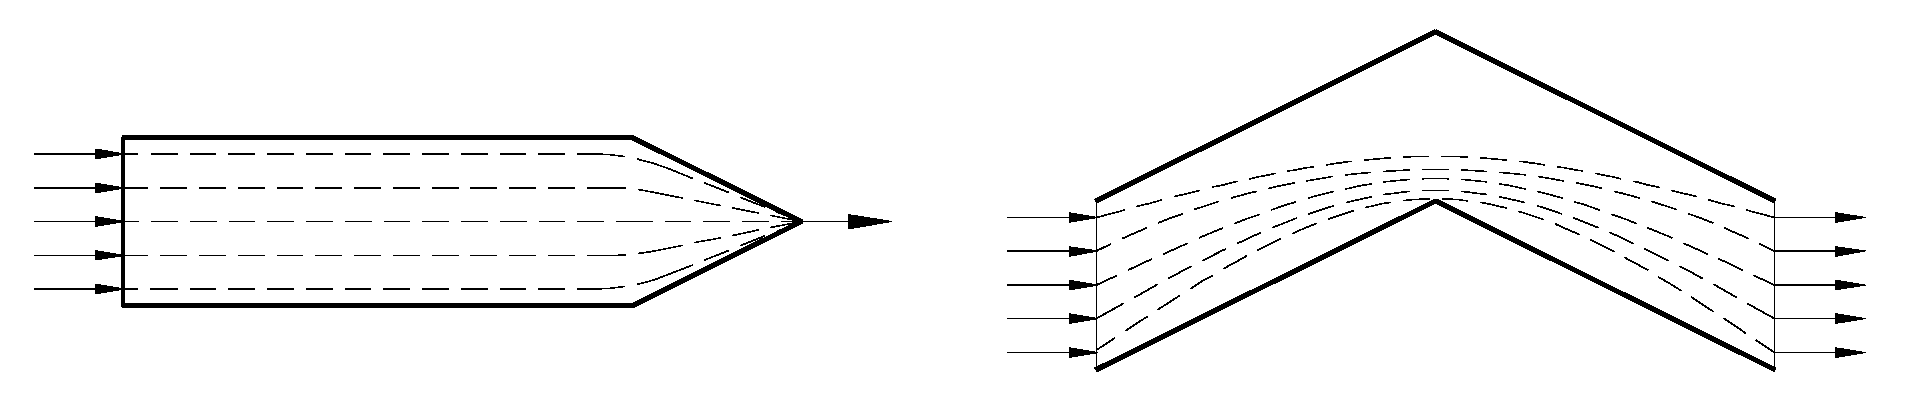
The stress flow method is used to analyze the cause of stress concentration at the diaphragm, the wheel loads on the deck transmit stress to the diaphragms through the U-ribs. In the process of load transmission, the stress flows are obstructed by diaphragm cutouts, resulting in the local high density of stress flows, and hence leading to stress concentrations around the cutouts.
According to the analysis of the geometric parameters of diaphragm cutouts, it is found that the geometrical size of the diaphragm cutout should be small, while the radius should be large, the included angle should be negative, and the stress flow should not be obstructed by cutouts. Therefore, an optimized geometry with a radius of 35 mm is recommended to reduce stress concentrations in zone A and zone B and to remove short fatigue cracks at diaphragm cutouts.
The maximum principal stresses in zone A and zone B around the cutouts were decreased significantly after the diaphragm cutouts were retrofitted. The local stresses decreased up to 87.6 MPa, and the stress reduction ratio is 59.9%. When the lateral probability distribution is considered, the equivalent constant amplitude stress is reduced by 55.2%. However, the stress at the critical section, which is near the cutout and at the horizontal line in the diaphragm, is increased slightly because this critical section is narrowed due to the increase in the radius of the cutout.
Based on the construction detail No. 4 in Table 8.1 in Eurocode 3, the modified nominal stress method, which takes the influence of geometry into consideration, is used to evaluate the fatigue life of diaphragm cutouts. The evaluated fatigue life of diaphragm cutouts, based on FEA and test results, are 1.7 years and 4.9 years respectively, before the cutouts are retrofitted, and increase to 78.1 years and 155.5 years respectively after retrofitting. These results indicate that this retrofitting technology is suitable for fatigue damage rehabilitation in zone A of the diaphragm cutouts.
The hot cutting method combined with corner grinding used to retrofit the geometry of diaphragm cutouts causes residual tensile stress, which is ignored in this paper. The residual stress distribution, the influence of the R ratio and a high-precision assessment method for diaphragm cutouts need to be further studied.

Author Contributions

Conceptualization, Z.-Y.C. and H.-H.X.; methodology, Z.-Y.C. and C.-X.L.; software, Z.-Y.C. and J.H.; validation, Z.-Y.C., C.-X.L. and H.-H.X.; formal analysis, Z.-Y.C.; investigation, Z.-Y.C.; resources, Z.-Y.C. and C.-X.L.; data curation, Z.-Y.C.; writing—original draft preparation, Z.-Y.C.; writing—review and editing, J.H. and H.-H.X.; visualization, Z.-Y.C.; supervision, J.H.; project administration, Z.-Y.C. and C.-X.L.; funding acquisition, Z.-Y.C. All authors have read and agreed to the published version of the manuscript.

Funding

This research was funded by National Natural Science Foundation of China through Grant No. 51708047, 51778069 and 51978081; Horizon 2020- Marie Skłodowska-Curie Individual Fellowship of European Commission (REUSE: 793787); the Natural Science Foundation of Hunan Province through Grant No. 2019JJ50670; the Excellent youth project of Hunan Provincial Department of Education through Grant No. 19B013, and the Innovative projects in key disciplines through Grant No.18ZDXK11.

Conflicts of Interest

The authors declare no conflict of interest.

References

  1. Li, C.; He, J.; Zhang, Z.; Liu, Y.; Ke, H.; Dong, C.; Li, H. An improved analytical algorithm on main cable system of suspension bridge. Appl. Sci. 2018, 8, 1358. [Google Scholar] [CrossRef] [Green Version]
  2. He, J.; Li, C.; Ke, H.; Liu, Y.; Zhang, Y.; Dong, C.; Zhang, Z. A simplified calculation method of length adjustment of datum strand for the main cable with small sag. Adv. Civ. Eng. 2019, 789, 1–8. [Google Scholar] [CrossRef]
  3. Li, C.; Li, Y.; He, J. Experimental study on torsional behavior of spatial main cable for a self-anchored suspension bridge. Adv. Struct. Eng. 2019, 22, 3086–3099. [Google Scholar] [CrossRef]
  4. Chen, Y.; Lv, P.; Li, D. Research on fatigue strength for weld structure details of deck with u-rib and diaphragm in orthotropic steel bridge deck. Metals 2019, 9, 484. [Google Scholar] [CrossRef] [Green Version]
  5. Xiao, Z.-G.; Yamada, K.; Inoue, J. Fatigue cracks in longitudinal ribs of steel orthotropic deck. Int. J. Fatigue 2005, 28, 409–416. [Google Scholar] [CrossRef]
  6. Battista, R.C.; Michèle, S.P.; Carvalho, E.M.L. Fatigue life estimates for a slender orthotropic steel deck. J. Constr. Steel Res. 2008, 64, 134–143. [Google Scholar] [CrossRef]
  7. Chen, Z.; Li, C.; Ke, L.; Liu, Y.; Lin, J. Study on fatigue damages and retrofit methods of steel box girder in a suspension bridge. J. Civ. Eng. 2017, 50, 11–20. [Google Scholar]
  8. Xin, H.; Milan, V. Fatigue crack initiation prediction using phantom nodes-based extended finite element method for S355 and S690 steel grades. Eng. Fract. Mech. 2019, 214, 164–176. [Google Scholar] [CrossRef] [Green Version]
  9. Xin, H.; Milan, V. Residual stress effects on fatigue crack growth rate of mild steel S355 exposed to air and seawater environments. Mater. Des. 2020, 193, 108732. [Google Scholar] [CrossRef]
  10. Xin, H.; Veljkovic, M. Effects of residual stresses on fatigue crack initiation of butt-welded plates made of high strength steel. In Proceedings of the Seventh International Conference on Structural Engineering, Mechanics and Computation (SEMC 2019), Cape Town, South Africa, 2–4 September 2019. [Google Scholar]
  11. Fu, Z.Q.; Ji, B.H.; Xie, S.H.; Liu, T.J. Crack stop holes in steel bridge decks: Drilling method and effects. J. Cent. South Univ. 2017, 24, 2372–2381. [Google Scholar] [CrossRef]
  12. Hao, W.; Abdellatif, I.; Noureddine, B. On the prediction of the residual fatigue life of cracked structures repaired by the stop-hole method. Int. J. Fatigue 2010, 32, 670–677. [Google Scholar] [CrossRef]
  13. Razavi, S.M.J.; Ayatollahi, M.R.; Sommitsch, C. Retardation of fatigue crack growth in high strength steel S690 using a modified stop-hole technique. Eng. Fract. Mech. 2016, 169, 226–237. [Google Scholar] [CrossRef]
  14. Van Puymbroeck, E.; Nagy, W.; Schotte, K.; Ul-Abdin, Z.; De Backer, H. Determination of residual welding stresses in a steel bridge component by finite element modeling of the incremental hole-drilling method. Appl. Sci. 2019, 9, 536. [Google Scholar] [CrossRef] [Green Version]
  15. Nagy, W.; Van Puymbroeck, E.; Schotte, K.; Van Bogaert, P.; De Backer, H. Measuring residual stresses in orthotropic steel decks using the incremental hole-drilling technique. Exp. Tech. 2017, 41, 215–226. [Google Scholar] [CrossRef]
  16. Cao, B.; Ding, Y.; Fang, Z.; Geng, F.; Song, Y. Influence of weld parameters on the fatigue life of deck-rib welding details in orthotropic steel decks based on the improved stress integration approach. Appl. Sci. 2019, 9, 3917. [Google Scholar] [CrossRef] [Green Version]
  17. Aljabar, N.J.; Zhao, X.L.; Al-Mahaidi, R.; Ghafoori, E.; Motavalli, M.; Powers, N. Effect of crack orientation on fatigue behavior of CFRP-strengthened steel plates. Compos. Struct. 2016, 152, 295–305. [Google Scholar] [CrossRef]
  18. Kaan, B.N.; Alemdar, F.; Bennett, C.R.; Matamoros, A.; Barrett-Gonzalez, R.; Rolfe, S. Fatigue enhancement of welded details in steel bridges using CFRP overlay elements. J. Compos. Constr. 2012, 16, 138–149. [Google Scholar] [CrossRef]
  19. Li, C.; Ke, L.; He, J. Effects of mechanical properties of adhesive and CFRP on the bond behavior in CFRP-strengthened steel structures. Compos. Struct. 2019, 211, 163–174. [Google Scholar] [CrossRef]
  20. Ke, L.; Li, C.; He, J.; Dong, S.; Chen, C.; Jiao, Y. Effects of elevated temperatures on mechanical behavior of epoxy adhesives and CFRP-steel hybrid joints. Compos. Struct. 2020, 235, 111789. [Google Scholar] [CrossRef]
  21. Chataigner, S.; Wabeh, M.; Garcia-Sanchez, D.; Benzarti, K. Preventive fatigue strengthening of steel structures with adhesively bonded CFRPs—Efficiency demonstration on a real bridge. J. Compos. Constr. 2020, 24, 05020002. [Google Scholar] [CrossRef]
  22. Dieng, L.; Marchand, P.; Gomes, F.; Tessier, C.; Toutlemonde, F. Use of UHPFRC overlay to reduce stresses in orthotropic steel decks. J. Constr. Steel Res. 2013, 89, 30–41. [Google Scholar] [CrossRef]
  23. Zhou, H.; Wen, J.; Wang, Z.; Zhang, Y.; Du, X. Fatigue crack initiation prediction of cope hole details in orthotropic steel deck using the theory of critical distances. Fatigue Fract. Eng. Mater. Struct. 2016, 39, 1051–1066. [Google Scholar] [CrossRef]
  24. Cui, C.; Zhang, Q.; Luo, Y.; Hao, H.; Li, J. Fatigue reliability evaluation of deck-to-rib welded joints in osd considering stochastic traffic load and welding residual stress. Int. J. Fatigue 2018, 111, 151–160. [Google Scholar] [CrossRef]
  25. Deng, Y.; Li, A.; Feng, D. Fatigue reliability assessment for orthotropic steel decks based on long-term strain monitoring. Sensors 2018, 18, 181. [Google Scholar] [CrossRef] [PubMed] [Green Version]
  26. Han, Y.; Li, K.; Wang, L.; Xu, G. Fatigue reliability assessment of long-span steel-truss suspension bridges under the combined action of random traffic and wind loads. J. Bridge Eng. 2019, 25, 04020003. [Google Scholar] [CrossRef]
  27. Zhiyuan, Y.Z.; Bohai, J.; Muye, Y.; Zhongqiu, F.; Yuan, T. Study on fatigue performance of welded joints for out-of-plane gusset in orthotropic steel bridge decks. J. Civ. Eng. 2016, 2, 69–76. [Google Scholar]
  28. Qinghua, Z.; Chuang, C.; Yizhi, B.; Qiao, L. Experimental study on fatigue features of orthotropic bridge deck through full-scale segment models. J. Civ. Eng. 2015, 48, 72–83. [Google Scholar]
  29. Zheng, K.; Feng, X.; Heng, J.; Zhu, J.; Zhang, Y. Fatigue reliability analysis of rib-to-deck joints using test data and in-situ measurements. Appl. Sci. 2019, 9, 4820. [Google Scholar] [CrossRef] [Green Version]
  30. Wu, C.; Yuan, Y.; Jiang, X. Fatigue behavior assessment method of the orthotropic steel deck for a self-anchored suspension railway bridge. Procedia Eng. 2016, 161, 91–96. [Google Scholar] [CrossRef] [Green Version]
  31. Heng, J.; Zheng, K.; Kaewunruen, S.; Baniotopoulos, C. Stochastic traffic-based fatigue life assessment of rib-to-deck welding joints in orthotropic steel decks with thickened edge u-ribs. Appl. Sci. 2019, 9, 2582. [Google Scholar] [CrossRef] [Green Version]
  32. Peng, Y.; Chen, J.; Dong, J. Experimental data assessment and fatigue design recommendation for stainless-steel welded joints. Metals 2019, 9, 723. [Google Scholar] [CrossRef] [Green Version]
  33. Aygül, M.; Al-Emrani, M.; Urushadze, S. Modelling and fatigue life assessment of orthotropic bridge deck details using FEM. Int. J. Fatigue 2012, 40, 129–142. [Google Scholar] [CrossRef]
  34. Aygül, M.; Bokesjö, M.; Heshmati, M.; Al-Emrani, M. A comparative study of different fatigue life failure assessments of welded bridge details. Int. J. Fatigue 2013, 49, 62–72. [Google Scholar] [CrossRef] [Green Version]
  35. Corte, W.D. Parametric study of floorbeam cutouts for orthotropic bridge decks to determine shape factors. J. Bridge Struct. 2009, 5, 75–85. [Google Scholar] [CrossRef]
  36. Ma, Y.; Guo, Z.; Wang, L.; Zhang, J. Probabilistic life prediction for reinforced concrete structures subjected to seasonal corrosion-fatigue damage. J. Struct. Eng. 2020, 146, 040201117. [Google Scholar] [CrossRef]
  37. Ju, X.; Zeng, Z.; Zhao, X.; Liu, X. Fatigue study on additional cutout between u shaped rib and floor beam in orthotropic bridge deck. Steel Compos. Struct. 2018, 28, 319–329. [Google Scholar]
  38. Wang, C.; Fu, B.; Zhang, Q.; Feng, Y. Analysis of floor-beam web cutout shapes in orthotropic steel bridge deck. J. Chang. Univ. 2012, 32, 58–64. [Google Scholar]
  39. Gao, L.Q.; Pu, Q.H.; Han, B.; Liu, Z.B. Comparison study on crossbeam web cutout of different shapes for orthotropic steel bridge deck. Appl. Mech. Mater. 2012, 238, 758–764. [Google Scholar] [CrossRef]
  40. Li, L.; Zhang, D.; Yuan, Z.; Shi, X. Stress analysis of arc-shaped cutouts in steel orthotropic deck plates. J. Highw. Transp. Res. Dev. 2012, 29, 55–61. [Google Scholar]
  41. Choi, S.-M.; Tateishi, K.; Hanji, T. Fatigue strength improvement of weld joints with cope hole. Int. J. Steel Struct. 2014, 13, 683–690. [Google Scholar] [CrossRef]
  42. Ke, L.; Lin, J.Q.; Li, C.X.; Liu, Y.; Chen, Z.Y. Fatigue performance and structural detail optimization of arc-shape cutouts in diaphragm of steel box girder. Bridge. Constr. 2017, 47, 18–23. [Google Scholar]
Figure 1. Representative diaphragm cutouts including (a) Type I: highway cutout in Eurocode 3, (b) Type II: railway cutout in Eurocode 3, (c) Type III: AASHTO cutout, (d) Type IV: Japanese standard cutout, (e) Type V: cutout used in Williamsburg bridge, (f) Type VI: large radius cutout.
Applsci 10 03983 g001aApplsci 10 03983 g001b
Figure 2. Cross-section of the steel box girder of a suspension bridge.
Applsci 10 03983 g002
Figure 3. Structural details and fatigue cracks in the rehabilitation region: (a) The drawing; (b) the photo.
Applsci 10 03983 g003
Figure 4. Repair schemes for diaphragm cutouts: for short cracks using (a) Scheme 1; for long cracks using (b) Scheme 2, (c) Scheme 3 and (d) Scheme 4.
Applsci 10 03983 g004
Figure 5. Finite element model of steel box girder.
Applsci 10 03983 g005
Figure 6. The most unfavorable load case and stress flow.
Applsci 10 03983 g006
Figure 7. Stress around the diaphragm cutout: (a) Mises equivalent stress (Pa), (b) principal compressive stress (Pa).
Applsci 10 03983 g007
Figure 8. Stress flow characteristics.
Applsci 10 03983 g008
Figure 9. Stress flow analysis around a cutout at the U-rib to diaphragm connection: (a) vectors of principal stresses and (b) stress flow and load path.
Applsci 10 03983 g009
Figure 10. Shape parameters of a diaphragm cutout.
Applsci 10 03983 g010
Figure 11. The effect of the geometrical parameters of diaphragm cutouts on the major principal stress: (a) the influence of arc radius (l = 10 mm), (b) the influence of the length of the straight line (β = 0°), (c) the influence of inclined angle (r = 30 mm).
Applsci 10 03983 g011
Figure 12. Geometry of (a) the original diaphragm cutout and (b) the retrofitted diaphragm cutout.
Applsci 10 03983 g012
Figure 13. Methods to locate wheel loads.
Applsci 10 03983 g013
Figure 14. Load programs: (a) lateral loading program and (b) longitudinal loading program.
Applsci 10 03983 g014
Figure 15. Strain gauges arranged at the section of cutout (a) before rehabilitation; (b) after rehabilitation. Strain gauges arranged at the side of the diaphragm (c) before rehabilitation; (d) after rehabilitation. On-site strain gauge arrangement (e) before rehabilitation; (f) after rehabilitation.
Applsci 10 03983 g015
Figure 16. Stress distributions along the edge of diaphragm cutouts: (a) longitudinal movement L3, (b) longitudinal movement L10.
Applsci 10 03983 g016
Figure 17. Stress spectra of diaphragm cutouts for a longitudinally moved vehicle: (a) stress spectra of zone A, (b) stress spectra of zone B.
Applsci 10 03983 g017
Figure 18. Stress spectra of diaphragm cutouts under lateral moved vehicle: (a) stress spectra of zone A, (b) stress spectra of zone B.
Applsci 10 03983 g018
Figure 19. The relationship between the longitudinal loading position and the stresses on the diaphragm: (a) the stresses at the horizontal line, (b) the stresses at the 45° direction line, (c) the stresses at the straight line parallel to the U-rib web.
Applsci 10 03983 g019aApplsci 10 03983 g019b
Table 1. Fatigue crack characteristics and quantity in cutouts.
Crack Length/mm0–2525–5050–100100–250
number52382625
percent36.8%26.9%18.4%17.7%
Inclination Angle0°–30°30°–45°45°–60°60°–90°
number6151290
percent43.3%36.2%20.5%0%
Table 2. Fatigue Life Assessment.
Before RetrofitAfter Retrofit
FEATestFEATest
σ1 (MPa)169.7145.374.360.4
σ2 (MPa)147.7140.270.759.3
σ3 (MPa)149.698.965.540
σ4 (MPa)136136.270.258.6
σ5 (MPa)80.946.835.418.9
σp for 140 kN axle (MPa)165.5133.670.255.8
σp for Model III (MPa)141.8114.560.247.8
Fatigue life t (years)1.74.978.1155.5

