Article

Performance of Thermally Modified Spruce Timber in Outdoor Above-Ground Conditions: Checking, Dynamic Stiffness and Static Bending Properties

by
Joran van Blokland
,
Stergios Adamopoulos
* and
Sheikh Ali Ahmed
Department of Forestry and Wood Technology, Linnaeus University, 351 95 Växjö, Sweden
*
Author to whom correspondence should be addressed.
Appl. Sci. 2020, 10(11), 3975; https://doi.org/10.3390/app10113975
Submission received: 26 May 2020 / Revised: 3 June 2020 / Accepted: 4 June 2020 / Published: 8 June 2020
(This article belongs to the Special Issue Biobased Building Materials)

Abstract

:
Previous studies have shown that thermally modified wood (TMW) performs well in outdoor, above-ground conditions in terms of resistance to wood-decaying fungi. Yet, little is known about the development of defects such as checks and the corresponding mechanical properties of TMW in this condition. This experiment focused on the effect of 30 months outdoor above-ground exposure (weathering) on the degree of checking, dynamic stiffness and static bending properties of thermally modified timber (TMT) of Norway spruce. Two board pairs per log were cut from 190 logs; one board of each pair was thermally modified and the other used as control. Then, 90 board pairs were exposed to the weather in south Sweden. Surface checking and axial stiffness were monitored at six-month intervals by using digital photography and non-destructive tests (time-of-flight and resonance method) to monitor changes in the material upon weathering. Finally, all boards were tested destructively in a 4-point static bending test following EN 408 standard. Results showed that weathering had no significance influence on static bending properties of TMT even though the degree of checking was considerably higher in TMT than unmodified timber after weathering. In particular, checks along growth rings were deeper, longer and more common in TMT after weathering, especially on the pith side of boards. The maximum depth of these checks did not depend on board orientation (i.e., which side was exposed) and exceeded limits given in strength grading standards for 7% of the modified boards included. Axial dynamic stiffness determined at 6-month intervals was less influenced by fluctuations in moisture content for TMT compared to unmodified timber, but did not confirm the increase in the degree of checking of TMT. The presence of checks from weathering did influence failure modes in TMT; horizontal shear failure became more frequent and some boards failed in compression.

1. Introduction

Thermal modification would prolong the service life of wood in outdoor applications, because its biological durability and dimensional stability are improved by a decrease in hygroscopicity after modification [1,2]. During the thermal modification process, wood is heated up to a target temperature of 160–240 °C that is maintained for a few hours while oxygen levels are kept low. Compared to other wood modification technologies, thermally modified wood (TMW) is available in largest volumes and at the lowest cost [3,4]. The total production capacity of TMW was estimated at 300,000 m3 in 2015 of which roughly half was modified according to the ThermoWood® process [3,5]. In 2019, the total production of ThermoWood® was slightly over 220,000 m3 [5]. The softwood species spruce (Picea abies [L.] Karst.) and pine (Pinus sylvestris L.) are primarily used for thermal modification, and TMW currently retails for about 1500 euro/m3 [5,6]. TMW is not suitable for ground contact situations since decay can already be discovered after a few years of exposure [7]. Previous studies also pointed out that TMW performs much better in outdoor, above-ground conditions [8,9], i.e., use class 3.2, according to EN 335-2 [10] standard. In this use class, Thermo-D can be applied, which is the most durable and dimensionally stable ThermoWood® product on the market [11,12].
The decrease in hygroscopicity after thermal modification is mainly explained by the thermal degradation of hygroscopic hemicelluloses in the wood cell wall, and measured by a reduction in equilibrium moisture content (EMC) of 50–60% and a reduction in swelling of 40–80% [1,13,14]. This loss in hemicelluloses is also considered in large part responsible for the decrease in some of the mechanical properties, particularly bending and tensile strength, and toughness [1,15,16]. These strength properties can be reduced by as much as 50% due to thermal modification depending on wood species and treatment conditions [15,17,18,19,20]. Mechanical properties of TMW have been investigated mainly using small specimens of clear wood, which makes it difficult to apply in structures. Today’s use of TMW is, therefore, limited to low-key and volume structures such as exterior cladding and decking or internal wall and ceiling panels and flooring, as a sustainable alternative to toxic preservative-treated timber or tropical hardwood. Thus, there is a lot of unexplored potential as has recently been seen in a preceding investigation on thermally modified timber (TMT) [21,22,23]. It was shown with sufficient accuracy in prediction that reasonable levels of strength remain after thermal modification of spruce timber. It was also found that although checking in knots was increased after thermal modification compared to kiln-dried timber, effects appear locally and did not affect bending stiffness of TMT at these sites. Yet, little is known about the development of checks and the corresponding mechanical properties of TMT in outdoor above-ground conditions.
Longer service-life of timber members relies on reliable estimation of material mechanical properties. Dynamic test methods used to obtain acoustic velocity in wood (based on natural resonance frequency or time-of-flight) have been proven useful in this respect [24,25]. The dynamic elastic modulus calculated from acoustic velocity and density has shown moderate to strong association with static bending strength and modulus of elasticity (MOE) for both timber and TMT [21,22,26,27,28]. Weather conditions, however, may have a considerable influence on in situ evaluation of exposed wooden members with dynamic tests. This is because acoustic velocity and density depend on wood moisture content (MC) and temperature. For example, acoustic velocity determined with both resonance and time-of-flight tools has been found to decrease rapidly with increasing MC until fibre saturation point, whereas above this point the rate of change in velocity was much slower [29,30]. Therefore, correction factors have been proposed to adjust the dynamic elastic modulus, velocity and/or density to a desired moisture and/or temperature level [31,32,33,34]. Other reasons for changes in dynamic properties of wood due to weathering may reflect changes in the structure and volume fraction of the various cell wall polymers, but also in the tissue integrity [35,36,37].
Degradation of wood in outdoor above-ground conditions is known as weathering [38,39]. Weathering phenomena relate primarily to photodegradation by sunlight, in particular ultraviolet radiation and to a lesser degree visible radiation that penetrate approximately 0.075 and 0.2 mm into wood, respectively, while moisture (e.g., precipitation and changes in relative humidity) among other things is a contributing factor [38,40]. Changes in wood by photodegradation—such as degradation of the cell wall and subsequent breakdown of the microstructure—are slow (5–6 mm/ 100 years) and confined to surface layers. Thus, such changes should have little influence on the mechanical properties of structural timber. Reviews on the surface degradation of thermally modified wood due to weathering were given by Evans [38] and Jirouš-Rajković and Miklečić [41]. Checking on the other hand, occurs when internal stress caused by differential shrinkage exceeds the tensile strength of wood [42]. Surface checking may occur when a ‘wet’ piece of timber dries quickly; internal checking when a ‘dry’ piece absorbs moisture, and; end checks (known as splits when they propagate through the piece) by drying of the timber ends. Checks first appear upon seasoning and develop further during weathering. Checks mainly appear radially along wood rays, but may occur between growth rings similar to (ring) shakes [42,43]. Shakes, however, are in general larger and develop along or across growth rings in trees during natural growth and become visible directly after conversion from log to timber [44]. Surface checking is typically more severe when growth rings are oriented parallel to the exposed surface compared to perpendicular and when pith and the surrounding juvenile wood are present [45,46,47,48]. A combination of surface checking and internal checking may lead to large cracks in boards [38]. Decay, caused by fungal decomposition of wood, is not regarded as an aspect of weathering [40].
Checking was found to increase by thermal modification compared to kiln-dried timber [23,49,50]. The pattern of checks is similar to kiln-dried timber; however, checks are wider, deeper and more abundant in TMT. Distinctive for TMT were internal checks that had developed radially [50]. High temperature drying during the thermal modification process was considered as the most critical factor for increased surface checking and internal checking in TMT compared to kiln-dried timber [49,50]. Surface checking was also found to be more frequent in thermally modified than unmodified spruce panels after 1 year of natural weathering, and at similar level after 5 years [51,52]; however, results from accelerated weathering tests are less consistent [51,53,54]. Surface checking was clearly present in 4-year-old cladding of Thermo-D spruce, and particularly notable were checks between growth rings [55]. Results on checking of TMW are difficult to compare between studies, because no standard test methods exist. For this reason, some researchers use EN ISO 4628-4 [56], a standard to assess the degree of cracking in coatings [49,52]. In addition, results from natural weathering tests are site specific [57,58]. Moisture content at the time of assessment of checking is often not reported, even though check size (length and width) depend on wood’s moisture content (MC) [59]. Assessment of checking is often made by visual inspection, which is subjective and prone to human error. In particular, digital photography has been proven useful for detecting and measuring surface checks in the field, does not require expensive equipment, and can provide a more objective assessment of the degree of checking [59].
Boonstra et al. [60] found a 16% and 12% decrease in mean flatwise bending strength and stiffness, respectively, of thermally modified terrace planking (140 × 27 × 600 mm3; width × thickness × length) of Norway spruce after 3 years outdoor above-ground exposure, but the degree of checking was not reported. Checking of TMT upon weathering is expected to be more severe compared to unmodified timber, in particular the development of long and deep checks along growth rings. Such cracks in wood can lead to a substantial reduction in strength and stiffness of the structural member [61]. Therefore, defined limits for the length and depth of checks in unmodified timber are given in rules for machine and visual strength grading, i.e., EN 14081-1 [62] and EN 1912 [63] standards, respectively. The aim of this study was, therefore, to investigate the effect of 30 months of outdoor above-ground exposure (weathering) on the degree of checking, dynamic stiffness, and 4-point static edgewise bending properties of thermally modified timber (TMT) of Norway spruce. Surface checking and axial dynamic stiffness were evaluated at six-month intervals by using digital photography and dynamic tests to monitor changes in the material upon weathering. Results were compared to bending properties of boards from the same batch of timber that were tested directly after thermal modification, i.e., not exposed outdoors. Data on the long-term performance of TMT exposed to weather can be useful for proper design and optimal maintenance of timber structures.

2. Materials and Methods

2.1. Timber and Thermal Modification

In this study, 380 boards of Norway spruce (Picea abies [L.] Karst.) with cross-sectional dimensions of approximately 45 × 145 mm2 and 3.6–4.8 m in length were included. Boards were sawn with a 2X-log pattern from 190 logs harvested in central Sweden to obtain two mirror imaged boards per log. After sawing, boards were kiln-dried to 12% MC and then planed. The boards were of saw falling quality, included various types of natural defects, sapwood, heartwood, juvenile wood, and many contained pith. Sawing, planning and drying was carried out at Stora Enso’s sawmill in Gruvön, Sweden. One board per log (i.e., 190 boards in total) was thermally modified (TM). These boards are herein referred to as TM boards. The other 190 mirror imaged boards were used as reference and will be further referred to as control boards. Thermal modification was done according to the ThermoWood® Thermo-D process in an industrial batch at Stora Enso’s treatment plant in Launkalne, Latvia. In this process, boards are first dried to approximately 0% MC and then heated to a maximum temperature of 212°C that is maintained for 3 h while oxygen levels are low. At the end of the process, boards are re-moistened to approximately 4–6% MC. The total process time is 3 days [12]. Figure 1 shows an overview of the preparation of boards.

2.2. Experimental

2.2.1. Weathering

Ninety (90) board pairs were exposed to the weather at SITES’s experimental forest and research station in Asa located 40 km north of Växjö in south Sweden (latitude. 57°10′ N, longitude. 14°47′ E) for a period of 30 months from spring 2017 until autumn 2019 (Figure 2). The average temperature and total annual precipitation were 7.1 °C and 560 mm in 2017, 7.8 °C and 558 mm in 2018, and 7.7 °C and 1105 mm in 2019, respectively. Climate data was provided by the Swedish Infrastructure for Ecosystem Science (SITES) at Asa Research Station (climate monitoring program of the Swedish University of Agricultural Sciences), and average temperature, solar radiation and relative humidity, and the total precipitation are shown in Table 1 for exposure periods of approximately 6 months, e.g., spring 2017 until autumn 2017. Boards were placed horizontally approximately 1 m above ground on supports that were spaced 1 m from each other. Boards were positioned lengthwise from North to South and a centre-to-centre distance of 0.25 m between each board was maintained (Figure 1 and Figure 2a). One third of the boards was oriented flat pith side up (group 1: pith up), one third flat pith side down (group 2: bark up), and the last 30 board pairs on their edge (group 3: edge). Board pairs were placed side by side. Plastic tubes prevented contact between exposure racks and boards, and kept boards in place (Figure 1 and Figure 2b,c). Board ends were not sealed.

2.2.2. Non-Destructive Tests (NDTs)

All 190 board pairs were examined by non-destructive tests; the 190 control boards after kiln-drying and the 190 TM boards after thermal modification. The board pairs used for weathering were also evaluated during exposure at six-month intervals. Two non-destructive test (NDT) methods were used to determine axial dynamic stiffness: one based on the principle of time-of-flight (Tof) and one resonance-based method. Time-of-flight (Δt) was obtained by a Sylva-test Trio® test device (CBS-CBT, Switzerland). Two transducers, one at each board end, were connected to the board in a pre-drilled hole. The time-of-flight is the time required for an ultrasonic wave to travel through the board. In the resonance-based method, the frequency of the first mode of axial vibration (fa,1) was obtained by a Timber Grader MTG handheld device (Brookhuis Micro-Electronics BV, The Netherlands). The Mechanical Timber Grader (MTG) was held against a board end and the frequency was measured by recording longitudinal vibrations from a built-in excitation hammer. A description of these methods and details of how they were implemented in this study can be found in van Blokland et al. [22]. Board mass (m) and volume (V) were obtained at the time of non-destructive testing. Before and during exposure, moisture content (MC) of 6 control and 6 TM boards, 2 board pairs from each group that were average in density, was determined by using the oven-dry method [64]. MC of a board was taken as the average MC of two board slices of approximately 20 mm thickness, one slice from each board end. These 6 boards used for determination of MC were excluded from all other tests, such that 84 board pairs (28 per group) after exposure were used in 4-point bending (4PB) tests and to assess degree of checking. Weather conditions at the time of NDTs are shown in Table 1.

2.2.3. Conditioning

At the end of the exposure period, the 84 exposed board pairs were taken from the field and stored on stickers at room temperature conditions (approximately 20 °C and 60% RH) in the laboratory hall of Linnaeus University, Växjö, Sweden. Non-destructive tests were repeated for a last time after the difference between board mass before and after exposure was approximately 1% or less. Figure 1 shows an overview of boards used for tests.

2.2.4. Bending Tests

Then, all 184 board pairs were bent to failure in a 4-point static edgewise bending test following EN 408 [65]. Boards were loaded by pulling specimens upwards in an ALWETRON TCT 100 test machine (Lorentzen and Wettre AB, Stockholm, Sweden). Force (F), global deflection (w), local deflection (v) and time were recorded during testing. At maximum load (Fmax), location of failure was recorded and type of failure was classified according to ASTM standard D143-94 [66]. Fracture surface on the tension side was characterised as brash or fibrous according to ASTM D143-94 [66]. Load-deflection (Fw) curves were categorised into four curve types: 1) sudden failure, 2) preliminary failure prior to failure, 3) non-linearity prior to failure, and 4) preliminary failures and non-linearity prior to failure. Further details regarding the implementation of these methods in the present study, and classification of failure type and Fw curves can be found in van Blokland et al. [21]. MC at the time of bending tests was determined from an approximately 20 mm thick board slice according to EN 13183-1 [64].

2.2.5. Degree of Checking: Board Surface

For 9 board pairs (i.e., 3 control and 3 TM boards per group), longitudinal separations of fibres (fissures) visible on the surface of a board’s flat sides were evaluated before, during and after outdoor exposure at the time of NDTs (Figure 1). Grading rules defined by EN 14081-1 [62] with limits for checks in structural timber were used as a guideline. Based on their depth, checks were classified as surface checks, deep checks and cracks. Cracks at board ends were classified as splits (Table 2). Deep checks and cracks were measured according to the Nordic visual strength grading rules for timber, i.e., INSTA 142 [67]. Depth of checks/cracks was measured with a feeler gauge 0.15 mm in thickness, and width of checks was not measured. In case of single checks/cracks, clusters of checks/cracks and overlapping checks/cracks, the total length was measured. No attempt was made to determine whether checks/cracks had developed across or along growth rings and surface checks were not included.
In addition to the visual assessment of degree of checking on a subsample, digital image processing was used to assign degree of checking on the exposed surface of a 300 mm long board section of all 84 exposed boards pairs. Before exposure, a WoodEye 5 scanner (WoodEye AB, Linköping, Sweden) with 4 multi-sensor cameras was used to obtain images of all 4 board surfaces over the full board length. TM boards were scanned twice, i.e., before and after thermal modification. During and after exposure, images were taken with a Sony DSC-H20 digital camera having a Carl Zeiss® Vario-Tessar® lens and 3648 × 2736 pixels resolution. These images were acquired at a representative area for each board, which was selected during the first measurement interval (i.e., after 6 months of weathering) and marked as PosX. The same position along the board was examined for board pairs. Images were taken at a 90 degree angle to the board surface at a distance of approximately 0.5 m right above PosX (Figure 3, step 1). Boards exposed on their edge (i.e., group 3) were evaluated on both flat sides, but only before and after outdoor exposure (Figure 1).

2.2.6. Degree of Checking: Board Cross-Section

For all exposed boards tested in bending, checking within the cross-section was also evaluated using the board slice used to determine MC before oven drying. The number and maximum depth of checks along and across growth rings with a minimum length of 1 mm and visible to the naked eye within this cross-section (only one side evaluated) was recorded for both flat sides of each board (i.e., pith and bark side).

2.3. Data Analysis

2.3.1. Calculation of Board Properties

Air-dry density (ρ) [kgm−3] was calculated as board mass divided by board volume. Acoustic velocity (ms−1) was calculated as follows:
v a , tof = L Δ t
for Tof measurements, and as
v a , res = f a , 1 2 L
for resonance-based measurements, and the L in Eqn. 1 and 2 is board length. Axial dynamic stiffness (MPa) was calculated as
E a = ρ   · v a 2
Denotation Ea,tof is used to refer to dynamic stiffness calculated from va,tof, and Ea,res when va,res was used. For control boards, acoustic velocity was adjusted to 12% MC using expressions given by Unterwieser et al. [33]. The minimum and maximum temperature of boards at the time of NDTs ranged between approximately 5 and 35°C. Below fibre saturation point (FSP), these temperature differences lead to a difference in Ea smaller than 5% compared to a reference temperature of 20 °C [32]. For this reason, no temperature corrections were made for Ea. Bending strength (fm) and global modulus of elasticity in bending (Em,g) were calculated from board’s Fw curve and local modulus of elasticity in bending (Em,l) from board’s Fv curve according to EN 408 [65], but no corrections of static bending properties to 12% MC or 150 mm board height were made [68]. Work-to-maximum load (WML) was calculated as the area under the Fw curve between force 0 and Fmax divided by the loaded board volume. Time to failure (t) was taken as the time in seconds from start of test until Fmax, and deformation at maximum load (wmax) as global deflection at Fmax.

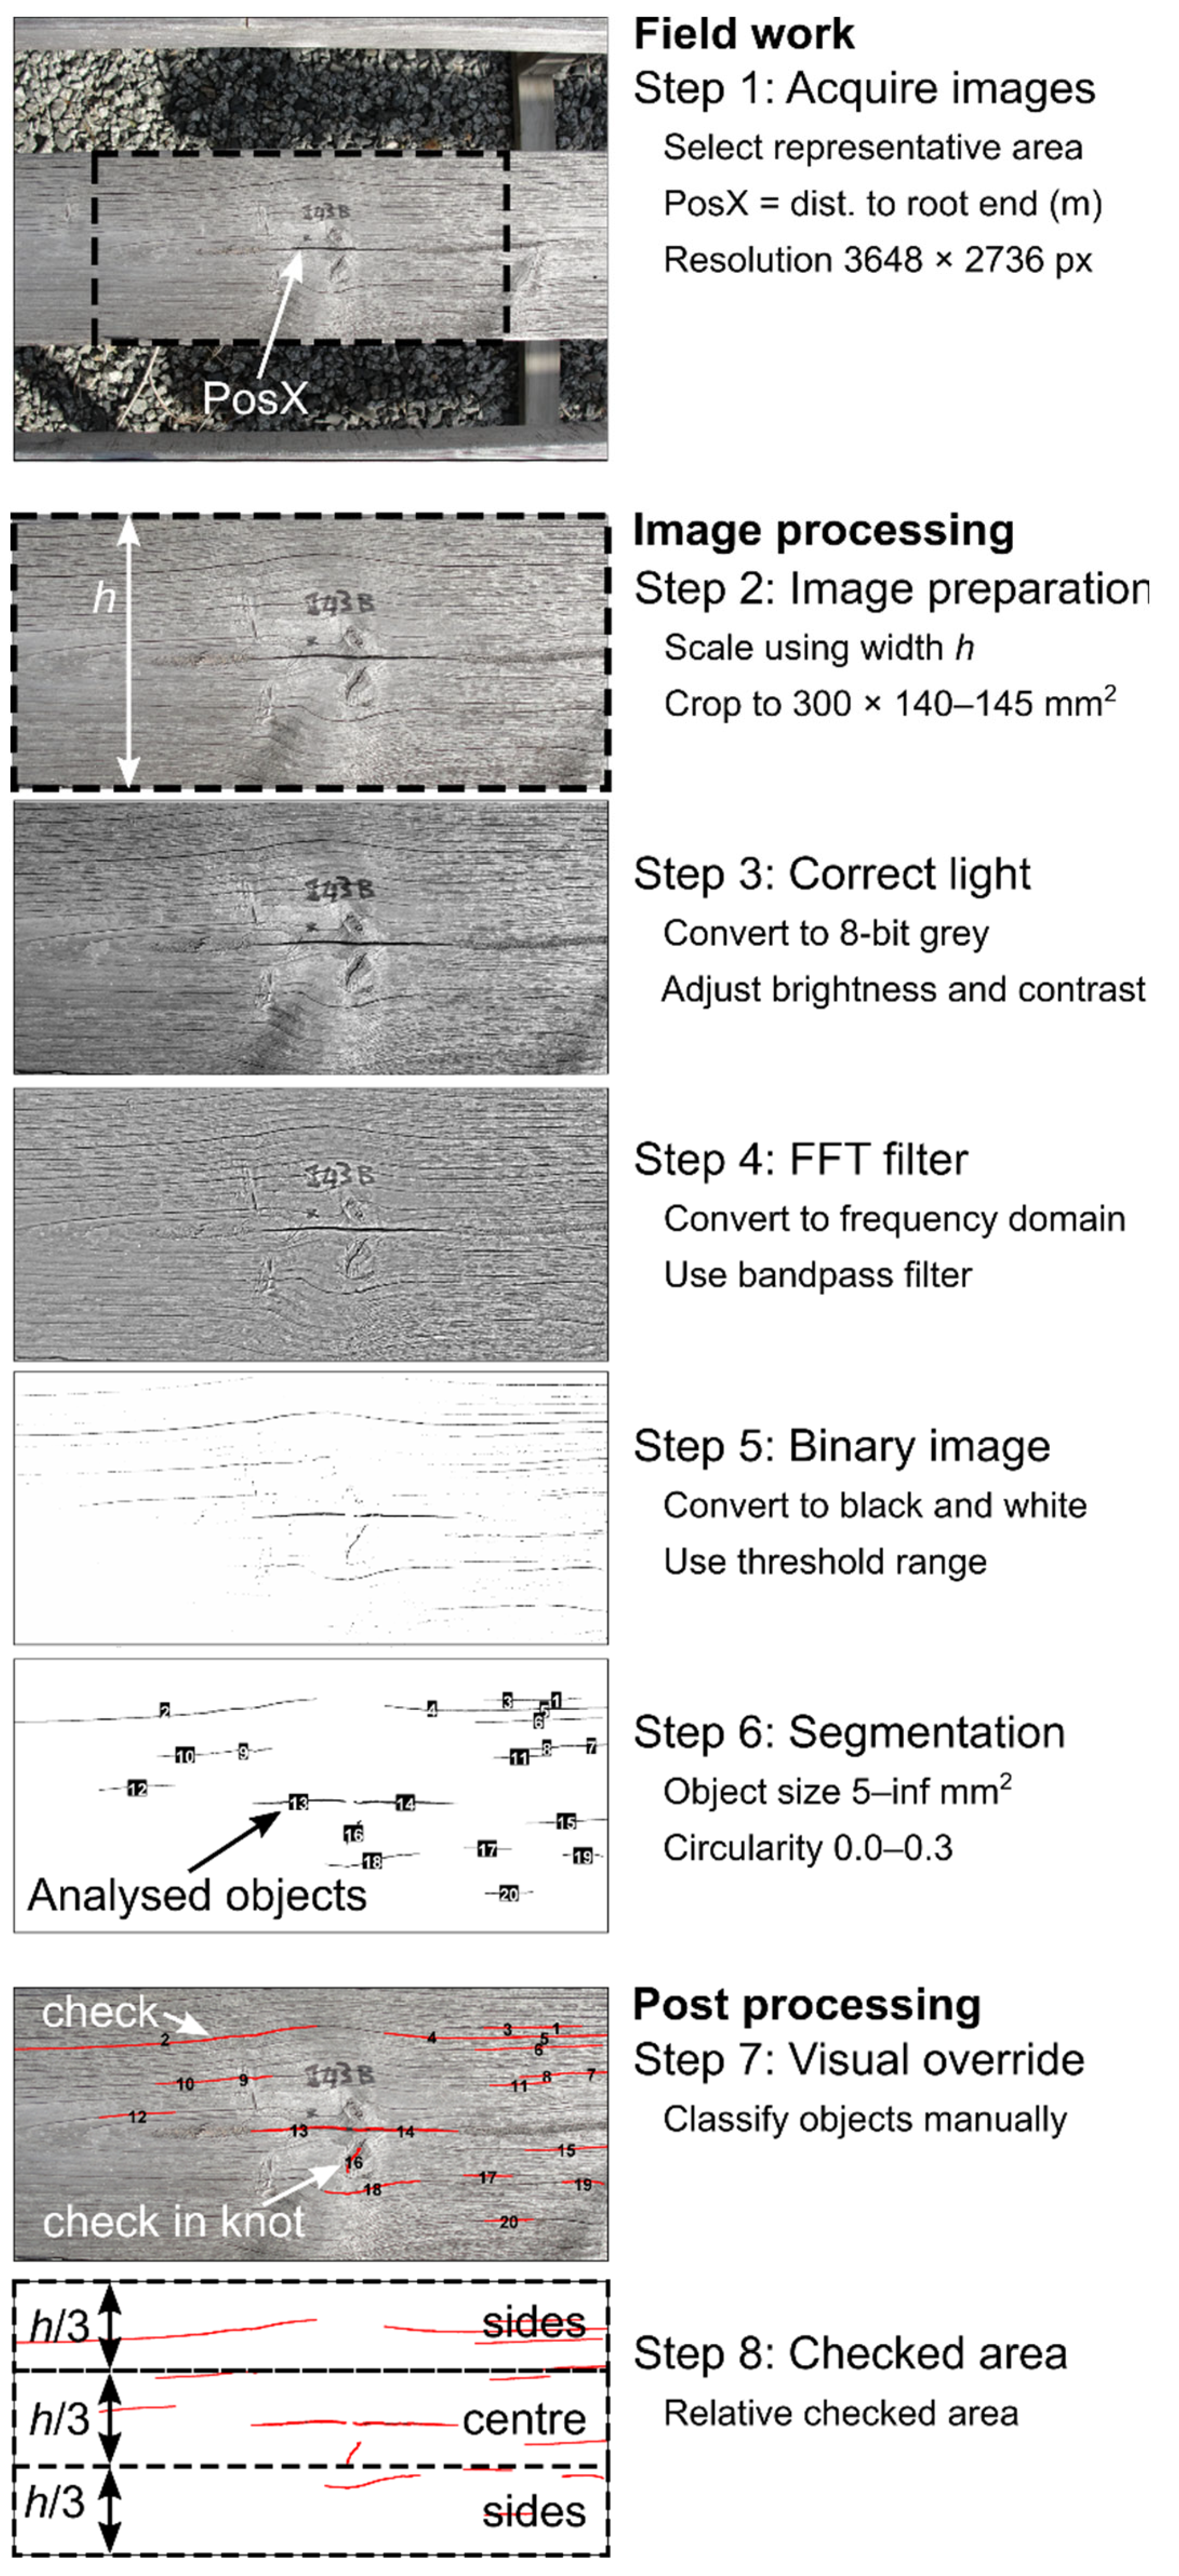
2.3.2. Digital Image Processing

All images were processed in ImageJ (Fiji) using a method developed to measure checking by means of digital photography (Figure 3) [59]. Images were scaled using board’s width (h), which was obtained at the time when the photo was taken, and cropped to 300 mm by 140–145 mm were PosX was the midpoint of this area (Figure 3, step 2). The resolution after cropping was between 2000 × 1000 and 3000 × 1500 pixels. No corrections for perspective and/or lens distortion were made. To correct for different ambient light conditions between photos, images were converted into 8-bit grey scale and brightness and contrast were adjusted to absolute levels of black and white on the object (Figure 3, step 3). Pixels were grouped into discrete regions by means of segmentation to distinguish checks from other features, such as colour differences (caused by e.g., earlywood and latewood) and/or shade (caused by rough weathered surfaces and sunlight) on the board surface. First, images were converted into the Fourier frequency domain by using a bandpass filter to remove noise and emphasize edges. Large structures were filtered down to 29 pixels and small structures up to 2 pixels (Figure 3, step 4). The image was converted into a ‘binary’ image to separate objects of interest from background by using a threshold range (ImageJ, threshold 0–25). All pixels above the threshold were set to white and all pixels below to black (Figure 3, step 5). The noise left after processing was removed in the following steps by including only larger and slender objects (i.e., ‘larger’ sized checks), and manual operations. First, checks were identified by automatic particle counting removing objects with areas smaller than 5 mm2 and a circularity, i.e., defined as 4 pi·(area/perimeter2), larger than 0.3 (Figure 3, step 6). Area in mm2 and the position of centre of mass of each object were exported, and outlines of objects plotted over original images (ImageJ, Region of Interest [ROI] manager) and used for post-processing. Then, objects were classified manually as check, check in knot, resin pockets or measurement error (Figure 3, step 7). The relative checked area, i.e., the total checked area divided by total area of the evaluated region in percentage, was calculated for the whole region and the centre and sides of this region for each board in Matlab® (version R2018a) (Figure 3, step 8). Checks in knots, resin pockets and measurement errors were excluded when calculating the total checked area. Low quality images were removed from the data set.
Checks may grow in size upon seasoning, modification or in service life. The separation is permanent and it is, therefore, assumed that the checked area only increases by time. This minimises fluctuations in board’s degree of checking between intervals due to differences in MC or image quality (e.g., images taken inside were of lesser quality than the ones taken in the field), and allows for better analysis of development of checks by exposure time.

2.3.3. Statistics

For all samples sets, normal distribution of data was verified using a normal probability plot and Shapiro–Wilk test at significance level 0.05. Analysis of variance (ANOVA) was used to determine the significance of exposure, treatment and/or board orientation on NDT and 4PB properties. A dependent t-test was used to compare mean values of NDT properties before and after exposure of ‘exposed’ control or TM boards. An F-test and independent t-test were used to compare variation and mean values of NDT and 4PB properties between boards tested ‘directly’ and ‘exposed’ or between control and TM boards. Data on checks in cross-sections were not normally distributed as was emphasized earlier by Sandberg [46] for length and area of checks. Therefore, a Wilcoxon rank sum and Kruskal–Wallis test were used to compare mean values of the number and maximum depth of checks in boards’ cross-sections between ‘exposed’ control and TM boards, and between groups (i.e., pith up, bark up or edge), respectively. To make samples sets tested ‘directly’ and ‘after exposure’ as comparable as possible in terms of number of specimens and distribution, a subset of 84 control and 84 TM boards was taken from the 100 control and 100 TM boards that were tested ‘directly’ (Figure 1). The selection aimed for a comparable distribution of Ea,res between sample sets, since Ea,res is the best single predictor of static bending properties of unmodified and TM timber of spruce [21,22]. Mean and standard deviation values were used to describe the level and variation of NDT and 4PB properties. For measures of checking, mean values were calculated. All calculations and statistics were done in Matlab®.

3. Results and Discussion

3.1. Degree of Checking

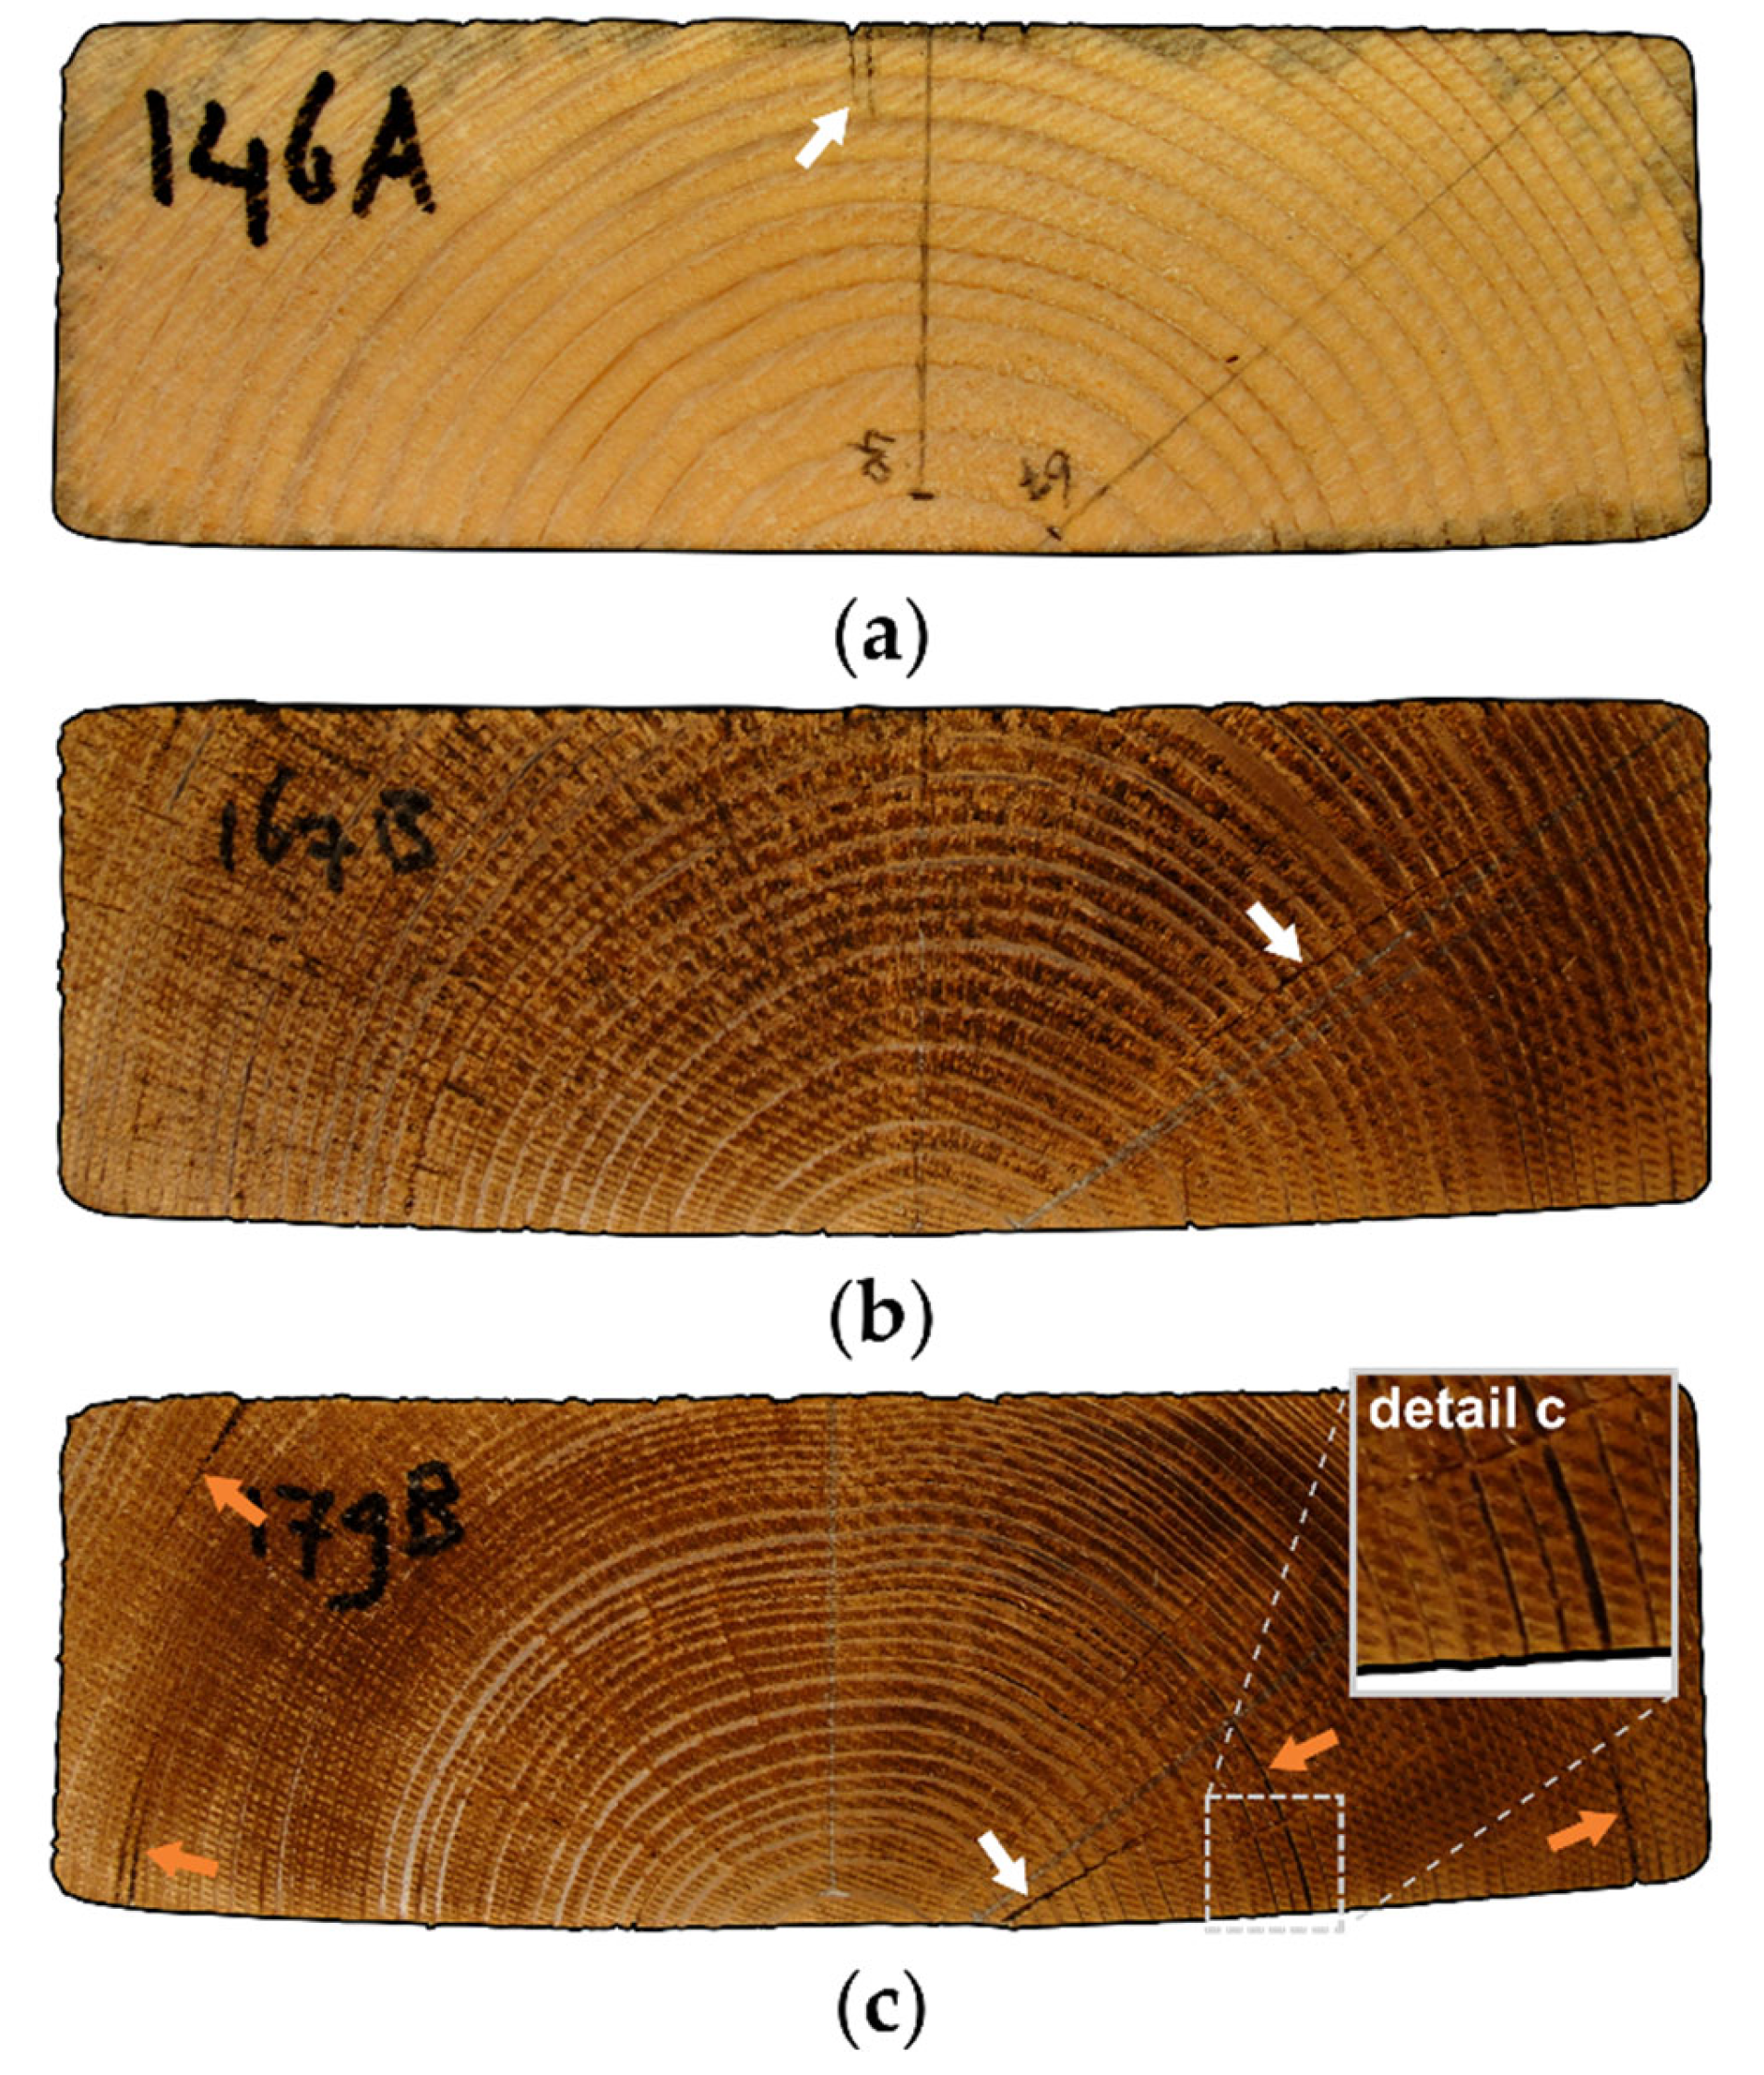
3.1.1. Board Cross-Section

Mean values of number of observations and maximum depth of checks along or across growth rings on the pith side, bark side or in the core of ‘exposed’ control and TM boards are shown in Table 3. The table also shows percentage occurrence of boards with checks in the cross-section per sample, because boards with cross-sections free of checking were excluded when calculating mean values. Examples of checks across (white arrows) and along (orange arrows) growth rings in boards’ cross-sections after weathering are shown in Figure 4.
Checks across growth rings occurred more often in TM boards than control boards and were more common on the bark side than on the pith side (Table 3). This is consistent with a previous study wherein surface checking of spruce and pine TMT was evaluated after 3 wetting cycles [49]. The maximum depth of checks across rings was equal between TM and control boards on the bark side, but on the pith side, checks were significantly deeper for TM than control boards (Table 3). Twenty seven percent (27%) of the TM boards enclosed pith within the cross-section, whereas this was only 6% for control boards. This may explain why checks across rings on pith sides occurred more often and were larger for TM boards, since checking is more severe when pith is present [46,47]. Table 3 also shows that, in contrast to control boards, approximately 20% of the TM boards had internal checks across growth rings. These internal checks were on average considerably larger than checks found at the board’s surfaces. Severe internal checking after weathering of TM spruce has not been reported by others [49,55], but is known to occur after the modification process especially when pith is enclosed within the cross-section [50]. Checks across growth rings and internal checks are shown as examples in Figure 4a,b, respectively.
Checks that had developed along growth rings were most often recorded on the pith side of TM boards (Table 3). This finding is in line with assessments made on TM spruce panels after 4 years of use [55]. These checks appeared also in control boards after weathering because of longitudinal separation of wood fibres in the tangential direction, but had then propagated only a few mm into the board. In detail, checks along growth rings in TM boards were on average 2–3 times deeper than for control boards (Table 3). Seven percent (7%) of the TM boards had checks along growth rings that developed over more than half the thickness of the timber, whereas this was 0% for control boards. Depending on their length, such deep checks are grade determining for untreated structural timber, specifically in load-cases where they may have a significant effect on strength such as shear strength of a beam [62]. Altgen et al. [49] did not find more checks along growth rings in TM than unmodified spruce and pine after 3 wetting cycles, and suggested that this could be explained by the absence of ultraviolet (UV) irradiation. However, Table 3 shows that number and maximum depth of checks along growth rings were statistically equivalent between the different groups for both flat sides of TM boards and the pith side of control boards, and thus did not depend on orientation or the presence of UV irradiation. Checks along growth rings on flat sides of a TM board are shown as an example in Figure 4c. Checks along growth rings were mainly found at the annual ring border on the pith side (radial surface) of boards (Table 3 and Figure 4, detail c). This is consistent with the location of checks found on the radial surface of unmodified wood of spruce and pine that was weathered for a period of 33 months [48]. However, no mention was made of checks that had developed between growth rings in previous studies on outdoor above-ground exposure of TMW for both natural and accelerated weathering tests [51,52,53,54].
The number of checks across rings was more or less similar between sample sets and flat sides, but in general higher for exposed surfaces (Table 3). On the other hand, the number of checks along growth rings was higher on the pith side than the bark side, higher for TM than control boards, and seemed not to depend on board orientation. Maximum depth of checks did not depend on board orientation, with exception of the maximum depth of checks across rings on the bark side of control boards, which was greater for exposed surfaces (Table 3).

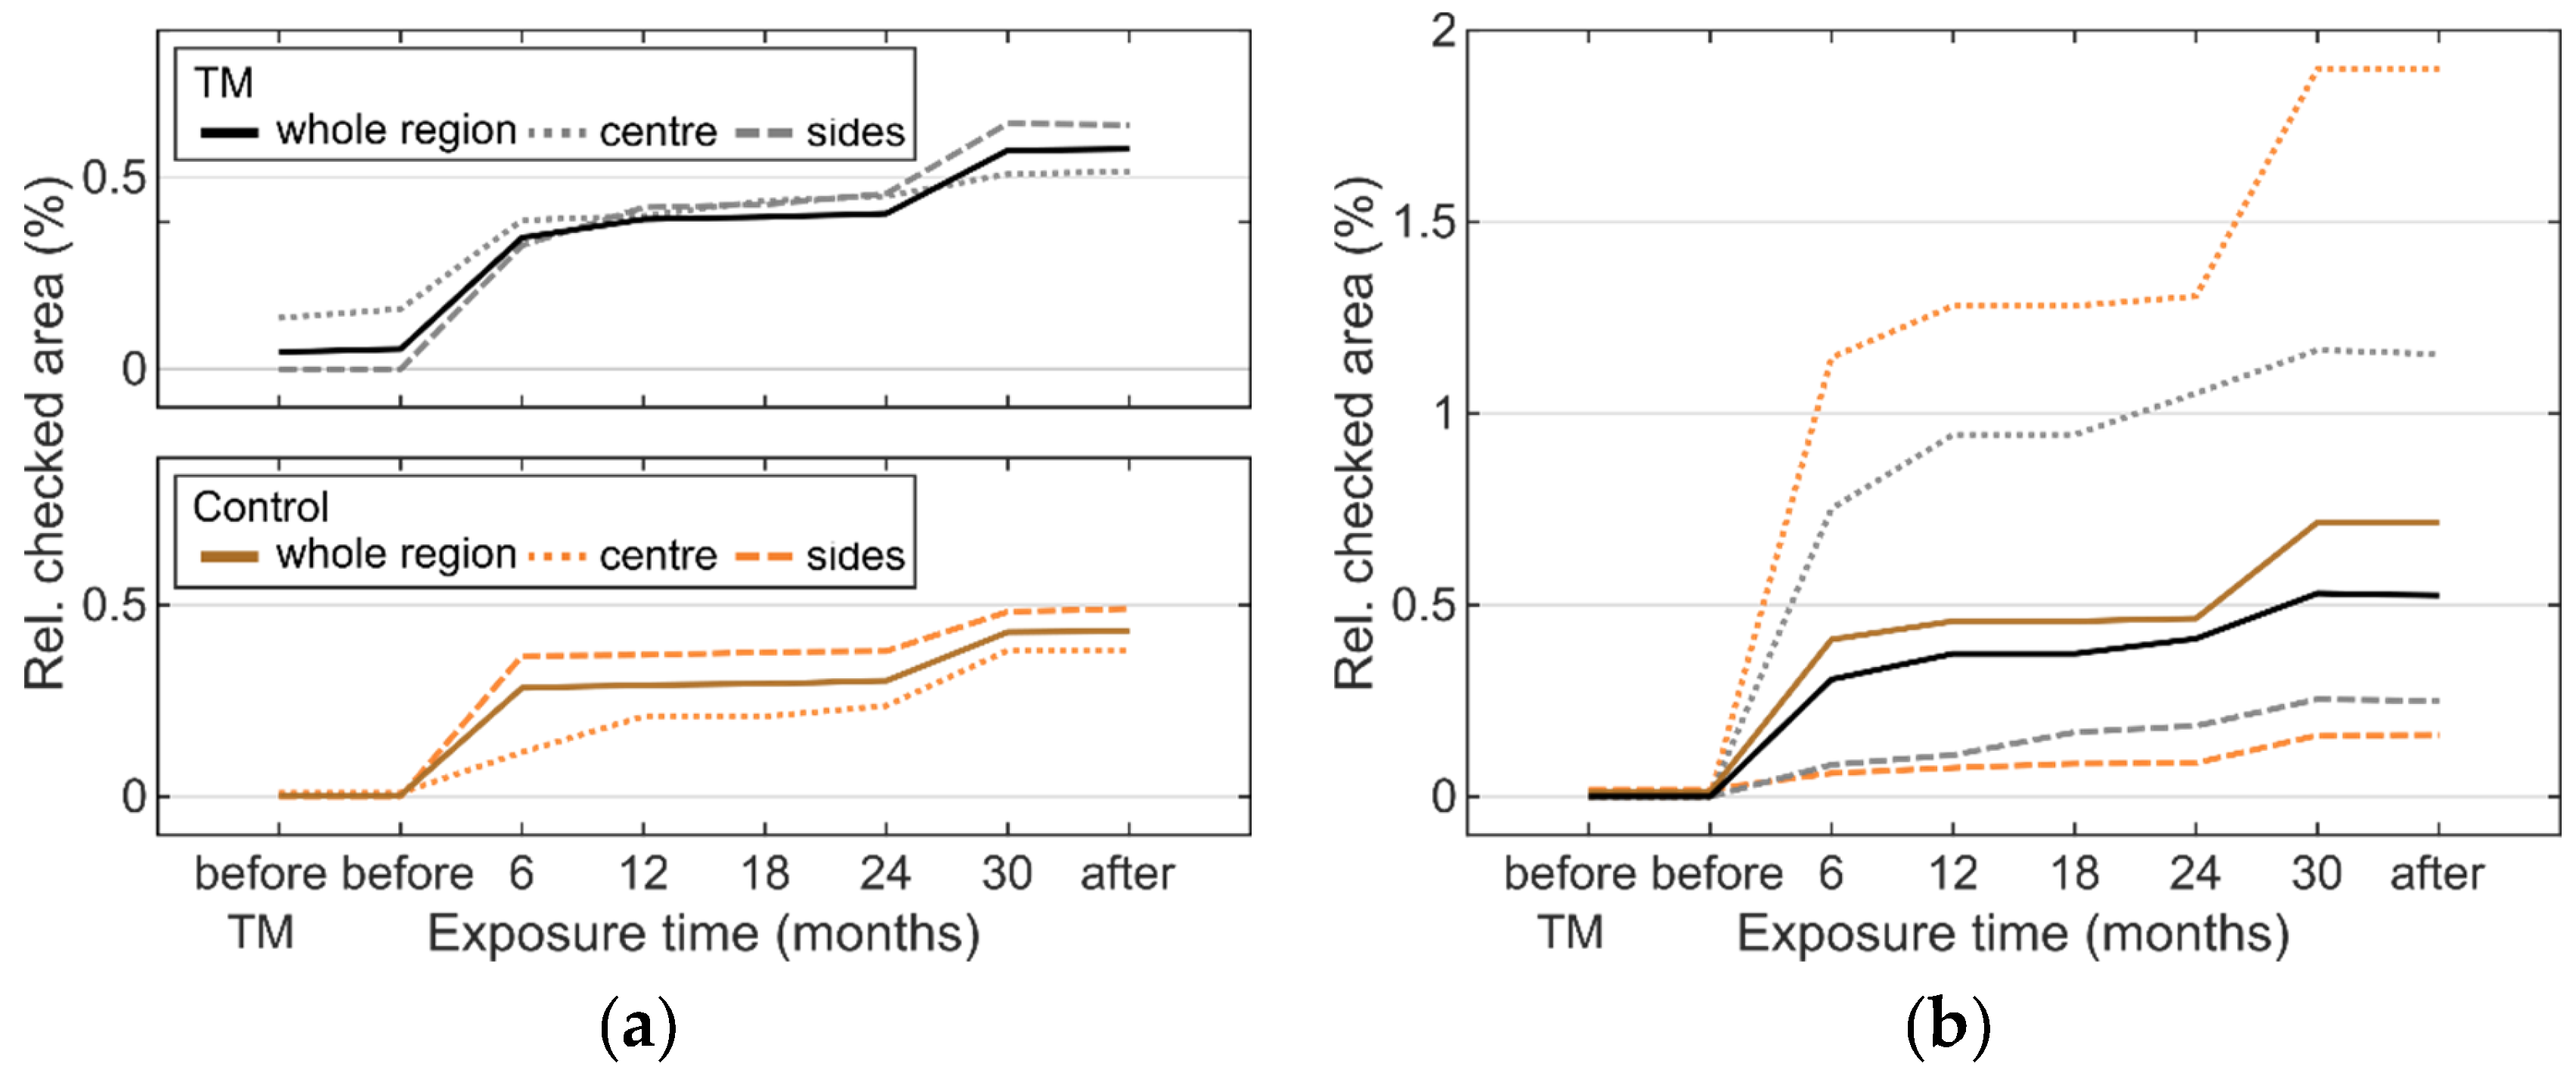
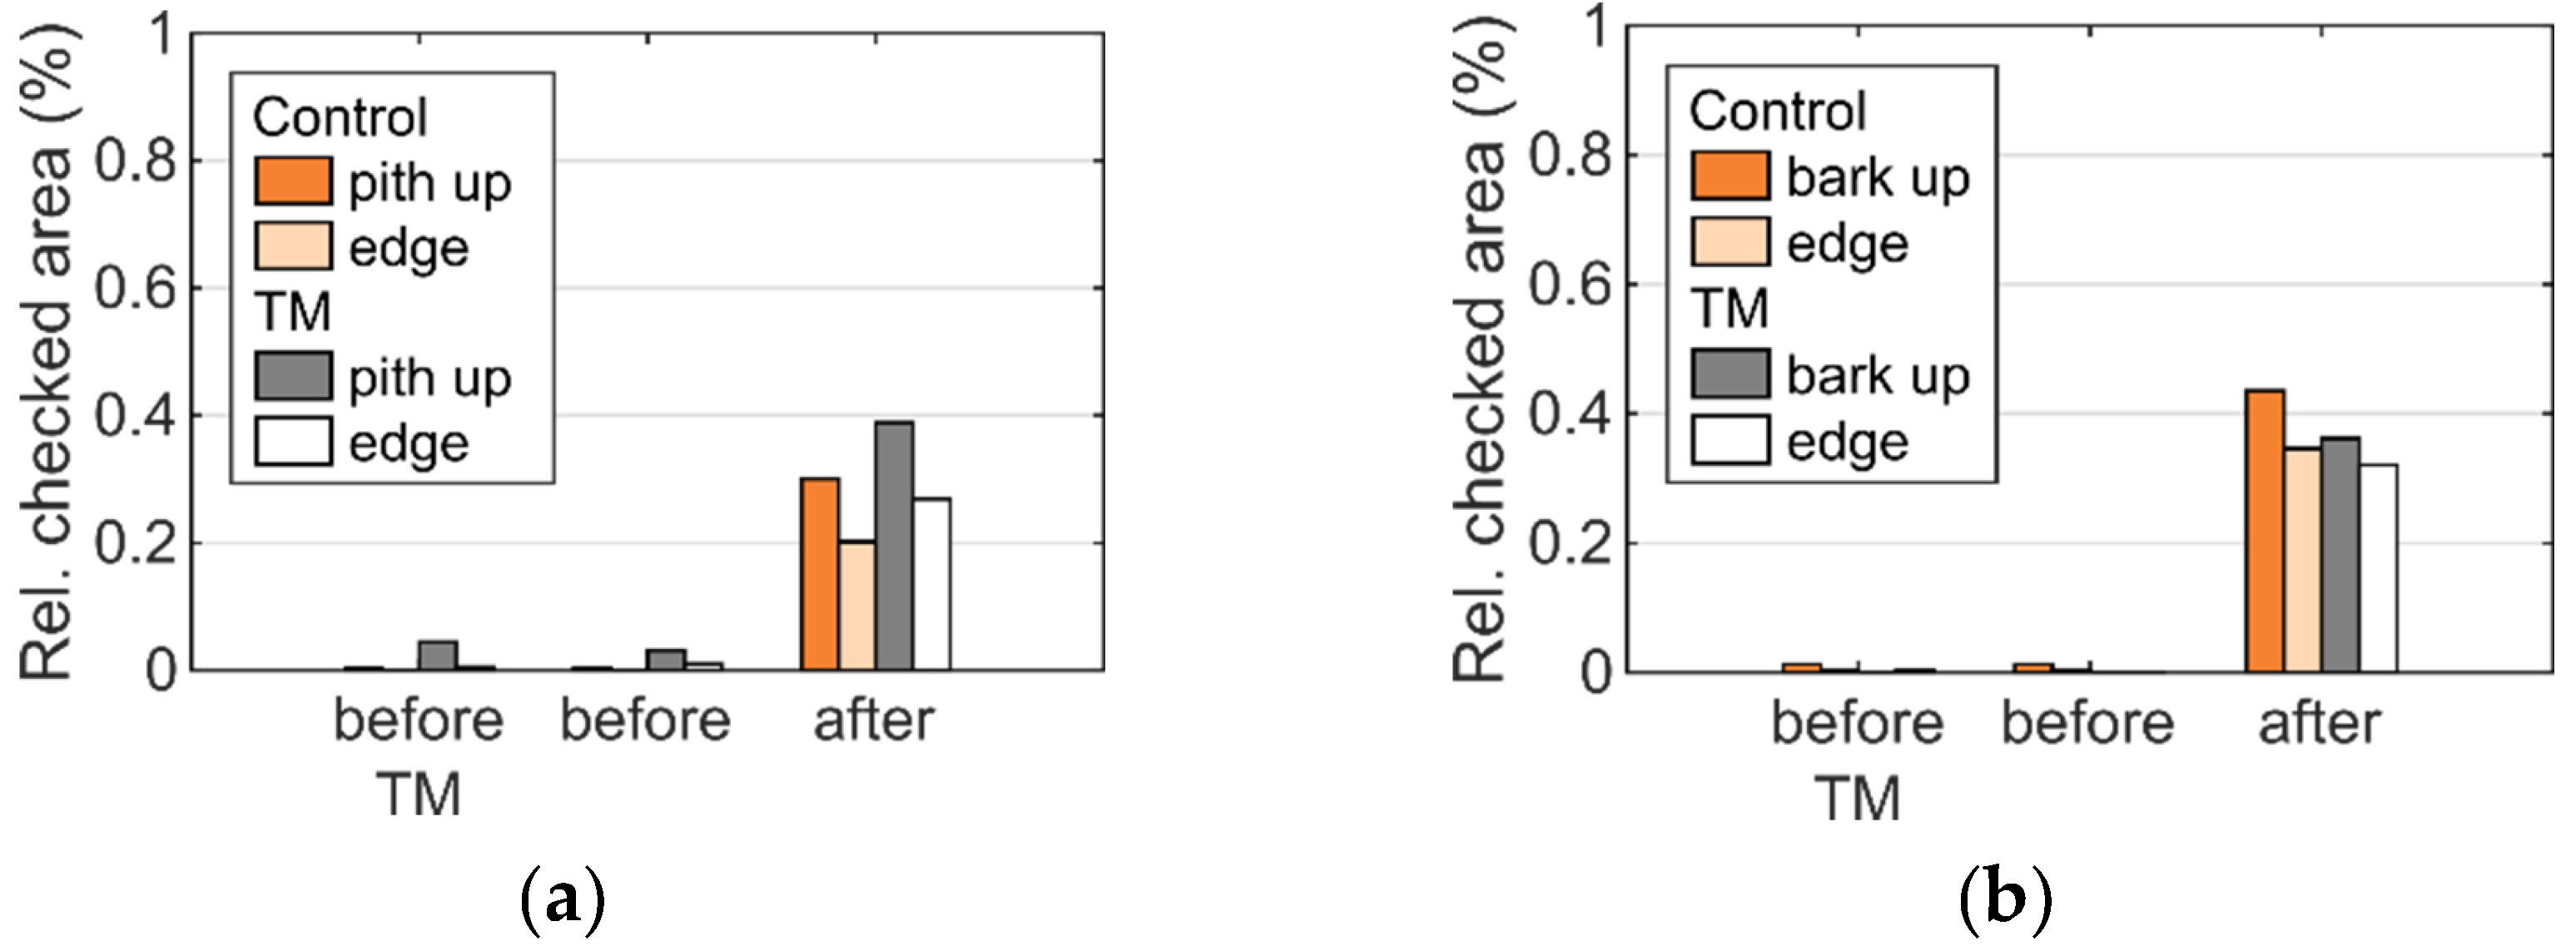
3.1.2. Board Surface: Digital Image Processing

The relative area of surface checks (%) by exposure time of ‘exposed’ control and TM boards determined by digital image processing is shown in Figure 5 for the pith side and bark side (boards exposed on their edge were excluded).
Before exposure, surface checks were mainly present on the pith side in the centre of TM boards close to the pith (Figure 5a, dotted grey line). These checks were already present before treatment, which is probably related to the fact that pith was enclosed more often in TM boards than control boards as discussed earlier. The relative area of surface checks was largest in the centre of control and TM boards on the bark side (Figure 5b, dotted lines). At this location, growth rings are orientated more or less parallel to the board’s surface and the tangential surface is exposed. Here, checks were formed primarily across growth rings (Figure 4a). It was shown earlier for unmodified spruce and pine wood that tangential surfaces have longer and wider checks, and a greater number of checks per unit area than corresponding radial surfaces, because of, inter alia, shrinkage anisotropy [48]. On the bark side, the area with surface checks was larger for control than TM boards. This was attributable to more severe checking (wider and/or longer checks) in the centre of control boards (Figure 5b, dotted orange vs. grey line), which is most likely caused by higher shrinkage and swelling coefficients of control boards compared to TM boards. In detail, the average radial and tangential swelling and shrinkage is 3–4% and 5–6% for Thermo-D spruce, and 3–5% and 6–9% for unmodified spruce, respectively [12,43,69]. The relative area of surface checks on the board’s pith side was larger for TM than control boards, both in the centre and at sides. Although differences were quite small, Figure 5a shows that for both control and TM boards the checked area was larger at board sides (dashed lines) than in the board’s centre (dotted lines) after 30 months of weathering. At the outer parts of a board on the pith side, growth rings are orientated more or less perpendicular to the board’s surface and the radial surface is exposed. Here, checks developed primarily along growth rings (Figure 4c). It was shown previously for unmodified spruce and pine wood that, on radial surfaces, checks are mainly formed at the annual ring border [48]. More checking at the outer parts on the pith side of TM boards compared to control boards is most likely because TMW exposed to weathering is more sensitive to delamination between growth rings [55], as discussed earlier (see again Table 3, checks along rings on pith side). The greatest increase in surface checking was observed after 6 months of weathering. After that, the relative area of surface checks increased at a slower rate (Figure 5). The plateau observed between month 12 and 24, and after exposure, was caused by the fact that boards were wet (i.e., boards were swollen and checks were closed) and/or because of bad light conditions (i.e., lower quality images). After 30 months of weathering, the relative area of surface checks was largest in the centre of boards on the bark side and at the sides of boards on the pith side, both for control and TM boards (Figure 5).
Results on surface checking from digital image processing were in line with checks measured in the cross-section. However, by using image processing to assess the degree of surface checking, it was shown that the checked area on the bark side is larger for control boards compared to TM boards, and vice versa on the pith side. Figure 6 shows that the relative checked area after weathering was less on both the pith and bark side of boards exposed on their edge compared to boards exposed flatwise.

3.1.3. Board Surface: Visual Assessment

On average, the relative length of deep checks was much larger for TM than control boards after weathering, in particular on the pith side (Figure 7). This is consistent with the results presented in Table 3 and Figure 5. The relative length of deep checks clearly increased for TM boards due to outdoor exposure. On the bark side, this was already noticeable during exposure, whereas on the pith side this was only clear after exposure when boards were conditioned. Cracks were only reported at board ends (i.e., splits), did not change much upon weathering, and were of similar length for control and TM boards after weathering (Figure 7). Splits were on average not longer than 2% of total board length, i.e., 0.1 m for a board of 4.8 m, and within limits given in EN 14081-1 [62] for untreated structural timber. It is safe to assume that these cracks located at timber ends will not affect bending stiffness and/or strength, which was determined at least 900 mm from board ends. However, they may have considerable effect on other load situations such as the capacity of connections when these are located at timber ends.
Results in Figure 7 are shown for all groups (pith up, bark up and edge), because no clear effect of board orientation was found on splits and deep checks as concluded earlier for maximum depth of checks in the cross-section. The spread in data between time intervals in Figure 7 is explained by different levels of board’s MC between intervals and/or human error [59]. For example, field trials showed that checks in glulam beams of spruce may close within 30 minutes when RH increases and check size may change multiple times a day [59]. Since the surface of checks is often irregular [48], the feeler gauge may get stuck while assessing the depth of checks. This may have led to underestimations of check depth.

3.2. Board Properties

Table 4 shows mean, standard deviation and coefficient of variation (CoV) values for various properties of control and TM boards tested directly, and before and after exposure. Average board density (ρ) was approximately 460 kgm−3 for control boards and 420 kgm−3 for TM boards. Moisture content (MC) at the time of testing was significantly different after exposure compared to boards tested directly or before exposure for both control and TM boards, whereas all boards were stored under similar conditions prior to testing. These differences were not larger than approximately 0.5% for control boards, but almost 2% for TM boards. The reason for this may be the increase in equilibrium moisture content (EMC) of thermally modified wood after exposure to high humidity levels [1]. Mean values of modulus of elasticity (MOE) and bending strength (fm) ranged between 10–13 GPa and 41–43 MPa for control boards and 10–13 GPa and 23–25 MPa for TM boards, respectively (Table 4). The levels and variation of ρ, MOE and fm of control boards shown in Table 4 are typical for Norway spruce timber coming from Sweden at 12% MC [70,71,72]. Treatment has a significant effect on mean ρ and fm of timber (independent t-test, α = 0.05), which are approximately 8–10% and 40–45% lower for Thermo-D spruce timber compared to unmodified spruce timber (Table 4). Similar reductions in material properties were obtained by others for thermally modified timber of spruce, pine and beech [71,73]. The non-destructive test (NDT) and 4-point static bending (4PB) properties of the 100 control and 100 TM boards tested ‘directly’ (see again Figure 1) were compared in detail by van Blokland et al. [21,22], and was not within the scope of the present study. With exception of acoustic velocity from Tof (va,res), no statistical differences in NDT properties were found between boards tested directly and before exposure for both control and TM boards (Table 4). That is, sample sets ‘direct’ and ‘exposed’ were comparable before weathering.

3.2.1. Non-Destructive Tests

Mean values of axial dynamic elastic moduli (Ea) and moisture content (MC) of ‘exposed’ control and TM boards are shown in Figure 8 for the measurement intervals. During weathering, levels of average MC were considerably higher and ranged between 13–23% for control boards and 8–12% for TM boards. These variations between spring and autumn measurements were smaller for TM than control boards, due to the improved hygroscopic properties of Thermo-D spruce wood [1,12]. Mean values of Ea for both sample sets were between 13.5–15 and 11–12.5 GPa for Tof and resonance-based measurements, respectively (Figure 8). This difference in level of Ea between dynamic test methods is in line with the literature, which reports that axial dynamic stiffness in timber is typically overestimated 10–20% by Tof [25,74], and previous test results on 100 control and 100 TM boards tested ‘directly’ [22]. Levels of mean Ea and MC of control and TM boards were inversely related (Figure 8a), and are consistent with established Ea–MC relationships for unmodified timber [33,75,76]. Significant differences in mean values of Ea,tof and Ea,res were found between measurement intervals for control boards (one-way ANOVA, p < 0.001), but not for TM boards (one-way ANOVA, p > 0.05) (Figure 8b). After adjusting dynamic elastic moduli of control boards to 12% MC (Figure 8c), no significant differences in mean values of Ea,res,12 and Ea,tof,12 between measurement intervals were found (one-way ANOVA, p > 0.05). Adjustment factors for TMT have not been established, but it has been shown that the influence of MC on static bending properties is less for TM small clear wood specimens compared to unmodified reference specimens [77]. This is consistent with smaller fluctuations of Ea,res and Ea,tof for TM boards compared to control boards, and no other trends were observed in Figure 8. Overall, the axial dynamic stiffness of TM and unmodified spruce timber did not change during 30 months of weathering in South Sweden. This is consistent with earlier research into the effect of 4 months of natural weathering on Ea of small clear wood of spruce [78].
Before and after exposure (i.e., when boards were conditioned), differences in MC at the time of testing were smaller than during weathering for both control and TM boards (Table 4 and Figure 8a). Thus, NDTs taken at these time intervals are most suitable to assess if board properties have been affected by weathering. For control boards, differences in mean density (ρ) and acoustic velocity (va) were less than 0.3% between before and after exposure and not significant for ρ and va,res (Table 4). These differences were larger and significant for TM boards, and ρ was 1.2% higher and va 1.7% lower after exposure compared to before exposure. The increase of ρ for exposed TM boards after weathering was noticeable over the full density range and attributable to the higher MC after exposure as discussed earlier. Values of va were also systematically lower. In addition to the higher MC after exposure, this difference may be attributed in some parts to the formation of checks after weathering [33,79,80]. However, the differences in MC at the time of testing make comparisons difficult, especially since differences in va were small as well. Acoustic velocity in axial direction remains largely unaffected by checking (Table 4), because the formation of checks is mainly along the grain and these openings in the wood do not obstruct stress waves [79]. Measurements of velocity across the grain have been proven useful for detection of checks, whereas velocity determined along the grain gives most accurate predictions of board’s bending properties [80].

3.2.2. Board Properties

Bending strength of control and TM boards tested directly and after exposure is shown in Figure 9 in a cumulative percentage diagram. The 5th percentile of bending strength (fm,05), and mean value of bending strength (fm,mean) are indicated in the diagram. Levels of fm,05 were 23.3 and 21.5 MPa for control boards and 10.8 and 10.2 MPa for TM boards tested directly and after exposure, respectively, and slightly lower after weathering. On average, bending strength (fm) was 6% lower for control boards and 9% lower for TM boards after weathering (Table 4 and Figure 9), and bending stiffness (Em,g) was 4% lower after weathering for both sample sets (Table 4). A t-test points out that the effect of weathering on mean fm and Em,g is not significant at the standard significance level of 0.05 (Table 4). Thus, 30 months of outdoor above-ground exposure has no significant effect on bending strength and stiffness of TM spruce timber. A similar conclusion was drawn by Boonstra et al. [60] who determined bending strength and stiffness of thermally modified terrace planking after 3 years of weathering. Exposed TM boards reached failure quicker than TM boards that were tested directly, whereas no such differences in time to failure (t) and deformation at maximum load (wmax) were found for control boards (Table 4). In detail, t and wmax and were on average 145 s and 25 mm for directly tested TM boards and 133 s and 23 mm for exposed TM boards, respectively.
Figure 10 shows work-to-maximum load (WML) of control and TM boards tested directly and after weathering. WML is plotted on the y-axis: left for control and right for TM boards. Note that mean WML is approximately 70% lower for TM boards compared to control boards, as was shown earlier by others for specimens of small clear wood [15,17], and discussed in detail by van Blokland et al. [21] for the 100 control and 100 TM boards tested directly (Figure 1). Mean WML of TM boards was approximately 14% lower after weathering compared to TM boards tested directly, but this difference was not consistent over the full range of boards and not significant (Table 4 and Figure 10). This decrease could have been expected, since fm and wmax were lower and Em,g remained unchanged after weathering (Table 4), and Fw curves of TMT are linear up to point of failure [21]. In contrast, lower fm,mean of control boards after weathering with corresponding equal levels of mean WML can be explained by a (small) increase in wmax and non-linearity in the bending behaviour that is typical for about 40% of Norway spruce timber coming from Sweden [21].
In a preceding investigation, four different types of load-deflection (Fw) curves have been distinguished for unmodified and TM spruce timber: 1) sudden failure, 2) preliminary failure prior to failure, 3) non-linearity prior to failure, and 4) preliminary failures and non-linearity prior to failure [21]. Table 5 shows how many control and TM boards tested directly and after weathering behaved according to each curve type in percentage frequency of occurrence. With the exception of one board, no non-linear behaviour was observed for TM boards, which is in line with previous results [21]. After weathering, more boards failed suddenly without preliminary failure or non-linearity observed in Fw curves, especially for TM boards. This is consistent with the earlier discussed decrease in WML.
Table 5 also shows failure type at maximum load (Fmax), defect at location of failure and type of fracture surface in percentage frequency of occurrence for each sample set tested in bending. After exposure, compression failure at Fmax was recorded for control and TM boards, while splinter tension (note: this failure mode is often combined with compression failure) became more common for control boards and horizontal shear failure more common for TM boards. Figure 11 shows examples of these three failure modes. These observations may be related to the presence of checks in boards after weathering. This was especially clear for failure in the compressive zone, which appears different in boards tested directly and after weathering (Figure 11a,b). After weathering, buckling of wood fibres due to compressive failure is combined with tensile failure perpendicular to the grain in the radial–longitudinal plane initiated at checks. This type of failure was governing 5% of the control boards and 2% of the TM boards after exposure, whereas it did not occur when boards were tested directly (Table 5). Horizontal shear failure at Fmax became more frequent for TM boards after weathering and is shown as example in Figure 11c. In line with previous studies, failure was still related to the presence of knots after weathering, and occurred more often through than around knots in TM than unmodified spruce timber [21,81]. However, failure through knots became more common for control boards after weathering (Table 5). This may be related to the fact that knots in control boards checked upon weathering, whereas knots of TMT were already checked before weathering i.e., during thermal modification. The fracture surface on the tension side appeared more often brash for TM boards compared to control boards, before as well as after weathering (Table 5).
Coefficients of determination (R2) incl. lower and upper bound at the 95% confidence interval of relationships between NDT properties, and bending strength and stiffness of control and TM boards tested directly and after exposure are shown in Table 6. The results are in line with R2-values typically found for unmodified and TM spruce timber [21,22,26,72,82]. In general, R2-values for the relationship between static and dynamic stiffness (EaEm,g) are similar between control and TM boards, whereas those for relationships between static bending strength and dynamic stiffness (Eafm) are typically weaker after thermal modification (Table 6). This was concluded earlier by van Blokland et al. [22]. That work also showed that resonance-based methods give more accurate predictions of static bending properties, which is especially obvious for unmodified timber (Table 4). With the resonance-based approach, a large number of vibrations are generated and subsequently recorded. This results in a higher accuracy and repeatability of velocity measurements compared to time-of-flight methods [83]. The relationship between static bending properties and dynamic elastic modulus from resonance is shown as example in Figure 12. After weathering, the investigated relationships between NDT properties and fm were somewhat weaker in terms of R2 for TM boards, but stronger for control boards. This is explained by the standard deviations of fm, which were somewhat lower for TM boards and higher for control boards after weathering (Table 4 and Figure 12). The effect of weathering on relationships between NDT properties, and bending strength and stiffness of unmodified and TM spruce seems limited.

4. Conclusions

Thirty months of weathering had no significant influence on the static bending properties of thermally modified timber (TMT), but the number and size of checks were higher/greater in TMT than unmodified timber after weathering. In particular, checks along growth rings were deeper, longer and more common in TMT after weathering, especially on the pith side of boards. The maximum depth of these checks did not depend on board orientation (i.e., which side was exposed) and exceeded limits given in strength grading standards for 7% of the modified boards included in this study. On the bark side, checking occurred mainly across growth rings and was more common in TMT, but the depth was similar to unmodified timber and the area with checks smaller than in unmodified timber, especially in the board’s centre. Axial dynamic stiffness determined at time intervals did not confirm the increase in the degree of checking of TMT. Dynamic stiffness was more stable over time for TMT compared to unmodified timber, because the variation in moisture content over time was smaller for TMT as well. The presence of checks from weathering did influence failure modes in TMT; horizontal shear failure became more frequent and some boards failed in compression. Longer exposure periods are required for accurate service-life predictions. Effects of checks on transverse dynamic stiffness, shear strength and the capacity of connections (at timber ends) of TMT, and possibilities for classifying/predicting the degree of checking of TMT based on raw material characteristics should be further investigated.

Author Contributions

Conceptualisation, J.v.B. and S.A.; Methodology, J.v.B. and S.A.; Software, J.v.B.; Validation, J.v.B.; Formal Analysis, J.v.B.; Investigation—Laboratory work, J.v.B.; Investigation – Field work, J.v.B. and S.A.A. assisted; Resources, S.A.; Data curation, J.v.B.; Writing—Original Draft Preparation, J.v.B.; Writing—Review and Editing, J.v.B., S.A. and S.A.A.; Visualization, J.v.B.; Supervision, S.A.; Project Administration, J.v.B.; Funding Acquisition, S.A. All authors have read and agreed to the published version of the manuscript.

Funding

This research received funding provided by the Formas project “New aspects on the strength behaviour of thermally modified wood towards structural applications” (grant no. 942-2015-722, coordinator Prof. S. Adamopoulos).

Acknowledgments

The timber and thermal modification were provided by Stora Enso Timber AB, Sweden. Field tests were facilitated and climate data were provided by the Swedish Infrastructure for Ecosystem Science (SITES) at Asa Research Station. These climate data were extracted from the Reference climate monitoring program, which is run by the Unit for Field-based Forest Research at the Swedish University of Agricultural Sciences, Uppsala, Sweden. The apparatus for bending tests was provided by the Department of Building Technology, Linnaeus University, Växjö, Sweden.

Conflicts of Interest

The authors declare no conflict of interest.

Availability of data

The data included in this study are available on request.

Abbreviations

4PB4-point bending
Ea,resAxial dynamic stiffness based on va,res and ρ
Ea,tofAxial dynamic stiffness based on va,tof and ρ
Em,gModulus of elasticity (MOE) based on global deflections in static bending
Em,lMOE based on local deflections in static bending
fa,1Frequency of the first mode of axial vibration
fmStatic edgewise bending strength
MCMoisture content
NDTNon-destructive test
tTime to failure
TMThermally modified
TMTThermally modified timber
TMWThermally modified wood
TofTime-of-flight
va,tofAcoustic velocity based on Δt and board’s length L
va,resAcoustic velocity based on fa,1 and board’s length L
wmaxGlobal deflection at maximum load
WMLWork-to-maximum load in static bending
ΔtTime-of-flight of stress wave
ρAir-dry density of board

References

  1. Rowell, R.M.; Andersone, I.; Andersons, B. Heat Treatment. In Handbook of Wood Chemistry and Wood Composites; Rowell, R.M., Ed.; CRC Press LLC: Boca Raton, FL, USA, 2013; pp. 511–536. [Google Scholar]
  2. Militz, H. Thermal Treatment of Wood: European Processes and Their Background; International Reserach Group on Wood Protection: Stockholm, Sweden, 2002. [Google Scholar]
  3. Altgen, M.; Militz, H. Influence of process conditions on hygroscopicity and mechanical properties of European beech thermally modified in a high-pressure reactor system. Holzforsch 2016, 70, 971–979. [Google Scholar] [CrossRef]
  4. Larsson-Brelid, P. Benchmarking and State of the Art for Modified Wood; SP Research Institude of Sweden: Borås, Sweden, 2013. [Google Scholar]
  5. International ThermoWood Association. ThermoWood® Production Statistics 2019. Available online: https://asiakas.kotisivukone.com/files/thermowood.palvelee.fi/uutiset/Productionstatistics2019.pdf (accessed on 5 February 2020).
  6. Stod, R.-M. Retail Price ThermoWood® Thermo-D Spruce Wood, 14 October 2019.
  7. Welzbacher, C.R.; Rapp, A.O. Durability of thermally modified timber from industrial-scale processes in different use classes: Results from laboratory and field tests. Wood Mater. Sci. Eng. 2007, 2, 4–14. [Google Scholar] [CrossRef]
  8. Metsä-Kortelainen, S.; Paajanen, L.; Viitanen, H. Durability of thermally modified Norway spruce and Scots pine in above-ground conditions. Wood Mater. Sci. Eng. 2011, 6, 163–169. [Google Scholar] [CrossRef]
  9. Metsä-Kortelainen, S.; Viitanen, H. Durability of thermally modified sapwood and heartwood of Scots pine and Norway spruce in the modified double layer test. Wood Mater. Sci. Eng. 2017, 12, 129–139. [Google Scholar] [CrossRef]
  10. EN 335-2. Durability of Wood and Wood-Based Products—Definition of Use Classes—Part 2: Application to Solid Wood; European Committee for Standardization (CEN): Brussels, Belgium, 2006. [Google Scholar]
  11. Hill, C.A.S. Wood Modification: Chemical, Thermal and Other Processes; John Wiley & Sons, Ltd.: West Sussex, UK, 2006. [Google Scholar]
  12. International ThermoWood Association. ThermoWood Handbook; International ThermoWood Association: Helsinki, Finland, 2003. [Google Scholar]
  13. Rowell, R.M.; Ibach, R.E.; McSweeny, J.; Nilsson, T. Understanding decay resistance, dimensional stability and strength changes in heat treated and acetylated wood. In Proceedings of the 4th European Conference on Wood Modification, Stockholm, Sweden, 1 January 2009; pp. 489–502. [Google Scholar]
  14. Kubovský, I.; Kačíková, D.; Kačík, F. Structural changes of oak wood main components caused by thermal modification. Polymers 2020, 12, 485. [Google Scholar] [CrossRef] [PubMed] [Green Version]
  15. Stamm, A.J.; Horace, K.; Burr, K.; Kline, A.A. Staybwood—Heat-stabilized wood. Ind. Eng. Chem. 1946, 38, 630–634. [Google Scholar] [CrossRef]
  16. Windeisen, E.; Bächle, H.; Zimmer, B.; Wegener, G. Relations between chemical changes and mechanical properties of thermally treated wood. Holzforsch 2009, 63, 773–778. [Google Scholar]
  17. Kubojima, Y.; Okano, T.; Ohta, M. Bending strength and toughness of heat-treated wood. J. Wood Sci. 2000, 46, 8–15. [Google Scholar] [CrossRef]
  18. Boonstra, M.J.; Van Acker, J.; Tjeerdsma, B.F.; Kegel, E.V. Strength properties of thermally modified softwoods and its relation to polymeric structural wood constituents. Ann. For. Sci. 2007, 64, 679–690. [Google Scholar] [CrossRef] [Green Version]
  19. Tukiainen, P.; Hughes, M. The effect of elevated temperature and high moisture content on the fracture behaviour of thermally modified spruce. J. Mater. Sci. 2016, 51, 1437–1444. [Google Scholar] [CrossRef]
  20. Gaff, M.; Kačík, F.; Sandberg, D.; Babiak, M.; Turčani, M.; Niemz, P.; Hanzlík, P. The effect of chemical changes during thermal modification of European oak and Norway spruce on elasticity properties. Compos. Struct. 2019, 220, 529–538. [Google Scholar] [CrossRef]
  21. van Blokland, J.; Olsson, A.; Oscarsson, J.; Adamopoulos, A. Prediction of bending strength of thermally modified timber using high-resolution scanning of fibre direction. Eur. J. Wood Prod. 2019, 77, 327–340. [Google Scholar] [CrossRef] [Green Version]
  22. van Blokland, J.; Adamopoulos, A.; Olsson, A.; Oscarsson, J.; Källander, B. Evaluation of non-destructive test methods to predict bending properties of thermally modified timber. In Proceedings of the World Conference on Timber Engineering, Seoul, Korea, 20–23 August 2018. [Google Scholar]
  23. van Blokland, J.; Olsson, A.; Oscarsson, J.; Daniel, G.; Adamopoulos, A. Crack formation, strain distribution and fracture surfaces around knots in thermally modified timber loaded in static bending. Wood Sci. Technol. 2020. [Google Scholar] [CrossRef]
  24. Riggio, M.; Anthony, R.W.; Augelli, F.; Kasal, B.; Lechner, T.; Muller, W.; Tannert, T. In situ assessment of structural timber using non-destructive techniques. Mater. Struct. 2014, 47, 749–766. [Google Scholar] [CrossRef]
  25. Legg, M.; Bradley, S. Measurement of stiffness of standing trees and felled logs using acoustics: A review. J. Acoust. Soc. Am. 2016, 139, 588–604. [Google Scholar] [CrossRef] [Green Version]
  26. Sandoz, J.L. Grading of construction timber by ultrasound. Wood Sci. Technol. 1989, 23, 95–108. [Google Scholar] [CrossRef]
  27. Hanhijärvi, A.; Ranta-Maunus, A. Development of strength grading of timber using combined measurement techniques. Report of the Combigrade-project—Phase 2. VTT Publ. 2008, 686. Available online: https://www.vttresearch.com/sites/default/files/pdf/publications/2008/P686.pdf (accessed on 5 February 2020).
  28. Olsson, A.; Oscarsson, J.; Johansson, M.; Källsner, B. Prediction of timber bending strength on basis of bending stiffness and material homogeneity assessed from dynamic excitation. Wood Sci. Technol. 2012, 46, 667–683. [Google Scholar] [CrossRef]
  29. Kang, H.; Booker, R.E. Variation of stress wave velocity with MC and temperature. Wood Sci. Technol. 2002, 36, 41–54. [Google Scholar] [CrossRef]
  30. Yang, H.; Yu, L.; Wang, L. Effect of moisture content on the ultrasonic properties of wood. J. For. Res. 2015, 26, 753–757. [Google Scholar] [CrossRef]
  31. Green, D.W.; Evans, J.W.; Logan, J.D.; Allen, J. Temperature corrections for mechanically graded lumber. In Proceedings of the World Conference on Timber Engineering, Montreux, Switzerland, 17–20 August 1998; pp. 844–845. [Google Scholar]
  32. Chan, M.J.; Walker, C.J.; Raymond, C.A. Effect of moisture content and temperature on acoustic velocity and dynamic MOE of radiata pine sapwood boards. Wood Sci. Technol. 2011, 45, 609–626. [Google Scholar] [CrossRef]
  33. Unterwieser, H.; Schickhofer, G. Influence of moisture content of wood on sound velocity and dynamic MOE of natural frequency- and ultrasonic runtime measurement. Eur. J. Wood Prod 2011, 69, 171–181. [Google Scholar] [CrossRef] [Green Version]
  34. Llana, D.F.; Iñiguez-Gonzalez, G.; Arriaga, F.; Niemz, P. Influence of temperature and moisture content on non-destructive measurements in Scots pine wood. Wood Res. 2014, 59, 769–780. [Google Scholar]
  35. Baar, J.; Tippner, J.; Gryc, V. The influence of wood density on longitudinal wave velocity determined by the ultrasound method in comparison to the resonance longitudinal method. Eur. J. Wood Prod 2012, 70, 767–769. [Google Scholar] [CrossRef]
  36. Brancheriau, L.; Bailleres, H. Natural vibration analysis of clear wooden beams: A theoretical review. Wood Sci. Technol. 2002, 36, 347–365. [Google Scholar] [CrossRef]
  37. de Borst, K.; Bader, T.K.; Wikete, C. Microstructure-stiffness relationships of Ten european and tropical hardwood species. J. Struct. Biol. 2012, 177, 532–542. [Google Scholar] [CrossRef] [PubMed]
  38. Evans, P.D. Weathering of wood and wood composites. In Handbook of Wood Chemistry and Wood Composites; Rowell, R.M., Ed.; CRC Press: Boca Raton, FL, USA, 2013; pp. 151–216. [Google Scholar]
  39. Feist, W.C. Weathering of wood in structural uses. In Structural Use of Wood in Adverse Environments; Meyer, R.W., Kellogg, R.M., Eds.; Van Nostrand Reinhold Co.: New York, NY, USA, 1982. [Google Scholar]
  40. Feist, W.C.; Hon, D.N.-S. Chemistry of weathering and protection. In The Chemistry of Solid Wood; Rowell, R.M., Ed.; American Chemial Society: Washingion, DC, USA, 1984; pp. 401–450. [Google Scholar]
  41. Jirouš-Rajković, V.; Miklečić, J. Weathering resistance of modified wood—A review. Proceedings of Jubilee Annual 2017–2018 of the Croatian Academy of Engineering, Zagreb, Croatia; 2018; pp. 223–246. [Google Scholar]
  42. Kollmann, F.F.P.; Côté, W.A. Principles of Wood Science and Technology. I Solid Wood; Springer: New York, NY, USA, 1968. [Google Scholar]
  43. Tsoumis, G.T. Science and Technology of Wood: Structure, Properties, Utilization; Van Nostrand Reinhold: New York, NY, USA, 1991. [Google Scholar]
  44. Kollmann, F.F.P. Mechanics and rheology of wood. In Principles of Wood Science and Technology: I Solid Wood; Kollmann, F.F.P., Côté, W.A.J., Eds.; Springer: New York, NY, USA, 1968. [Google Scholar]
  45. Urban, K.; Evans, P.D. Preliminary Observations of the Effect of Growth Ring Orientation on the Surface Checking of Flat Sawn Southern Pine Decking; International Research Group on Wood Protection (IRG/WP): Bangalore, India, 2005. [Google Scholar]
  46. Sandberg, D. Radially sawn timber: The influence of annual ring orientation on crack formation and deformation in water soaked pine (Pinus silvestris L.) and spruce (Picea abies Karst.). Eur. J. Wood Prod 1997, 55, 175–182. [Google Scholar] [CrossRef]
  47. Sandberg, D. The influence of pith and juvenile wood on proportion of cracks in sawn timber when kiln dried and exposed to wetting cycles. Holz als Roh- Und Werkstoff 1996, 54. [Google Scholar] [CrossRef] [Green Version]
  48. Sandberg, D. Weathering of radial and tangential wood surfaces of pine and spruce. Holzforsch 1999, 53, 355–364. [Google Scholar] [CrossRef] [Green Version]
  49. Altgen, M.; Adamopoulos, S.; Militz, H. Wood defects during industrial-scale production of thermally modified Norway spruce and Scots pine. Wood Mater. Sci. Eng. 2017, 12, 14–23. [Google Scholar] [CrossRef]
  50. Johansson, D. Influences of drying on internal checking of spruce (Picea abies L.) heat-treated at 212 °C. Holzforsch 2006, 60, 558–560. [Google Scholar] [CrossRef]
  51. Feist, W.C.; Sell, J. Weathering behavior of dimensionally stabilized wood treated by heating under pressure of nitrogen gas. Wood Fiber Sci. 1987, 19, 183–195. [Google Scholar]
  52. Jämsä, S.; Ahola, P.; Viitaniemi, P. Long-term natural weathering of coated ThermoWood. Pigment. Resin Technol. 2000, 29, 68–74. [Google Scholar] [CrossRef]
  53. Dubey, M.K.; Pang, S.; Walker, J. Color and dimensional stability of oil heat-treated radiata pinewood after accelerated UV weathering. For. Prod J. 2010, 60, 453–459. [Google Scholar] [CrossRef]
  54. Miklečić, J.; Jirouš-Rajković, V.; Pervan, S.; Grujić, S. Oils usage in finishing of thermally modified wood in outdoor applications. In Proceedings of the Wood is Good—Transfer of Knowledge in Practice as a Way out of the Crisis, Zagreb, Croatia, 15 October 2010; pp. 89–96. [Google Scholar]
  55. Ala-Viikari, J.; Mayes, D. New generation ThermoWood®―How to take ThermoWood® to the next level. In Proceedings of the 4th European Conference on Wood Modification (ECWM), Stockholm, Sweden, 27–29 April 2009; pp. 23–29. [Google Scholar]
  56. EN ISO 4628-4. Paint and Varnishes—Evaluation of Degradation of Coatings—Designation of Quantity and Size of Defects, and of Intensity of Uniform Changes in Apparearance—Part 4: Assessment of Degree of Cracking; European Committee for Standardization (CEN): Brussels, Belgium, 2016. [Google Scholar]
  57. Stirling, R. Natural Durability Classification Systems Used Around the World; International Research Group on Wood Protection: Beijing, China, 2009. [Google Scholar]
  58. Brischke, C.; Welzbacher, C.R.; Meyer, L.; Bornemann, T.; Larsson-Brelid, P.; Pilgård, A.; Frühwald Hansson, E.; Westin, M.; Rapp, A.O.; Thelandersson, S.; et al. Service Life Prediction of Wooden Components—Part 3: Approaching a Comprehensive Test Methodology; International Research Group on Wood Preservation: Queenstown, New Zealand, 2011. [Google Scholar]
  59. Vorobyev, A. Non-Contact Computer Aided in-Field Surface Measuring Techniques of Cracks in Glued Laminated Beams; Luleå University of Technology: Luleå, Sweden, 2012. [Google Scholar]
  60. Boonstra, M.J.; Van Acker, J.; Kegel, E.V. Effect of a two-stage heat treatment process on the mechanical properties of full construction timber. Wood Mater. Sci. Eng. 2007, 2, 138–146. [Google Scholar] [CrossRef]
  61. Lamb, F.M. Splits and Cracks in Wood; Western Dry Kiln Association: Corvallis, OR, USA, 1992. [Google Scholar]
  62. EN 14081-1. Timber Structures—Strength Graded Structural Timber with Rectangular Cross Section—Part 1: General; European Committee for Standardization (CEN): Brussels, Belgium, 2016. [Google Scholar]
  63. EN 1912. Structural Timber—Strength Classes—Assignment of Visual Grades and Species; European Committee for Standardization (CEN): Brussels, Belgium, 2012. [Google Scholar]
  64. EN 13183-1. Moisture Content of a Piece of Sawn Timber—Part 1: Determination by Oven Dry Method; European Committee for Standardization (CEN): Brussels, Belgium, 2002. [Google Scholar]
  65. EN 408. Structural Timber—Structural Timber and Glued Laminated Timber—Determination of Some Physical and Mechanical Properties; European Committee for Standardization (CEN): Brussels, Belgium, 2012. [Google Scholar]
  66. ASTM D143-94. Standard Test Methods for Small Clear Specimens of Timber; ASTM International: West Conshohocken, PA, USA, 2000. [Google Scholar]
  67. INSTA 142. Nordic Visual Strength Grading Rules for Timber (in Swedish); Swedish Standards Institute (SIS): Stockholm, Sweden, 2010. [Google Scholar]
  68. EN 384. Structural Timber—Determination of Characteristic Values of Mechanical Properties and Density; European Committee for Standardization (CEN): Brussels, Belgium, 2016. [Google Scholar]
  69. Paulínyová, J.M.; Čunderlík, I. Chosen physical properties of spruce juvenile wood (Picea abies Karst). In Proceedings of the 5th IUFRO Symposium “Wood Structure and Properties ’06”, Sliač-Sielnica, Slovakia, 3–6 September 2006; pp. 93–97. [Google Scholar]
  70. Bengtsson, C.; Betzold, D. Bending strength and stiffness of Norway spruce timber—influence of high temperature drying. In Proceedings of the International Symposium on Wood Machining, Vienna, Austria, 27–29 September 2000; pp. 139–149. [Google Scholar]
  71. Bengtsson, C.; Jermer, J.; Brem, F. Bending Strength of Heat-Treated Spruce and Pine Timber; International Research Group on Wood Preservation: Cardiff, Wales, 12–17 May 2002. [Google Scholar]
  72. Ranta-Maunus, A.; Denzler, J.K.; Stapel, P. Strength of European Timber—Part 2. Properties of Spruce and Pine Tested in Gradewood Project; VTT: Esbo, Finland, 2011. [Google Scholar]
  73. Widmann, R.; Fernandez-Cabo, J.L.; Steiger, R. Mechanical properties of thermally modified beech timber for structural purposes. Eur. J. Wood Prod. 2012, 70, 775–784. [Google Scholar] [CrossRef] [Green Version]
  74. Niemz, P.; Mannes, D. Non-destructive testing of wood and wood-based materials. J. Cult. Herit. 2012, 13, 26–34. [Google Scholar] [CrossRef]
  75. Montero, M.J.; de la Mata, J.; Esteban, M.; Hermoso, E. Influence of moisture content on the wave velocity to estimate mechanical properties of large cross-section pieces for structural use of scots pine from spain. Maderas. Cienc. Y Tecnol. 2015, 17, 407–420. [Google Scholar] [CrossRef] [Green Version]
  76. Sandoz, J.L. Moisture content and temperature effect on ultrasonic timber grading. Wood Sci. Technol. 1993, 27, 373–380. [Google Scholar]
  77. Arnold, M. Effect of moisture on the bending properties of thermally modified beech and spruce. J. Mater. Sci. 2010, 45, 669–680. [Google Scholar] [CrossRef] [Green Version]
  78. Oberhofnerová, E.; Arnetová, K.; Holeček, T.; Borůvka, V.; Bomba, J. Determination of correlation between destructive and nondestructive test methods applied on modified wood exposed to natural weathering. BioResources 2016, 11, 5155–5168. [Google Scholar] [CrossRef]
  79. Ceccotti, A.; Togni, M. NDT on ancient timber beams: Assessment of strength/stiffness properties combining visual and instrumental methods. In Proceedings of the 10th International Symposium on Nondestructive Testing of Wood, Lausanne, Switzerland, 26–28 August 1996; pp. 379–388. [Google Scholar]
  80. Kasal, B.; Lear, G.; Tannert, T. Stress waves. In In Situ Assessment of Structural Timber; Kasal, B., Tannert, T., Eds.; Springer: Dordrecht, The Netherlands, 2011; Volume 7. [Google Scholar]
  81. Johansson, C.-J.; Boström, L.; Bräuner, L.; Hoffmeyer, P.; Holmquist, C.; Solli, K.H. Laminations for Glued Laminated Timber—Establishment of Strength Classes for Visual Strength Grades and Machine Settings for Glulam Laminations of Nordic Origin; SP Swedish National Testing and Research Institute: Borås, Sweden, 1998; p. 38. [Google Scholar]
  82. Olsson, A.; Oscarsson, J. Strength grading on the basis of high resolution laser scanning and dynamic excitation: A full scale investigation of performance. Eur. J. Wood Prod 2017, 75, 17–31. [Google Scholar] [CrossRef] [Green Version]
  83. Wang, X. Acoustic measurements on trees and logs: A review and analysis. Wood Sci. Technol. 2013, 47, 965–975. [Google Scholar] [CrossRef]
Figure 1. Preparation of boards, and boards used for non-destructive tests (NDTs) and 4-point static bending (4PB) tests.
Applsci 10 03975 g001
Figure 2. Control boards (light) and thermally modified (TM) boards (dark) placed on racks at the start of weathering: (a) overview, (b) detail of board positioned on its edge, and (c) detail of board positioned flat.
Applsci 10 03975 g002
Figure 3. Checking measured by means of a digital image processing method involving 8 steps.
Applsci 10 03975 g003
Figure 4. Examples of checks across (white arrows) and along (orange arrows) growth rings in crosscuts of ‘exposed’ boards after weathering: (a) control board with checks across rings on bark side, (b) TM board with internal checks across rings and (c) TM board with checks along and across annual rings on pith and bark side.
Applsci 10 03975 g004
Figure 5. Mean relative area of surface checks (% of total investigated area) from digital image processing of ‘exposed’ control and TM boards by exposure time: (a) pith side (group 1: pith up) and (b) bark side (group 2: bark up) [legend in a].
Applsci 10 03975 g005
Figure 6. Mean relative area of surface checks (% of total investigated area) from digital image processing of ‘exposed’ control and TM boards before and after exposure per group: (a) pith side (group 1 and 3) and (b) bark side (group 2 and 3).
Applsci 10 03975 g006
Figure 7. Mean relative length of splits and deep checks (% of total board length) from visual assessment of ‘exposed’ control and TM boards by exposure time.
Applsci 10 03975 g007
Figure 8. Moisture content (MC) and dynamic elastic moduli (Ea) of ‘exposed’ control and/or TM boards by exposure time: (a) MC (mean ± standard deviation) and Ea (mean), (b) Ea (mean ± standard deviation), and (c) Ea adjusted to 12% MC (mean ± standard deviation) of control boards (legend in a).
Applsci 10 03975 g008
Figure 9. Bending strength of control (circles) and TM (squares) boards tested directly and after weathering. Mean (fm,mean) (dash-dotted line) and 5-percentile (fm,05) (dashed line) values of bending strength are given for each sample set.
Applsci 10 03975 g009
Figure 10. Work-to-maximum load (WML) of control (left y-axis/circles) and TM boards (right y-axis/squares) tested directly and after weathering.
Applsci 10 03975 g010
Figure 11. Example of failures: (a) control board directly tested, (b) control board tested after exposure and (c) TM board tested after exposure. Legend: white arrow = compression failure with fibre buckling; orange arrow = tensile failure perpendicular to the grain in the compression zone; black arrow = horizontal shear failure.
Applsci 10 03975 g011
Figure 12. Relationships between static bending properties and dynamic elastic modulus of control and TM boards directly tested and after exposure: (a) Ea,resEm,g and (b) Ea,resfm.
Applsci 10 03975 g012
Table 1. Weather conditions for exposure periods and at measurement intervals.
Climate Factor
Unit
Temperature 1
(°C)
Precipitation 2
(mm)
Solar radiation 1
(Wm2)
Relative Humidity 1
(%)
EXPOSURE PERIOD 3
Spring 2017–Autumn 201711.232315880
Autumn 2017–Spring 20182.43175991
Spring 2018–Autumn 201816.026919373
Autumn 2018–Spring 20192.14003793
Spring 2019–Autumn 201913.154318977
MEASUREMENT INTERVAL 4
Autumn 2017 (month 6)8.55.55794
Spring 2018 (month 12)17.20.027161
Autumn 2018 (month 18)8.60.14591
Spring 2019 (month 24)6.90.017464
Autumn 2019 (month 30)7.00.313486
1 Average of 1-minute values. 2 Sum of total per hour. 3 Given over a period of approximately 6 months. 4 Given over a period of 1 day.
Table 2. Classification of checking.
EN 14081-1 [62]In this Work Referred to as
ChecksGrade Determining Characteristics
With a depth less than half the thickness-Surface checks
With a depth more than half the thicknessLengthDeep checks
Through the thicknessLength and positionCracks, and if at board ends as splits
Table 3. Checks in cross-section of ‘exposed’ control and TM boards for all boards and per group: mean values of number of observations [no.] and maximum depth [mm] (in bold), and percentage occurrence [%] in parenthesis.
TreatmentControlTM
Group(s)AllPith upBark upEdgeallPith upBark upEdge
ACROSS RINGS
pith side3 c
4
(48%)
4
4 a
(75%)
2 a
6 a
(36%)
1 a
2 a
(32%)
3 c
7
(68%)
4 a
7 a
(90%)
2 a,b
7 a
(63%)
2 b
8 a
(50%)
bark side3
7 c
(88%)
2
5(79%)
5 a
9
(86%)
4 a
7
(100%)
3
7 c
(98%)
2 a
6 a
(97%)
4
7 a
(100%)
2 a
7 a
(96%)
core1 c
17 c
(1%)
1 n/a
17 n/a
(4%)


(0%)


(0%)
4 c
27 c
(18%)
3 a
24 a
(21%)
2 a
35 a
(11%)
6 a
25 a
(21%)
ALONG RINGS
pith side3
3
(57%)
3 a
3 a
(54%)
2 a
4 a
(36%)
4 a
3 a
(82%)
4
10
(93%)
4 a
10 a
(100%)
3 a
10 a
(81%)
5 a
11 a
(96%)
bark side2 c
3 c
(5%)


(0%)
2 n/a
3 n/a
(4%)
2 n/a
3 n/a
(11%)
2 c
7 c
(39%)
2 a
7 a
(31%)
2 a
9 a
(37%)
2 a
5 a
(50%)
core1 c
9 c
(1%)


(0%)


(0%)
1 n/a
9 n/a
(4%)
3 c
25 c
(1%)


(0%)


(0%)
3 n/a
25 n/a
(4%)
a,b No significance difference (p > 0.05) between groups (pith up, bark up or edgewise) within control and TM boards is indicated with the same letter (Kruskal–Wallis test). c No significant difference (p > 0.05) between ‘all’ exposed control and TM boards is indicated with the same letter (Wilcoxon rank sum test). n/a Not applicable.
Table 4. Mean value (upper and bold), standard deviation (middle) and coefficient of variation (lower) for various properties of control and TM boards tested directly, and before and after exposure.
TreatmentControlTM
Exposure
Interval
DirectExposedDirectExposed
BeforeAfterBeforeAfter
NON-DESTRUCTIVE TESTS
ρ (kgm−3)463
39
8%
457
39
9%
457
39
9%
422
33
8%
417 a
35
8%
422 a
36
9%
va,tof (ms−1)5560 b
231
4%
5682 α,b
265%
5665 α
270
5%
5735 b
258
5%
5852 a,b
279
5%
5755 a
272
5%
Ea,tof (MPa)14,374
1997
14%
14,786 α
2079
14%
14,723 α
2117
14%
13,929
1916
14%
14,356 a
2047
14%
14,029 a
1976
14%
va,res (ms−1)5208
254
5%
5222 A
271
5%
5211 A
296
6%
5384
293
5%
5384 a
319
6%
5291 a
313
6%
Ea,res (MPa)12,623
1864
15%
12,523
1975
16%
12,488
2051
16%
12,293
1876
15%
12,173 a
1995
16%
11,880 a
1908
16%
BENDING TESTS
MC (%)12.9c
0.7 c
5%
13.5 a
0.4
3%
12.3a,c
0.3 c
2%
4.7 c
0.6
12%
5.5 a
0.4
7%
7.0 a,c
0.5
7%
fm (MPa) 143.3
10.8
25%
(23.3)
N.A.40.9
11.7
29%
(21.5)
25.1 C
8.8
35%
(10.8)
N.A.22.9 C
7.9
34%
(10.2)
Em,g (MPa)11,151
1811
16%
N.A.10,708
2019
19%
10,924
1825
17%
N.A.10,492
1709
16%
Em,l (MPa)12,381
1980
16%
N.A.12,408
2389
19%
12,366
2198
18%
N.A.11,959
2077
17%
WML (mmN/mm3)0.0239
0.0116
49%
N.A.0.0238
0.0142
60%
0.0073
0.0042
57%
N.A.0.0063
0.0038
59%
wmax (mm)44.4
10.7
24%
N.A.45.4
12.1
27%
25.1 C
6.9
28%
N.A.23.1 C
6.5
28%
t (s)211
39
18%
N.A.212
43
20%
145 c
28
19%
N.A.133 c
24
18%
1 5th percentile value of bending strength (fm,05) given in parenthesis. a,α,A Significance exposed before vs. after (dependent t-test). b,β,B Significance direct vs. exposed before (F-test, independent t-test). c,γ,C Significance direct vs. exposed after (F-test, independent t-test). Significance levels: lower case letters p < 0.01 (e.g., a), Greek letters p < 0.05 (e.g., α), upper case letters p < 0.10 (e.g., A).
Table 5. Type of load–deflection (Fw) curve, and characterisation of failure type, defect and fracture surface at maximum load of control and TM boards tested directly and after exposure (% frequency of occurrence).
TreatmentControlTM
ExposureDirectExposedDirectExposed
IntervalAfterAfter
CURVE TYPE 1
115213756
247406343
3151700
4232301
FAILURE TYPE
Simple tension69688081
Cross-grain tension27161813
Splinter tension41110
Compression0502
Horizontal shear0014
DEFECT AT LOCATION OF FAILURE
Around knots80653632
Through knots13305661
Reaction wood643.51
Cross-grain103.50
Top rupture0102
n/a 20014
FRACTURE SURFACE
Brash38246450
Fibrous62713544
n/a 30516
1Fw curve: (1) sudden failure, (2) preliminary failure prior to failure, (3) non-linearity prior to failure, and (4) preliminary failures and non-linearity prior to failure. 2 Not applicable (n/a) for horizontal shear failure. 3 Not applicable (n/a) for compression and horizontal shear failure.
Table 6. Coefficient of determination (R2) incl. lower and upper bound at 95% confidence interval of relationships between static bending and non-destructive test (NDT) properties of control and TM boards tested directly and after exposure. 1.
TreatmentControlTM
Bending PropertyEm,gfmEm,gfm
ρdirect
exposed 2
exposed
0.56 ± 0.14
0.53 ± 0.14
0.50 ± 0.15
0.16 ± 0.14
0.35 ± 0.16
0.32 ± 0.16
0.50 ± 0.15
0.40 ± 0.16
0.39 ± 0.16
0.17 ± 0.14
0.10 ± 0.12
0.12 ± 0.13
Ea,tofdirect
exposed 2
exposed
0.80 ± 0.07
0.79 ± 0.08
0.77 ± 0.08
0.36 ± 0.16
0.61 ± 0.13
0.58 ± 0.13
0.82 ± 0.09
0.80 ± 0.07
0.79 ± 0.08
0.44 ± 0.15
0.38 ± 0.16
0.36 ± 0.16
Ea,resdirectexposed 2
exposed
0.87 ± 0.05
0.88 ± 0.05
0.88 ± 0.05
0.51 ± 0.15
0.70 ± 0.10
0.69 ± 0.11
0.90 ± 0.04
0.88 ± 0.05
0.87 ± 0.05
0.49 ± 0.15
0.46 ± 0.15
0.45 ± 0.15
1R2-values are significantly different from zero (F-test, p < 0.001). 2 NDT property was determined on ‘exposed’ control and TM boards before weathering.

