Abstract
A simple, selective, and inexpensive spectrophotometric method is described in the present study for estimation of trace concentrations of Cu2+ in water based on its reaction with chromogenic reagent namely 4-amino-3-mercapto-6-[2-(2-thienyl)vinyl]-1,2,4-triazin-5(4H)-one (AMT). The reaction between copper(II) ions and AMT reagent gives [Cu(L)(NO3)(H2O)2]•H2O complex, where L represents AMT molecule with NH group. The formed complex exhibits a sharp, and well-defined peak at λmax = 434 nm with a molar absorptivity (ε) of 1.90 × 10⁴ L mol−1 cm−1, and Sandell’s factor of 0.003 μg mL−2. Absorbance of the [Cu(L)(NO3)(H2O)2]•H2O follows Beer’s law over a 0.7–25 μg mL−1 range with a detection limit of 0.011 μg mL−1. Validation of the submitted method was established by estimating Cu2+ in certified reference materials and actual sea and tap water samples. The results are compared with data obtained from copper concentration measurements using ICP-OES. The chemical structure of the Cu(II)-AMT complex was fully characterized by FT-IR, SEM, EDX, TGA, and ESR techniques.
1. Introduction
Copper is a biologically-active element, whose compounds have a strong influence on the vital activities of organisms. Copper plays an essential role in biological processes including metabolism, nerve function, hemoglobin synthesis, and bone development [1,2,3]. However, an increase in the amount of copper in the human body may lead to serious problems such as heart disease, anemia, and liver damage [4].Therefore, the copper concentration in environmental samples—especially water—should be monitored continuously, preferably by simple and effective analytical methods. Many analytical techniques including microwave plasma—AES [5], AAS [6], potentiometry [7,8], voltammetry [9], ICP-OES [10], and ICP-MS [11] have been developed and used to monitor copper concentration levels in a variety of samples. Actually, most AAS and ICP-OES methods recently developed use preconcentration methodology to improve sensitivity and selectivity. However, such methodology is highly costly, and time-consuming. Spectrophotometric techniques generally are preferred for metal ion determinations in aqueous media, because of their simplicity, low cost, and availability [12]. Among the many spectrophotometric reagents used to determine copper are 1,4-dioxane [13], 4-(2′-benzothiazolylazo)salicylic acid (BTAS) [14], 2,4-dinitro APTPT [15], diethyldithiocarbamate (DDTC) [16,17], 2-amino-4-(m-tolylazo)pyridine-3-ol (ATAP) [18], 2-(5-Bromo-2-Oxoindolin-3-ylidene) hydrazine carbothioamide (HBITSC) [19], 4-(4′-nitrobenzylideneimino)-3-methyl-5-mercapto-1,2,4-triazole (NBIMMT) [20], 2-acetylpyridine thiosemicarbazone (2-APT) [21], N,Nbissalicylidene-2,3-diaminopyridine(H2IF) [22], and rhodamin derivative with 5-(ά-methyl-3 hydoxybenzylidene) (5M, 3H-BR) [23]. However, most of these reagents suffer from shortcomings such as a narrow pH range, interference from common ions, the need to heat the reaction mixture, and lengthy color development [24]. Thus, there is an urgent need to prepare selective and sensitive chromogenic reagents that can operate over a wide range of concentrations and pH values.
Although reagent 4-amino-3-mercapto-6-[2-(2-thienyl)vinyl]-1,2,4-triazin-5(4H)-one (AMT) has been previously reported [25,26,27,28], as far as we know, there is no analytical use of this reagent yet. Therefore, the present work will discuss the preparation and characterization of a copper(II) complex with AMT and the use of this ligand as a spectrophotometric reagent for developing an analytical method for determining copper in certified reference materials and water samples.
2. Experimental
2.1. Chemicals and Reagents
All materials employed in the study were of analytical reagent grade and no further purification was required. Alkali, alkaline earth, and heavy metal nitrates were obtained from Sigma-Aldrich, St. Louis, MO, USA. All solvents were purchased from Fisher Scientific. Deionized water was used exclusively in the experiments. A weighed amount of CuNO3•3H2O was dissolved in an appropriate volume of deionized water for preparation of stock solution of Cu2+ (50 μg mL−1) [29]. Appropriate weights of nitrate salts of some metal ions were dissolved in deionized water for obtaining stock solutions of these ions. The pH of aqueous solutions was adjusted to 4.5 with acetate buffer (CH3COOH/CH3COONa).
2.2. Apparatus
Electronic spectra and absorbance values of the ligand and its Cu complex were recorded using a HACH LANGE (Model DR-6000) spectrophotometer. The elemental compositions of the ligand and its complex with copper were determined using a Perkin Elmer CHNS/O analyzer model 2400 Series II. The ligand and its Cu complex were characterized by FT-IR spectroscopy at 400–4000 cm−1 with an ALPHA attenuated FT-IR spectrometer (Bruker, Billerica, MA, USA). 1H NMR of AMT compound was recorded by FT-NMR spectrometer (A Bruker DRX-500). A JEOL JEM-6390 scanning electron microscope combined with a unit of energy dispersive X-ray spectroscopy was used to record morphological images and to determine elemental distributions in the samples. Measurements of electron spin resonance (ESR) were carried out using a SPINSCAN X spectrometer from ADANI with operating frequency of 9.2–9.55 GHz. Diphenylpicrylhydrazyl (DPPH) was used as a reference to calculate the g-values. The g factor of DPPH is 2.0036. Copper complex with AMT was grounded to get fine particles, then the power was placed in 1 mm (ID) sealed capillary tube. All ESR measurements were carrying out at 300 K. Magnetic susceptibility of Cu(II)-AMT complex was measured at 25 ± 0.35 °C by a magnetic susceptibility balance (Johnson Matthey, Alfa product, Model No. (MKI)) calibrated using Hg[Co(NCS)4]. Determination of metal ion concentrations in aqueous solution was carried out by ICP-OES spectrometry (Optima 2100 DV, Perkin Elmer, Waltham, MA, USA). pH measurements were made with a Jenway 3305 pH meter. Thermogravimetric measurements were performed by use of a Mettler-Toledo TGA/DSC1 calorimeter under a nitrogen flow of 60 mL min−1 at 25–900 °C.
2.3. Preparation of the AMT Ligand
AMT ligand was synthesized by the method reported in [26]. Scheme 1 summarizes the procedure. 1H NMR (DMSO-d6): δ 6.48 (s, 2H, NH2), 6.90 (d, 1H, thiophene-CH=CH-triazine), 7.06 (t, 1H, Hb of thiophene), 7.36 (d, 1H, Hc of thiophene), 7.59 (d, 1H, Ha of thiophene), 8.11 (d, 1H, thiophene-CH=CH-triazine), 14.04 (s, 1H, SH). 13CNMR (DMSO-d6): δ 118.0 (thiophene-CH=CH-triazine), 126.7 (thiophene-CH=CH-triazine), 127.7 (C4 of thiophene), 128.7 (C3 of thiophene), 129.3 (C5 of thiophene), 141.0 (C2 of thiophene), 141.2 (C6 of triazine), 147.7 (C-SH), 166.8 (C=O). Elemental analysis(%) of AMT calculated for C9H8N4OS2 (252.31) is displayed in Table 2, while, the 1HNMR and 13CNMR spectra of AMT ligand are shown in Supplementary Materials (Figures S1 and S2, respectively).
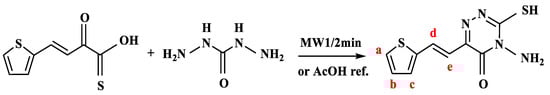
Scheme 1.
Synthesis of AMT.
2.4. Preparation of [Cu(L)(NO3)(H2O)2]•H2O
1.00 mmol of AMT and 1.00 mmol of CuNO3•3H2O were refluxed in methanol at 90 °C for three hours. After cooling the reaction vessel to room temperature (25 ± 0.4), the brown precipitate, [Cu(L)(NO3)(H2O)2]•H2O, was obtained by filtration in non-pure form. However, the obtained precipitate was purified by recrystallization from methanol, and the pure product was dried at 80–90 °C. Yield: 78%. Elemental analysis (%) of [Cu(L)(NO3)(H2O)2]•H2O calculated for C9H14N5O7S2-Cu (431.90) is displayed in Table 2.
2.5. Estimation of Cu(II) in Waters Using Recommended Method
Different volumes of standard copper(II) solutions (0.7–25.0 μg mL−1) were added to 8 mL of a 0.042% (w/v) AMT solution in 10 mL of acetate buffer (pH 4–6). Deionized water was used to dilute all solutions to 50 mL. Absorbance was measured at 434 nm against a reagent blank. 100 mL of tap or sea water was sampled, filtered, and transferred into clean polyethylene bottles. All samples were analyzed within 6 h of collection. Appropriate quantities were treated according to the recommended procedure before and after spiking with known concentrations of Cu(II).
2.6. Evaluation of Proposed Method Using Certified Reference Materials
Multielement standard solution (# 90243) purchased from Sigma-Aldrich was used as a certified reference material to evaluate the proposed method. According to product catalog, this solution contains 10 mg L−1 of Cu, in addition to K, Bi, and Pb, with concentration of 100 mg L−1; Al, B, Cr, Li, Mo, Na, Ni, and Tl at concentration level of 50 mg L−1; while, Ba, Ca, Cd, Co, Fe, Mg, Mn, Sr, and Zn are in concentrations equal to Cu. An aliquot of the solution was analyzed by recommended procedure for estimating Cu after addition of few drops of KF•2H2O (0.1% m/v) as a masking agent.
The steel sample (No.21899) obtained from Analytical Chemistry Laboratory Service, (München, Germany) was also used as a certified reference material to evaluate the proposed method. The copper content in the sample is 0.519% (w/w). The main components are Cr, Ni, Mn, and Zn, in addition to ultra-traces concentrations of Mo, P, C, S, Si, Tl, V, and Co.
0.2 g of steel sample was heated with 10 mL of aqua regia to near dryness. The sample was then mixed with 5 mL of concentrated H2SO4 and heated for 30 min. The resulting solution was neutralized by NaOH and diluted using doubly distilled water in a 100 mL calibrated flask. A part of aqueous solution was subjected to recommended procedure to estimate copper in steel sample.
3. Results and Discussion
A brown product was observed immediately upon mixing the aqueous copper(II) and AMT solutions. The electronic spectrum of the free ligand solution (1.2 × 10⁻⁴ mol L−1) recorded against deionized water as a blank showed two peaks at 254, and 376 nm assigned to π–π* and n → π* transitions, respectively (Figure 1a). The peak at 376 nm shifted to 434 nm after reaction of the AMT reagent with copper(II) (Figure 1b–d). Figure 1 also demonstrates the increase in absorbance with increasing Cu2+ concentration. Moreover, the electronic spectrum of Cu(II)-AMT complex recorded in solid state using the Nujol mulls method and shown in Supplementary Materials (Figure S3) exhibited a broad band at 630 nm corresponding to T2g(2D) ← Eg in octahedral environment [30]. The effective magnetic moment (µeff) of copper complex with AMT calculated from the Equation (1) was 1.82 B.M confirming the distorted octahedral symmetry of this complex.
where, χM is molar susceptibility modified using Pascal’s constants of all atoms diamagnetism, while T is absolute temperature.
µeff = 2.828 (χM.T)1/2
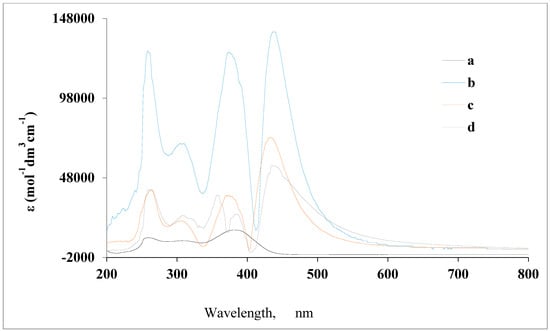
Figure 1.
Electronic spectra recorded in aqueous media of (a) 4-amino-3-mercapto-6-[2-(2-thienyl)vinyl]-1,2,4-triazin-5(4H)-one (AMT) ligand at concentration of 1.2 × 10⁻⁴ mol L−1 and following addition of the Cu(II)-AMT complex at Cu2+ concentrations of (b) 0.70 µg/mL, (c) 3.50 µg/mL, and (d) 5.50 µg/mL.
The stoichiometry of Cu(II)-AMT complex was estimated using the mole ratio method, wherein the absorbance at 434 nm was plotted versus the [AMT]/[Cu2+] ratio as shown in Figure 2. The results indicate that the AMT ligand and Cu2+ reacted in a 1:1 ratio.
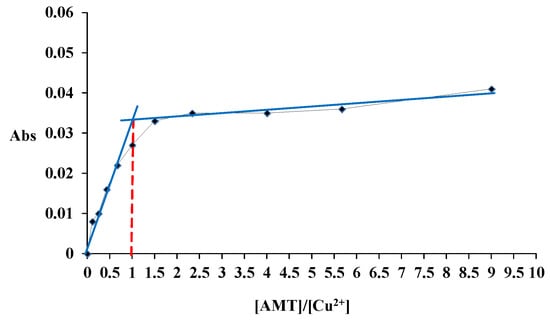
Figure 2.
Determination of the stoichiometry of the Cu(II)–AMT complex. Blue lines represent the tangents of the linear portions of the mole ratio curve, while red dashed line shows the molar ratio.
3.1. Characterization
Techniques including FT-IR, SEM, EDX, TGA, and ESR were used to characterize the complex formed between Cu(II) and AMT.
3.1.1. FT-IR Technique
The FT-IR spectra of AMT and the [Cu(L)(NO3)(H2O)2]•H2O complex are demonstrated by traces A and B, respectively, in Figure 3. For AMT, a peak due to NH2 was observed at 3291–3195 cm−1, aromatic C–H stretching peak was located at 3064–3091 cm−1, and the aliphatic C–H stretching peak was observed at 2936 cm−1. A peak corresponding to S–H was observed at 2665 cm−1. Peaks of C=O, C=C, and C=N were observed at 1660, 1593, and 1618 cm−1, respectively. Following differences were observed between the spectrum of AMT and that of its complex with Cu2+. The NH2 peak in Cu(II)-AMT shifted to approximately 3142 cm−1 and decreased significantly in intensity. This indicates that the NH2 group participated in complex formation. The C=O frequency shifted from 1660 to 1705 cm−1 in reference to coordination of AMT to Cu2+ through the carbonyl oxygen atom. Peaks due to ν(Cu–N), and ν(Cu–O) were observed at 530, and 518 cm−1, respectively. The coordination behavior of the nitrate ion was confirmed through the appearance of characteristic frequencies of bidentate nitrate group at 1545, 1353, and 820 cm−1 and the absence of the distinctive band of ionic nitrate group at 1766 cm−1 [31]. Therefore, the nitrate group served as a bidentate ligand with C2v symmetry. Table 1 lists the different FT-IR frequencies of AMT and the [Cu(L)(NO3)(H2O)2]•H2O complex.
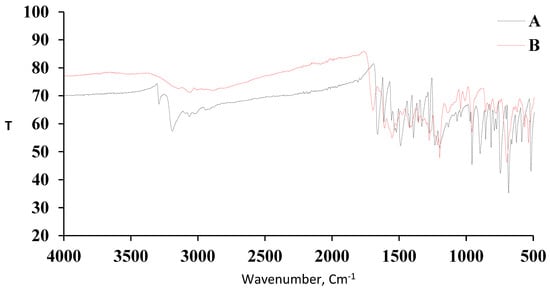
Figure 3.
FT-IR spectra of (A) AMT and (B) [Cu(L)(NO3)(H2O)2]•H2O.

Table 1.
FT-IR frequencies (cm−1) and tentative assignments of AMT and the Cu(II)-AMT complex.
3.1.2. SEM and EDX Analysis
The SEM images of AMT and its complex with copper(II) shown in Figure 4 provide useful information on surface morphology and particles size. The surface morphology of AMT changed dramatically after its reaction with Cu2+. Free AMT molecules are visualized as platelet–like particles with a clear, and smooth surface (Figure 4A–D). The AMT particles size calculated using image J program ranged from 4.6 to 8.2 µm. Agglomerated particles with a rough surface are observed in the SEM image of Cu(II)-AMT as shown in Figure 4E–H. The particles size of Cu(II)-AMT complex were in the range of 18.8–31.25 µm. However, the SEM images of Cu(II)-AMT complex displayed a few particles with size less than 10 µm that may have combined to form agglomerates with larger size. The EDX analysis of the AMT ligand revealed three signals corresponding to carbon, oxygen, and sulfur elements (Figure 5A), while the EDX spectrum of copper complex with AMT confirmed the presence of copper in the complex as indicated by the signals corresponding to this element in Figure 5B. Such signals were not found in the EXD spectrum of free AMT (Figure 5A). The elemental analysis of AMT ligand and its complex with Cu(II) is displayed in Table 2.
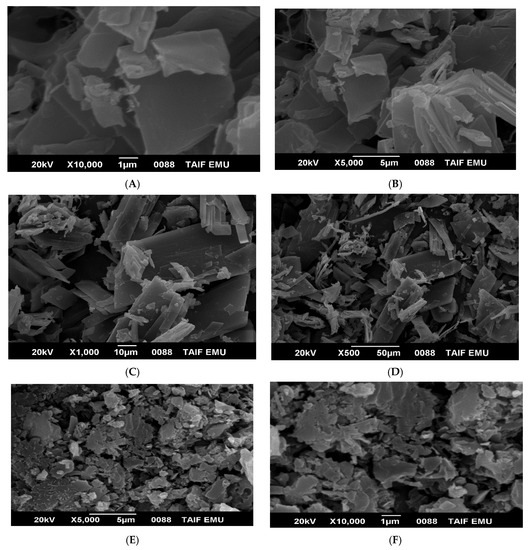
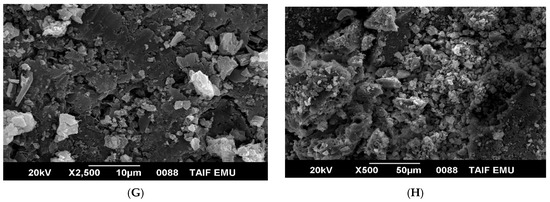
Figure 4.
SEM images at a different magnification of (A–D) AMT and (E–H) Cu(II)-AMT.
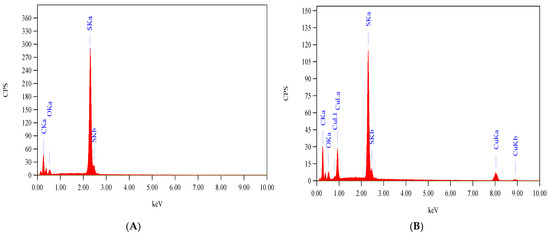
Figure 5.
EDX spectra of (A) AMT and (B) [Cu(L)(NO3)(H2O)2]•H2O.
Table 2.
The elemental analysis of AMT ligand and Cu(II)-AMT complex.
3.1.3. Thermal Analysis
Thermogravimetric analysis of the ligand occurred in two stages as shown in Figure 6A. The first stage which was because of the loss of one molecule each of NH3 and CO covered the range 60–200 °C. Complete decomposition of ligand occurred throughout the second stage at 200–600 °C. No residue was observed. Scheme 2 shows the proposed path of ligand thermolysis. Thermogravimetric analysis of Cu(II)-AMT involved four stages as shown in Figure 6B and Scheme 3. The loss of one molecule of uncoordinated water was in the first stage and occurred at 27–104 °C with a 4.45% weight loss. Two molecules of coordinated water were lost in the second stage at 120–200 °C with a weight loss of 8.25%. The third stage at 200–528 °C involved partial fragmentation of the ligand moiety and the release of nitrogen oxides amounting to a 63.02% weight loss. Complete decomposition of the complex leaving a residue of copper oxide occurred in the final stage at 528–1000 °C (24.64% weight loss).
Figure 6.
TGA of AMT (A) and [Cu(L)(NO3)(H2O)2]•H2O (B).
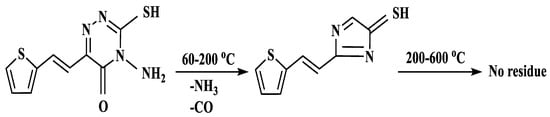
Scheme 2.
Suggested thermal decomposition of AMT.
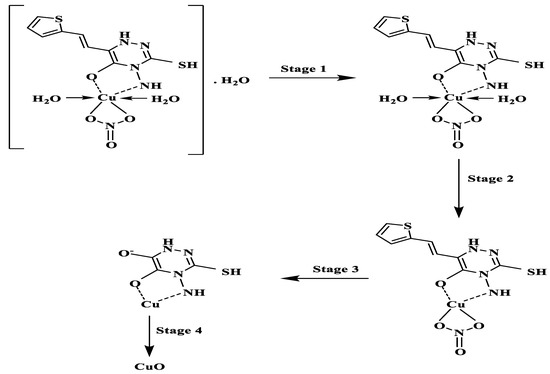
Scheme 3.
Suggested thermal decomposition of Cu(II)-AMT.
3.1.4. Electron Spin Resonance of [Cu(L)(NO3)(H2O)2]•H2O
The powdered ESR spectrum of the Cu-AMT complex measured at 300 K showed two bands at 330 and 310 mT with g⊥ = 2.08306 and gıı = 2.2175, respectively (Figure 7). The g-values confirmed that the unpaired electron of Cu(II) occupies the orbital of dx2−y2, where gıı is greater than both g⊥ and g of free electron (2.0023) [32,33]. The shape of the ESR spectrum suggests a distorted octahedral symmetry for the Cu-ATM complex [32] in excellent agreement with µeff value. The gav value calculated from Equation (2) was equal to 2.1279. Deviation of gav from g of free electron was because of the covalent property of bonding in Cu-ATM [33].
gav = 1/3(gıı + 2 g⊥)
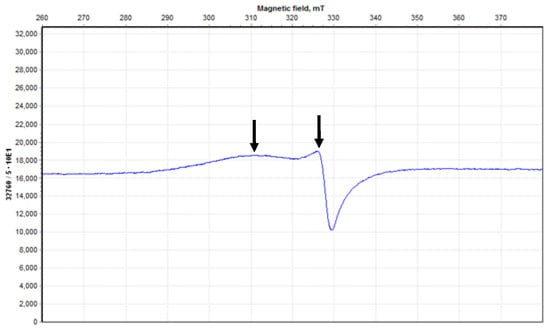
Figure 7.
Electron spin resonance of [Cu(L)(NO3)(H2O)2]•H2O. Two arrows indicate the significant peaks in spectrum.
A molar conductivity of Λm = 8.2 Ω−1 cm2 mol−1 measured at 1.00 × 10⁻³ M in DMF solvent at room temperature indicated that the Cu-ATM complex is a non-electrolyte [34]. Full characterization of the complex formed between Cu2+ and AMT suggests the chemical formula to be [Cu(L)(NO3)(H2O)2]•H2O. Figure 8 shows the proposed structure of the complex.
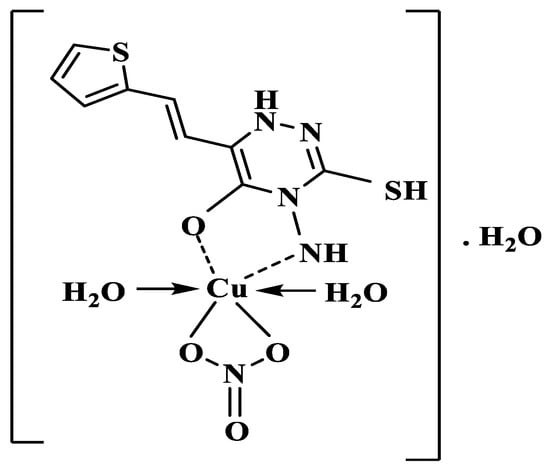
Figure 8.
Chemical structure of [Cu(L)(NO3)(H2O)2]•H2O complex. L represents AMT molecules with NH group.
3.2. Analytical Application
The brown complex formed between Cu2+ and AMT was used to develop an analytical procedure for monitoring the copper concentration in environmental samples.
3.2.1. Optimization of the Recommended Procedure
The relationship between solution pH and the absorbance of [Cu(L)(NO3)(H2O)2]•H2O at λmax = 434 nm was examined at various pH values using HCl/NaOH and acetate buffer (CH3COOH/CH3COONa). The results in Figure 9 show that the maximum absorbance of [Cu(L)(NO3)(H2O)2]•H2O occurred at pH 4–6 in acetate buffer. The absorbance is less at pH ≤ 3, because the protonation equilibrium of the reagent shifted to the left as displayed in Scheme 4 producing protonated form (H2L). Therefore, the deprotonated form of the reagent (HL) is required for complex formation. The absorbance of the Cu(II)-AMT complex decreased dramatically above pH 6, a behavior most likely attributed to the hydrolysis of Cu(II)-AMT and the formation of colorless forms of copper(II) such as hydroxo species. Thus, the acetate buffer with pH 4–6 was chosen for further experiments.
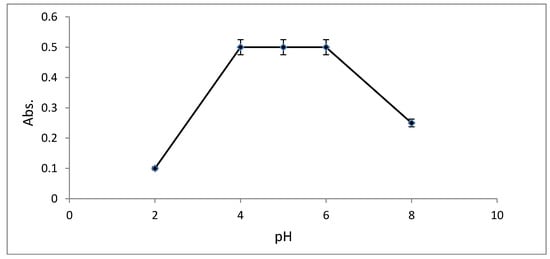
Figure 9.
Influence of solution pH on the absorbance of [Cu(L)(NO3)(H2O)2]•H2O at λmax = 434 nm. Copper(II) concentration = 2 μg mL−1; [AMT] = 1.20 × 10⁻⁴ M.
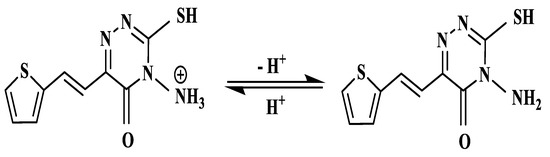
Scheme 4.
Chemical equilibrium of AMT reagent.
The absorbance of [Cu(L)(NO3)(H2O)2]•H2O at λmax was significantly influenced by a change in AMT concentration from 4.0 × 10⁻⁴ to 6.7 × 10⁻⁵ M at constant Cu2+ concentration (Figure 10). The absorbance of the complex was constant at [AMT] = 6.5 × 10⁻⁵ to 2.2 × 10⁻⁴ mol L−1, but increased at concentrations above 2.2 × 10⁻⁴ mol L−1. A small decrease in absorbance was seen above 2.8 × 10⁻⁴ mol L−1, possibly because excess chromogenic reagent reduced the extent of complex formation by increasing the acidity of the solution [35]. Thus, the AMT concentration was fixed at 2.8 × 10⁻⁴ mol L−1 for all measurements.
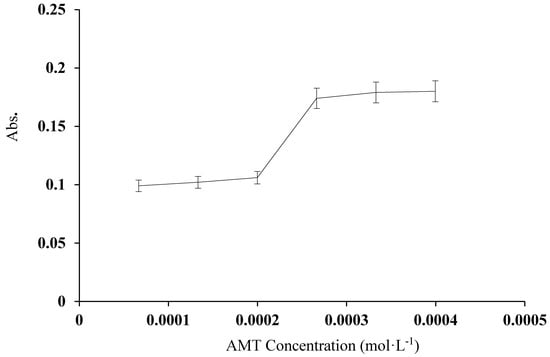
Figure 10.
The relationship between the concentration of AMT reagent and the absorbance of [Cu(L)(NO3)(H2O)2]•H2O at 434 nm. Cu(II) concentration = 2 μg mL−1.
3.2.2. Investigation of Method Selectivity
The potential impact of common foreign ions on the estimation of copper was tested at optimized conditions and in the presence of 2 μg mL−1 Cu(II). The tolerance limit of interfering ions was expressed by the concentration of these ions or species that makes the relative error in the copper determination greater than ±5%. Al3+ and Mn2+ seriously interfered—probably due to complex formation with AMT—as shown in Table 3. However, these interferences were eliminated by addition of 0.5 mL KF•2H2O (0.1 mol L−1), which reduced the relative error to an acceptable ±5% level at an interfering ion concentration of 100 µg mL−1.
Table 3.
Influence of some foreign ions when applying the developed spectrophotometric procedure for the estimation of 2 µg mL−1 Cu(II). [AMT] = 1.665 × 10⁻³ mol L−1; relative error: ±5%.
3.2.3. Analytical Performance of the Recommended Procedure
The plot of Cu(II) concentration versus absorbance is linear over a range of 0.7–25 µg mL−1. The linear equation that describes the calibration curve of our developed method is:
where, A and C are absorbance, and concentration of copper(II) solution, respectively. Sandell’s factor, and the molar absorptivity (ε) of the proposed method are 0.003 µg cm−2, and 1.9 × 10⁴ L mol−1 cm−1, respectively. LOD calculated using the equations in [21] is 0.011 µg mL−1 (11.00 µg L−1). Relative standard deviation (RSD) and relative error (RE) of the spectrophotometric method calculated from ten replicate measurements of copper recovery at 2 µg mL−1 in distilled water were 1.4% and 1.2%, respectively. Variables demonstrating the effectiveness of the analytical method are listed in Table 4. Comparison of these analytical features with those of previously-published spectrophotometric methods in Table 5 establishes the good sensitivity and wide linear dynamic range of our method. Moreover, the analytical performance of the proposed method, in terms of selectivity, sensitivity, and dynamic concentration range, was compared with a wide variety of analytical techniques [5,6,7,8,9,36,37,38,39]. The spectrophotometric method developed in the present study provides better sensitivity and selectivity than some the methods mentioned in Table 6, without the need to use the extraction or preconcentration methodology. The dynamic concentration range of the proposed method covers a wide domain of concentrations including the maximum values of copper in drinking waters recommended by the U.S. Environmental Protection Agency [EPA] (1 mg L−1) and the WHO (2 mg L−1). Moreover, the proposed chromogenic reagent can operate at a wide range of pH values. Therefore, the suggested spectrophotometric method is appropriate for rapid and routine analyzes in many laboratories.
A = 0.18 C − 0.009 (R2 = 0.992, n = 10)
Table 4.
Summary of the analytical performance of the spectrophotometric method.
Table 5.
Comparison between the proposed method and previously-published spectrophotometric methods to estimate Cu(II) *.
Table 6.
Comparison between the proposed method and various previously published analytical techniques to estimate Cu(II).
3.2.4. Evaluation of the Recommended Procedure
Our spectrophotometric procedure was effectively employed for the analysis of Cu in multielement standard solution (# 90243), and steel sample (No.21899) as certified reference materials, in addition to tap water (Taif City, Saudi Arabia) and sea water (Red Sea, Jeddah Governorate, Saudi Arabia). Copper concentrations in multielement solution and steel sample estimated by the proposed spectrophotometric procedure were 9.91 ± 0.27 mg L−1 and 0.475% (w/w), respectively, with small differences from certified values. However, Student’s t-test revealed no significant differences between the concentrations determined by spectrophotometric method and certified values at the 95% confidence level since the tabulated t–value (2.78) was always greater than the calculated values (2.61, 2.55) for five replicate measurements. Water samples were spiked with a known concentration of copper as shown in Table 7, and the recovery method was determined. Acceptable recoveries were obtained, which confirms the accuracy and applicability of the method for copper determination in water samples. A comparison of the results of our spectrophotometric method with those of the standard ICP-OES indicates analytically-acceptable agreement between these procedures. Therefore, the proposed method can be used for the rapid and sensitive detection of Cu(II) in water samples. The rapid color development due to reaction of AMT with copper(II) can be detected by the naked eye, which makes the proposed method suitable for the qualitative analysis of copper(II) in a variety of samples.
Table 7.
Evaluation of proposed spectrophotometric method by determining copper in water samples *.
4. Conclusions
The present study describes the first synthesis and characterization of the [Cu(L)(NO3)(H2O)2]•H2O complex. The AMT ligand is a bidentate N,O donor, which coordinates with Cu2+ in 1:1 ratio. Full characterization of the [Cu(L)(NO3)(H2O)2]•H2O complex suggests the octahedral structure shown in Figure 8. The reaction between AMT and copper(II) was used to develop an effective spectrophotometric procedure for the determination of copper in water samples. The developed method is simple, low cost, and sensitive with LOD of 11.00 ppb. The proposed chromogenic reagent operates at a wide range of concentrations and pH values. On the other hand, the developed method can work as a sensitive chemo sensor for copper monitoring in water samples since color change due to reaction of AMT with Cu(II) appears rapidly within less than 10 s and remains stable for up to 2 h.
Supplementary Materials
The following are available online at https://www.mdpi.com/2076-3417/10/11/3895/s1, Figure S1: 1H NMR spectrum of AMT ligand, Figure S2: 13C NMR spectrum of AMT ligand, Figure S3: The electronic spectrum of [Cu(L)(NO3)(H2O)2]•H2O.
Author Contributions
Investigation, methodology, validation and writing: S.S.A. and H.M.A.-S. All authors have read and agreed to the published version of the manuscript.
Funding
This research received no external funding.
Conflicts of Interest
The authors declare no conflict of interest.
References
- Veitía, M.S.I.; Dumas, F.; Morgant, G.; Sorenson, J.R.J.; Frapart, Y. Synthesis, structural analysis and anticonvulsant activity of a ternary Cu (II) mononuclear complex containing 1,10-phenanthroline and the leading antiepileptic drug valproic acid. Biochimie 2009, 91, 1286–1293. [Google Scholar] [CrossRef] [PubMed]
- Horstkotte, B.; Alexovic, M.; Maya, F.; Duarte, C.M.; Andruch, V.; Cerda, V. Automatic determination of copper by in-syringe dispersive liquid–liquid microextraction of its bathocuproine-complex using long path-length spectrophotometric detection. Talanta 2012, 99, 349–356. [Google Scholar] [CrossRef] [PubMed]
- Kannan, D.; Arumugham, M.N. Synthesis, characterization, DNA-binding studies and antimicrobial activity of copper (II) complex with 1, 10-phenanthroline, L-tyrosine and urea as ligands. Int. J. Inorg. Bioinorg. Chem. 2013, 3, 8–15. [Google Scholar]
- Fornea, V.; Trupina, S. Spectrophotometric determination of Cu(II), Co(II) and Ni(II) ions in mono and multi-component systems. Bull. Polytech. Inst. Iasi Sect. Chem. Chem. Eng. 2016, 62, 9–20. [Google Scholar]
- Baghban, N.; Yilmaz, E.; Soylak, M. Nanodiamond/MoS2 nanorod composite as a novel sorbent for fast and effective vortex-assisted micro solid phase extraction of lead(II) and copper(II) for their flame atomic absorption spectrometric detection. J. Mol. Liq. 2017, 234, 260–267. [Google Scholar] [CrossRef]
- Lima, R.T.; Raposo, J.L.; Virgílio, A.; Neto, J.A.G. Determination of copper at wide range concentrations using instrumental features of high-resolution continuum source flame atomic absorption spectrometry. Eclét. Quím. 2010, 35, 86–92. [Google Scholar] [CrossRef]
- Bagheri, H.; Shirzadmehr, A.; Rezaei, M. Determination of copper ions in foodstuff products with a newly modified potentiometric carbon paste electrode based on a novel nano-sensing layer. Ionics 2016, 22, 1–12. [Google Scholar] [CrossRef]
- Issa, Y.M.; Ibrahim, H.; Shehab, O.R. New copper(II)-selective chemically modified carbon paste electrode based on etioporphyrin I dihydrobromide. J. Electroanal. Chem. 2012, 666, 11–18. [Google Scholar] [CrossRef]
- El-Raheem, H.A.; Hassan, R.Y.A.; Khaled, R.; Farghali, A.; El-Sherbiny, I.M. Polyurethane-doped platinum nanoparticles modified carbon paste electrode for the sensitive and selective voltammetric determination of free copper ions in biological samples. Microchem. J. 2020, 155, 104765. [Google Scholar] [CrossRef]
- Reddy, S.K.; Reddy, C.S.; Reddy, G.V.S. Bioaccumulation of trace metals in selected vegetable crops around tummalapalle uranium mine kadapa district, Andhra Pradesh. Orient. J. Chem. 2018, 34, 1078–1090. [Google Scholar] [CrossRef]
- Peng, G.; He, Q.; Zhou, G.; Li, Y.; Su, X.; Liu, M.; Fan, L. Determination of heavy metals in water samples using dual-cloud point extraction coupled with inductively coupled plasma mass spectrometry. Anal. Methods 2015, 7, 6732–6739. [Google Scholar] [CrossRef]
- Huo, F.J.; Yin, C.X.; Yang, Y.T.; Su, J.; Chao, J.B.; Liu, D.S. Ultraviolet-Visible Light (UV-Vis)-Reversible but fluorescence-irreversible chemosensor for copper in water and its application in living cells. Anal. Chem. 2012, 84, 2219–2223. [Google Scholar] [CrossRef] [PubMed]
- Lutfullah; Sharma, S.; Rahman, N.; Azmi, S.N.H.; Iqbal, B.; Amburkb, M.I.B.B.; AlBarwanib, Z.M.H. UV spectrophotometric determination of Cu(II) in synthetic mixture and water samples. J. Chin. Chem. Soc. 2010, 57, 622–631. [Google Scholar] [CrossRef]
- Hashem, E.Y.; Seleim, M.M.; El-Zohry, A.M. Spectrophotometric determination of copper(II) in pharmaceutical, biological and water samples by 4-(2′-benzothiazolylazo)-salicylic acid. J. Appl. Spectrosc. 2011, 78, 586–593. [Google Scholar] [CrossRef]
- Kamble, G.S.; Kolekar, S.S.; Anuse, M.A. Synergistic extraction and spectrophotometric determination of copper(II) using 1-(2,4-dinitro aminophenyl)-4,4,6-trimethyl-1,4-dihydropyrimidine-2-thiol: Analysis of alloys, pharmaceuticals and biological samples. Spectrochim. Acta Part A Mol. Biomol. Spectrosc. 2011, 78, 1455–1466. [Google Scholar] [CrossRef]
- Uddin, M.N.; Salam, M.A.; Hossain, M.A. Spectrophotometric measurement of Cu(DDTC)2 for the simultaneous determination of zinc and copper. Chemosphere 2013, 90, 366–373. [Google Scholar] [CrossRef]
- Uddin, M.N.; Shah, N.M.; Hossain, M.A.; Islam, M.M. Copper and Mercury in Food, Biological and Pharmaceutical Samples: Spectrophotometric Estimation as Cu(DDTC)2. Am. J. Anal. Chem. 2014, 5, 838–850. [Google Scholar] [CrossRef]
- Gouda, A.A.; Amin, A.S. Cloud-point extraction, preconcentration and spectrophotometric determination of trace quantities of copper in food, water and biological samples. Spectrochim. Acta A Mol. Biomol. Spectrosc. 2014, 120, 88–96. [Google Scholar] [CrossRef]
- Madan, P.U.; Barhate, V.D. Extractive spectrophotometric determination of copper (II) using 2-(5-bromo-2-oxoindolin-3-ylidene) hydrazine carbothioamide as an analytical reagent. Eur. J. Biomed. Pharma. Sci. 2016, 3, 392–396. [Google Scholar]
- Shaikh, B.; Barache, U.B.; Anuse, M.A.; Gaikwad, S.H. 4-(4′-nitrobenzylideneimino)-3-methyl-5-mercapto-1, 2, 4-triazole, a new chromogenic reagent for extractive spectrophotometric determination of copper (II) in pharmaceutical and alloy samples. S. Afr. J. Chem. 2016, 69, 157–165. [Google Scholar] [CrossRef]
- Admasu, D.; Reddy, D.N.; Mekonnen, K.N. Spectrophotometric determination of Cu(II) in soil and vegetable samples collected from Abraha Atsbeha, Tigray, Ethiopia using heterocyclic thiosemicarbazone. Springer Plus 2016, 1169, 2–8. [Google Scholar] [CrossRef] [PubMed][Green Version]
- Babayeva, K.; Demir, S.; Andac, M. A novel spectrophotometric method for the determination of copper ion by using a salophen ligand, N,N′-disalicylidene-2,3-diaminopyridine. J. Taibah Univ. Sci. 2017, 11, 808–814. [Google Scholar] [CrossRef]
- Subudhi, K.S.; Sreevani, D.; Rao, K.A. Spectrophotometric determination of trace copper in hair, milk, banana, rice and pharm products with 5-{ά–methyl-3-hydroxybenzylidene} rhodamine [5M, 3H-Br] reagent. Int. J. Res. Anal. Rev. 2019, 6, 809–817. [Google Scholar]
- Lin, Q.; Chen, P.; Liu, J.; Fu, Y.P.; Zhang, Y.M.; Wei, T.B. Colorimetric chemosensor and test kit for detection copper(II) cations in aqueous solution with specific selectivity and high sensitivity. Dyes Pigm. 2013, 98, 100–105. [Google Scholar] [CrossRef]
- Al-Juwaiser, I.A.; Ibrahim, M.R.; Al-Awadi, N.A.; Ibrahim, Y.A. An improved direct synthetic approach to anhydronucleosides. Tetrahedron 2008, 64, 8206–8212. [Google Scholar] [CrossRef]
- Saad, H.A.; Youssef, M.M.; Mosselhi, M.A. Microwave assisted synthesis of some new fused 1,2,4-triazines bearing thiophene moieties with expected pharmacological activitymosselhi. Molecules 2011, 16, 4937–4957. [Google Scholar] [CrossRef]
- Saad, H.A.; Moustafa, A.H. Synthesis and anticancer activity of some new s-glycosyl and s-alkyl 1,2,4-triazinone derivatives. Molecules 2011, 16, 5682–5700. [Google Scholar] [CrossRef]
- El-Nahass, M.M.; Ashour, A.; Atta, A.A.; Saad, H.; Hassanien, A.M.; Al-Baradi, A.M.; El-zaidia, E.F.M. Dielectric relaxation and optical properties of 4-amino-3-mercapto-6-(2-(2-thienyl)vinyl)-1,2,4-triazin-5(4H)-one Donor. Pramana 2017, 88. [Google Scholar] [CrossRef]
- Korostelev, P.P. Preparation of Solutions for Chemical Analysis Works; Publishing House of Academy of Sciences of the USSR: Moscow, Russia, 1964; p. 401. [Google Scholar]
- Lever, A.B.P. Inorganic Electronic Spectroscopy, 2nd ed.; Elsevier: Amsterdam, The Netherlands, 1997. [Google Scholar]
- Nakamoto, K. Infrared Spectra of Inorganic and Coordination Compounds; Willey: New York, NY, USA, 1970. [Google Scholar]
- Lund, A.; Shiotani, M.; Shimada, S. Principles and Applications of ESR Spectroscopy; Springer: New York, NY, USA, 2011. [Google Scholar]
- Cotton, F.A.; Wilkinson, G. Advanced Inorganic Chemistry, A Comprehensive Text, 4th ed.; John Wiley & Sons: New York, NY, USA, 1986. [Google Scholar]
- Geaey, W.J. The Use of Conductivity Measurements in Organic Solvents for the Characterisation of Coordination Compounds. Coord. Chem. Rev. 1971, 7, 81–122. [Google Scholar]
- Hamza, A.; Bashammakh, A.S.; Al-Sibaai, A.A.; Al-Saidi, H.M.; El-Shahawi, M.S. Part 1. Spectrophotometric determination of trace mercury (II) in dental-unit wastewater and fertilizer samples using the novel reagent 6-hydroxy-3-(2-oxoindolin-3-ylideneamino)-2-thioxo-2H-1,3-thiazin-4(3H)-one and the dual-wavelength β- correction spectrophotometry. J. Hazard. Mater. 2010, 178, 287–292. [Google Scholar]
- Barache, U.B.; Shaikh, A.B.; Lokhande, T.N.; Kamble, G.S.; Anuse, M.A.; Gaikwad, S.H. An efficient, cost effective, sensing behavior liquid-liquid extraction and spectrophotometric determination of copper(II) incorporated with 4-(4’-chlorobenzylideneimino)-3-methyl-5-mercapto-1, 2, 4-triazole: Analysis of food samples, leafy vegetables, fertilizers and environmental samples. Spectrochim. Acta A Mol. Biomol. Spectrosc. 2018, 189, 443–453. [Google Scholar] [PubMed]
- Jain, A.P.; Puri, B.K. Atomic absorption spectrometric determination of copper after adsorption of its sodiumdiethyldithiocarbamate complex on a new polymeric adsorbent. Indian J. Chem. 2006, 40, 409–411. [Google Scholar]
- Ghaedi, M.; Montazerozohori, K.M.M.; Shokrollahi, A.; Soylak, M. Flame atomic absorption spectrometric (FAAS) determination of copper, iron and zinc in food samples after solid-phase extraction on Schiff base-modified duolite XAD 761. Mater. Sci. Eng. C 2013, 33, 2338–2344. [Google Scholar] [CrossRef] [PubMed]
- Al-Saidi, H.S. Biosorption using chitosan thiourea polymer as an extraction and preconcentration technique for copper prior to its determination in environmental and food samples by flame atomic absorption spectrometry: Synthesis, characterization and analytical applications. Int. J. Biol. Macromol. 2016, 93, 390–401. [Google Scholar]
© 2020 by the authors. Licensee MDPI, Basel, Switzerland. This article is an open access article distributed under the terms and conditions of the Creative Commons Attribution (CC BY) license (http://creativecommons.org/licenses/by/4.0/).