Article

Effect of Haptic Feedback on Pilot/Operator Performance During Flight Simulation

Research Centre for Modeling & Simulation, National University of Sciences & Technology, Islamabad 44000, Pakistan
*
Authors to whom correspondence should be addressed.
These authors contributed equally to this work.
Appl. Sci. 2020, 10(11), 3877; https://doi.org/10.3390/app10113877
Submission received: 20 March 2020 / Revised: 7 May 2020 / Accepted: 15 May 2020 / Published: 3 June 2020

Abstract

:
Flying an unmanned aerial vehicle (UAV) is a challenging task, due to the absence of direct sensory information such as a view of surroundings, sound, vibrations, and motion. It is important to provide these sensory stimulations to an operator for better situational awareness and efficient control. In this research, we study the effects of incorporating haptic feedback in UAV flight control. We present an experimental evaluation of three flight control scenarios, that is, in the absence of haptic feedback, in the presence of realistic haptic feedback, and an exaggerated haptic feedback. These three conditions are tested for an altitude hold, gain, and descent task in the flight simulation environment. A linear mathematical model is used to simulate the flight dynamics of a UAV controlled by a 6 DOF Touch 3D Stylus haptic device. Fifteen untrained users are recruited to participate in the flight simulation experiment. The analysis of the results of the experiment indicates an improvement in the longitudinal flight control performance. Specifically, the altitude hold task is better performed with no feedback, the altitude gain with exaggerated haptic feedback, and the altitude descent with realistic haptic feedback. A subjective evaluation in the end corroborates these findings.

1. Introduction

Haptic aids in controlling unmanned aerial vehicles (UAVS) and remotely operated vehicles are gaining interest. The provision of artificial stimulants in the control of UAV flight, remotely as well as in simulation environments, is vital for an increased sense of immersion. Such sensory stimulation is introduced artificially inside the flight simulator/ground control station (GCS) to make the operator experience more natural and realistic than with a visual display alone, due to its limited field of view being insufficient and often unsafe for achieving the flight objectives in flight simulation/teleoperation [1,2]. In order to incorporate these sensory stimulations, different systems are installed at the GCS, varying in the cost, fidelity requirement, manufacturer capability, and scope of research and development. One of the most important stimulants that should be provided to a UAV operator at the GCS are the forces that are analogous to those acting on the control stick in a manned aircraft flight. Others sensory modalities include visual, vestibular, and auditory stimulations. In this research, the effect of haptic feedback on the operator and his/her behavior in controlling the UAV is explicitly investigated.
Aerodynamic loads on control surfaces of the UAV are used to obtain the forces acting on the control stick. These forces are calculated and rendered to help the operator perceive the haptic load that is on the control stick, due to the aircraft’s flight state [3]. For example, if an operator performs a turn during a flight, the loads experienced on the control surfaces are transmitted to the control stick inside the cockpit, thereby delivering information about the status of the flight conditions to the operator through the sense of touch. The steady/unsteady loads experienced on the control stick stimulate the haptic sensors of the operator. The hardware for the haptic system consists of an artificial force-loading mechanical device attached to the control stick. This mechanical device controls the magnitude and rate of the force feedback to be transmitted to the control device. It is anticipated in this research that the effect of artificial haptic feedback on the control stick will generate a more immersive experience for the operator and improve his/her situational awareness. More specifically, the goal of this research is to investigate the use of accurate force feedback on the basis of aerodynamic models in improving handling qualities of fixed wing UAVs during flying.
Haptic feedback has been used to enhance the information provided by the visual display in various applications. It has been shown that the use of haptic aiding systems improves the handling qualities of UAVs or other remotely operated vehicles [4,5,6,7]. Haptic feedback was provided in the form of attractive and repulsive magnetic forces by defining an artificial force field in obstacle avoidance tasks and exploratory missions. It was demonstrated that the number of collisions and time of mission completion were reduced, due to such haptic cues [8,9]. Control barrier functions (CBF) have been used to generate force feedback for a quadcopter UAV to aid a safe operation and were evaluated against two conditions, that is, no haptic aids and artificial force fields [10]. Generic haptic aids have been used to investigate the change in pilots’ visual and neuromuscular response in target tracking tasks [11]. The utility of haptic feedback as a support system during pilot training was evaluated and shorter training times were observed [12]. Another direction of research is to generate haptic feedback on the basis of pilot intent estimation [13]. Emerging technologies such as robot-assisted surgeries and self-driving vehicles are becoming more effective and risk free by introducing haptic feedback technologies [14,15]. Instead of using conventional methods of providing feedback in response to detected collisions, the authors [16] used optical flow measured by a wide angle camera mounted on a moving robot for generating haptic forces in the virtual environment. The analysis of responses solicited by using NASA TLX suggested that the operator workload was reduced when haptic feedback was provided for the interaction with virtual environments [17,18].
Haptic feedback can be used to minimize visual illusions experienced by operators while landing in a featured or featureless night environment. Operators rely on haptic cues more in a virtual landing task, as compared to visual cues which can reduce landing illusions. Moreover, haptic feedback has more impact for up/down movements (i.e., elevator control or pitch rotation) rather than left/right movement (i.e., roll and yaw rotations) [19].
Other benefits of haptic feedback were presented in terms of efficient control [17,18], enhanced skill learning [20,21], and improved situational awareness [22]. On the basis of the analysis of previous studies, it is observed that there exists a significant effect of incorporating haptic feedback in UAV controls for obstacle avoidance, exploratory missions, increasing situational awareness, minimizing landing illusions, and so forth. Here, we evaluate the effect of haptic feedback on navigational tasks for fixed wing UAVs. We develop a bare-bones UAV flight simulator for optimizing the navigational control of a virtual aircraft. The external forces acting on the aircraft are simulated and the operator is asked to continuously adjust controls to complete a navigation task. The operator provides motion commands to the UAV while receiving force feedback from a 6 DOF haptic device. We believe that the force feedback will provide better situational awareness and effective navigation. To this end, the following hypotheses are made:
  • While the presence of accurately modeled haptic forces provides better control of a UAV, unrealistic or exaggerated forces may produce better handling of the aircraft.
  • The role of haptic feedback in UAV handling varies for different phases of flight. In other words, a single force model may not produce better navigational control across all phases of flight.
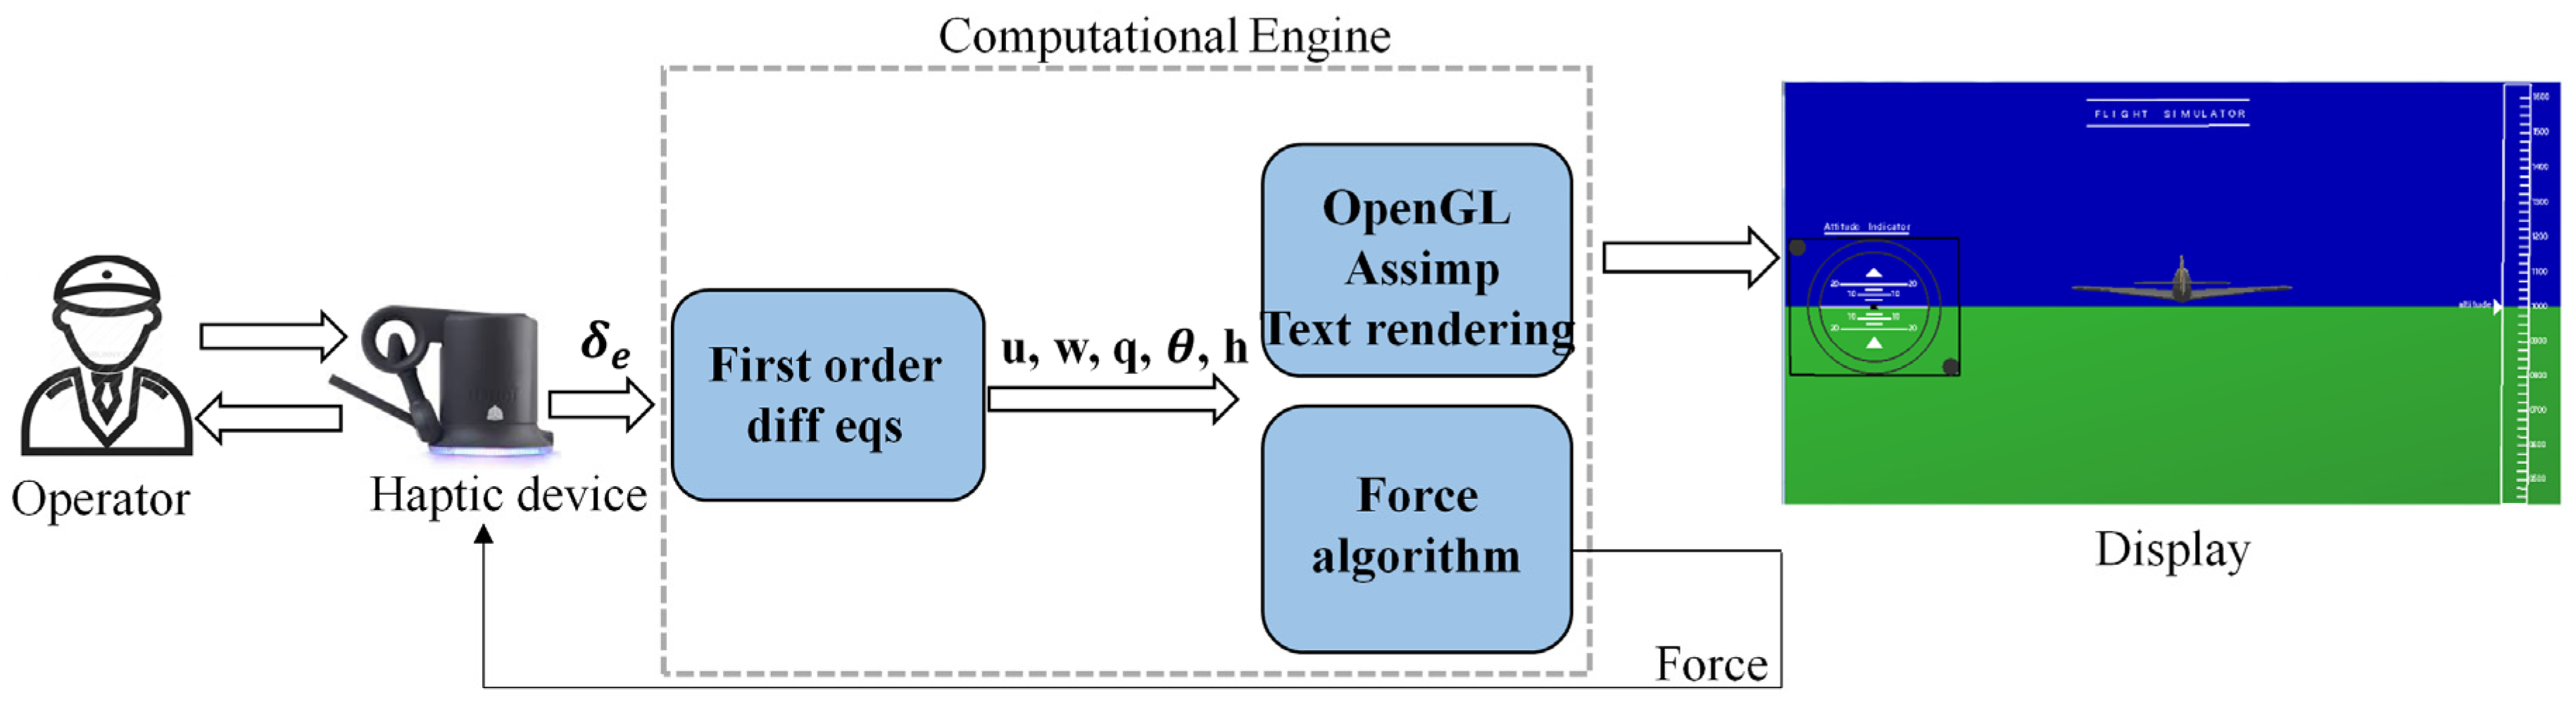
2. Methodology

Keeping in mind that haptic feedback helps achieve mission objectives more efficiently and provides better situational awareness without an increase in the workload of an operator, the focus of this research is to develop a flight simulator for fixed wing UAV by incorporating haptic feedback and study its effect on operator performance. This research consists of two main parts, the first describes the flight simulation including the visual interface for the visualization of flight, the dynamic modeling of a UAV, and the rendering of haptic forces. In the second part, we study the effects of the proposed system on operator performance based on how accurately one can hold a specific altitude for a given time.
Figure 1 shows the proposed system architecture, explains the mapping of functionality and how different components are communicating with each other to produce the resultant output. It consists of synchronized graphics and haptic loops, where the former updates the visual display which helps the operator to see different flight parameters like altitude of the UAV, and the latter generates a feedback force that helps the operator feel the forces acting on the control surfaces. These forces are rendered on the basis of the flight parameters obtained from the dynamic modeling of UAV and position/orientation of the haptic device.

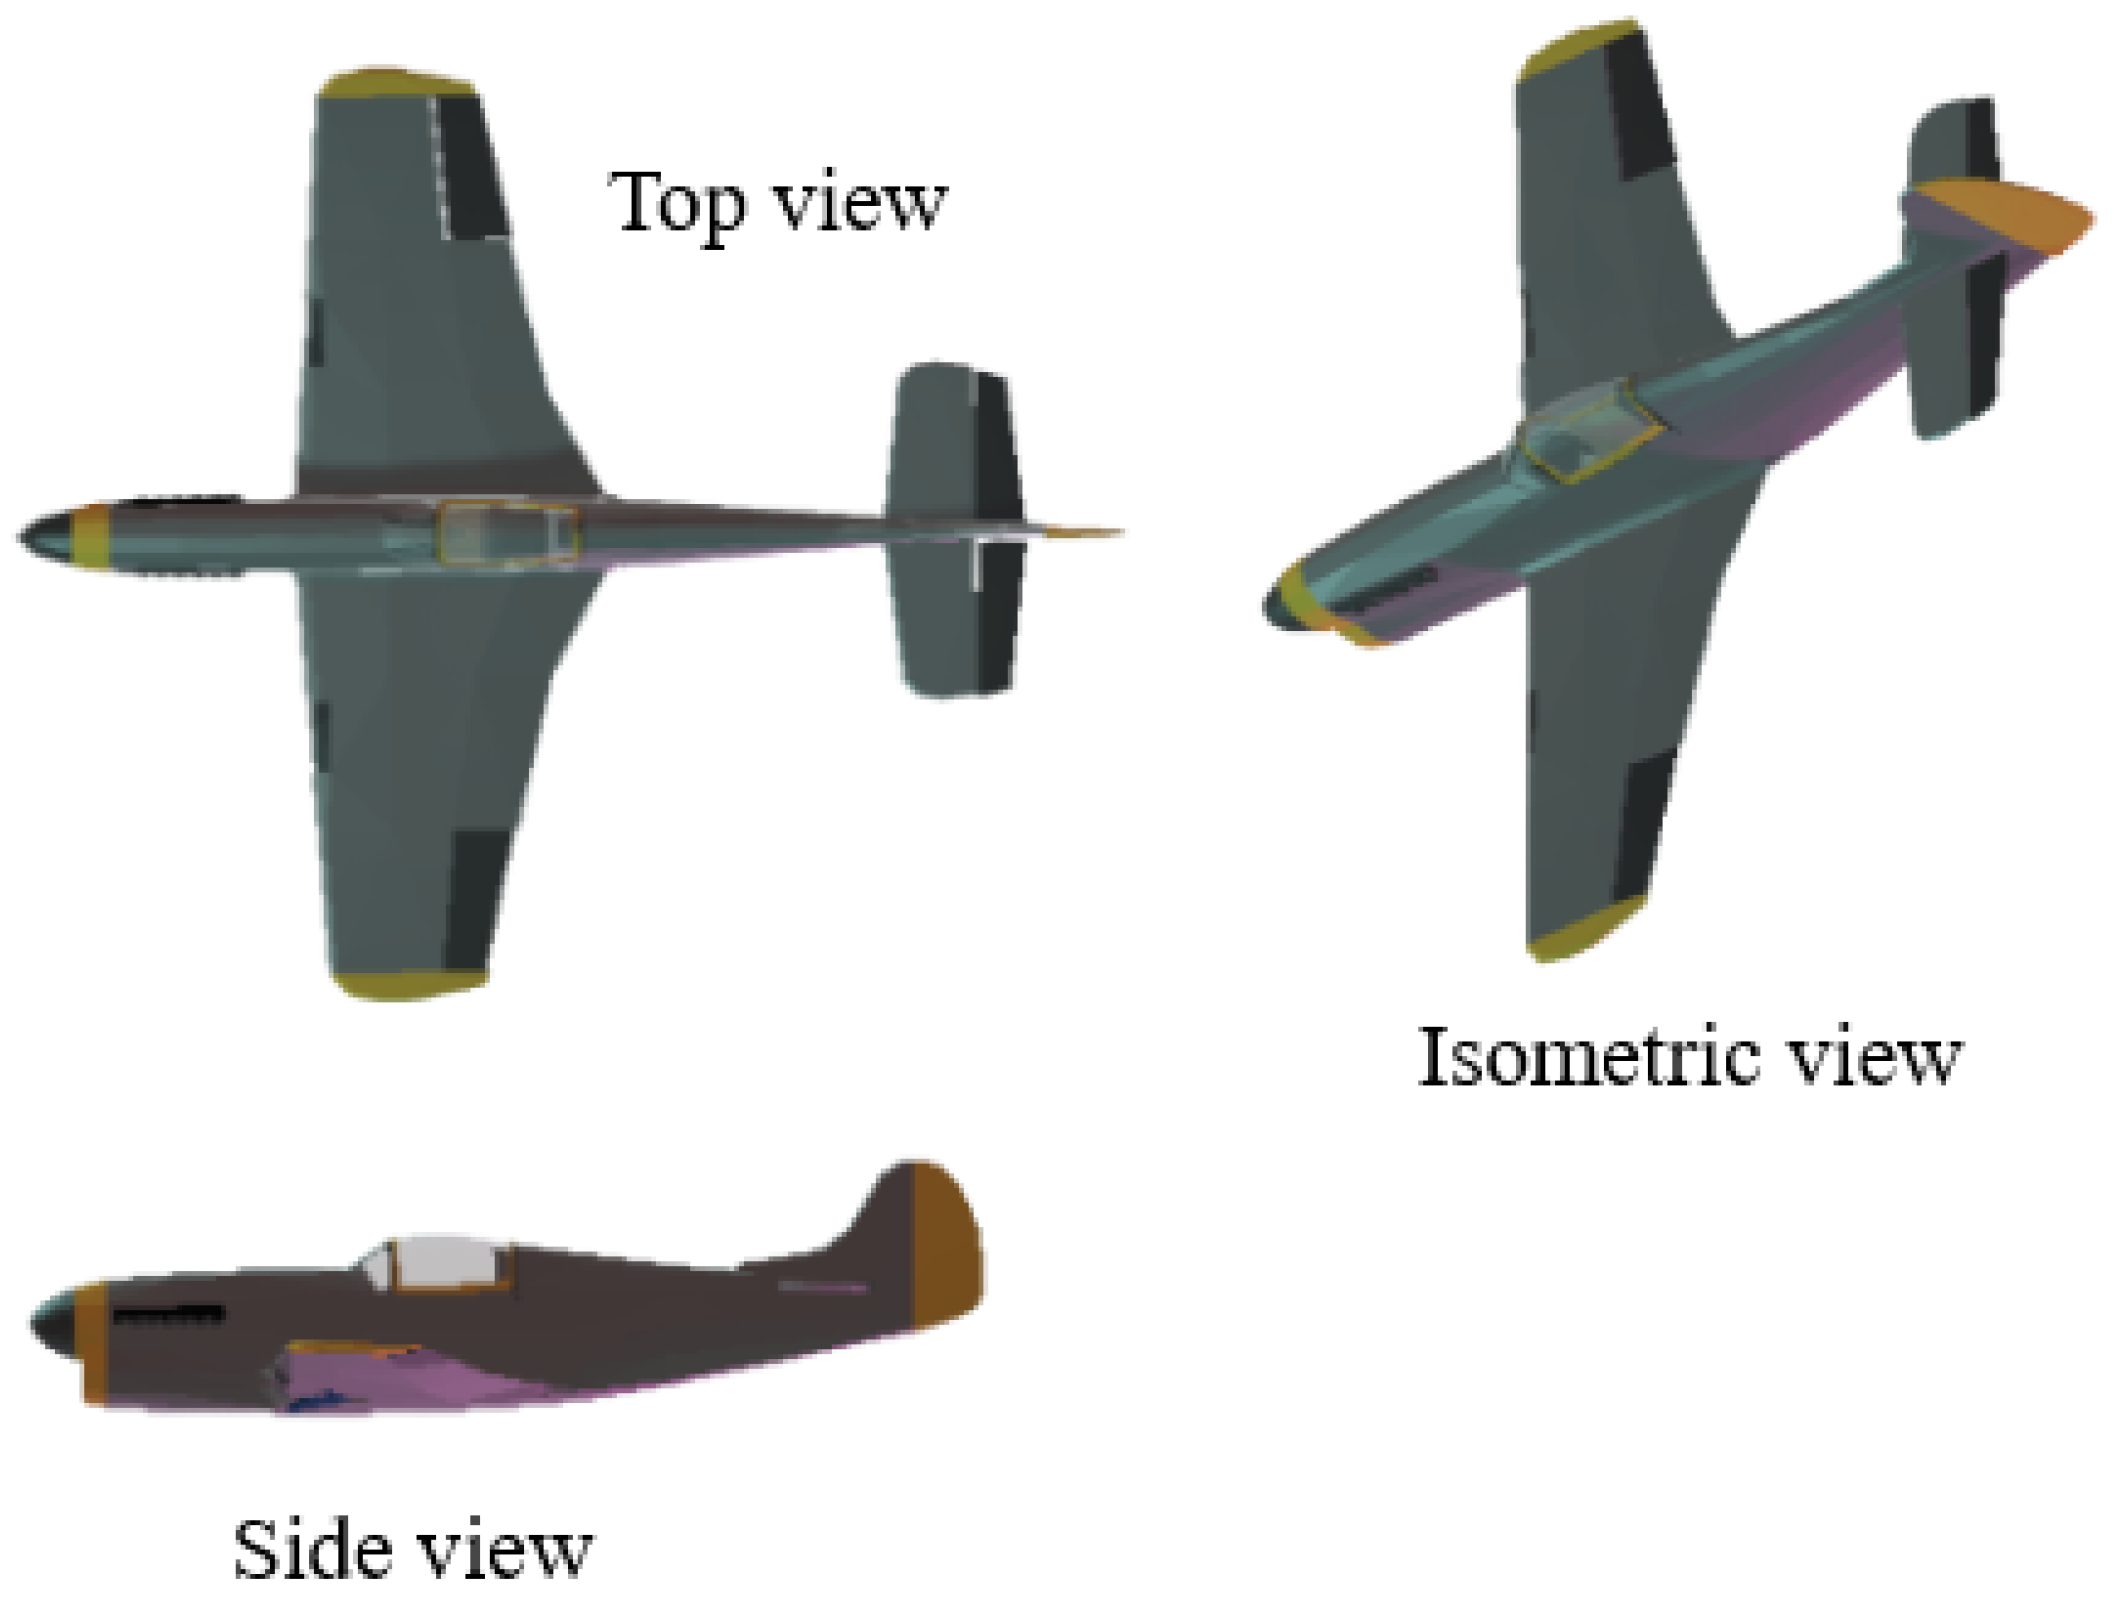
2.1. Aerodynamic Modeling of UAV

The aerodynamic modeling of a UAV involves the modeling of control surfaces, the reaction to varying flight conditions, and the response to different changes in aircraft [23]. Such mathematical modeling allows for testing different flight parameters in simulations rather than real aircrafts which are not economical or safe and require specialized equipment and environment [24].
In this paper, we limit our experimentation and discussion only to the pitch rotations of the aircraft and its response to velocity and thrust. Therefore, we assume a decoupling between longitudinal and lateral-directional dynamics [25]. The modeling of UAV is a stepwise process in which, firstly, we linearize our model by considering small perturbation theory and steady state conditions [26], and represent our system, using first order differential equations. Next, we solve moment and force equations to obtain dimensionless derivatives and, then, find numerical values of these derivatives using the xflr5 analysis tool similar to the study [27] by using the UAV parameters given in Table 1.
This study uses a UAV based on the conventional RC aircraft model, as shown in Figure 2.
Aerodynamic derivatives, mass, and inertial characteristics are written as coefficients in first order differential equations, which are the state space representation of the system. The complete state of the system is described by a set of variables whose number depends on the DOF of the system.
x ˙ = Ax + Bu
where A is the system matrix, x is the state vector containing variables describing state of the system, B is the input matrix, and u is the input vector having input variables, that is, thrust and control surface deflections.
The state space representation of our system is as follows:
u ˙ w ˙ q ˙ θ ˙ h ˙ = X u X w X q g cos θ o 0 Z u Z w Z q g sin θ o 0 M u M w M q 0 0 0 0 1 0 0 0 cos θ 0 u cos θ + w sin θ 0 u w q θ h + X δ e X δ t Z δ e 0 M δ e 0 0 0 0 0 δ e δ t
where u is forward velocity, w vertical velocity, q pitch rate, θ pitch angle, θ o trim pitch angle, and h is the altitude.
In the design of longitudinal control, pulling of the control stick conventionally corresponds to negative elevator input which performs a pitch-up motion, that is, rotates the UAV nose upward, causing an increased altitude. The response of the mathematical model of the UAV to 1 ° elevator input is shown in Figure 3a. A push force on the control stick will have the opposite response, causing the UAV to speed up with the nose downward and decreasing the altitude, as shown in Figure 3b, where the UAV response to + 1 ° elevator input is displayed. Figure 3 validates the mathematical model and the longitudinal control convention.

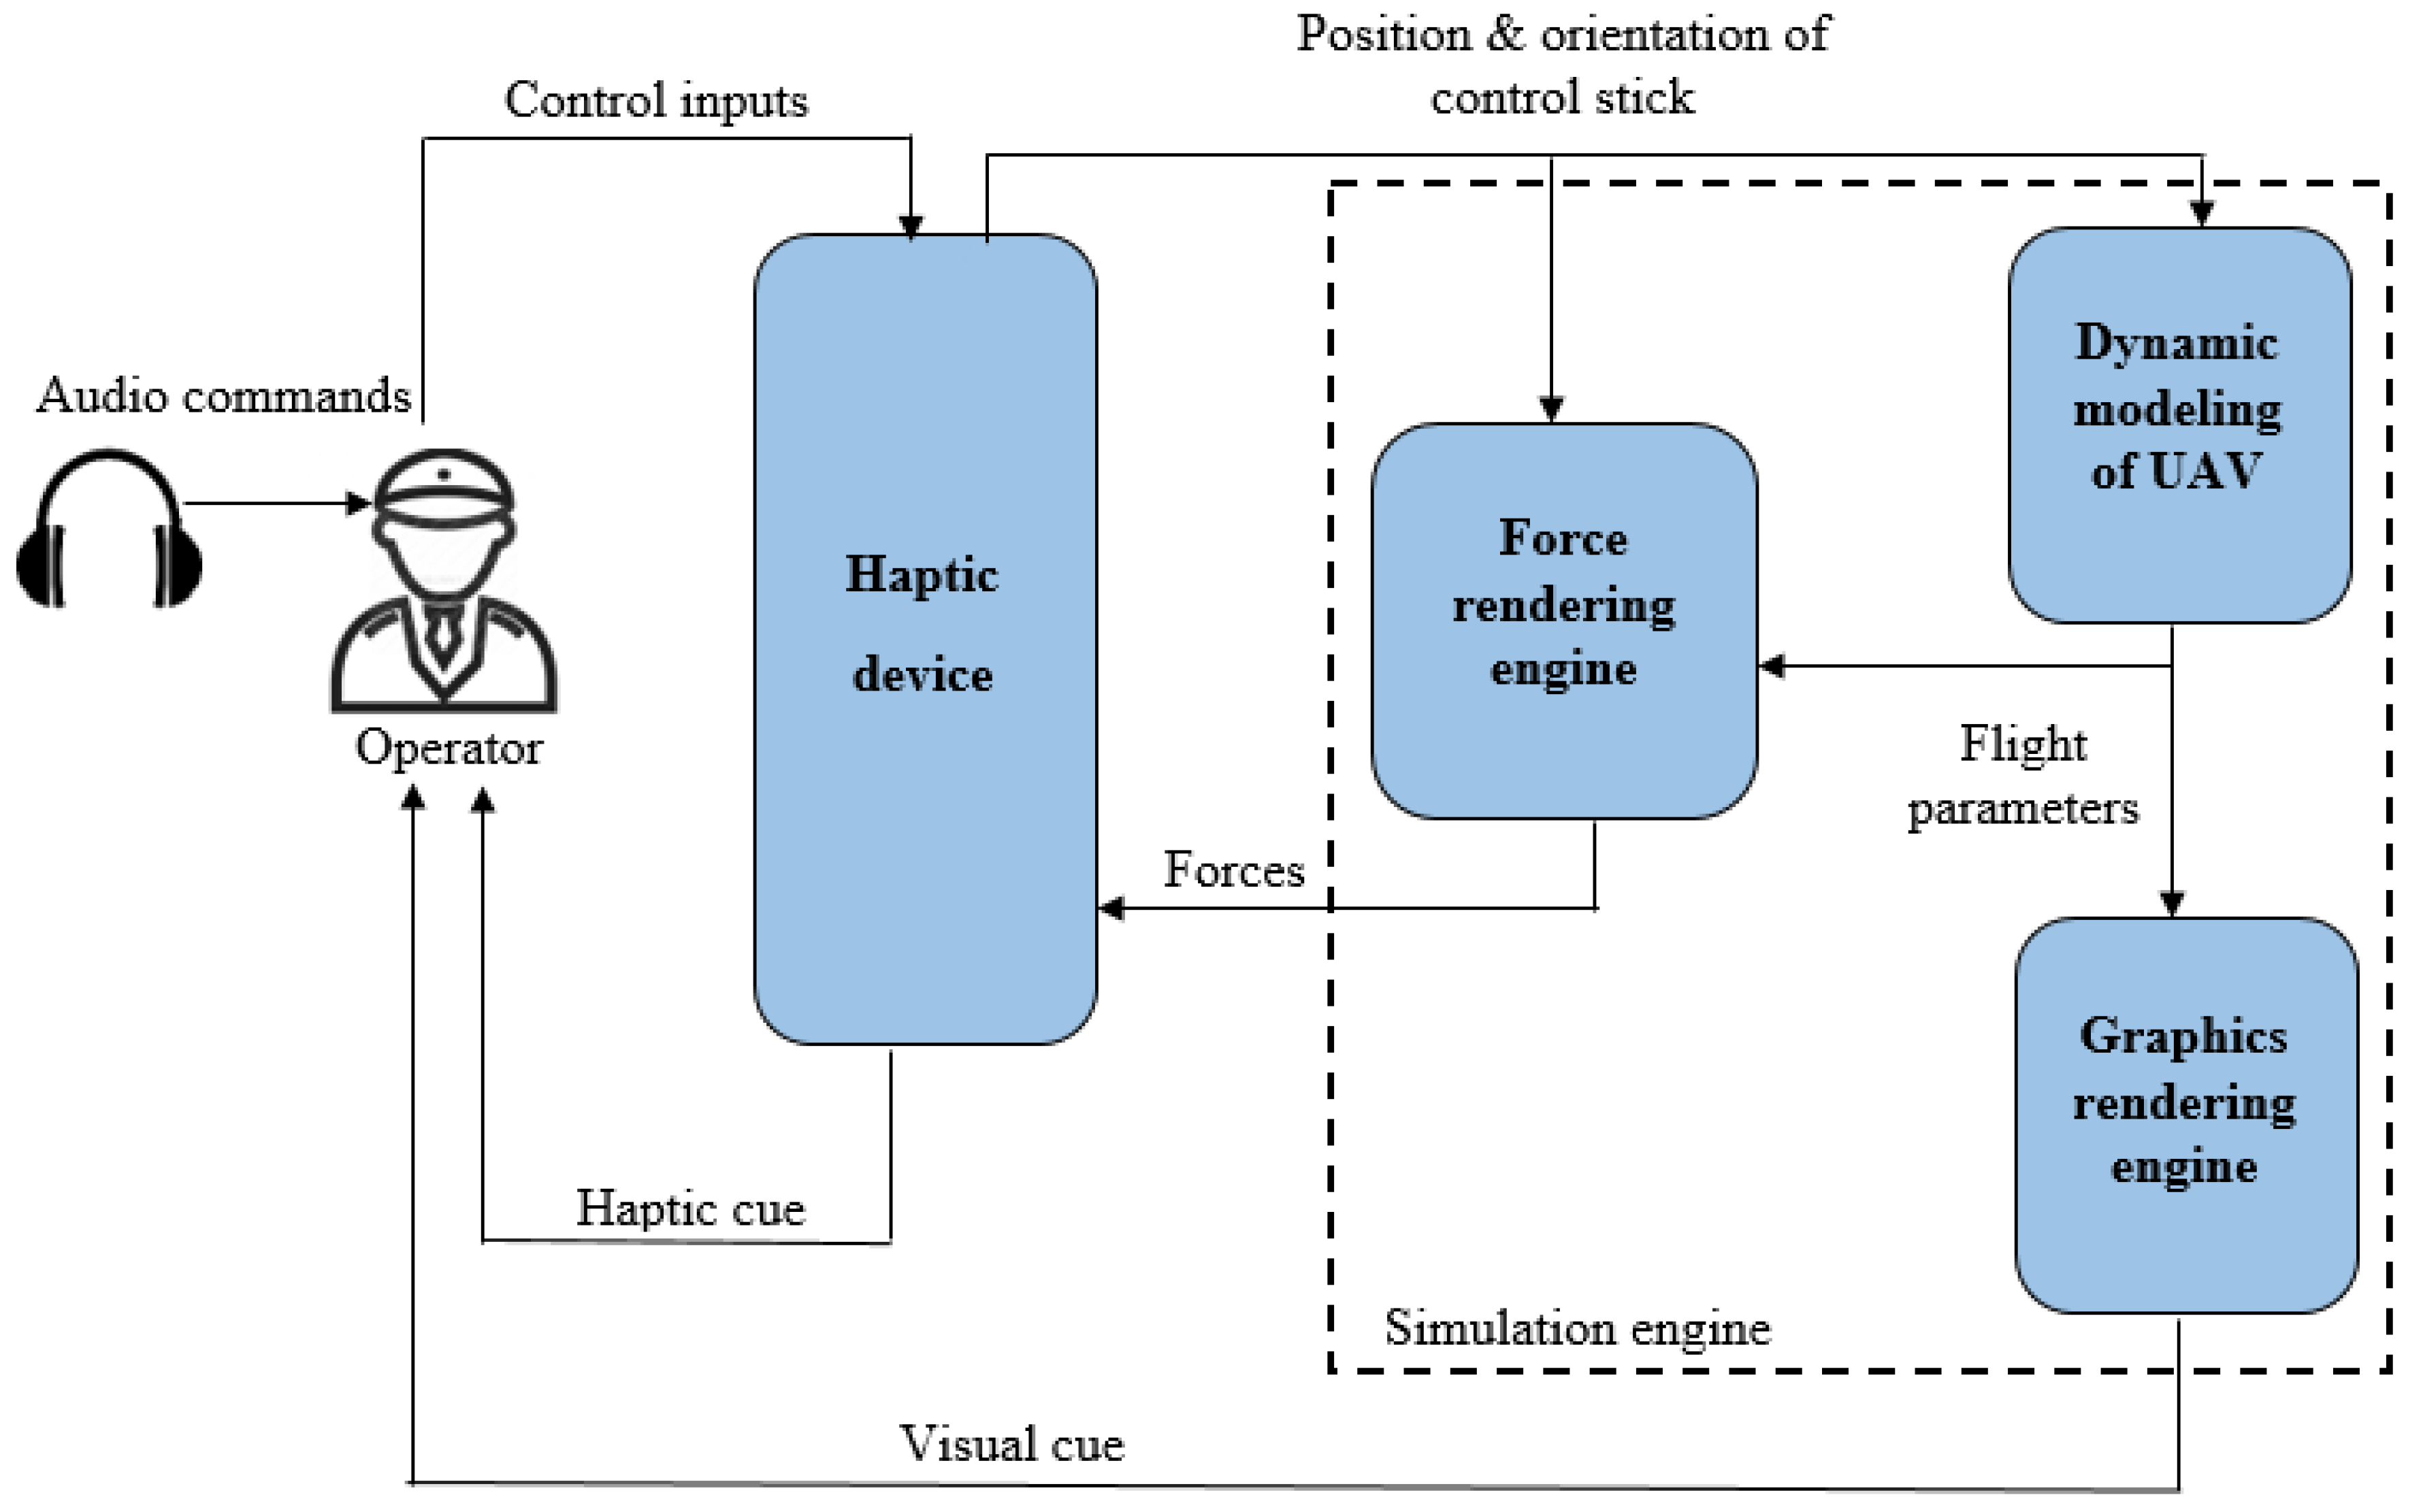
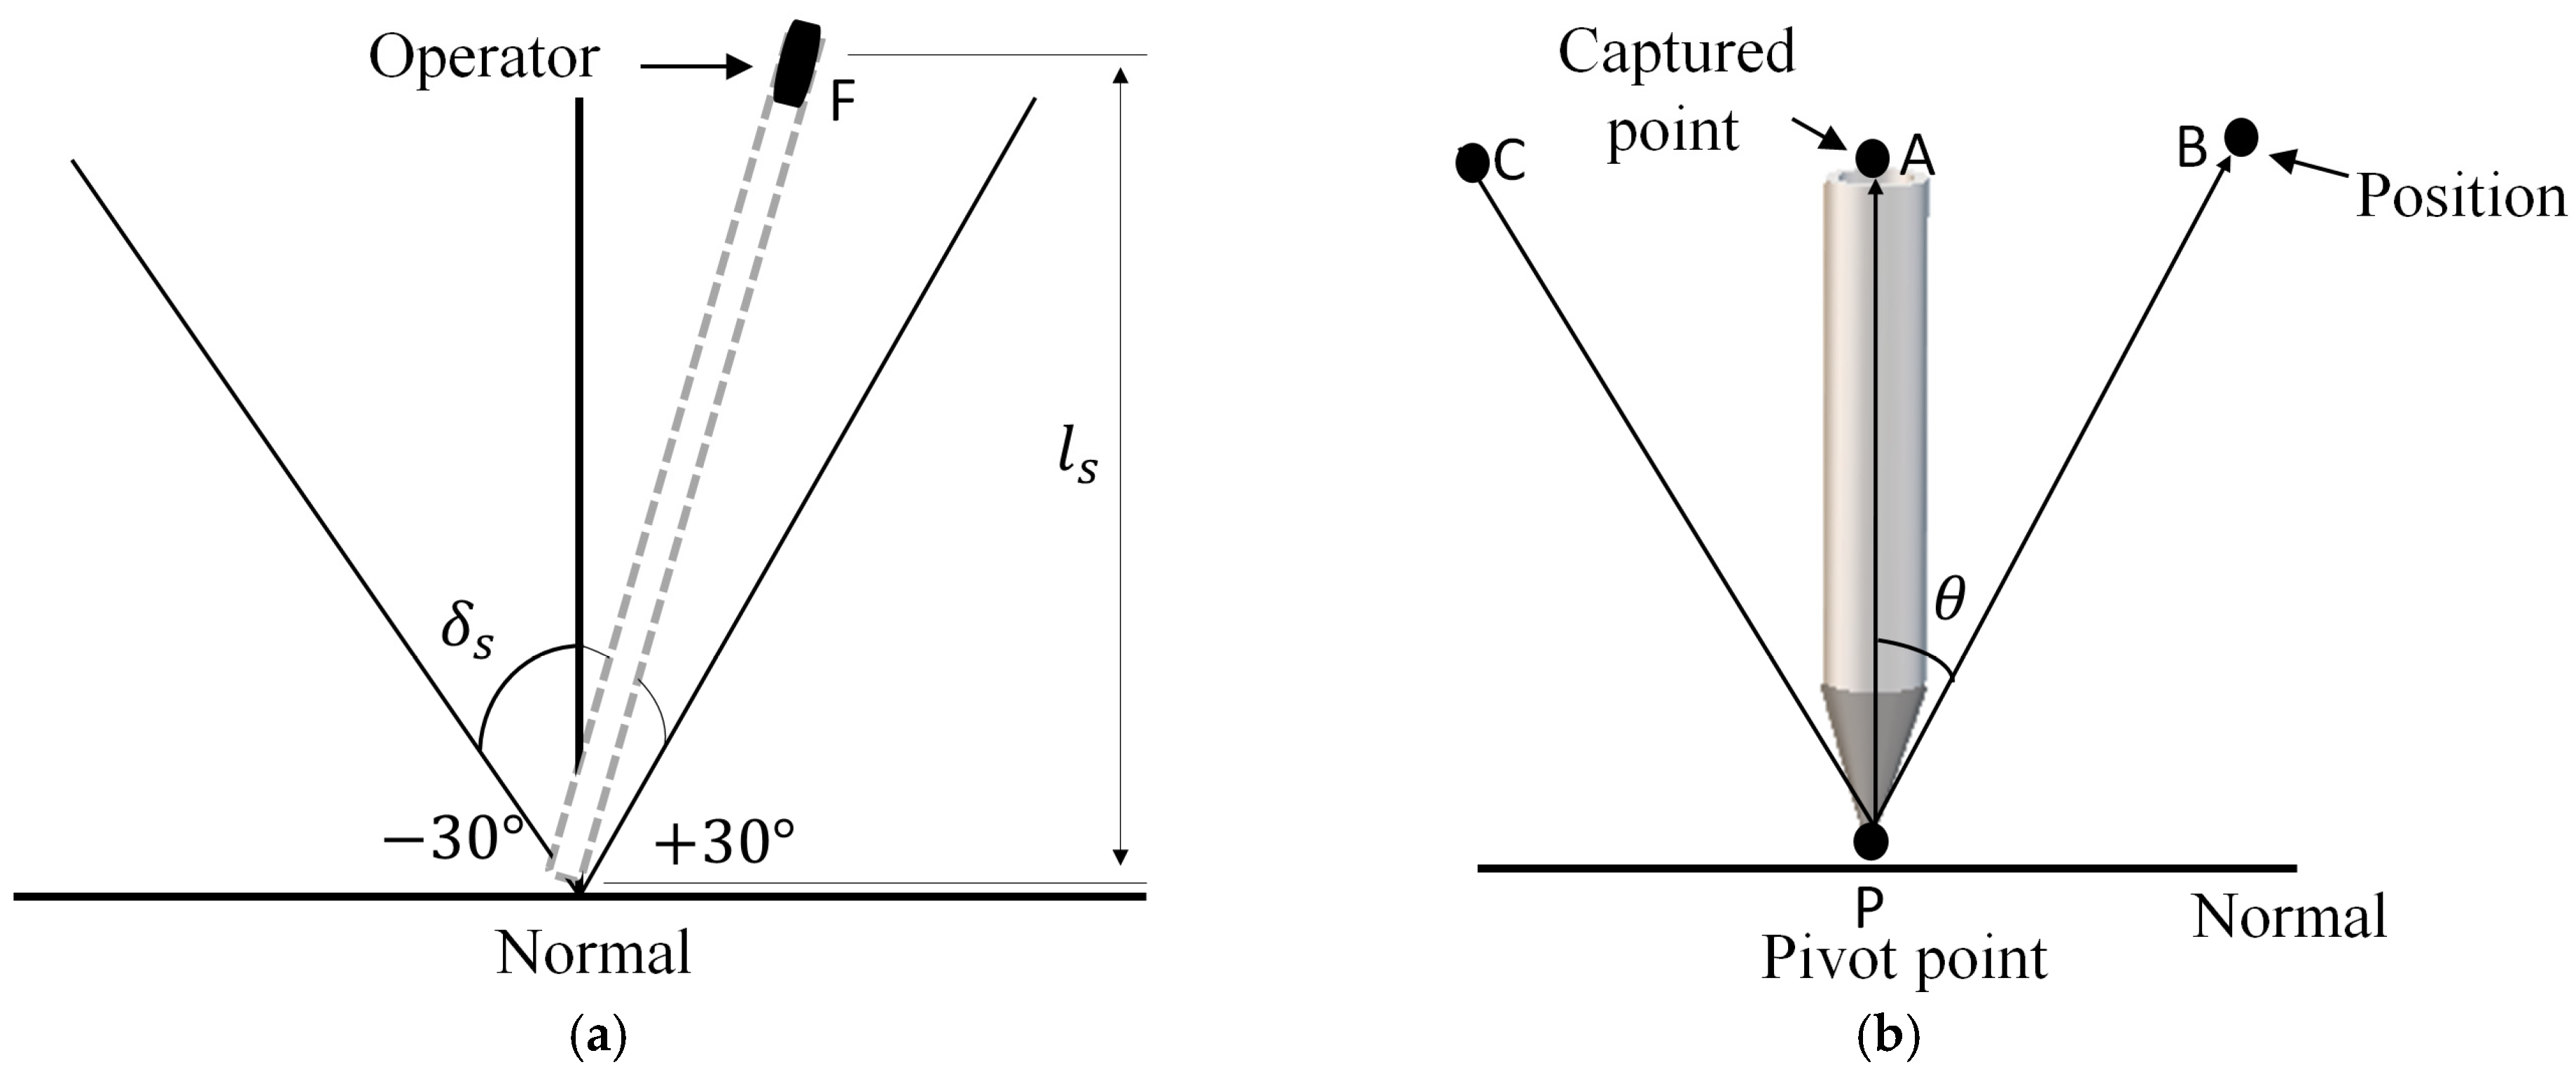
2.2. Haptic Rendering

For the calculation of haptic forces, we used the same idea as for the forces felt in a manned aircraft. To deflect a control surface, an elevator in our case, the operator moves the control stick in either direction, forward/backward in our case. The force F exerted by the operator to move the control surface, called the stick force, is proportional to the hinge moment H e acting on the control surfaces. To move the control surface, the operator has to overcome the hinge moment by applying force.
The hinge moment can be expressed as having the combined effects of the tail angle of attack α t , elevator deflection δ e , and tab angle δ t separately. The hinge moment coefficient C h e can be expressed as
C h e = C h o + C h α t α t + C h δ e δ e + C h δ t δ t
where C h o is the residual moment, C h α t = d C h d α t , C h δ e = d C h d δ e , and C h δ t = d C h d δ t . Precise hinge moment parameters are hard to find analytically, so wind tunnel tests are required to find these values for the optimal control system design.
As mentioned earlier, the work done for displacing the control stick is equal to the work done in overcoming the hinge moment and moving the control surface to the desired deflection angle. This can be mathematically expressed as
F = H e δ e l s δ s
where l s and δ s are the length of control stick and stick deflection angle, respectively, and the δ e l s δ s part of Equation (4) is the gearing ratio G used to provide mechanical advantage in a control system.
Now, we define the hinge moment as
H e = 1 2 C h e ρ V 2 s e c e
where ρ is air density, V is speed, s e is the area of the hinge line and c e is the chord length of the UAV whose values are state in Table 1.
Using H e in Equation (4), the relation for the control stick force becomes
F = 1 2 δ e l s δ s C h e ρ V 2 s e c e .
In order to mimic the forces experienced by an operator of a manned aircraft in a flight simulation, forces are calculated and rendered using the relation expressed in Equation (6). It can be seen that the magnitude of force increases with the UAV size and square of speed. The control parameter in our case is δ e in Equation (2), which depends on the control stick deflection simulated by the haptic device. δ e is updated based on the input from the operator and flight parameters (forward and vertical velocity, pitch rate, angle and altitude) are calculated by solving the first order differential equations (FODEs) of the mathematical model. Pitch angle θ is passed to the UAV model for the visualization of pitch rotation. The speed of the UAV is obtained from the forward and vertical velocities u and w, respectively. Similarly, the altitude of the UAV is determined from Equation (2) using FODE. These flight parameters are then passed to the graphics and force rendering engines to update the visualization in real time and render forces through the haptic device to the operator. The graphical user interface shown in Figure 4 consists of the UAV model, an attitude indicator used to give immediate and direct indication to aircrafts pitch and bank in reference to an artificial horizon, and an altimeter to show the altitude of the UAV.
The workflow of the developed system is shown in Figure 5. The operator continuously adjusts the UAV controls, using the control stick modeled using a 6 DOF haptic device, the motions of which are constrained to mimic those of the control stick of an aircraft. The computations for calculating flight parameters are handled by a computational engine which comprises of graphics and force rendering engines.
When designing the control mechanism for a UAV, it is important to maintain a relationship between the control stick movement and the control surface (i.e., elevator) deflection that is within acceptable limits. In our case, it is achieved by mapping in such a way that 1 ° control stick deflection is equal to 1 ° elevator deflection and the total workspace is between + 30 ° and 30 ° , as shown in Figure 6a. In terms of haptic rendering, the feedback force should be mapped such that it restricts an operator from overstressing the UAV and it should be of enough magnitude that it gives the operator a feel of the commanded maneuver. Moreover, the force magnitude also provides the operator with an indication of the severity of the motion that will result from the control stick movement. In this study, the effect of haptic feedback on lateral-directional dynamics is not considered. However, considering coupling phenomena, the study can be extended by incorporating roll and yaw moments, if high angles of attack are considered.
In this study, we used the Touch 3D Stylus haptic device which can handle 6 DOF input and is capable of producing 3 DOF force feedback. Since we only model longitudinal dynamics, as we restrict our analysis only to pitch rotations of the UAV, we designed a mechanical linkage onto which the haptic device stylus is mounted, i.e., at point A in Figure 6b. Point A is the reference point on the basis of which the control stick deflection θ , by taking the dot product between vectors PA and PB and the corresponding forces, is computed. Thus, the haptic device is limited to 1 DOF and has a close resemblance to an actual control stick of an aircraft (Figure 7).

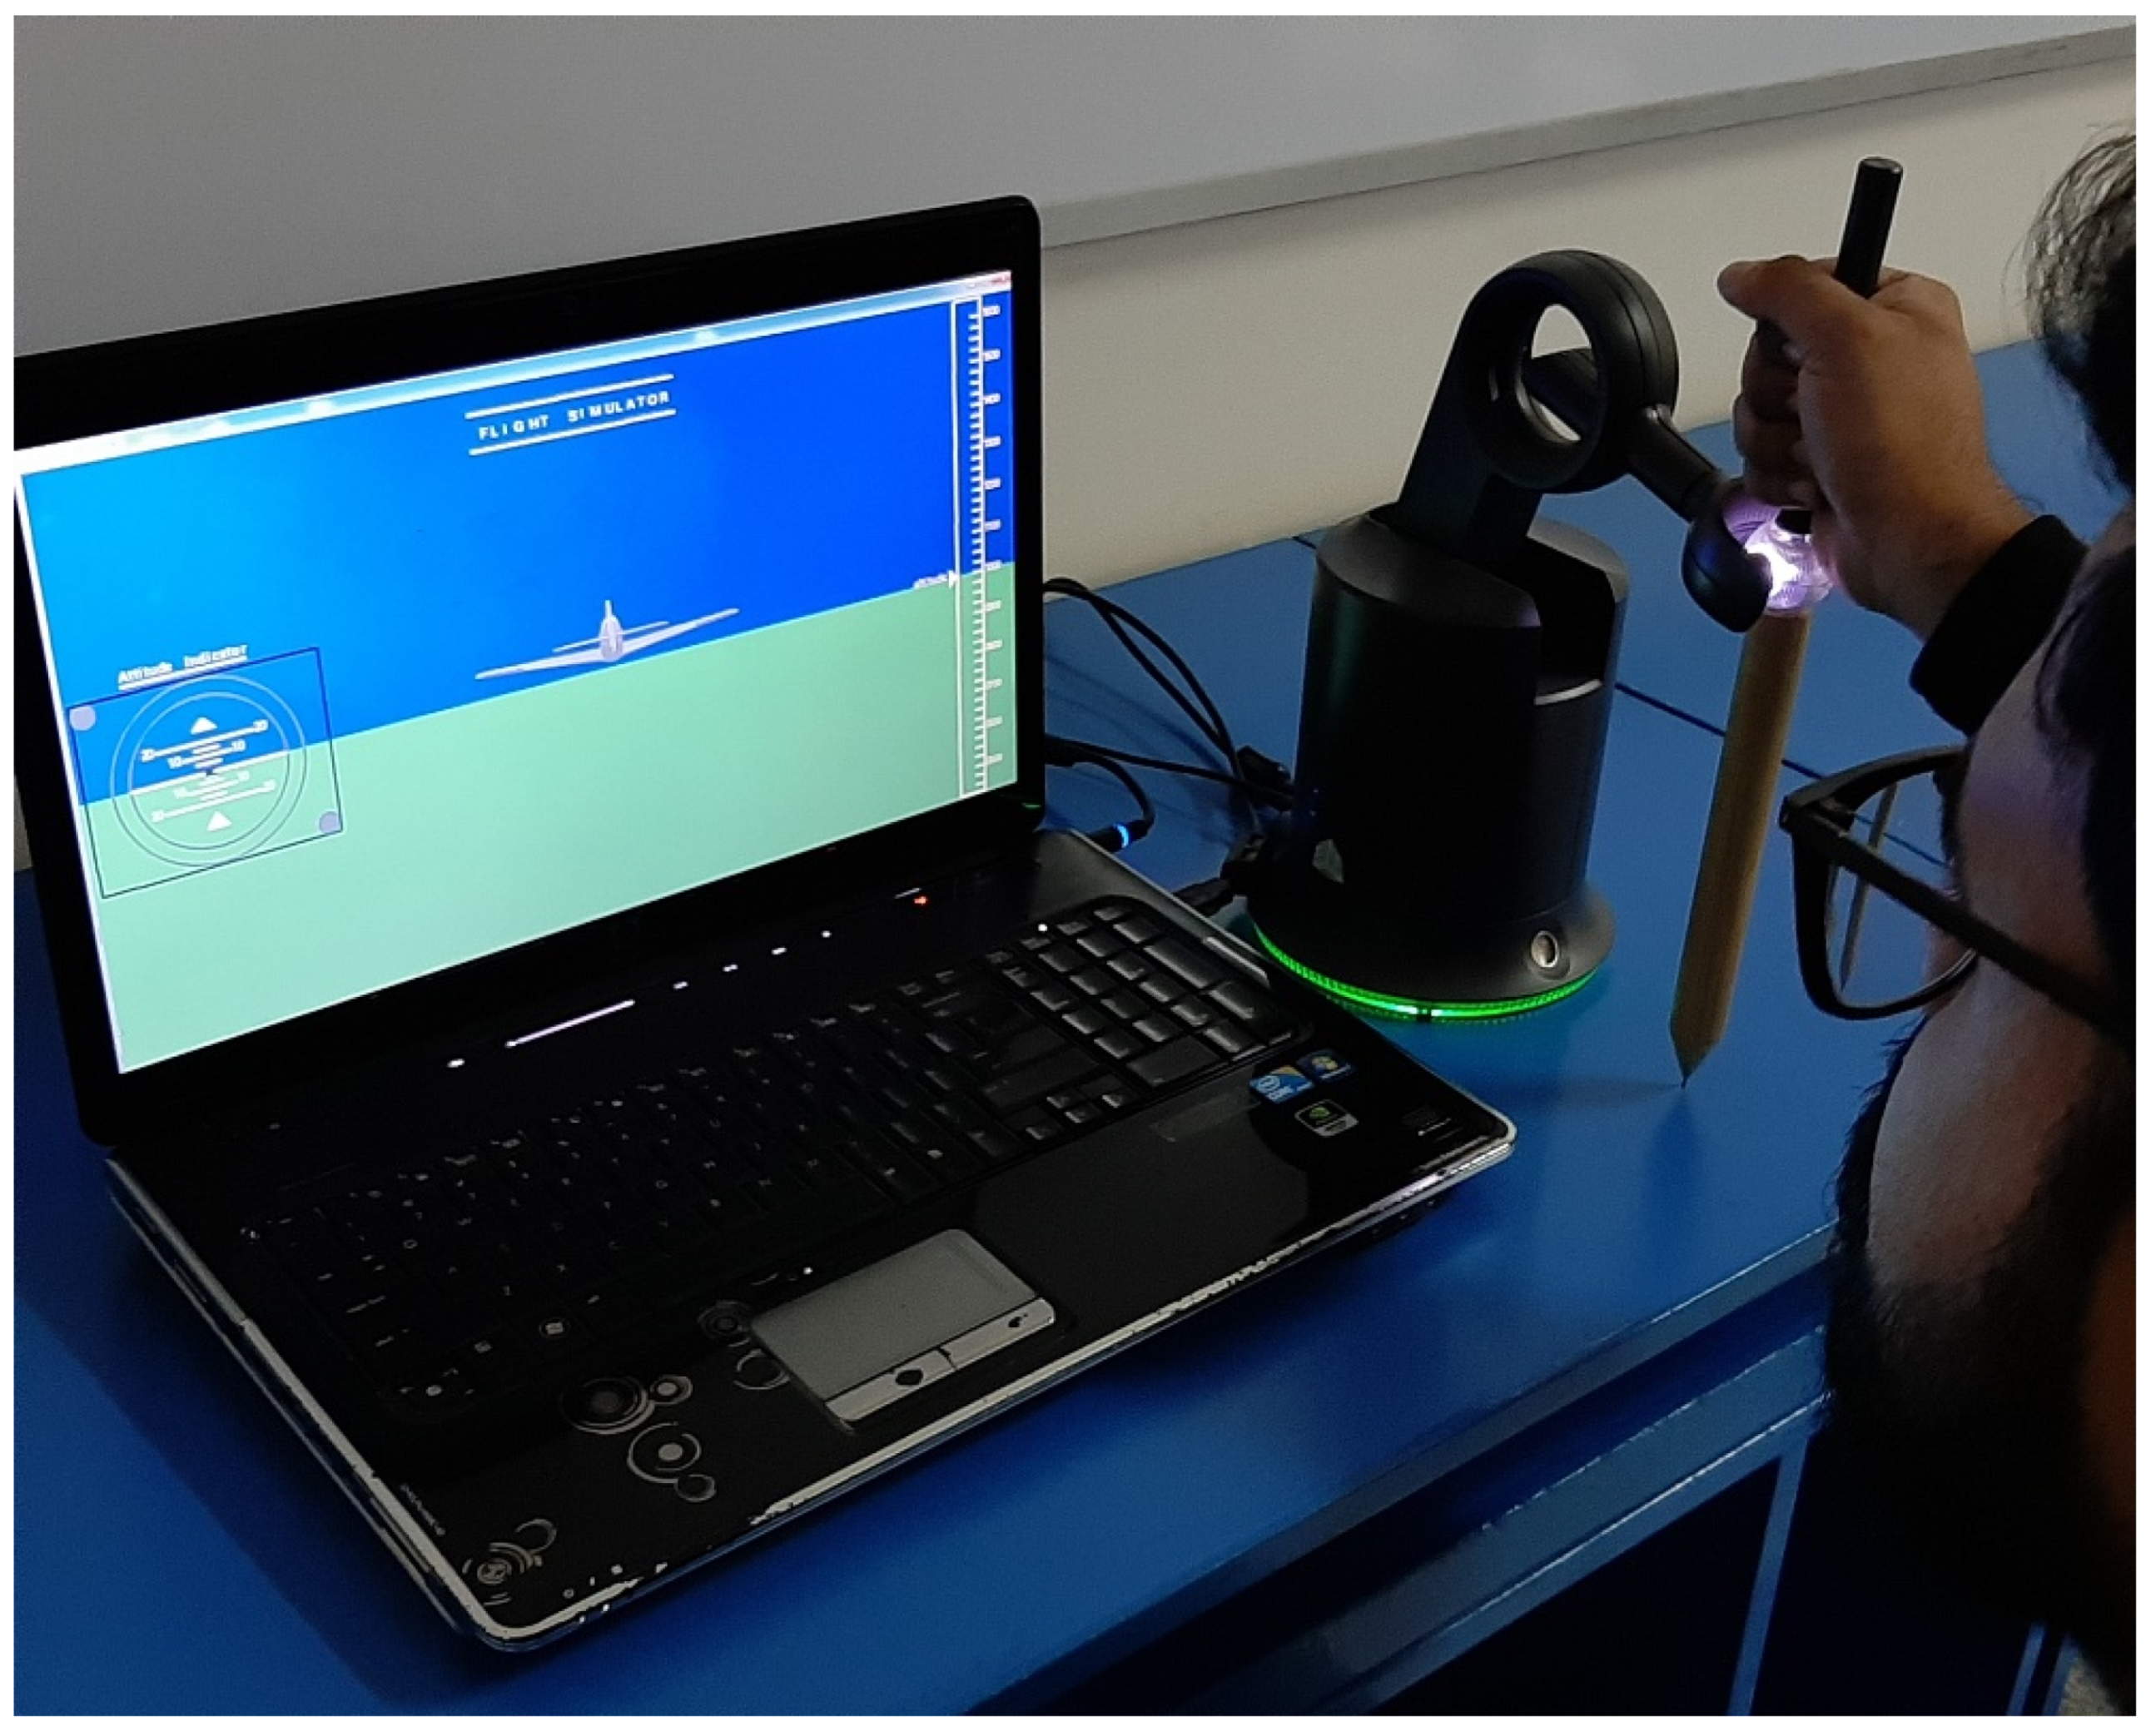
3. Experiment Design

The aim of the developed system is to study the effects of incorporating haptic feedback into the controls of a fixed wing UAV on the handling capabilities of operators during different phases of flight. To this end, an altitude hold task was designed and validated on graduate students enrolled in the Computational Engineering postgraduate program at National University of Sciences & Technology, Islamabad. The altitude hold task was chosen on the basis of the findings from previous studies [19] which show that haptic feedback has a significant effect on performance when it is related to pitch rotation (up and down movement) as compared to yaw or roll rotations.
Fifteen graduate students enrolled in the Computational Engineering program participated in the study. None of them had any previous experience in interacting with force feedback haptic devices. A list of instructions on how to operate the haptic device was given to every user. To acclimatize the users with the use of haptic forces, they were asked to use the haptic device in an application available as an example in the OpenHaptics SDK. The application allowed them to interact with objects in a virtual environment and experience force feedback on collision. The use of the application before the study enhanced user confidence in haptic device control. The experiment on each user consisted of three testing scenarios: flight control in the absence of force feedback, flight control in the presence of realistic force feedback, and flight control in the presence of exaggerated force feedback, i.e., twice the force computed by the mathematical model. These three force conditions were chosen to evaluate if accurate haptic modeling always results in better UAV control. Each scenario was tested for 2 min 30 s. The total experimentation time was 120 min with approximately 8 min for each user. In each scenario, the task was to increase or decrease an altitude to a height specified by the acoustic command and hold that altitude until the next command (30 s altitude hold time). The user had to move the haptic device backward and forward to increase and decrease the altitude of the UAV, respectively. The three testing scenarios were run in a random order for different users, and to remove bias, they were not informed about which scenario was being played.
There was a total of five acoustic commands: (1) Hold altitude at 1000 ft. (2) Increase altitude to 1200 ft. (3) Increase altitude to 2000 ft. (4) Decrease altitude to 1200 ft. (5) Decrease altitude to 1000 ft. With each command followed by a silence of 30 s. The specified altitudes were selected to check the effect on operator performance, whether it is easy to hold an altitude if the difference is larger (e.g., between 1200 ft and 2000 ft) or if it is easy if the difference is small (e.g., between 1000 ft and 1200 ft). Such a design of the altitude variation task allows for the analysis of different phases of flight against various time-related criteria. We were also interested in seeing the effect of increasing and decreasing altitudes on undershoot and overshoot.
Moreover, in order to evaluate the effect of haptics on altitude hold subjectively, all the participants were also asked to fill out a questionnaire after performing the experiment, which gave us a quick insight into the individual’s perceived performance. Figure 7 shows the experimental setup, consisting of a high resolution graphic display (altimeter on right and attitude meter on left), earphones, and a Touch 3D Stylus haptic device with maximum force of 3.4 N, which is sufficient for this experiment.

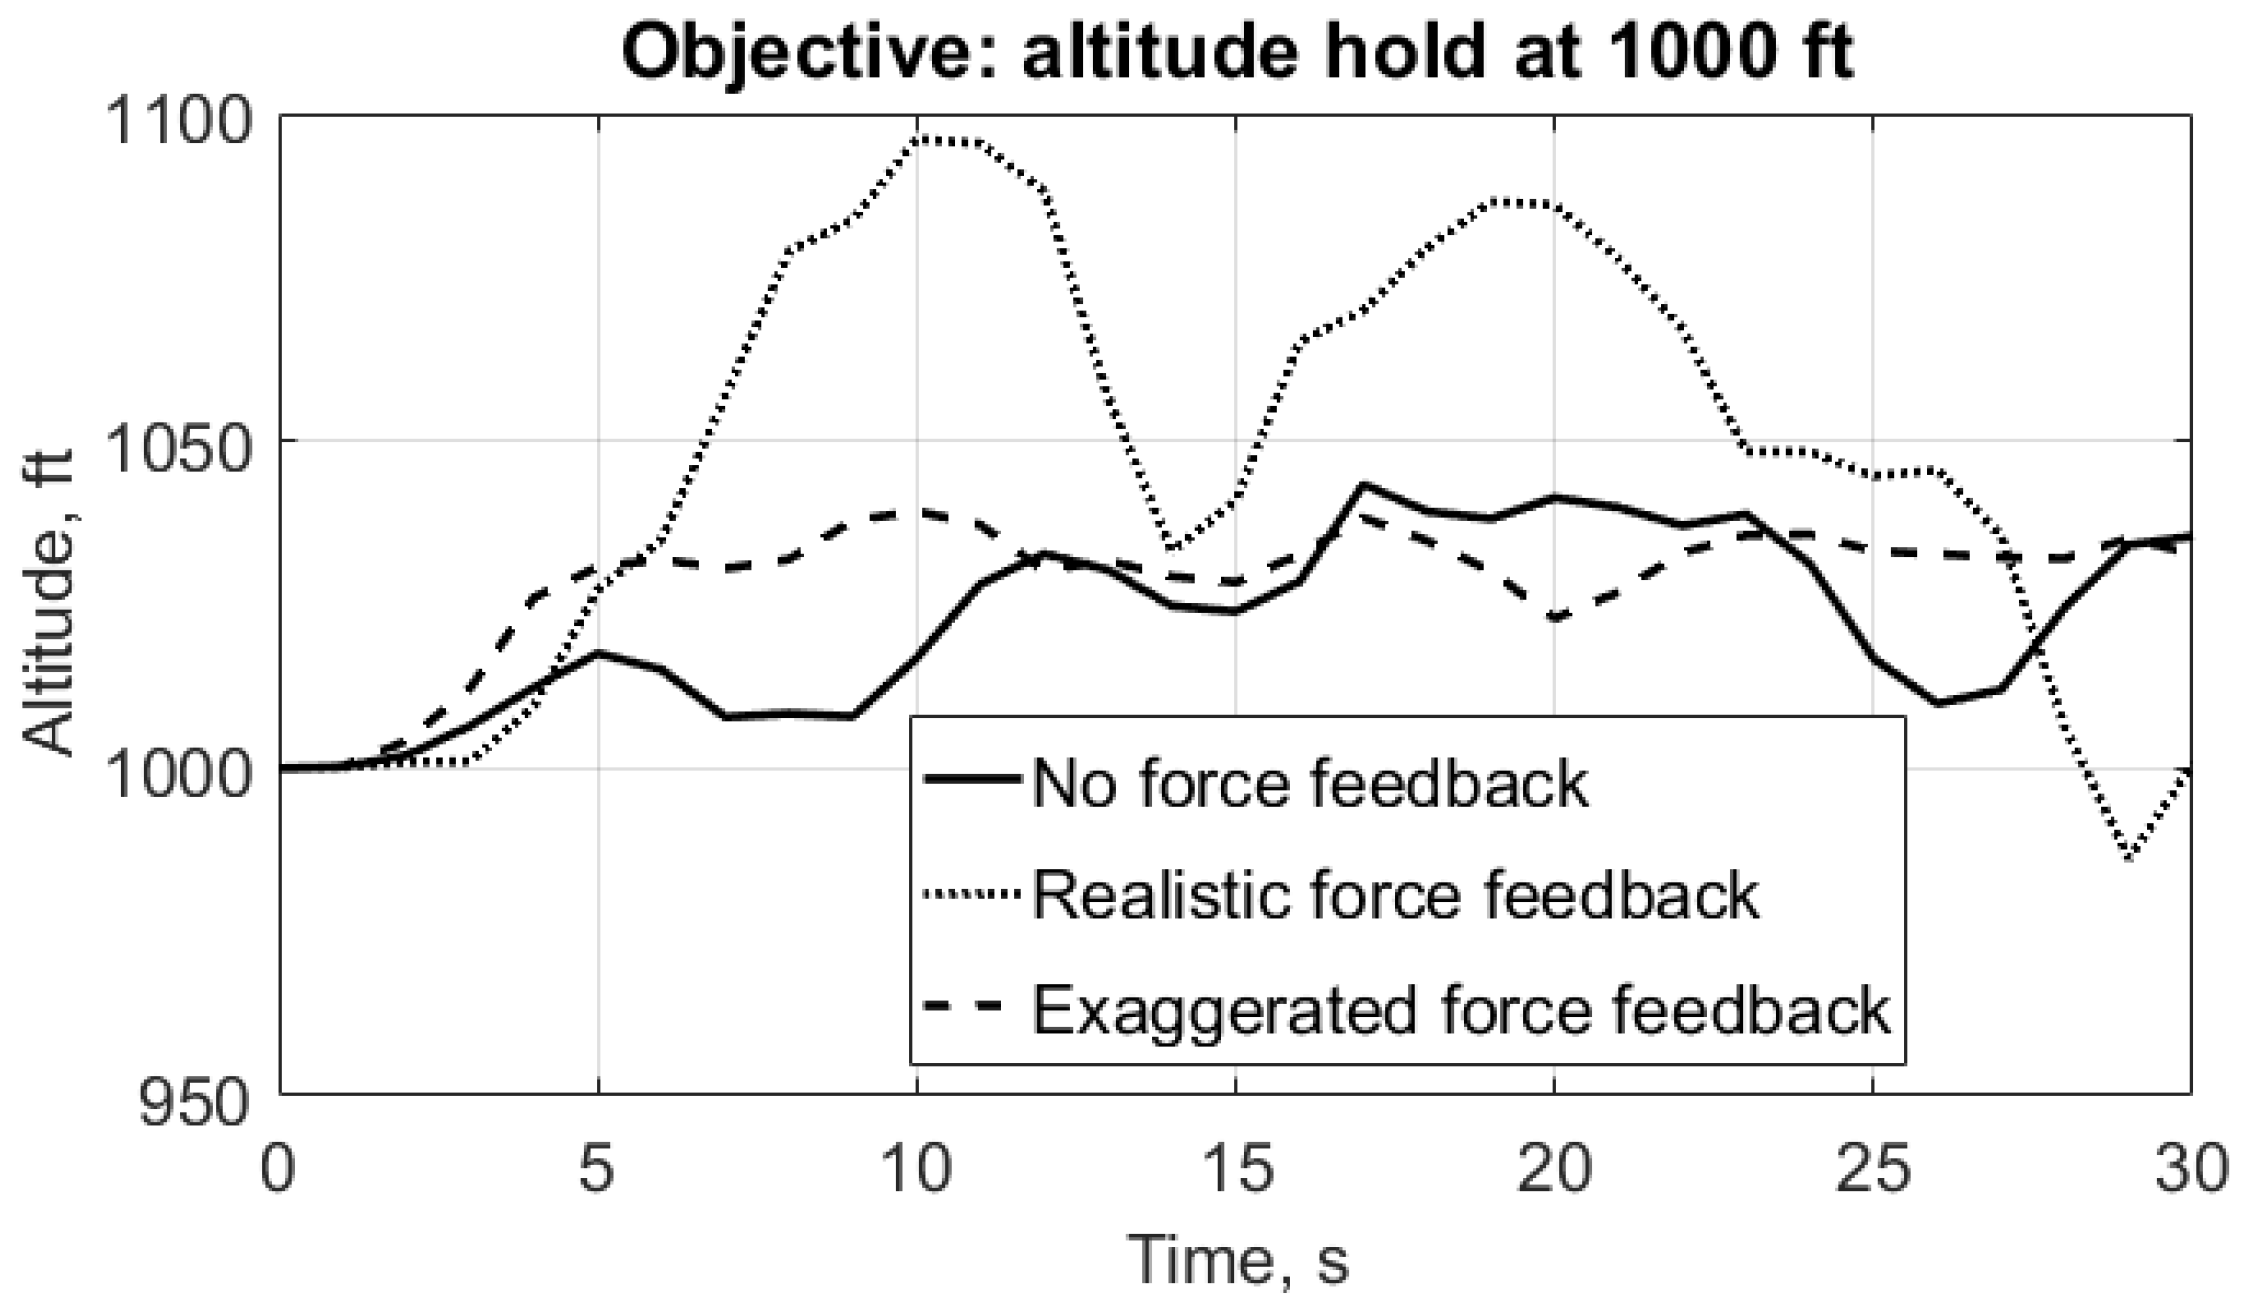
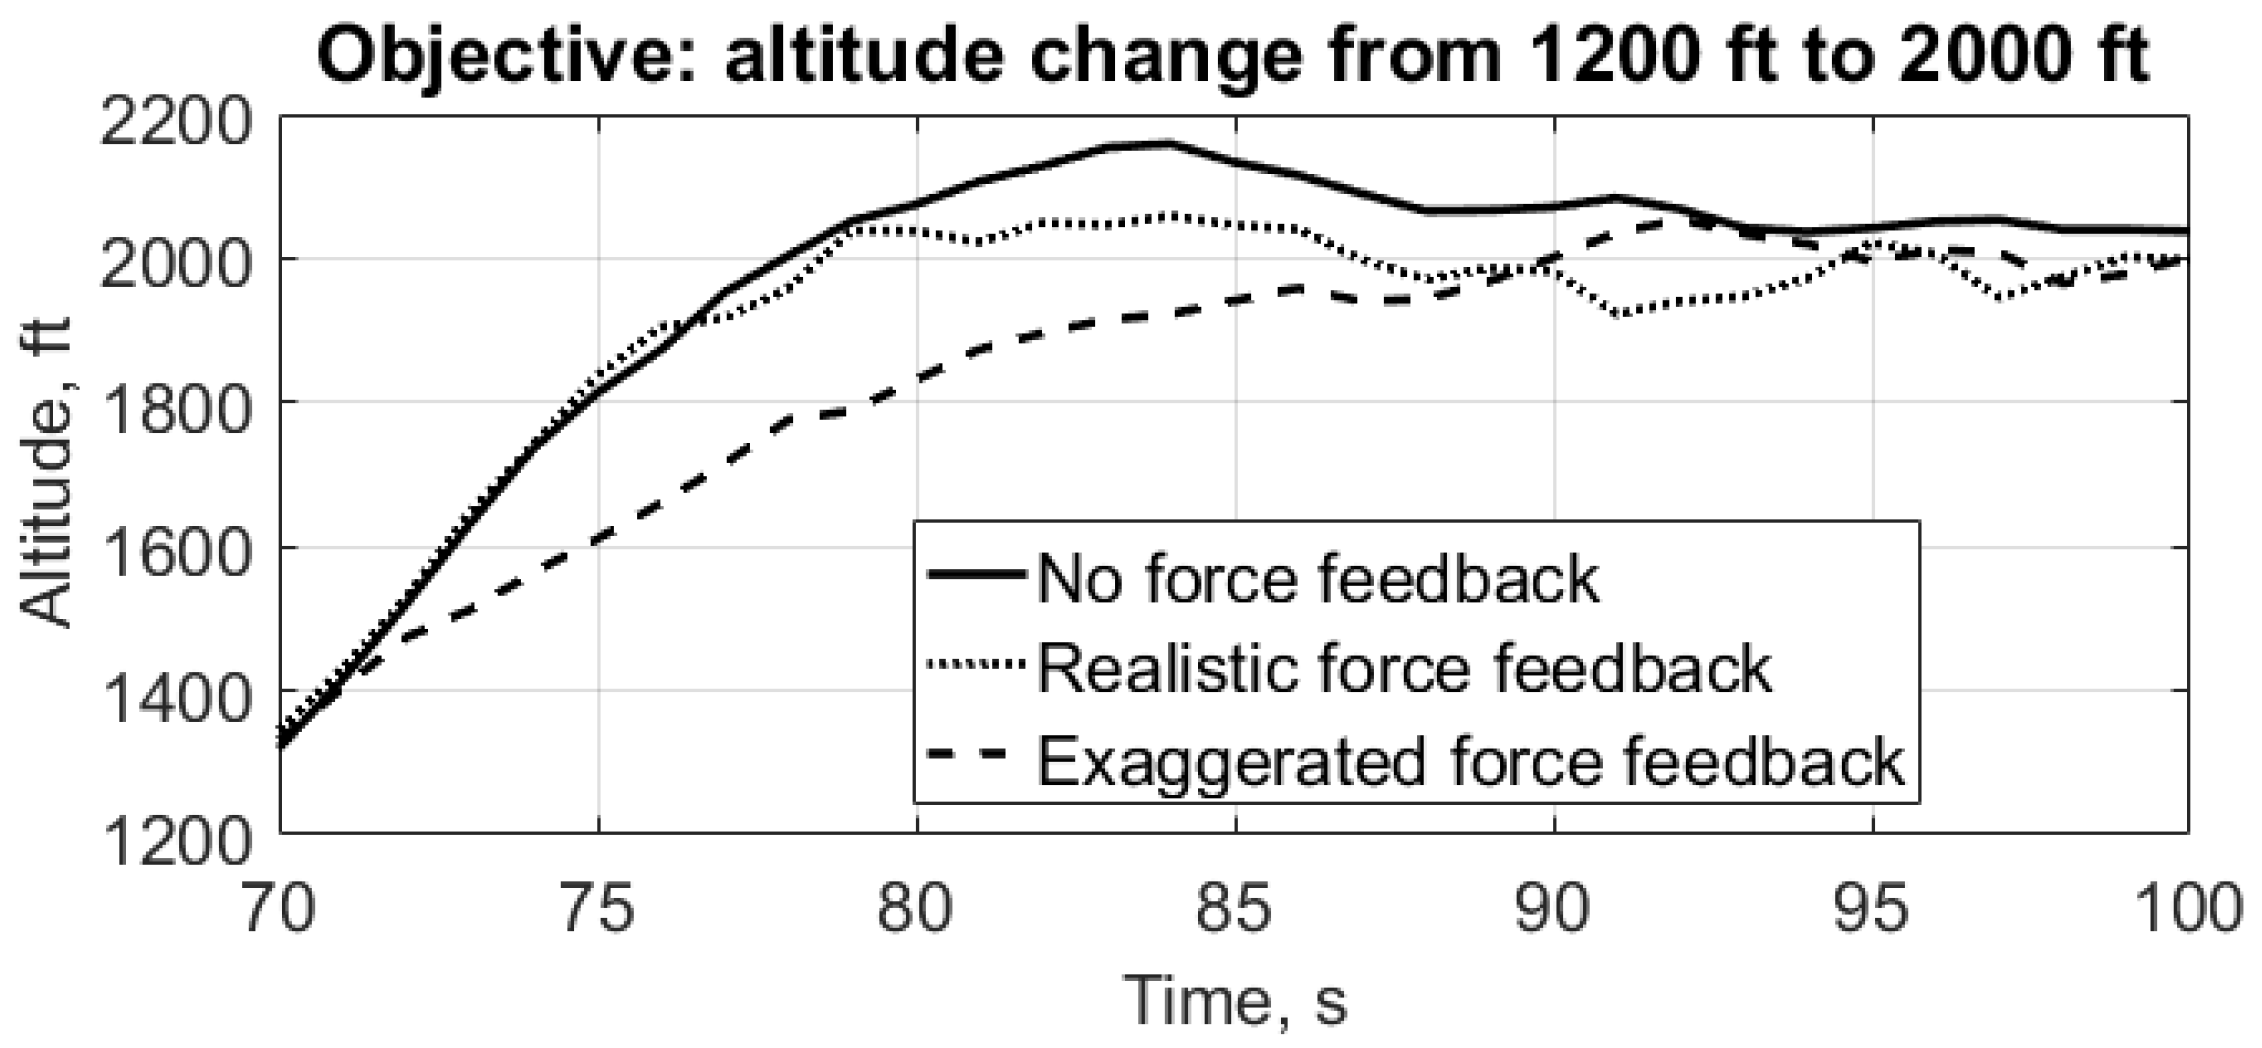
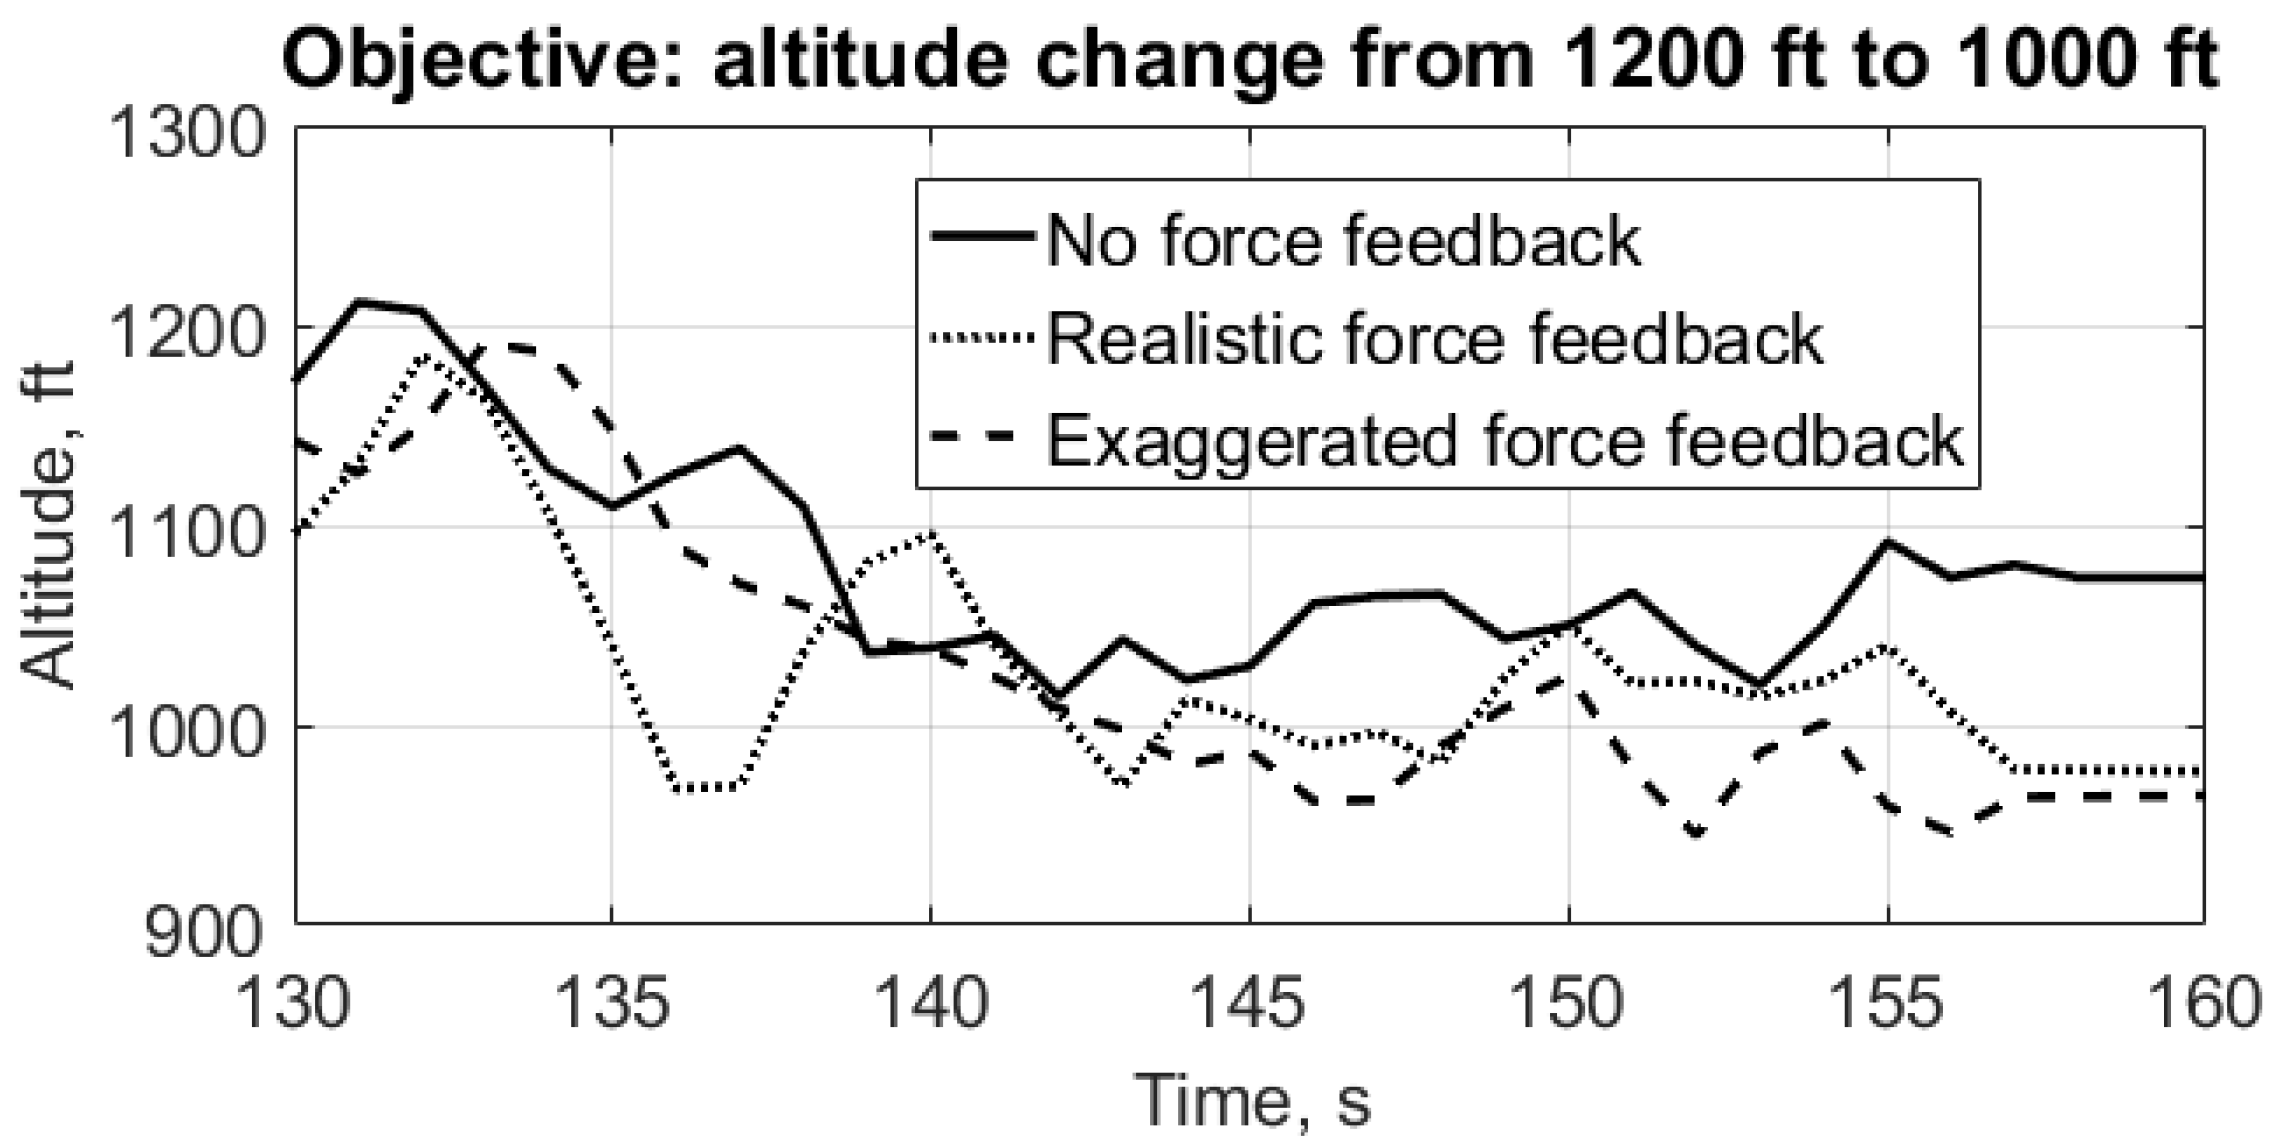
4. Results and Discussion

In order to check the effect of the three conditions (no force feedback, realistic force feedback, and exaggerated force feedback), we performed a one-way Analysis of Variance (ANOVA) on the average of 15 users. The analysis revealed a significant effect in three conditions with [ F ( 2 , 15 ) = 39.9 , p < 0.01 ]. The p-value corresponding to the F-statistic of the one-way ANOVA is lower than 0.01, which strongly suggests that one or more pairs of treatments are significantly different. Therefore, we can conclude from the ANOVA results that haptic feedback have an effect on operators’ performance in terms of handling qualities. ANOVAs do not tell us where the significant difference lies, so we have treatments, for which we shall apply Tukey’s HSD (Honest Significant Difference) test to each of the three pairs to pinpoint which of them exhibits a statistically significant difference. Table 2 shows the results of the one-way ANOVA.
We first found the critical value of the Tukey HSD Q statistic based on k = 3 treatments with v = 28 , 602 degrees of freedom for error with α = 0.01 and α = 0.05 in the studentized range distribution [28]. The critical values obtained for Q for α = 0.01 and α = 0.05 are: Q c r i t i c a l α = 0.01 , k = 3 , v = 28062 = 4.1208 , and Q c r i t i c a l α = 0.05 , k = 3 , v = 28062 = 3.3147 . We will check Q s t a t i s t i c > Q c r i t i c a l . The highlighted results (boldface means significant effect) from Tukey HSD are represented in Table 3. On the basis of Tukey’s HSD results, we can emphasize that the maximum operator’s performance difference is between the scenarios of a no force feedback and exaggerated force feedback.
The results of the ANOVA and Tukey’s HSD suggest that the operator’s performance in the altitude hold task varied for different testing scenarios with a maximum difference between the no force feedback and exaggerated force feedback conditions, as presented in Table 3. We analyzed the mission data of all the operators, as shown in Figure 8, for three force conditions, i.e., no force feedback (force vector (0, 0, 0)), realistic force feedback (force vector (0, y, 0)), and exaggerated force feedback (force vector (0, 2y, 0)). We divided the graph on the basis of time intervals and altitude values, as discussed in Section 3 to analyze the operator’s performance with respect to rise time, peak time, settling time, overshoot, and time elapsed in the tolerance band, which gave us an insight into our system’s stability and performance.

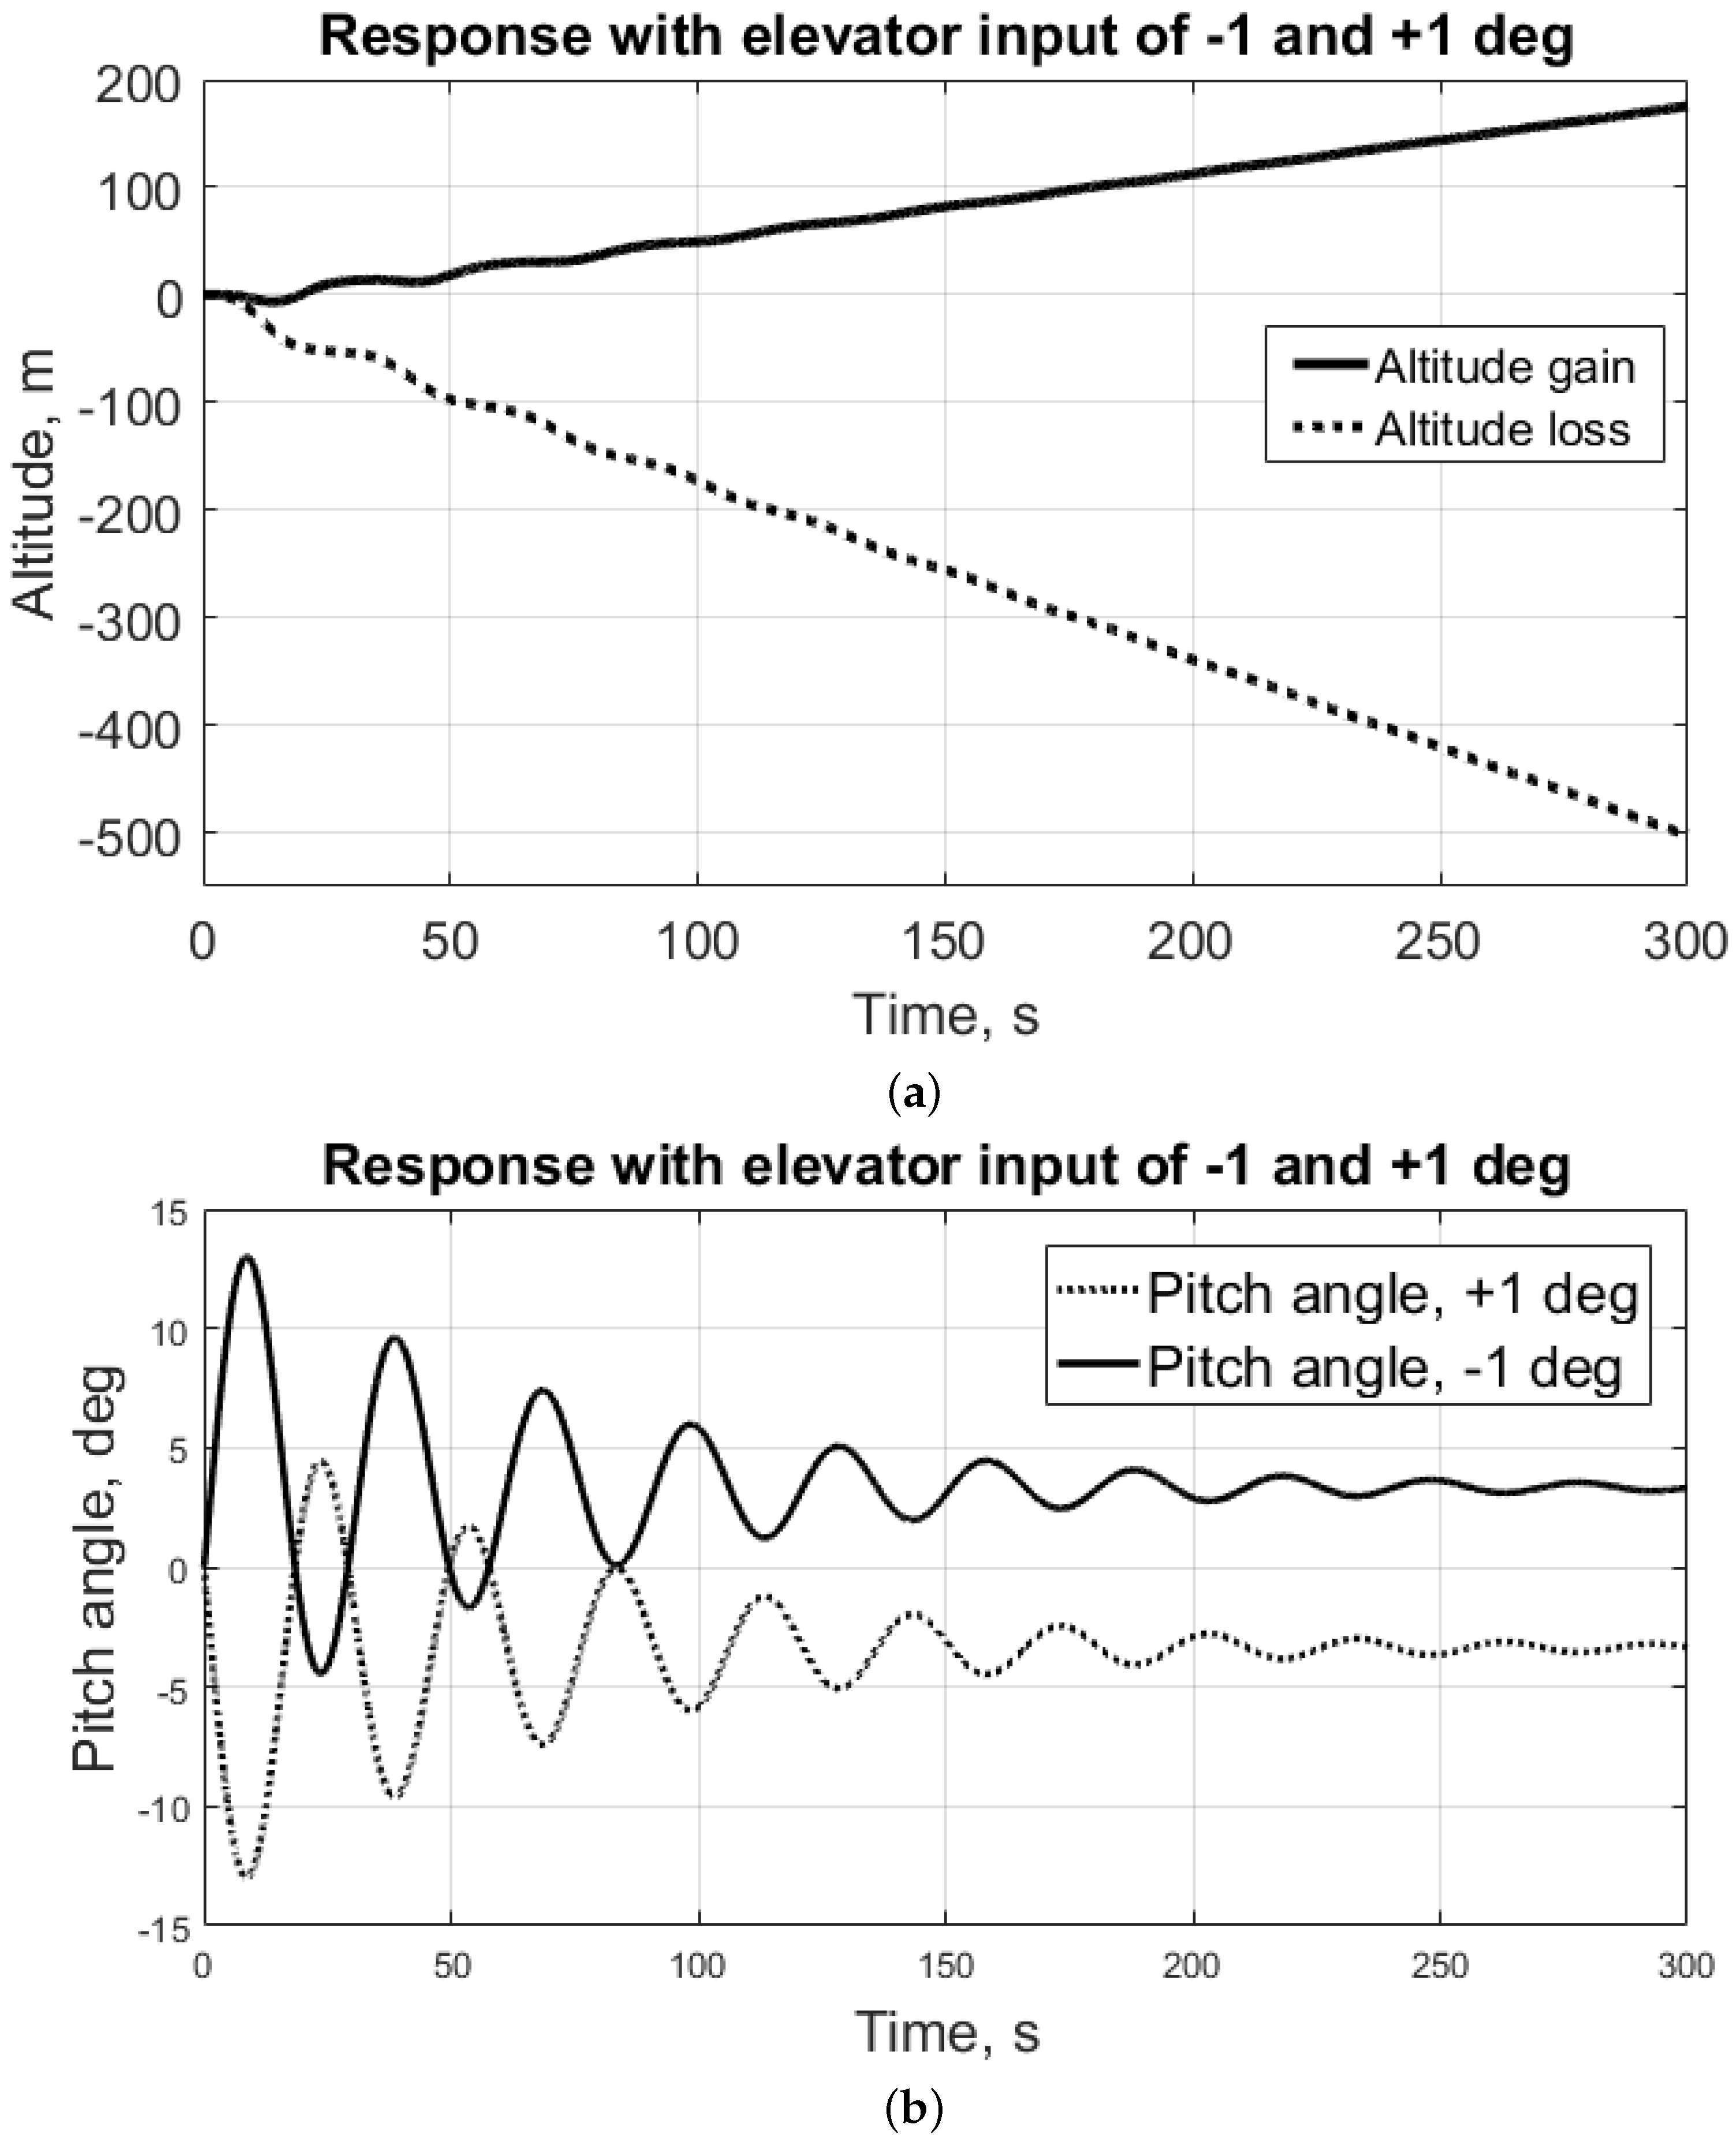
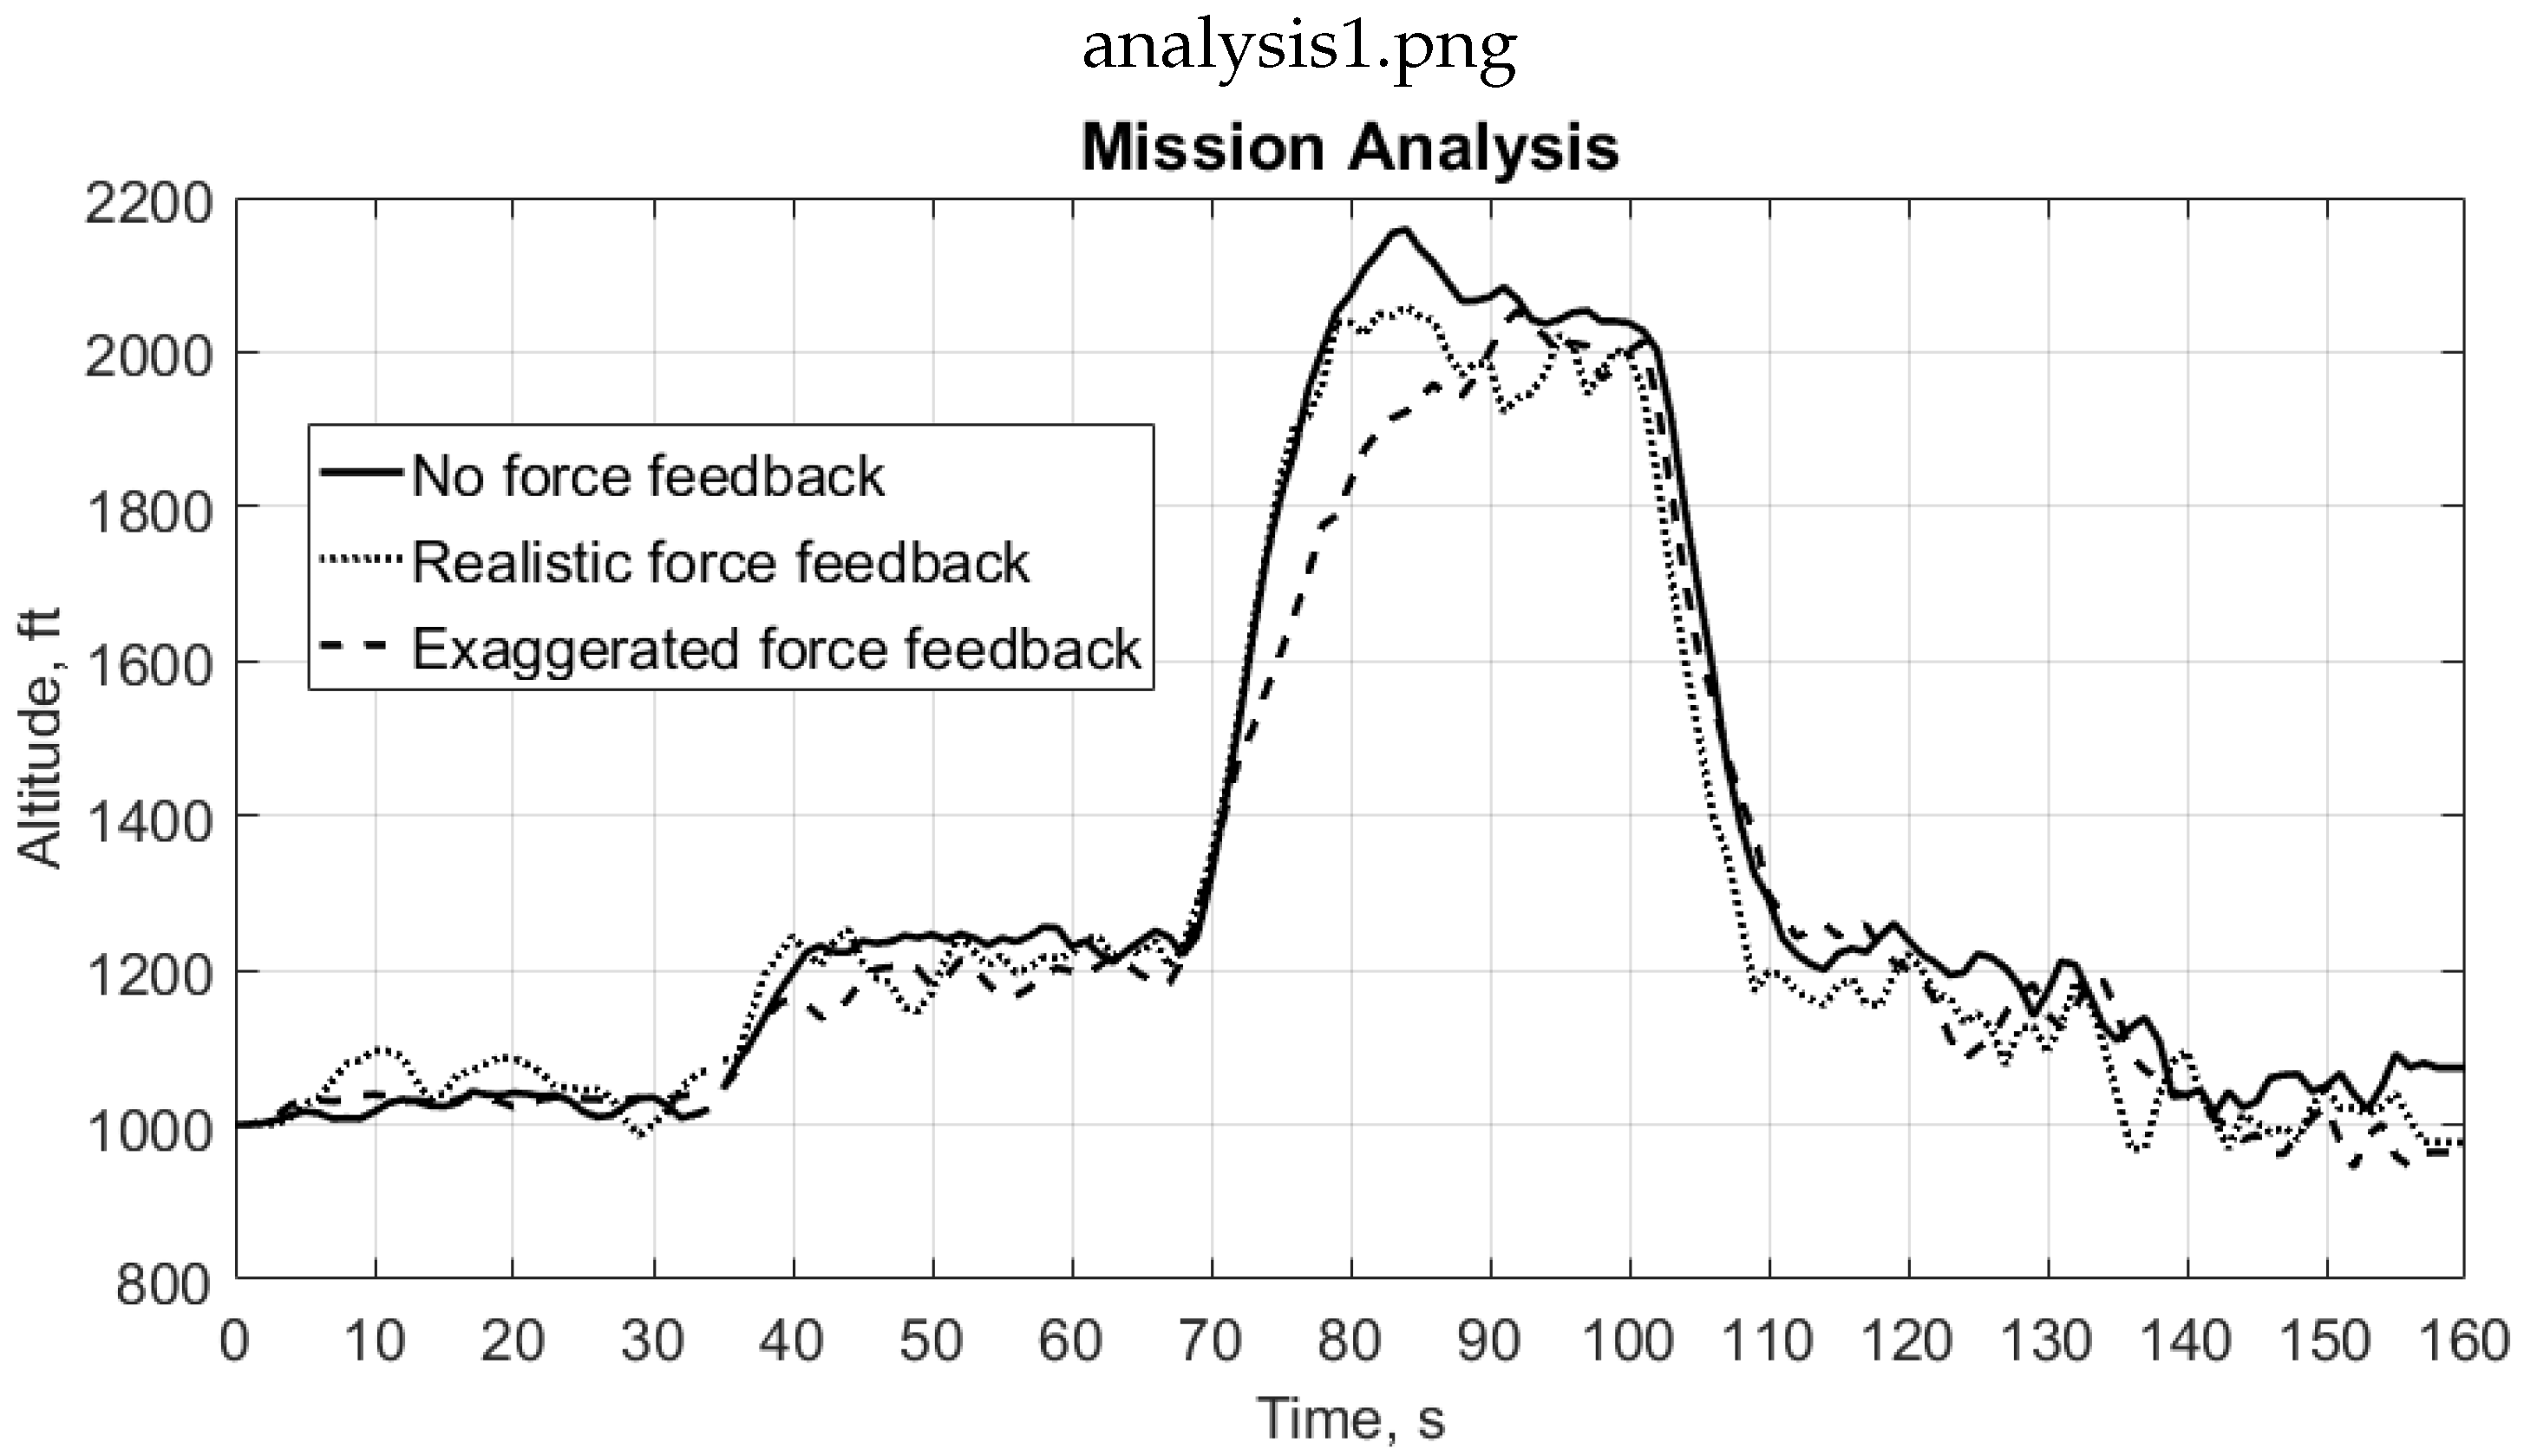
4.1. Rise Time and Overshoot Analysis

Figure 9, Figure 10 and Figure 11 illustrate the performance analysis for three conditions on the basis of rise time and overshoot. It depicts the average altitude holding capability of pilots at different altitude instances. To determine the effect of force feedback on operator’s performance in terms of achieving the set point (i.e., altitude) we calculated rise time for increasing altitudes from time intervals 35 to 70 s and 70 to 100 s, respectively, as presented in Table 4. We can not use the rise time as a performance parameter from 0 to 30 s because the simulation starts at 1000 ft, and the operator only has to hold that altitude for 30 s.
Analyzing the rise time from 35 to 70 s and 70 to 100 s intervals, as shown in Figure 10 and Figure 11 and Table 4, we see that the rise time increases as the force getS stronger, this is because an operator has to put in more effort to counter the forces acting on the control surfaces of the UAV by pulling the control stick (having control surface forces), which significantly increased ‘ t r ’. It is actually a good performance sign OF our application because by increasing the rise time we are controlling our system’s overshoot.
If we look at the average of first 30 s time of all the 15 users, it can be seen that users experiencing exaggerated force feedback have a better performance in terms of achieving a close to steady state condition and with the smaller % overshoot, as presented in Table 5. Similarly, from time intervals 35 to 70 s and 70 to 100 s in Figure 10 and Figure 11, we can see that the overshoot is controlled using force feedback conditions. The numerical values presented in Table 5 support this analysis. Hence, we concluded that in the altitude hold task, where users have to increase the altitude and hold it to the specified value (i.e., 1000 ft, 1200 ft and 2000 ft) for 30 s, force feedback conditions help in controlling the overshoot, whether the altitude difference is small or large.

4.2. Fall Time and Undershoot Analysis

For the decreasing altitudes we calculated fall time ( t f ) and % maximum undershoot to analyze our results. From the fall time, we studied the time required by operators to decrease the UAVs’ altitude to the specified set point. The effect of the haptic feedback on the fall time and undershoot is shown in Figure 12 and Figure 13.
In experiments, when users were asked to decrease the altitude from time interval 100 to 130 s and 130 to 160 s to 1200 ft and 1000 ft, the ‘ t f ’ is reduced for the realistic and exaggerated force feedback condition, as shown in Table 6. This was due to the fact that decreasing the altitude caused the nose of the UAV to rotate downward causing the increased speed as explained previously through Figure 3. As a result, users experienced an additional increased force feedback which pushed the control stick away from an operator, hence reaching the set point in less time. This also affected operators’ performance in the altitude holding task because the force calculation (i.e., Equation (6)) depends on the square of the UAV speed.
Just as the increase in ‘ t r ’ can be used to control overshoot. Similarly, reduced ‘ t f ’, excessive pushing force on control stick and increased values of undershoot as shown in Table 7 can be used to increase situational awareness and immersion in a simulation environment by giving an indication to an operator about sudden altitude loss.

4.3. Settling Time Analysis
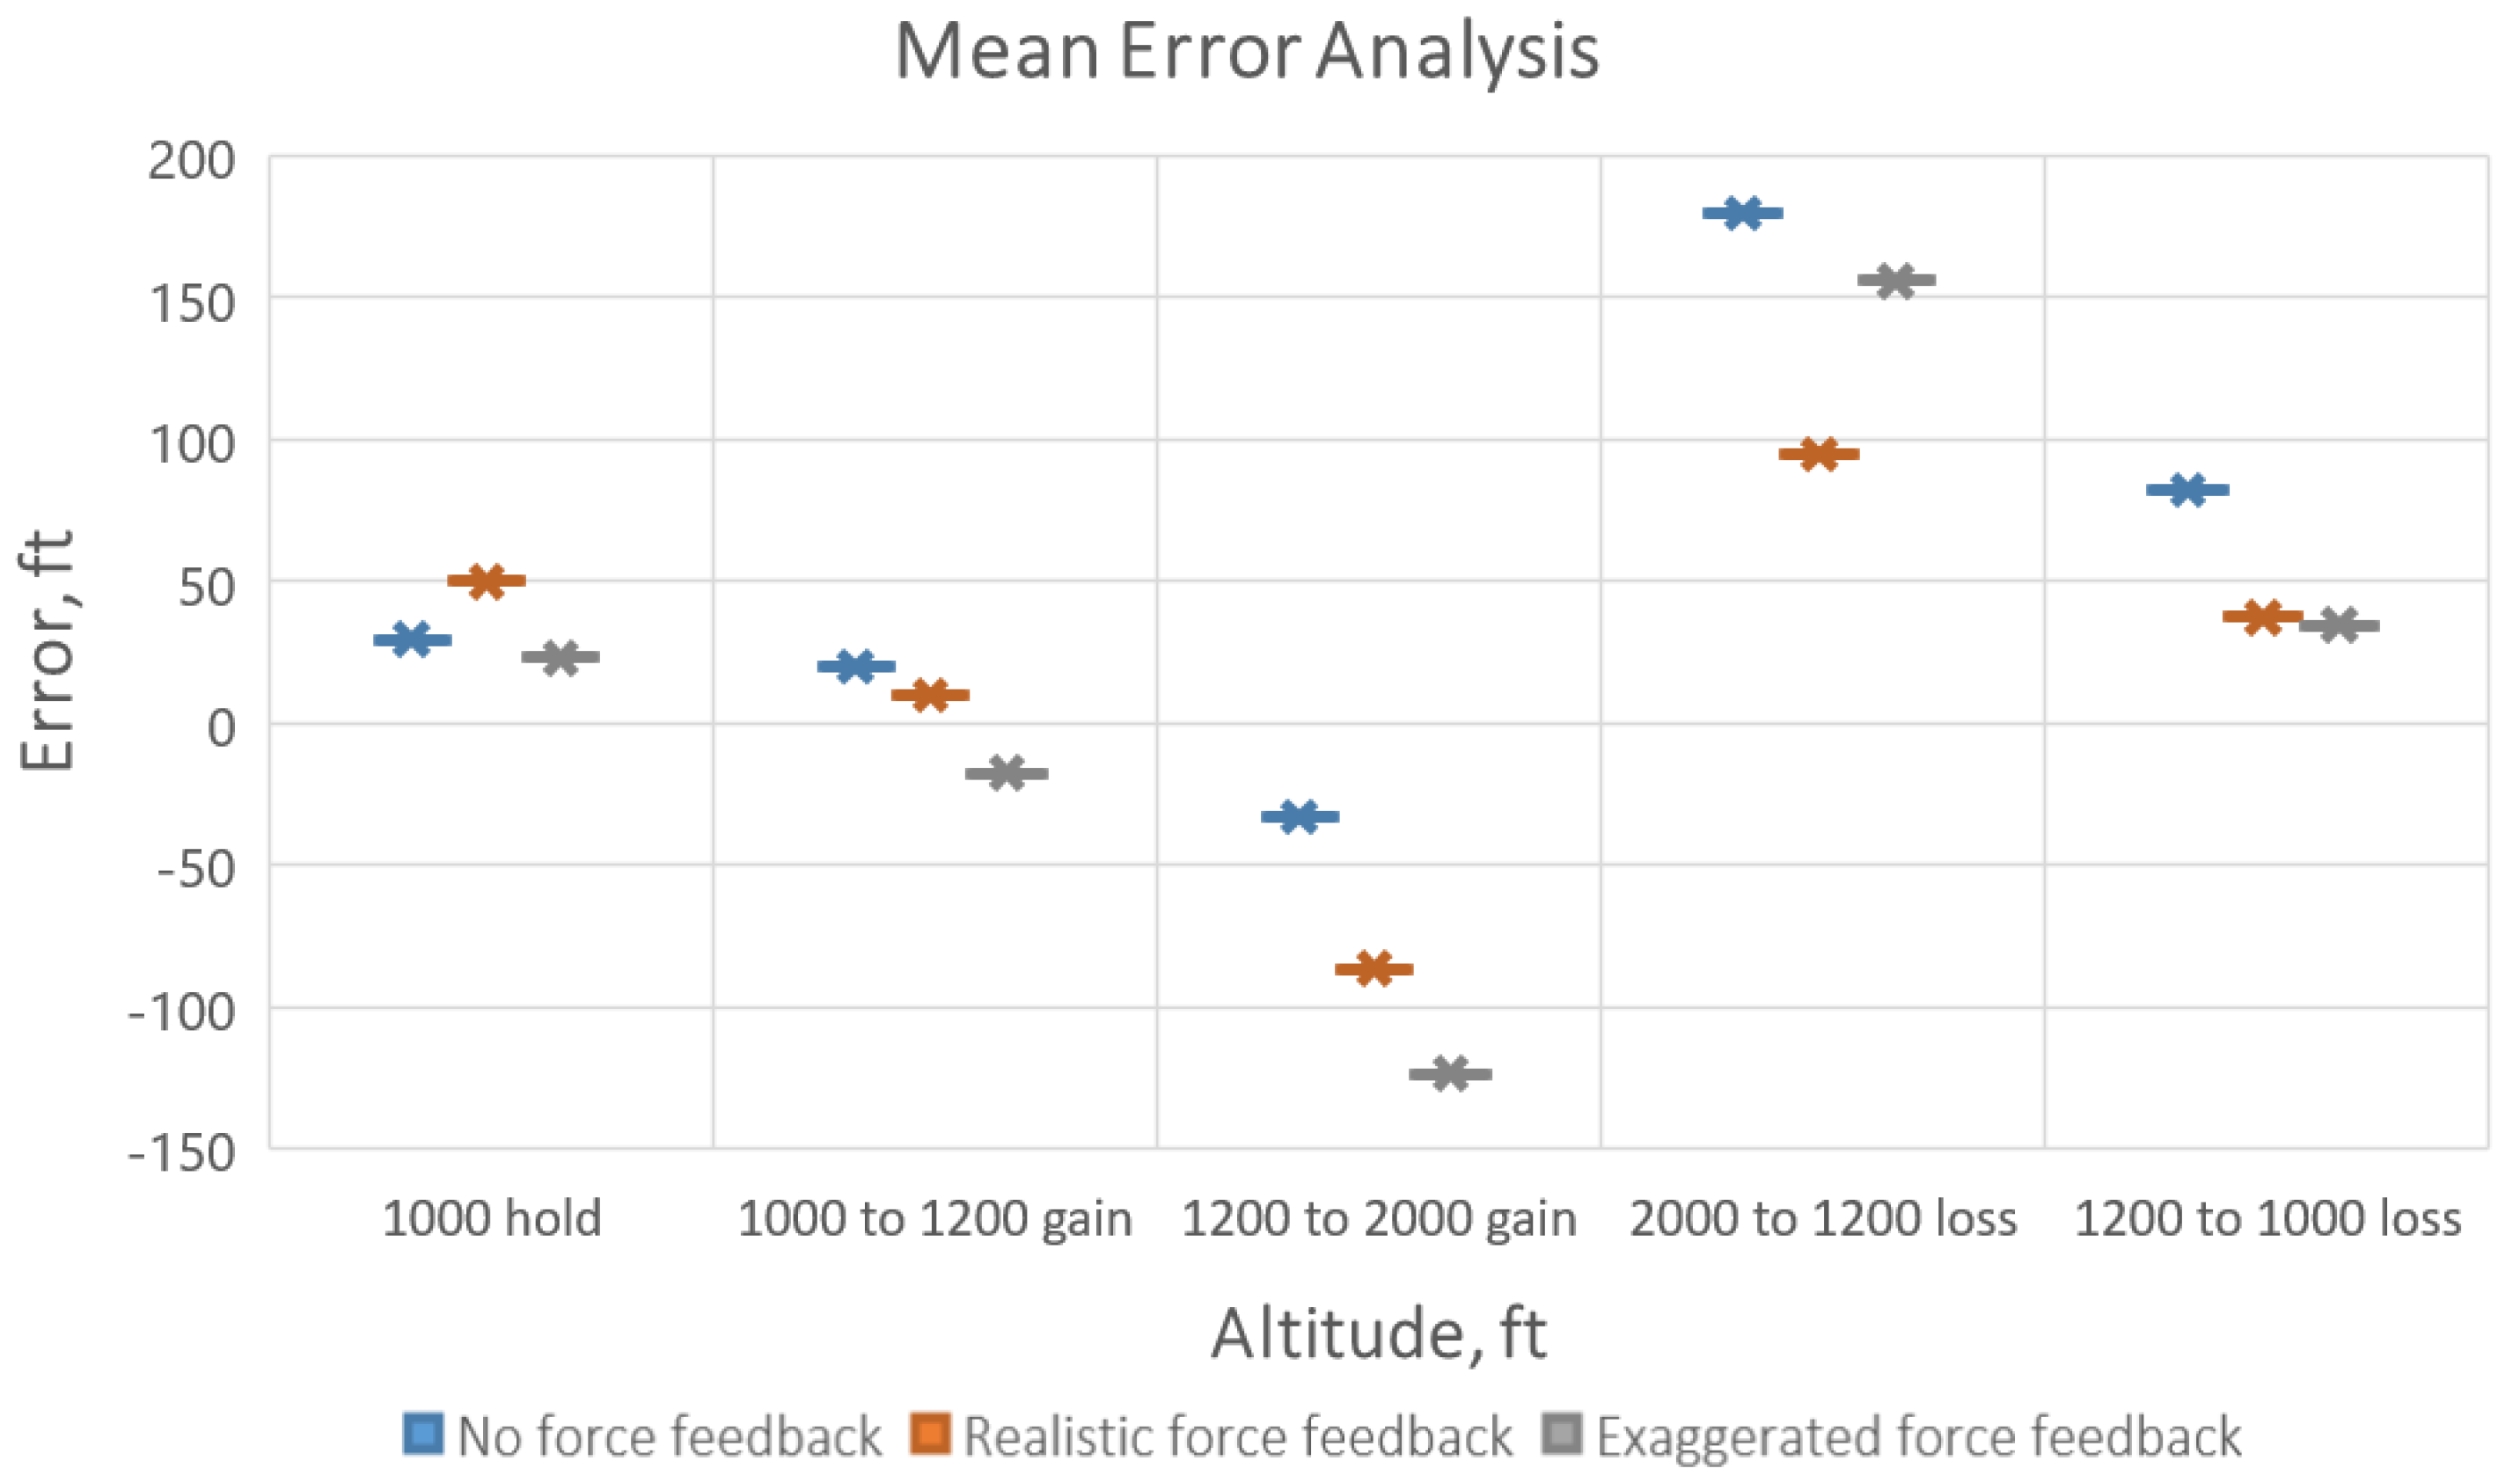
Settling time ( t s ) and time elapsed in the tolerance band can be used to make useful conclusions about systems performance and stability. Less values of ‘ t s ’ imply that the system took less time to achieve a close to steady state condition. Here, the width of tolerance band is calculated as a percentage of the total change in altitude at specific time intervals. We took the band width of 20% and 5% of Δ altitude for the change of 200 ft and 800 ft respectively.
At the time interval from 0 to 30 s, the settling time can not be used as a performance parameter because there is no change in the altitude and the operator has to hold an existing altitude for 30 s. In time intervals between 35 to 100 s, we can see that with the realistic and exaggerated force feedback conditions, ‘ t s ’ is significantly reduced in each interval which proves that in the altitude hold task, we can enter a steady state condition in less time when compared with no the force feedback condition. The settling times for different time intervals are presented in Table 8.
As we can see in Table 8 and Table 9, we do not have a settling time and time elapsed in the tolerance band for realistic and exaggerated force feedback conditions from 100 to 130 s, this is due to the fact that when operators were asked to drop the altitude to 1200 ft from 2000 ft (i.e., significant altitude difference) they were not able to control the UAV to keep it in the steady state region.
To support our conclusion, we also calculated the time elapsed in the tolerance band, which illustrates the total time period an operator spent in the close to steady state. The numerical values of the time elapsed in the tolerance band are presented in Table 9. We can see from Figure 13 that from 130 to 160 s of time, the response is not in the tolerance band, so we increased the width of the tolerance band to 50% Δ altitude. Then, the time elapsed in the band was calculated for realistic and exaggerated force feedback conditions, which are significantly higher, as seen in Table 9. Accuracy is compromised by increasing the width of the tolerance band. The numerical values prove that with realistic and exaggerated force feedback conditions, the time elapsed in the tolerance band is significantly increased, thus, the operators spent more time in the steady state condition, which is good performance sign.

4.4. Error Analysis

We calculated error at different altitude instances to further evaluate our results and it supports the above analysis that with force conditions, the operator performance for the altitude hold task was better, i.e., resulted in low error values. The mean values of errors are shown in Figure 14.
At the start of an experiment, when operators were asked to only hold an altitude at 1000 ft, the exaggerated force feedback condition gave optimum results with less error values, as in Figure 14 and less % overshoot, Table 5, which is a good performance sign. Similarly, for increasing and decreasing altitudes at 1000 ft and 2000 ft, realistic and exaggerated force feedback conditions yielded better performance by improved handling qualities. The mean error values presented in Figure 14 validate our analysis.

4.5. Comparative Summary

The best condition (no force, realistic force, or exaggerated force) is selected on the basis of the comparison of six performance parameters for altitude hold, gain, and descent phase (Table 10). The performance parameters include rise time, overshoot control, fall time, undershoot control, settling time, and mean error. We can see that no force condition yields better results only when operators execute the altitude hold command. Exaggerated force turns out to be the best performer for altitude gain/climb phase. Similarly, the altitude descent task is performed better with a realistic force feedback.

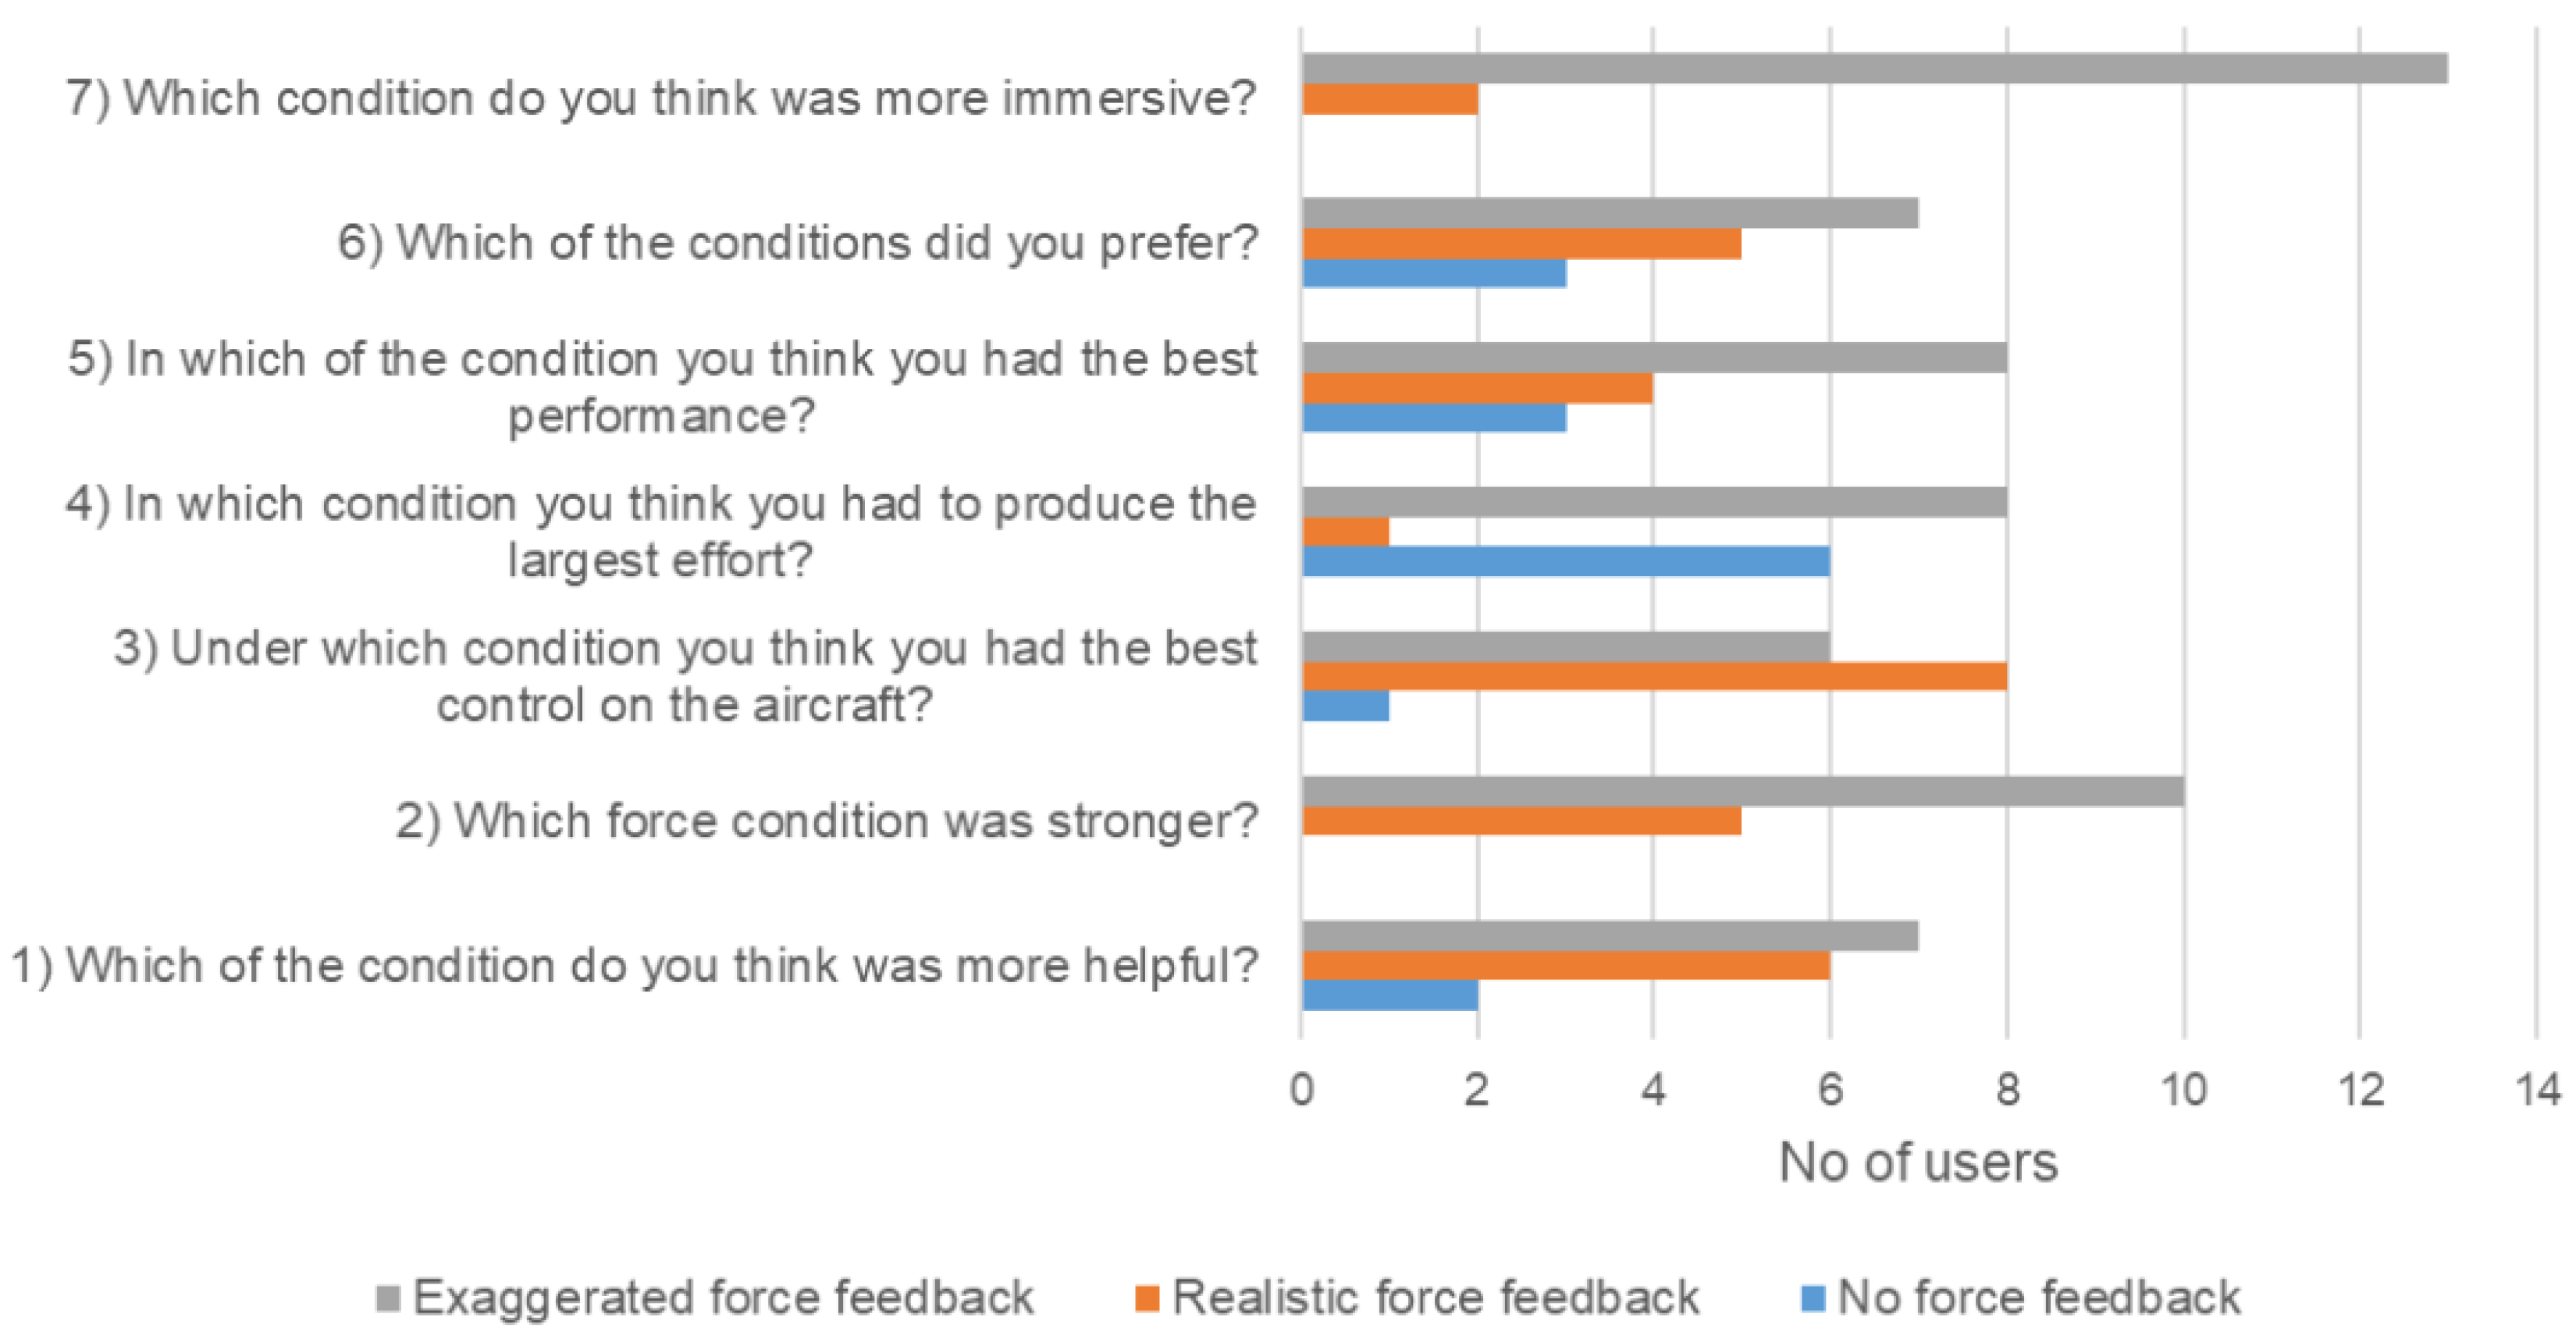
4.6. Subjective Evaluation

After the experiments, operators were interviewed individually to describe their experience about different force conditions and their perceived performance. In order to compare our results, operators were asked to fill out a questionnaire consisting of seven questions. In every question, they had to choose between the three conditions: no force feedback, realistic force feedback, and exaggerated force feedback.
Figure 15 shows the questions with the corresponding responses of the operators. Most of the operators agreed that by incorporating haptic feedback in the UAV controls, the mission objectives can be achieved effectively. However, the answer to question 4 shows a controversial situation in which 8 out of 15 operators thought that haptic feedback demanded more effort. When asked about this in the follow-up interview, most of the operators clarified that when they experienced force intermittently, they pushed the control stick away from them, which compromised their performance and required more physical effort to maintain the desired altitude.

5. Conclusions

A simulated haptic-aided flight control system of a UAV is developed that uses an aerodynamic model of the UAV to obtain forces acting on the control stick. The developed system is used to study the effects of haptic feedback on longitudinal flight control. Our analysis shows that the proposed haptic aiding system has a significant effect on operator performance and situational awareness. On the basis of six different performance parameters, it is concluded that no force feedback is acceptable for altitude hold tasks, exaggerated force feedback works better for altitude gain, and realistic force feedback is adequate for altitude descent. The findings suggest that it can be used in flight simulators for effective operator training and to increase immersion, which is an important aspect for making a smooth transition from simulator to real flight. The subjective assessment reported by the participants also suggested an increased confidence with haptic feedback. In future, challenges of real-time implementation will be addressed that include the effects of communication time delays, limited control inputs, and designing barrier functions from on-board sensors data.

Author Contributions

Conceptualization, S.R. and A.M.; H.A.M. and S.R. performed the investigation and experiments; H.A.M., S.R., and A.M. analyzed the data; supervision, S.R., A.M. and R.R.; writing—original draft, H.A.M., S.R.; writing—review and editing, S.R., A.M., and R.R. All authors have read and agreed to the published version of the manuscript.

Funding

This research received no external funding.

Acknowledgments

We acknowledge Rizwan Riaz for providing us with the facilities to conduct this study.

Conflicts of Interest

The authors declare no conflict of interest.

Abbreviations

The following abbreviations are used in this manuscript:
UAVUnmanned Aerial Vehicle
DOFDegree(s) of Freedom
GCSGround Control Station
FODEFirst order differential equation(s)
SDKSoftware Development Kit
ANOVAAnalysis of Varaince
HSDHonest Significant Difference

References

  1. Elhajj, I.; Xi, N.; Fung, W.K.; Liu, Y.H.; Li, W.J.; Kaga, T.; Fukuda, T. Haptic information in Internet-based teleoperation. IEEE/ASME Trans. Mechatron. 2001, 6, 295–304. [Google Scholar] [CrossRef]
  2. McCarley, J.S.; Wickens, C.D. Human Factors Implications of UAVs in the National Airspace; Technical Report AHFD-05 05/FAA-05-01; Aviation Human Factors Division, Institute of Aviation, University of Illinois at Urbana-Champaign: Champaign, IL, USA, 2005. [Google Scholar]
  3. Alaimo, S.M.C.; Pollini, L.; Bresciani, J.P.; Bülthoff, H.H. A comparison of Direct and Indirect Haptic Aiding for Remotely Piloted Vehicles. In Proceedings of the 19th International Symposium in Robot and Human Interactive Communication, Viareggio, Italy, 13–15 September 2010. [Google Scholar] [CrossRef]
  4. Ju, C.; Park, S.; Park, S.; Son, H.I. A Haptic Teleoperation of Agricultural Multi-UAV. In Proceedings of the IEEE IROS Workshop on Agricultural Robotics: Learning from Industry 4.0 and Moving into the Future, Vancouver, BC, Canada, 28 September 2017. [Google Scholar]
  5. Lam, T.M.; Boschloo, H.W.; Mulder, M.; van Paassen, M.M.; van der Helm, F.C.T. Effect of haptic feedback in a trajectory following task with an unmanned aerial vehicle. In Proceedings of the 2004 IEEE International Conference on Systems, Man and Cybernetics (IEEE Cat. No.04CH37583), Hague, The Netherlands, 10–13 October 2004; Volume 3, pp. 2500–2506. [Google Scholar] [CrossRef]
  6. Lam, T.M.; Delannoy, M.; Mulder, M.; van Paassen, M.M. Effects of Haptic Feedback in the Tele-Operation of an Unmanned Aerial Vehicle. In Proceedings of International Symposium on Aviation Psychology; Wright State University: Dayton, OH, USA, 2005. [Google Scholar]
  7. Lee, S.; Sukhatme, G.S.; Kim, G.J.; Park, C.M. Haptic Teleoperation of a Mobile Robot: A User Study. Presence Teleoperators Virtual Environ. 2005, 14, 345–365. [Google Scholar] [CrossRef] [Green Version]
  8. Lam, T.M.; Boschloo, H.W.; Mulder, M.; van Paassen, M.M. Artificial Force Field for Haptic Feedback in UAV Teleoperation. IEEE Trans. Syst. Man Cybern. Part A Syst. Hum. 2009, 39, 1316–1330. [Google Scholar] [CrossRef]
  9. Razzanelli, M.; Aringhieri, S.; Franzini, G.; Avanzini, G.; Giulietti, F.; Innocenti, M.; Pollini, L. A Visual-Haptic Display for Human and Autonomous Systems Integration. In Modelling and Simulation for Autonomous Systems; Hodicky, J., Ed.; Springer: Cham, Switzerland, 2016; pp. 64–80. [Google Scholar]
  10. Zhang, D.; Yang, G.; Khurshid, R.P. Haptic Teleoperation of UAVs Through Control Barrier Functions. IEEE Trans. Haptics 2020, 13, 109–115. [Google Scholar] [CrossRef] [PubMed] [Green Version]
  11. Olivari, M.; Nieuwenhuizen, F.M.; Bülthoff, H.H.; Pollini, L. Pilot Adaptation to Different Classes of Haptic Aids in Tracking Tasks. J. Guid. Control Dyn. 2014, 37, 1741–1753. [Google Scholar] [CrossRef]
  12. D’Intino, G.; Olivari, M.; Geluardi, S.; Venrooij, J.; Innocenti, M.; Bülthoff, H.H.; Pollini, L. Evaluation of haptic support system for training purposes in a tracking task. In Proceedings of the 2016 IEEE International Conference on Systems, Man, and Cybernetics (SMC), Budapest, Hungary, 9–12 October 2016; pp. 002169–002174. [Google Scholar]
  13. D’Intino, G.; Olivari, M.; Bülthoff, H.H.; Pollini, L. Haptic Assistance for Helicopter Control Based on Pilot Intent Estimation. J. Aerosp. Inf. Syst. 2020, 17, 193–203. [Google Scholar] [CrossRef]
  14. Okamura, A.M.; Verner, L.N.; Reiley, C.E.; Mahvash, M. Haptics for Robot-Assisted Minimally Invasive Surgery. In Robotics Research; Kaneko, M., Nakamura, Y., Eds.; Springer: Berlin/Heidelberg, Germany, 2011; pp. 361–372. [Google Scholar]
  15. Abbink, D.A.; Mulder, M.; Boer, E.R. Haptic shared control: Smoothly shifting control authority? Cognit. Technol. Work 2012, 14, 19–28. [Google Scholar] [CrossRef] [Green Version]
  16. Mahony, R.; Schill, F.; Corke, P.; Oh, Y.S. A new framework for force feedback teleoperation of robotic vehicles based on optical flow. In Proceedings of the 2009 IEEE International Conference on Robotics and Automation, Kobe, Japan, 12–17 May 2009; pp. 1079–1085. [Google Scholar] [CrossRef] [Green Version]
  17. Micconi, G.; Aleotti, J.; Caselli, S.; Benassi, G.; Zambelli, N.; Zappettini, A. Haptic guided UAV for detection of radiation sources in outdoor environments. In Proceedings of the 2015 Workshop on Research, Education and Development of Unmanned Aerial Systems (RED-UAS), Cancun, Mexico, 23–25 November 2015; pp. 265–271. [Google Scholar] [CrossRef]
  18. Courtois, H.; Aouf, N. Haptic feedback for obstacle avoidance applied to unmanned aerial vehicles. In Proceedings of the 2017 International Conference on Unmanned Aircraft Systems (ICUAS), Miami, FL, USA, 13–16 June 2017; pp. 417–424. [Google Scholar] [CrossRef]
  19. Ziat, M.; Wagner, S.; Frissen, I. Haptic Feedback to Compensate for the Absence of Horizon Cues During Landing. In Haptics: Perception, Devices, Control, and Applications; Bello, F., Kajimoto, H., Visell, Y., Eds.; Springer: Cham, Switzerland, 2016; pp. 47–54. [Google Scholar]
  20. Saddik, A.E. The Potential of Haptics Technologies. IEEE Instrum. Meas. Mag. 2007, 10, 10–17. [Google Scholar] [CrossRef]
  21. Morris, D.; Tan, H.; Barbagli, F.; Chang, T.; Salisbury, K. Haptic Feedback Enhances Force Skill Learning. In Proceedings of the Second Joint EuroHaptics Conference and Symposium on Haptic Interfaces for Virtual Environment and Teleoperator Systems, Tsukaba, Japan, 22–24 March 2007; pp. 21–26. [Google Scholar] [CrossRef]
  22. Stegagno, P.; Basile, M.; Bülthoff, H.H.; Franchi, A. A semi-autonomous UAV platform for indoor remote operation with visual and haptic feedback. In Proceedings of the 2014 IEEE International Conference on Robotics and Automation (ICRA), Hong Kong, China, 31 May–7 June 2014; pp. 3862–3869. [Google Scholar] [CrossRef] [Green Version]
  23. Schoemann, J.; Hornung, M. Modeling of Hybrid Electric Propulsion Systems for Small Unmanned Aerial Vehicles. In Proceedings of the 12th AIAA Aviation Technology, Integration, and Operations (ATIO) Conference and 14th AIAA/ISSMO Multidisciplinary Analysis and Optimization Conference, Indianapolis, IN, USA, 17–19 September 2012. [Google Scholar] [CrossRef]
  24. Vuruskan, A.; Yuksek, B.; Ozdemir, U.; Yukselen, A.; Inalhan, G. Dynamic modeling of a fixed-wing VTOL UAV. In Proceedings of the 2014 International Conference on Unmanned Aircraft Systems (ICUAS), Orlando, FL, USA, 27–30 May 2014; pp. 483–491. [Google Scholar] [CrossRef]
  25. Maqsood, A.; Go, T.H. Optimization of Hover-to-Cruise Transition Maneuver Using Variable-Incidence Wing. J. Aircr. 2010, 47, 1060–1064. [Google Scholar] [CrossRef]
  26. Stevens, B.; Lewis, F.; Johnson, E. Aircraft Dynamics and Classical Control Design. In Aircraft Control and Simulation: Dynamics, Controls Design, and Autonomous Systems; John Wiley & Sons, Ltd.: New York, NY, USA, 2015; Chapter 4; pp. 250–376. [Google Scholar] [CrossRef]
  27. Prisacariu, V. Analysis of UAVs Flight Characteristics. In Review of the Air Force Academy; Henri Coandă Air Force Academy Publishing House: Braşov, Romania, 2018; pp. 29–36. [Google Scholar] [CrossRef]
  28. Student. Errors of Routine Analysis. Biometrika 1927, 19, 151–164. [Google Scholar] [CrossRef]
Figure 1. System architecture.
Applsci 10 03877 g001
Figure 2. Views of unmanned aerial vehicles (UAV).
Applsci 10 03877 g002
Figure 3. Response of the aerodynamic model of A UAV with negative and positive elevator inputs. (a) Effect on altitude. (b) Effect on pitch angle.
Applsci 10 03877 g003
Figure 4. Graphical user interface of the proposed simulation system.
Applsci 10 03877 g004
Figure 5. System workflow.
Applsci 10 03877 g005
Figure 6. (a) Control stick acceptable range, (b) restriction mechanism for limiting haptic device to 1 DOF.
Applsci 10 03877 g006
Figure 7. Experimental setup.
Applsci 10 03877 g007
Figure 8. Mission analysis.
Applsci 10 03877 g008
Figure 9. Altitude analysis at 1000 ft.
Applsci 10 03877 g009
Figure 10. Altitude analysis at 1200 ft.
Applsci 10 03877 g010
Figure 11. Altitude analysis from 1200 to 2000 ft.
Applsci 10 03877 g011
Figure 12. Altitude analysis at 1200 ft.
Applsci 10 03877 g012
Figure 13. Altitude analysis at 1000 ft.
Applsci 10 03877 g013
Figure 14. Mean error analysis at increasing and decreasing altitudes.
Applsci 10 03877 g014
Figure 15. Operator response to subjective questionnaire.
Applsci 10 03877 g015
Table 1. Unmanned aerial vehicles (UAV) parameters.
ParameterValueNotation
Wing span
Area
Weight
Air density
Rolling moment of inertia
Pitching moment of inertia
Yawing moment of inertia
1.0 m
0.24 m 2
0.492 kg
1.225 kg/m 3
0.01076 kg·m 2
0.02514 kg·m 2
0.03561 kg·m 2
b
s
m
ρ
I x x
I y y
I z z
Table 2. ANOVA results.
SourceDegrees of Freedom vF Statisticp-Value
Conditions
Error
2
228,062
39.9186 1.1102 × 10 16
Table 3. Tukey’s HSD results.
ConditionTukey HSD Q StatTukey HSD p-ValueTukey HSD Inference
None vs. Realistic force feedback
None vs. Exaggerated force feedback
Realistic vs. Exaggerated force feedback
8.73
12.2736
3.5340
0.0010053
0.0010053
0.333626
p < 0.01
p < 0.01
p < 0.05
Table 4. Rise time, s ( t r ) at different time intervals.
Time (s)No Force FeedbackRealistic Force FeedbackExaggerated Force Feedback
35 to 70 s
70 to 100
5
8
3
10
6
20
Table 5. % maximum overshoot at different time intervals.
Time (s)No Force FeedbackRealistic Force FeedbackExaggerated Force Feedback
0 to 30
35 to 70
70 to 100
4.36
12.0
7.9
9.6
9.9
2.9
3.9
7.8
2.6
Table 6. Fall time, s ( t f ) at different time intervals.
Time (s)No Force FeedbackRealistic Force FeedbackExaggerated Force Feedback
100 to 130
130 to 160
13
12
10
6
10
12
Table 7. % Maximum undershoot at different time intervals.
Time (s)No Force FeedbackRealistic Force FeedbackExaggerated Force Feedback
100 to 130
130 to 160
4.9
1.4
10.1
3.1
11.1
5.5
Table 8. Settling time, s ( t s ) at different time intervals.
Time (s)No Force FeedbackRealistic Force FeedbackExaggerated Force Feedback
35 to 70
70 to 100
100 to 130
130 to 160
26
26
20
8
16
23
-
11
10
18
-
5
Table 9. Time elapsed in tolerance band at different time intervals.
Time (s)No Force FeedbackRealistic Force FeedbackExaggerated Force Feedback
35 to 70
70 to 100
100 to 130
130 to 160
9
6
10
0
18
8
-
20
24
14
-
25
Table 10. Best force condition on the basis of performance parameters.
Performance Parameters
AltitudeForce ConditionRise TimeOvershoot ControlFall TimeUndershoot ControlSettling TimeMean ErrorBest Selection
HoldNo force
Realistic force
Exaggerated force
•••
GainNo force
Realistic force
Exaggerated force
•••
DescentNo force
Realistic force
Exaggerated force
•••

