Article

High-Efficient Micro Reacting Pipe with 3D Internal Structure: Design, Flow Simulation, and Metal Additive Manufacturing

1
School of Mechanical and Automotive Engineering, South China University of Technology, Guangzhou 510640, China
2
Department of Electrical Engineering and Information Technology, Karlsruhe Institute of Technology, 76131 Karlsruhe, Germany
*
Author to whom correspondence should be addressed.
Appl. Sci. 2020, 10(11), 3779; https://doi.org/10.3390/app10113779
Submission received: 12 April 2020 / Revised: 25 May 2020 / Accepted: 28 May 2020 / Published: 29 May 2020
(This article belongs to the Special Issue Advancements in Laser Based Additive Manufacturing Technologies)

Abstract

:
The micro reacting pipe with 3D internal structure, which is a micromixer with the shape of the pipe, has shown great advantages regarding mass transfer and heat transfer. Since the fluid flow is mostly laminar at the micro-scale, which is unfavorable to the diffusion of reactants, it is important to understand the influence of the geometry of the microchannel on the fluid flow for improving the diffusion of the reactants and mixing efficiency. On the other hand, it is a convenient method to manufacture a micro reacting pipe in one piece through metal additive manufacturing without many post-processing processes. In this paper, a basis for the design of a micromixer model was provided by combining the metal additive manufacturing process constraints with computational fluid dynamics (CFD) simulation. The effects of microchannel structures on fluid flow and mixing efficiency were studied by CFD simulation whose results showed that the internal micro-structure had a significantly positive effect on the mixing efficiency. Based on the simulation results, the splitting-collision mechanism was discussed, and several design rules were obtained. Two different materials were selected for manufacturing with the laser powder bed fusion (L-PBF) technology. After applying pressure tests to evaluate the quality of the formed parts and comparing the corrosion-resistance of the two materials, one material was picked out for the industrial application. Additionally, the chemical experiment was conducted to evaluate the accuracy of the simulation. The experimental results showed that the mixing efficiency of the micro reacting pipe increased by 56.6%, and the optimal determining size of the micro reacting pipe was 0.2 mm. The study can be widely used in the design and manufacture of a micromixer, which can improve efficiency and reacting stability in this field.

1. Introduction

The micro reacting pipe is a kind of micromixer with the shape of a pipe which is a continuous flow chemical synthesis device with critical dimension from micron to millimeter. It has many high-quality characteristics. For example, the micromixer has great mass transfer ability and strong heat transfer ability. It is easy to monitor the chemical production by using this device, and there is no amplification effect. These characteristics greatly improve the mixing efficiency of micro reacting pipes, facilitate the stable control of various chemical reactions in industrial production, and shorten the R&D period of new products in chemical and pharmaceutical fields. For instance, Luong Jim et al., realized the effective management of extra-column effect and performed post-column backflushing with the 3D-printed two-stage micromixer [1]. Therefore, the study of the micro reacting pipe is of great significance for the development of high efficiency, low consumption, safe and controllable production mode, and the realization of fine and sustainable development in the fields of medicine and chemical industry [2,3].
The critical dimension of the micro reacting pipe is in the order of micron to millimeter, which greatly increases the influence of the wall viscosity force on fluid. Hence, the flow pattern inside the channel of the micro reacting pipe is mostly laminar flow. In laminar flow, the mixing of the components in fluid depends on the natural diffusion of molecules which is extremely slow. For example, the diffusion coefficient of liquid is only about 1 × 10⁻¹⁰–1 × 10⁻⁹ m2/s, which is not conducive to the improvement of production efficiency. Therefore, it is necessary to improve the diffusion process in the micro reacting pipe to improve the production efficiency and practical value of the micro reacting pipe [2,4,5]. One of the effective methods is adding external instruments to provide energy to produce turbulence directly. For instance, Fan Zhang’s team investigated the turbulent mixing of two miscible fluids in a high pressure (HP) coflow micromixer operated at 100 bar [6].
Because the traditional manufacturing methods usually exert some influence on the outer surface of raw materials, it is inconvenient to use them to fabricate the internal structure. For example, square waveforms shaped or “Z” shaped micromixers [2] need to be made up of two metal plates, each of which is machined on its outer surface, and then they are bolted or welded. Another example is Jeon WJ, who manufactured micromixers by using molds [7]. There are some other designs using different methods of manufacturing. For instance, using lithography, micro-molding, and bonding techniques to build polydimethylsiloxane micromixer [8] or using a standard wet etching technique to fabricate the designed channel and bonding glass–glass chip to produce the designed micromixer [9]. But these methods can only make a 2D shape. There are some other methods to manufacture a 3D shape micromixer, such as forming a three-dimensional (3D) micromixer with propeller blades by two-photon polymerization (TPP) [10], which needs a long time to fix the printed 3D object, so the process is cumbersome. In addition, the 3D-microfluidic reactor in low temperature cofired ceramic (LTCC) [11] has poor thermal conductivity and is difficult to control sintering shrinkage. There is an easy method, which is bending straight tubes of copper into coil [12]. However, it causes the internal structure to be too simple to produce turbulence to mix fluid efficiently. By contrast, additive manufacturing (AM) can be used to form micro reacting pipes with 3D inner structure directly without adding additional processes such as welding or making molds.
There were some people redesigning the micromixer. For example, Sumsun Naher et al. [13], Mubashshir Ahmad Ansari et al. [14], Zeyang Wu et al. [15], and Xueye Chen et al. [16] have designed different internal structures of the micro reacting pipe through simulation, which might improve the mixing efficiency of the micro reacting pipe theoretically, but their results were difficult to be fabricated by the traditional manufacturing methods because of the complex geometry, thus, the practicability of these results was affected. Based on AM technology, the optimized internal structure can be formed directly to give more optimization space for the micro reacting pipe. In addition, the AM technology can break through the conventional thinking of deforming and removing materials, realize the new manufacturing concept of “ Net Shape Forming “ [17,18], and conform to the new tide of “Green Manufacturing” [19].
The fabrication of micromixer by AM has been studied. For example, Obinna Okafor’s team made small continuous flow oscillating baffle reactors with SLA (stereo lithography appearance) technology [20] and Elisenda Fornells’ team studied a multi-material 3D printed microfluidic reactor with integrated heating [21]. The evaluation results of the study showed that the micro reacting pipe could be manufactured by AM technology to obtain a satisfactory mixing performance, which reflected the potential of AM in the field of micro reacting pipe manufacturing.
The micromixers mentioned above are all non-metallic material. But there is also research which is based on metal additive manufacturing such as 316L stainless steel micromixer by micro powder injection molding [22]. Jie Liu et al., proposed bringing the L-PBF method to fabricate the porous metals as catalyst supports to improve the hydrogen production performance of micromixers [23]. But this method also needs to assemble several parts to make a completed micromixer, whose process is relatively complex. Kathryn L. et al., investigated optimized wavy microchannels numerically which were manufactured by using L-PBF [24]. Their microchannels had a relatively gentle rolling inner structure. But this structure could not make turbulence as much as possible.
In this paper, based on L-PBF technology, a type of internal structure of the micro reacting pipe was designed and fabricated, and its optimal critical dimension was discussed. In addition, the properties of the micro reacting pipe in this paper were compared with the former ordinary micro reacting pipe. To investigate the content above, both the CFD simulation method and chemical experimental method were employed. To study the insight of the micromixer, Harrson S. et al., discussed computational methodology for the development of microdevices and micromixers with ANSYS CFX [25]. At the same time, the chemical experiment was based on the Villermaux–Dushman parallel competition reaction system which used the concentration of I 3 in the outflowed solution as a probe to evaluate mixing efficiency. On the other hand, Jacob C. et al., researched building direction effects on microchannel tolerance and surface roughness through X-ray computed tomography (CT-scan) [26]. Therefore, this paper will not focus on the dimension deviation and surface roughness.

2. Research Preparation

2.1. Equipment and Materials

To conduct the chemical experiments, the advection pump 2PB-10005 was employed to inject the reactant solutions and the Agilent Cary 60 UV spectrophotometer was used to determine the absorbance of the outflowed solution. To fabricate the micro reacting pipe, two metal materials were compared and the better one was selected to form the micro reacting pipe with the L-PBF machine Dimetal-280 manufactured by Laseradd Technology (Guangzhou, China) Co., Ltd. Main system technical parameters of the L-PBF machine are described briefly below. Its theoretical spot diameter is greater than or equal to 40 μm, stacking layer thickness is 0.02–0.1 mm, laser power is (10–100%) × 500 W, velocity of forming is 10–20 cm3/H, and accuracy of forming is ±0.02 mm. The principle of the L-PBF process is illustrated in Figure 1a. With the help of high-energy laser, metal parts with extremely internal complicated structure can be fabricated directly by powder material without the need of post-processing treatment [27].
The aforementioned metal materials were IN718 alloy and 316L stainless steel, whose average particle sizes were 25 and 33 μm, respectively. Their compositions were as shown in Table 1, and the micromorphology images of the two materials powders are as shown in Figure 1b,c.

2.2. Research Procedure

The research procedure of this study is shown in Figure 2. Firstly, based on the combination of the optimal principles to improve mixing efficiency and the constraints of L-PBF process, the internal structure of the micro reacting pipe was obtained in this paper. Secondly, the optimal critical dimension as well as the comparison between the micro reacting pipe in this paper and the former ordinary one was discussed by CFD simulation. Thirdly, the corrosion resistance test and compression resistance test were performed to select the suitable material and the forming parameters to form the micro reacting pipe. Finally, several micro reacting pipes in this paper were fabricated and some chemical experiments were conducted to verify the simulation settings.

2.3. Design of Micro Reacting Pipe

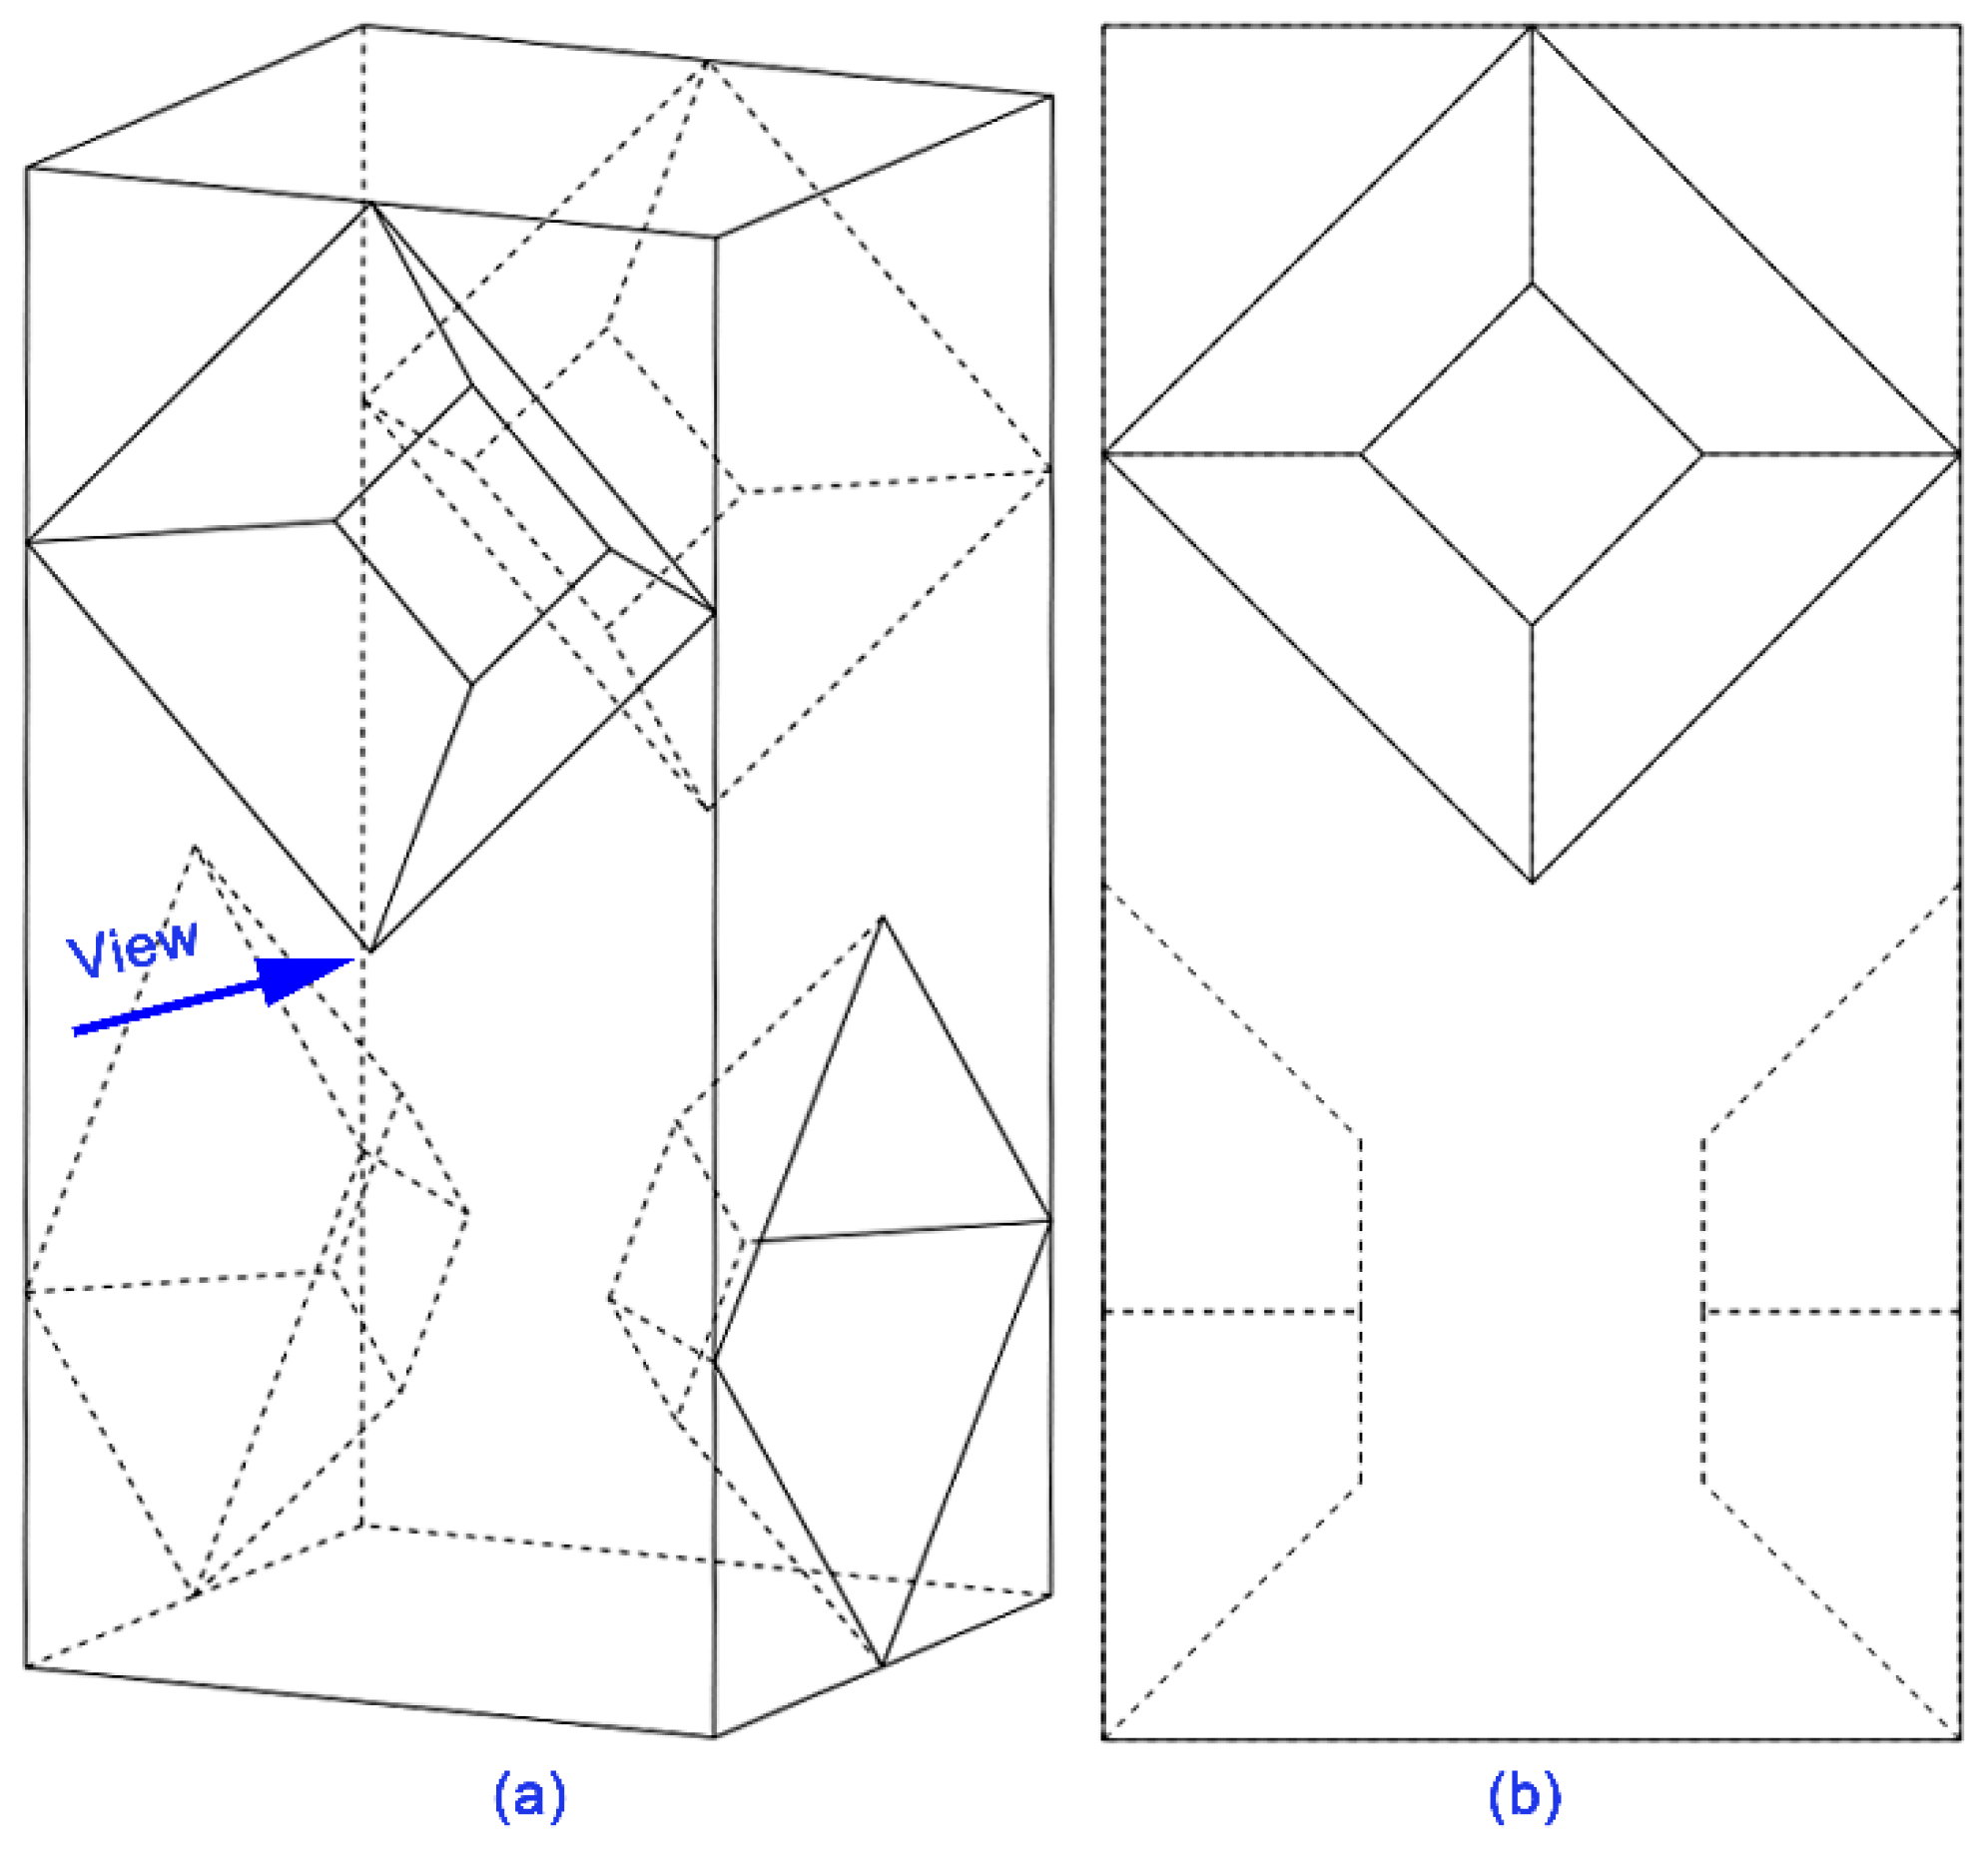
As shown in Figure 3, the internal structure designed in this study is composed of the obstacles with the shape of quadrilateral pyramid table. The dimension of the outer circle is 10 mm. Fluid will turn into several strands by the front edges and the gaps between obstacles when it passes through the obstacles. Then, the split fluid will converge along the slope, so the fluid will collide and form swirls at the back of the obstacles. This process will break down the laminar pattern, turn the flow pattern into turbulence, and promote convection diffusion so as to improve the mixing efficiency. During manufacturing, out of consideration of process constraints of L-PBF, the axis of the micro reacting pipe should be vertical to the substrate. At the same time, the angle between the suspended structure and the wall in the channel should be not smaller than 45° to avoid building support inside the channel which cannot be removed after forming [28]. So, the first design principle is obtained: the angle of inclination of the internal structure is more than or equal to 45°.
The flow field model used in this simulation is shown in Figure 4a below. The entrance part was modeled according to the actual measurement of the tee coupling joint used in the chemical experiment. The mixing area was composed of 10 groups of internal structure units with the total length of 40 mm.
The characteristic cross-section of the flow field is shown in Figure 4b. The size represented by x in the diagram is called the determining size and is denoted as JXxx (indicating that the length of the gap is xx × 0.1 mm). By geometrical analysis, the area, the circumference, and the critical dimension of the cross-section can be calculated. By the laws of geometry, the equations are as follows:
The relationship between the area and the determining size:
A = ax + ( a x ) 2 2 tan θ .
The relationship between circumference and determining size:
C = 4 a + 2 ( a x ) ( 1 cos θ ) sin θ .
The equation of the critical dimension of the cross-section:
d = 4 A C = 2 axsin θ + ( a x ) 2 cos θ 2 asin θ + ( a x ) ( 1 cos θ ) .
In this study, θ was equal to 45°, and a was equal to 2 mm. Therefore, the relationship between the critical dimension and the determining size is as follows:
d = 4 + x 2 ( 1 2 ) x + 2 ( 1 + 2 ) .
In this paper, the simulation analysis and experimental verification were conducted with the determining size of 0.2, 0.4, 0.6, 0.8, 1.0 mm, which corresponded to the critical dimension of 0.85, 0.89, 0.95, 1.03, 1.13 mm.

2.4. Parameter Settings and Characterization Method in CFD

In this paper, CFD simulation was conducted with the commercial software ANSYS 17.0. Firstly, the mesh file of the model was constructed. The final number of mesh elements ranged from 6.5 × 10⁵ to 8.0 × 10⁵. Then, the standard k-e model was used to describe the flow pattern [29]. Water and ethanol were used as simulation mediums, and the species transport equation was used to simulate the diffusion process. The density of the mixture was defined by volume-weighted mixing law [30], and the viscosity of the mixture was set to 0.001 kg/(m2·s), the mass diffusion coefficient was 1.2 × 10⁻⁹ m2/s.
When setting the boundary condition, the velocity inlet and the pressure outlet were used to define the boundary condition. The volume flow rate inside the two inlets were 100 mL/min. Temperature was set to 293 K, and the gauge pressure of inlets was 20,000 Pa in inlets and 0 Pa in outlet. The solution scheme was SIMPLE. The pressure discretization scheme used PRESTO! The other items were discretized by the second-order upwind method.
In the field of characterizing the mixing efficiency in CFD, Ansari et al. [31] used the mixing index to analyze the mixing efficiency in the simulation. The mixing index M is defined as follows:
M = 1 σ 2 σ max 2 ,
where
σ   =   1 N   ( c i c ¯ m ) 2 .
In the equations above, σ 2 is the variance of the tracer’s concentration inside the cross-section, σ max 2 is the maximum value of σ 2 . N denotes the number of sample points inside the cross-section, c i is the mass fraction of the tracer at certain sample points, and c ¯ m is the average value of c i . In the case of complete mixing, M = 1, while M = 0, there is no mixing process happening [31]. In this study, the mixing index came from the outlet.

2.5. Experimental Method to Characterize Mixing Efficiency

2.5.1. The Process of Villermaux–Dushman Reaction System

The chemical experiment used the Villermaux–Dushman parallel competition reaction system, which used the concentration of I 3 in the outflowed solution as a probe to evaluate mixing efficiency [32]. The process is as follows: dissolve the powder of H3BO3, NaOH, KI, and KIO3 with deionized water respectively. Then, pour the solutions above into a beaker successively and stir them so as to obtain the solution a. Next, dilute the 98% H2SO4 solution to the solution b with the certain concentration of H+ needed in the experiment. The following reactions will occur after the two solutions mixing [28]:
H 2 BO 3 + H + =   H 3 BO 3 ,
5 I + IO 3 + H + = 3 I 2 + 3 H 2 O ,
I 2 + I I 3 .
Reaction (7) reacts always faster than (8). Thus, reaction (8) happens only in the position where there is an excess of H + . Since H + is given less than H 2 BO 3 , reaction (8) happens only when the mixing is not sufficient, which causes some local excess of H + . Reaction (9) will happen after reaction (8), so the product of reaction (9), i.e., I 3 can become the probe to reflect the mixing efficiency after calculating with equilibrium constant K of reaction (9) [33].
According to Beer–Lambert law [34], the relationship between the absorbance of the solution and the concentration of I 3 is as follow:
[ I 3 ] = A ε L .
where A denotes the absorbance of solution which can be determined by the UV spectrophotometer, ε is the equilibrium constant which is only related to temperature, L is the wall thickness of the cuvette used in experiment.
To characterize the mixing efficiency, the segregation index is defined as follows [35]:
X s = Y Y ST ,
Y =   2 V total ( [ I 2 ] + [ I 3 ] ) V b · [ H + ] 0 ,
Y ST = 6 [ IO 3 ] 0 6 [ IO 3 ] 0 + [ H 2 BO 3 ] 0 ,
where Vb denotes the volume of solution b, [] denotes the equilibrium concentration, [ ] 0 denotes the initial concentration.
Since Xs is negatively correlated with the mixing efficiency, the micromixedness ratio (α) was proposed, and the micromixedness ratio is positively correlated with the mixing efficiency. The relationship between Xs and α is as follows:
α = 1 X S X S .

2.5.2. Determination of [ H + ] 0

The I / IO 3 system is very sensitive to the concentration of H + , because this reaction system is actually a battle fighting for H + . Too much or too less of H + can reflect a wrong result of mixing efficiency. Therefore, it is necessary to select an appropriate H + concentration at first. Foumier et al. [35] found that the initial concentration of H + should range from 0.03 to 0.08 mol/L and the most appropriate value within this range should be selected according to the measuring range of the UV spectrophotometer and the results of the experiment.

3. Results and Discussions

3.1. Practicality Experiment Results of Micro Reacting Pipe

3.1.1. Metal AM Printing and Compression Resistance Test of Micro Reacting Pipe

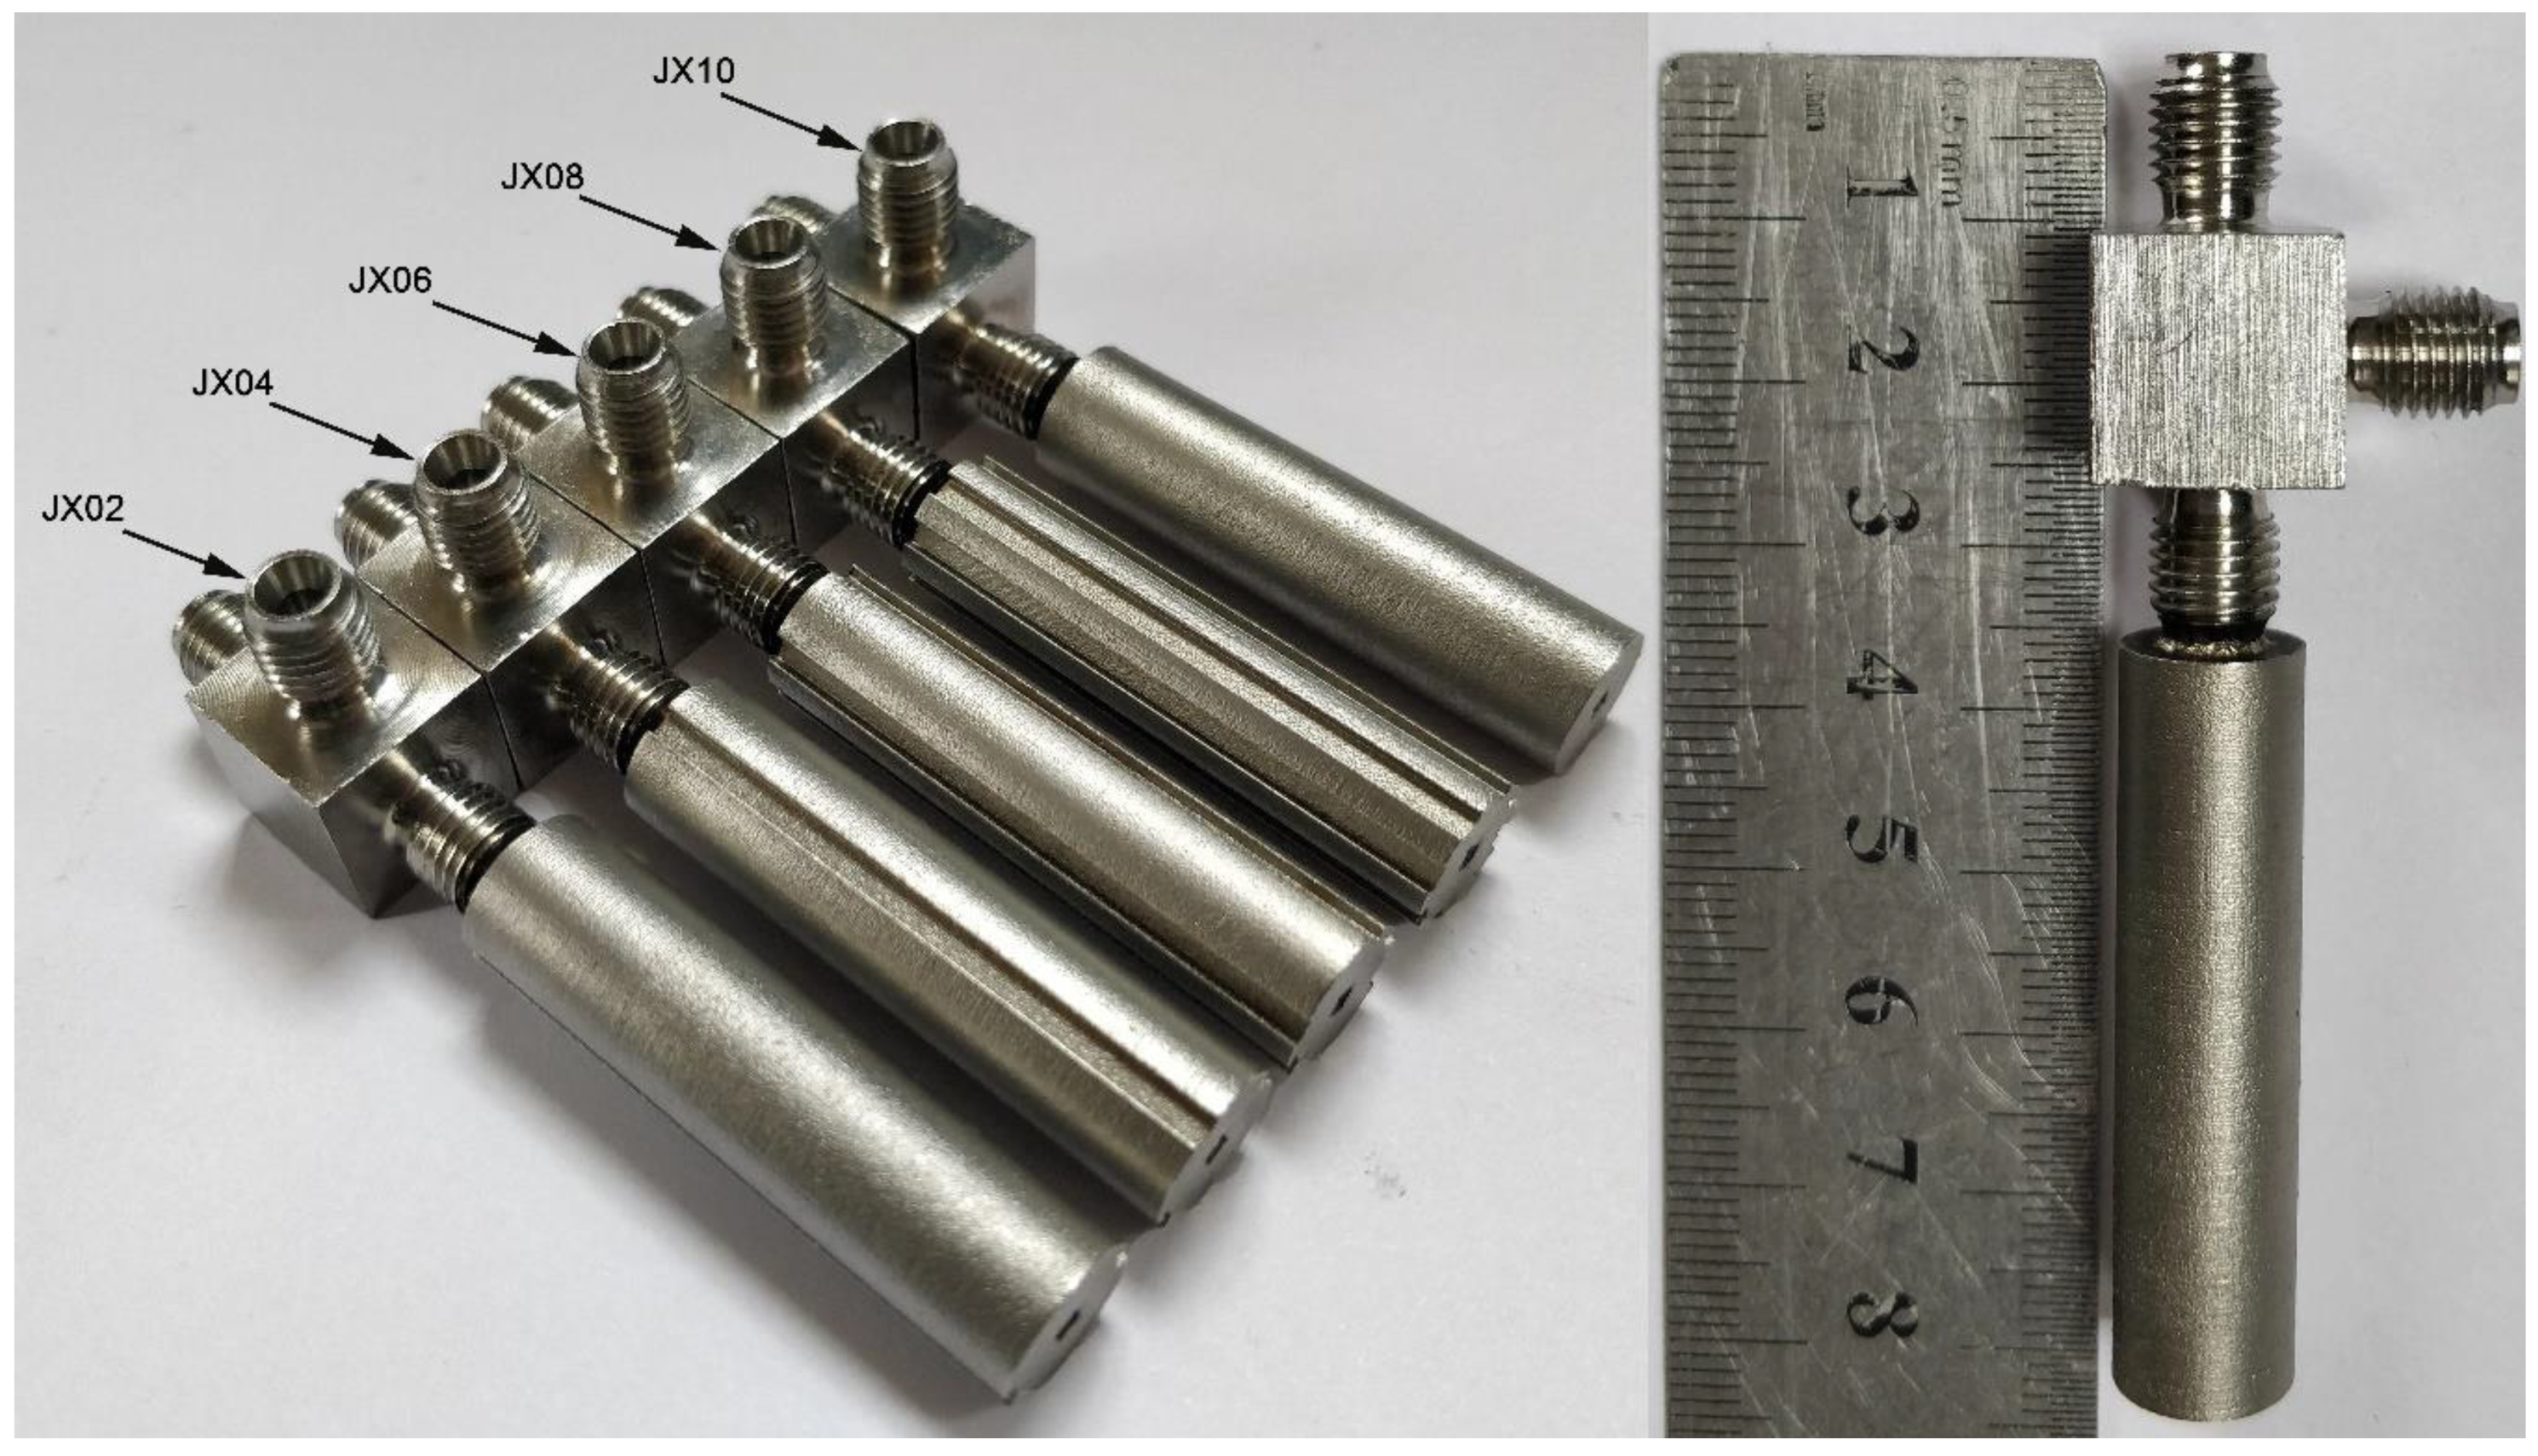
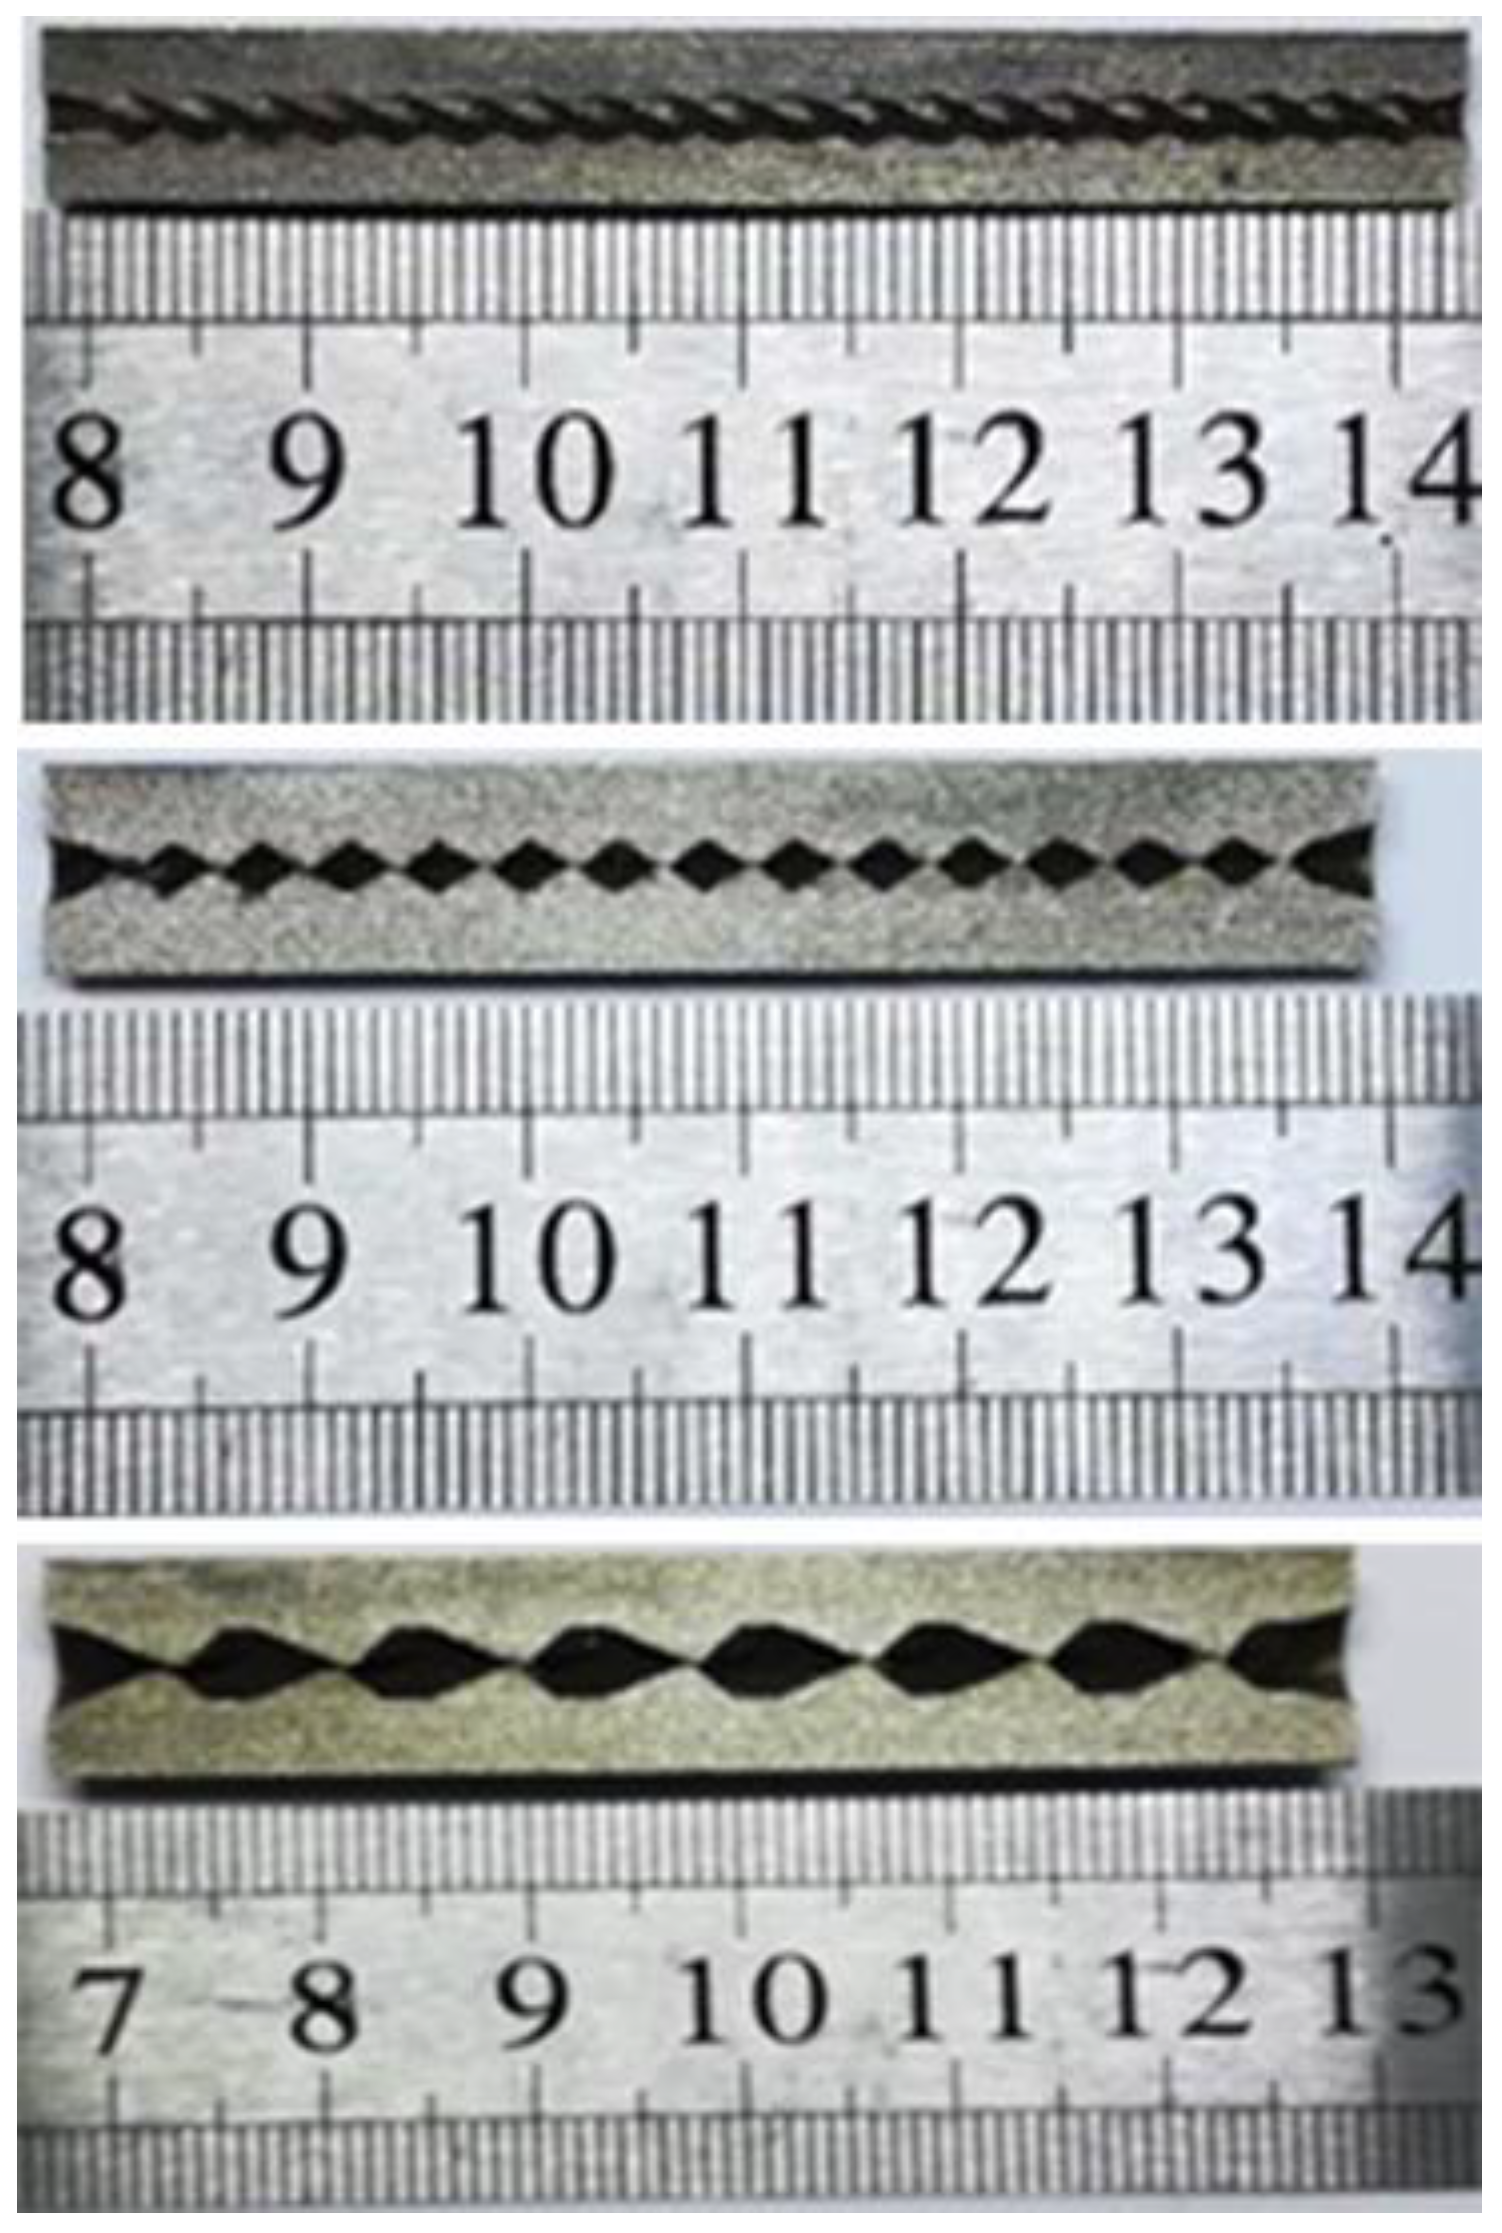
In this study, two kinds of materials, IN718 and 316L stainless steel, were used for forming the micro reacting pipe. Because 316LSS is relatively cheap and used extensively as metal materials in L-PBF, on the contrary, IN718 is expensive but has better corrosion-resistance. The optimization parameters of L-PBF forming IN718 are as follow: spiral angle 30°, scanning distance 0.08 mm, laser power 200 W, scan speed 1200 mm/s; the L-PBF optimized parameters for 316L stainless steel material: inter-laminar spiral scanning, the effect of spiral angle 30°, scanning distance 0.08 mm, laser power 140 W, scanning speed 800 mm/s. The formed parts made of IN718 and 316L stainless steel are shown in Figure 5. The printed molded parts were cut from the substrate by wire cutting and polished. In this study, the inner and outer diameters of the molded parts were measured by electronic vernier calipers, and each dimension data was measured three times. The maximum dimension deviation value is 0.2 mm.
To facilitate the physical experiment of mixing efficiency, the shape of the micro reacting pipe was adjusted, the groove was added to the outer wall of the micro reacting pipe according to the size of the determining size, and the experimental sample was molded by IN718 and the molding parameters obtained in Section 2.3. After obtaining the molded part, the tee coupling was welded to import the two reaction solutions, and the final sample is shown in Figure 6.
The channel size of the micro reacting pipe is small so the pressure in the micro reacting pipe drops dramatically, and it is used in a large flow rate to increase the output in the industrial production, which requires the compression resistance of the micro reacting pipe. In this study, the parameters of L-PBF were optimized by booster test, and the parameters of the high-quality pipe could be obtained by the test. The test pressure was dynamic and gradually increased. During the test, horizontal flow pump was used to inject water into the formed micro reacting pipe and the output flow rate of the pump was continuously increased. As the pressure increases up to the limited pressure 5 MPa in industrial application, if there is no leakage on the external wall of the pipe, the compression resistance of the formed parts can meet the industrial requirements.

3.1.2. Comparison of Corrosion Resistance between Two Materials

Strong corrosive substances such as hydrochloric acid and phosphorus tribromate are often used in chemical production, so it is necessary to compare the corrosion resistance of the materials used by static corrosion test. The test objects were placed in 3% hydrochloric acid solution and 99% phosphorus tribromate solution for 24 h respectively. The lower the mass variation is, the better the corrosion resistance is. The test results are as shown in Table 2 and Table 3, and the data show that the corrosion resistance of IN718 is better than that of 316L stainless steel, and the corrosion resistance of the material can meet the industrial requirements.

3.1.3. Test Results of Physical Mixing Efficiency of Micro Reacting Pipe

In the experiment of mixing efficiency, 11.2406 g boric acid powder, 3.6357 g sodium hydroxide thin tablet, 1.973 g potassium iodide powder, and 0.4985 g potassium iodate powder were dissolved in enough deionized water, and then slowly poured sodium hydroxide into boric acid solution and stirred to make a buffer. Then, the potassium iodide solution and potassium iodate solution were poured into the buffer in turn. Then, 98% concentrated sulfuric acid was diluted to 0.025 mol/L and 0.03 mol/L to obtain the solution b. The initial concentrations of each component in solution a and b are shown in Table 4.
The solution a and b were injected into each inlet of the micro reacting pipe simultaneously by the volume flow rate of 100 mL/min by the advection pump, the absorbance of the effluent was measured, and the absorbance was converted into the micromixedness ratio. The experimental results are as shown in Figure 7. The change of micromixedness ratio with the determining size was consistent at 0.05 and 0.06 mol/L H + concentration, and accorded to the law of theory that the micromixedness ratio of 0.05 to 0.06 mol/L is higher than that of 0.06 mol/L, so the experimental results are correct.

3.2. Simulation Results of Micro Reacting Pipe and Selection of Model Parameters

3.2.1. Selection of Model Parameters and the Three Design Principles

The fundamental reason for the high mass transfer performance of the micro reacting pipe is its small critical dimension of the channel. By reducing the critical dimension of the channel, the diffusion distance of the components reduces, and the mixing efficiency dominated by free diffusion is enhanced. The following formula (15) shows that the microscopic mixing time (t) of the micromixer is directly proportional to the square of the critical dimension (d) and inversely proportional to the component diffusion coefficient (D). Therefore, for the microscopic mixing process, the mixing efficiency decreases monotonously with the increase of the critical dimension [36]. Therefore, the second design principle of the micro reacting pipe is that the channel characteristic size should be reduced as much as possible to enhance the mixing efficiency dominated by free diffusion:
t     d 2 D .
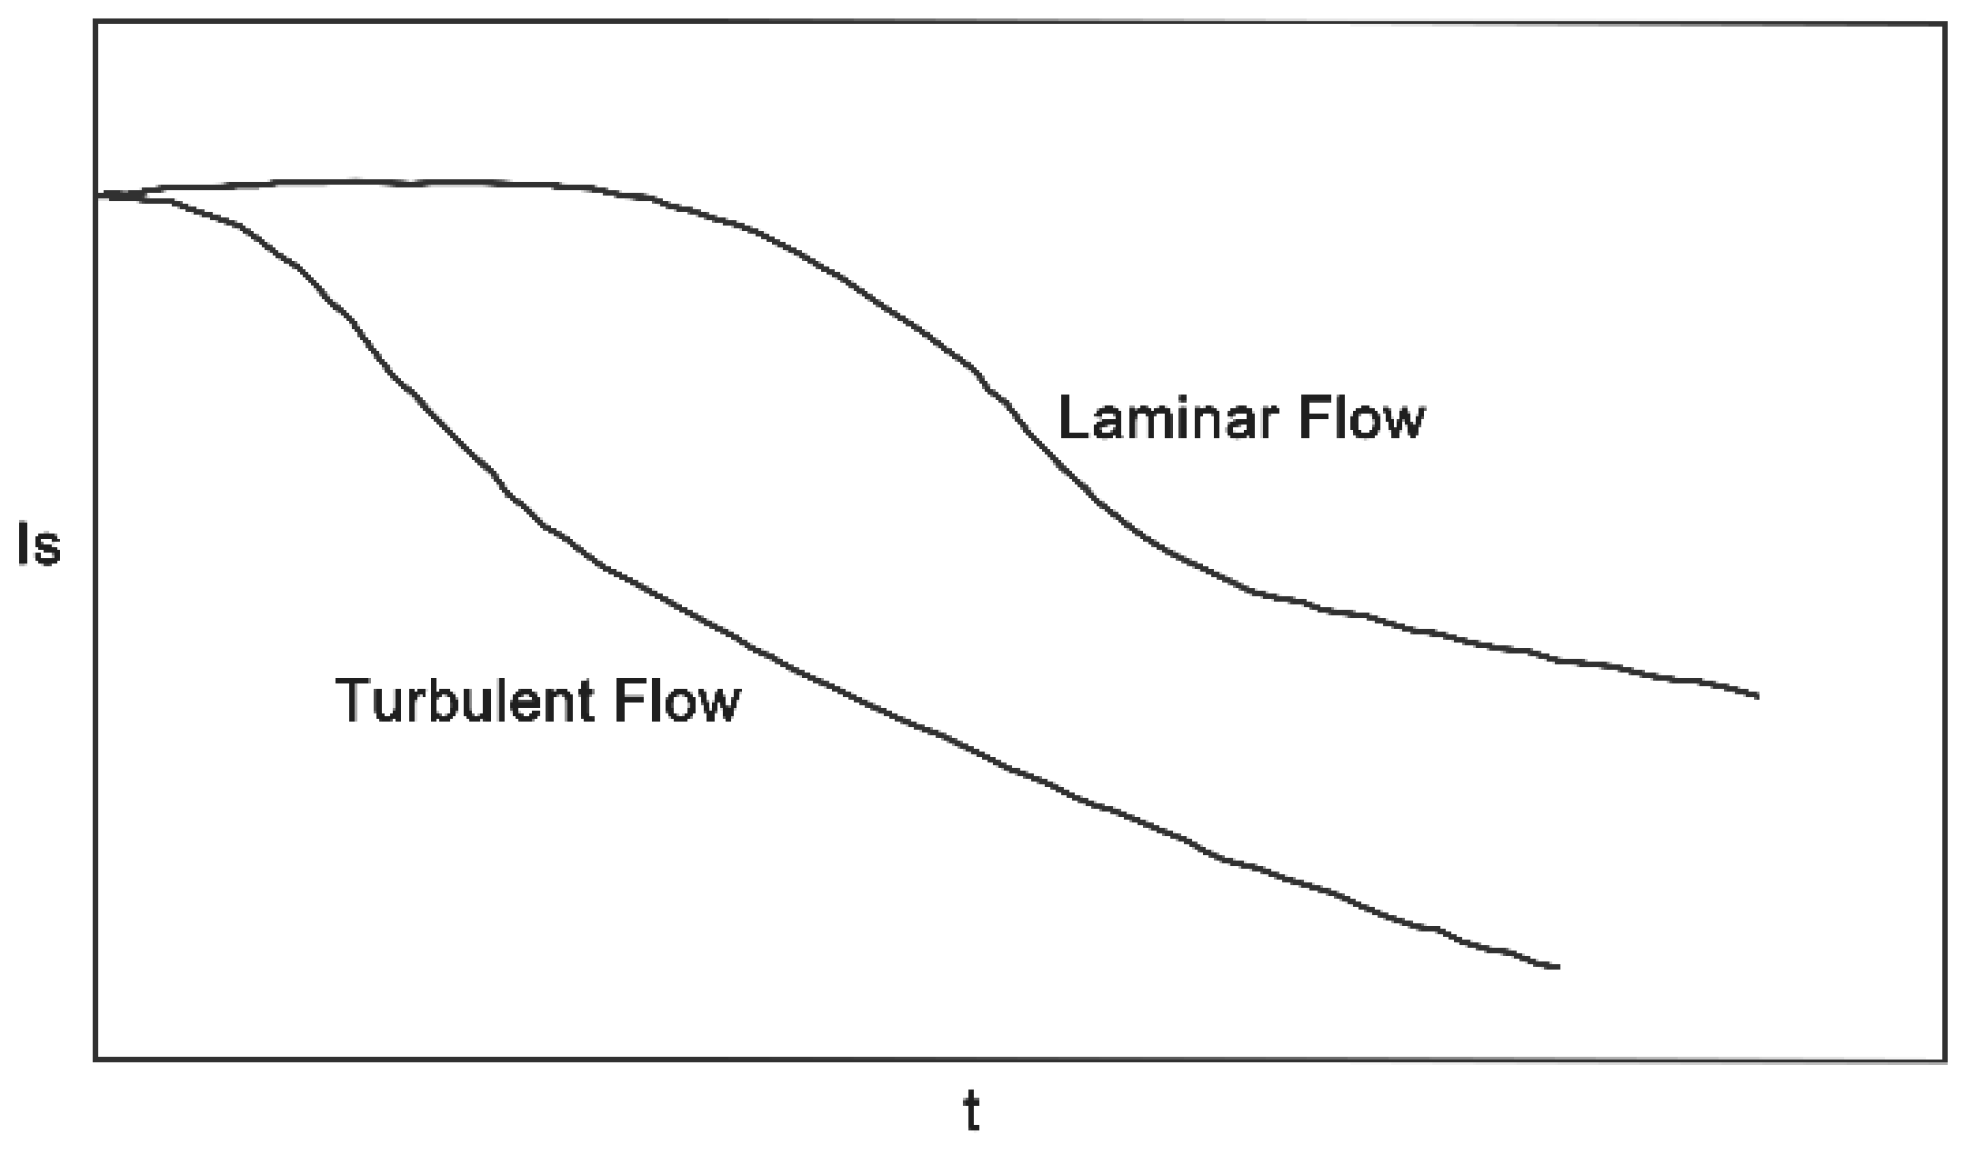
Figure 8 shows the relationship between the intensity of segregation (Is) and the mixing time (t) in different flow states [2]. The intensity of segregation (Is) in turbulent flow decreases more rapidly than laminar flow, because turbulence can promote convective motion between micro-clusters of fluid, and shorten the distance between micro-clusters, thus enhancing the mixing efficiency dominated by convective diffusion. Therefore, the third design principle of the micro reacting pipe is trying to put the fluid in a turbulent state to enhance the mixing efficiency dominated by convective diffusion.
Combined with the application requirements of the micro reacting pipe and the process constraints of metal additive manufacture, three design principles of the micro reacting pipe based on the metal additive manufacture method are summarized:
  • The tilt angle of the internal structure is greater than or equal to 45° to avoid warping during laser melting;
  • The critical dimension of the micro reacting pipe’s channel should be reduced as much as possible to enhance the mixing efficiency dominated by free diffusion;
  • To enhance the convection-diffusion dominated mixing efficiency, the fluid in the micro reacting pipe channel should be put in a turbulent state.
The critical Reynolds number (Re *) is related to the roughness of the wall and channel shape, and Re is defined by the following Equation [2]:
Re = ρ vd μ ,
where ρ, v, d, μ represent the density, average rate, critical dimension (hydraulic diameter), and dynamic viscosity of a cross-section, respectively.
When the actual Reynolds number (Re) on a cross-section exceeds the critical Reynolds number (Re *), the flow will begin to become unstable and gradually transform to complete turbulence as the difference between the two increases.
As Equation (16) shows, when the critical dimension (d) of the micro reacting pipe is reduced to a low level, the actual Reynolds number (Re) will be so small that the critical Reynolds number (Re *) cannot be exceeded or the gap between Re * and Re cannot be enlarged, which makes it difficult for the flow to transfer from laminar flow to fully developed turbulence. That is also the reason why the flow state is usually laminar flow in ordinary micro reacting pipes.
The Re can be increased by enlarging the critical dimension, however, due to the constraint of the second design principle, only increasing the critical dimension will reduce the mixing efficiency. Therefore, fully developed turbulence can only be created by increasing the cross-section’s average velocity or decreasing the Re *. One specific way to increase the cross-section’s average velocity is to increase the energy supply of external energy sources, such as increasing the pump’s output pressure and flow rate, or installing an ultrasonic oscillator on a micro reacting pipe. Multiple pumps are used for multi-stage energy supply, and the micro reacting pipe is placed in an electric or magnetic field to accelerate or rotate charged particles in a fluid by an electric field or magnetic field force, which is the active micro reacting pipe [37].
However, the active micro reacting pipes’ energy consumption and overall device complexity greatly increase due to the need for additional external energy sources. Fortunately, some former studies have also shown that adding obstacles inside the channel can reduce Re * [31]. Therefore, this study used the method of creating complete turbulence by reducing the Re *. Some obstacles in the micro reacting pipe’s channel were designed to generate turbulence to improve the mixing efficiency [38].

3.2.2. Simulation Results of Micro Reacting Pipe

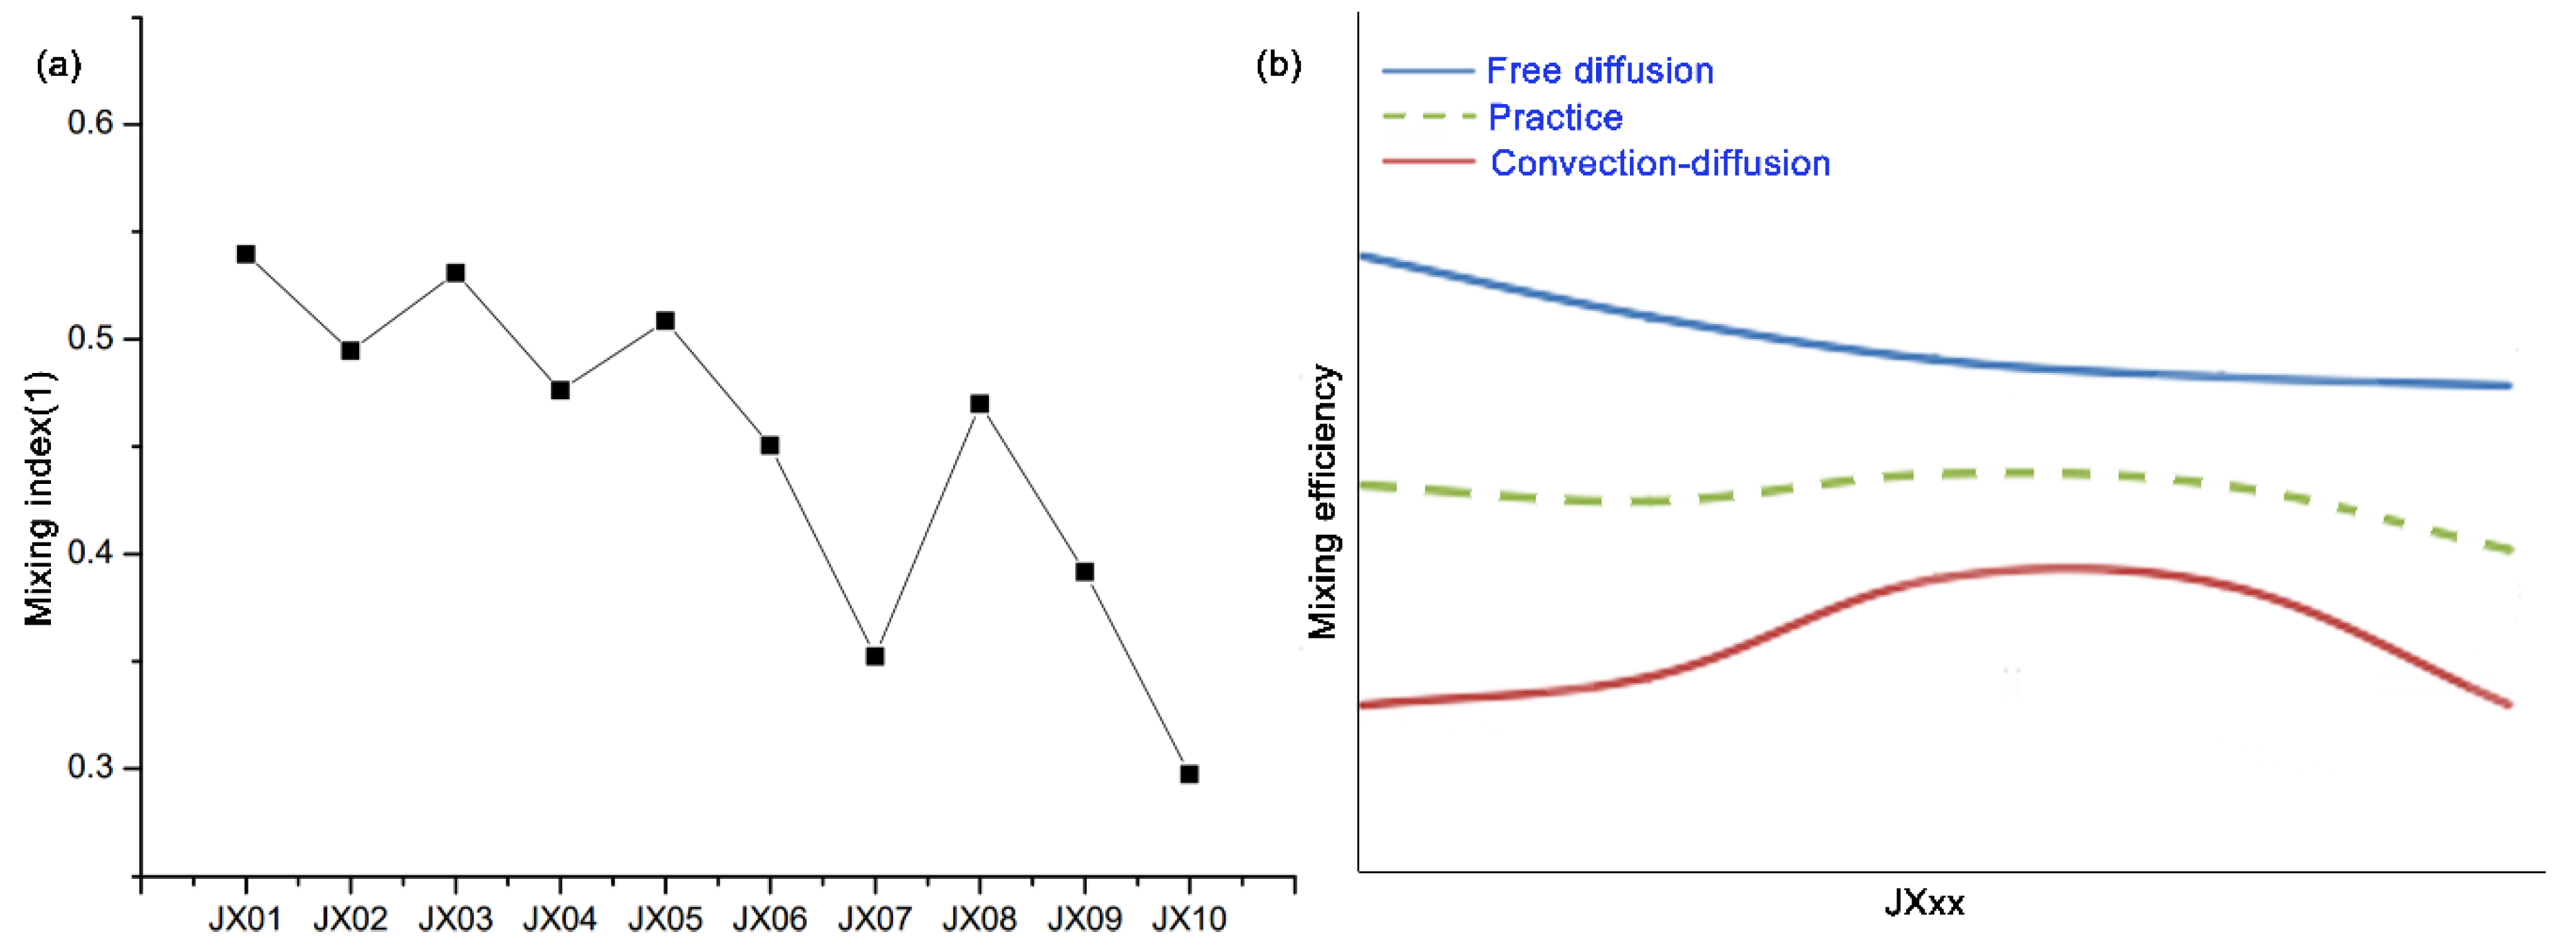
The simulation data were substituted in Equations (5) and (6) to obtain the mixing index under the corresponding determining size, as shown in Figure 9.
Based on the theories and experiment results above, concrete measures were put forward for the design of the micro reacting pipe, including:
  • Reducing the micromixing distance and improving the mixing efficiency by means of sudden contraction and sudden enlargement of the cross-section of the micro reacting pipe;
  • The fluid can be separated by means of a structure with a sharp edge;
  • The fluid confluence can be guided by an inclined plane with a certain angle between the wall of the tube and the surfaces of the obstacles.
With these measures, the fluid can collide in the radial direction and greatly enhance the convection diffusion of the components in the radial direction.
It can be seen from Figure 9a that the mixing index decreases first and then become larger with the increase of the determining size, and then decreases rapidly after an extreme value, where the extreme value appears when the determining size is 0.8 mm. Refer to the previous analysis of the design principles of micro reacting pipes, it is the result of the combination of the second design principle (reducing the size, enhancing the free diffusion) and the third design principle (creating turbulence and enhancing convection-diffusion) in Figure 9b. According to the analysis of the second design principle, with the increase of the determining size, the critical dimension of the channel as well as the longest distance between the fluid components is also increasing. Therefore, the mixing efficiency caused by free diffusion decreases with the increasing of the determining size, and the mixing index caused by free diffusion decreases monotonously with the increase of the determining size. With the increase of the determining size, the critical dimension of the channel is also increasing. According to Equation (16), this accelerates the increase of the actual Reynolds number in the channel. However, the increase of the determining size also reduces the volume of the obstacle and the interference to the flow. Due to the existence of this pair of contradictions, the mixing efficiency caused by convection-diffusion exhibits an “inverted U-shaped” change as the critical dimension to increase.
To explain the disturbance effect of the designed obstacle on the fluid flow, and according to Figure 9a, the best determining size is 0.2 mm. The micro reacting pipe without obstacles and the micro reacting pipe with the determining size of 0.2 mm were simulated, as shown in Figure 10 below. The mixing index of the obstacle free micro reacting pipe was calculated to be 0.315734242.
As shown in Figure 10a,c, the state of flow flowing in an unobstructed channel is laminar, the fluid flows completely along the axial direction, and there is a lack of transverse mass and momentum exchange between the fluid microspheres. So, the diffusion of components depends on the random motion of molecules. In the channel with obstacles, the fluid is squeezed at the square frame, which reduces the distance between the two sides of the fluid boundary, shortens the maximum displacement of the two components, and enhances the free diffusion efficiency of the components. At the circle, the velocity vectors round in layers of circles, indicating that a swirl is formed there, which indicates that the fluid flow changes into turbulence.
Figure 10d,e is respectively two velocity vector diagrams of the fluid formed after passing through one set of orthogonal obstacles. In Figure 10d, four strands of fluid, upper left, upper right, lower left, and lower right, are guided by obstacles to move towards the circle in the graph and converge into two strands. The convergent fluids are divided into four strands after reaching the next set of obstacles which are orthogonal to the former, and then move towards the circle frame in Figure 10e, converge into two strands. In this periodic fluid movement, the fluid is constantly divided and converged, and the fluid microspheres from all directions collide violently at the confluence, resulting in the continuous deformation and fragmentation of the fluid microspheres and the formation of smaller microspheres. Thus, it is more favorable for the uniform distribution of the components in the fluid and the enhancement of the mixing efficiency.
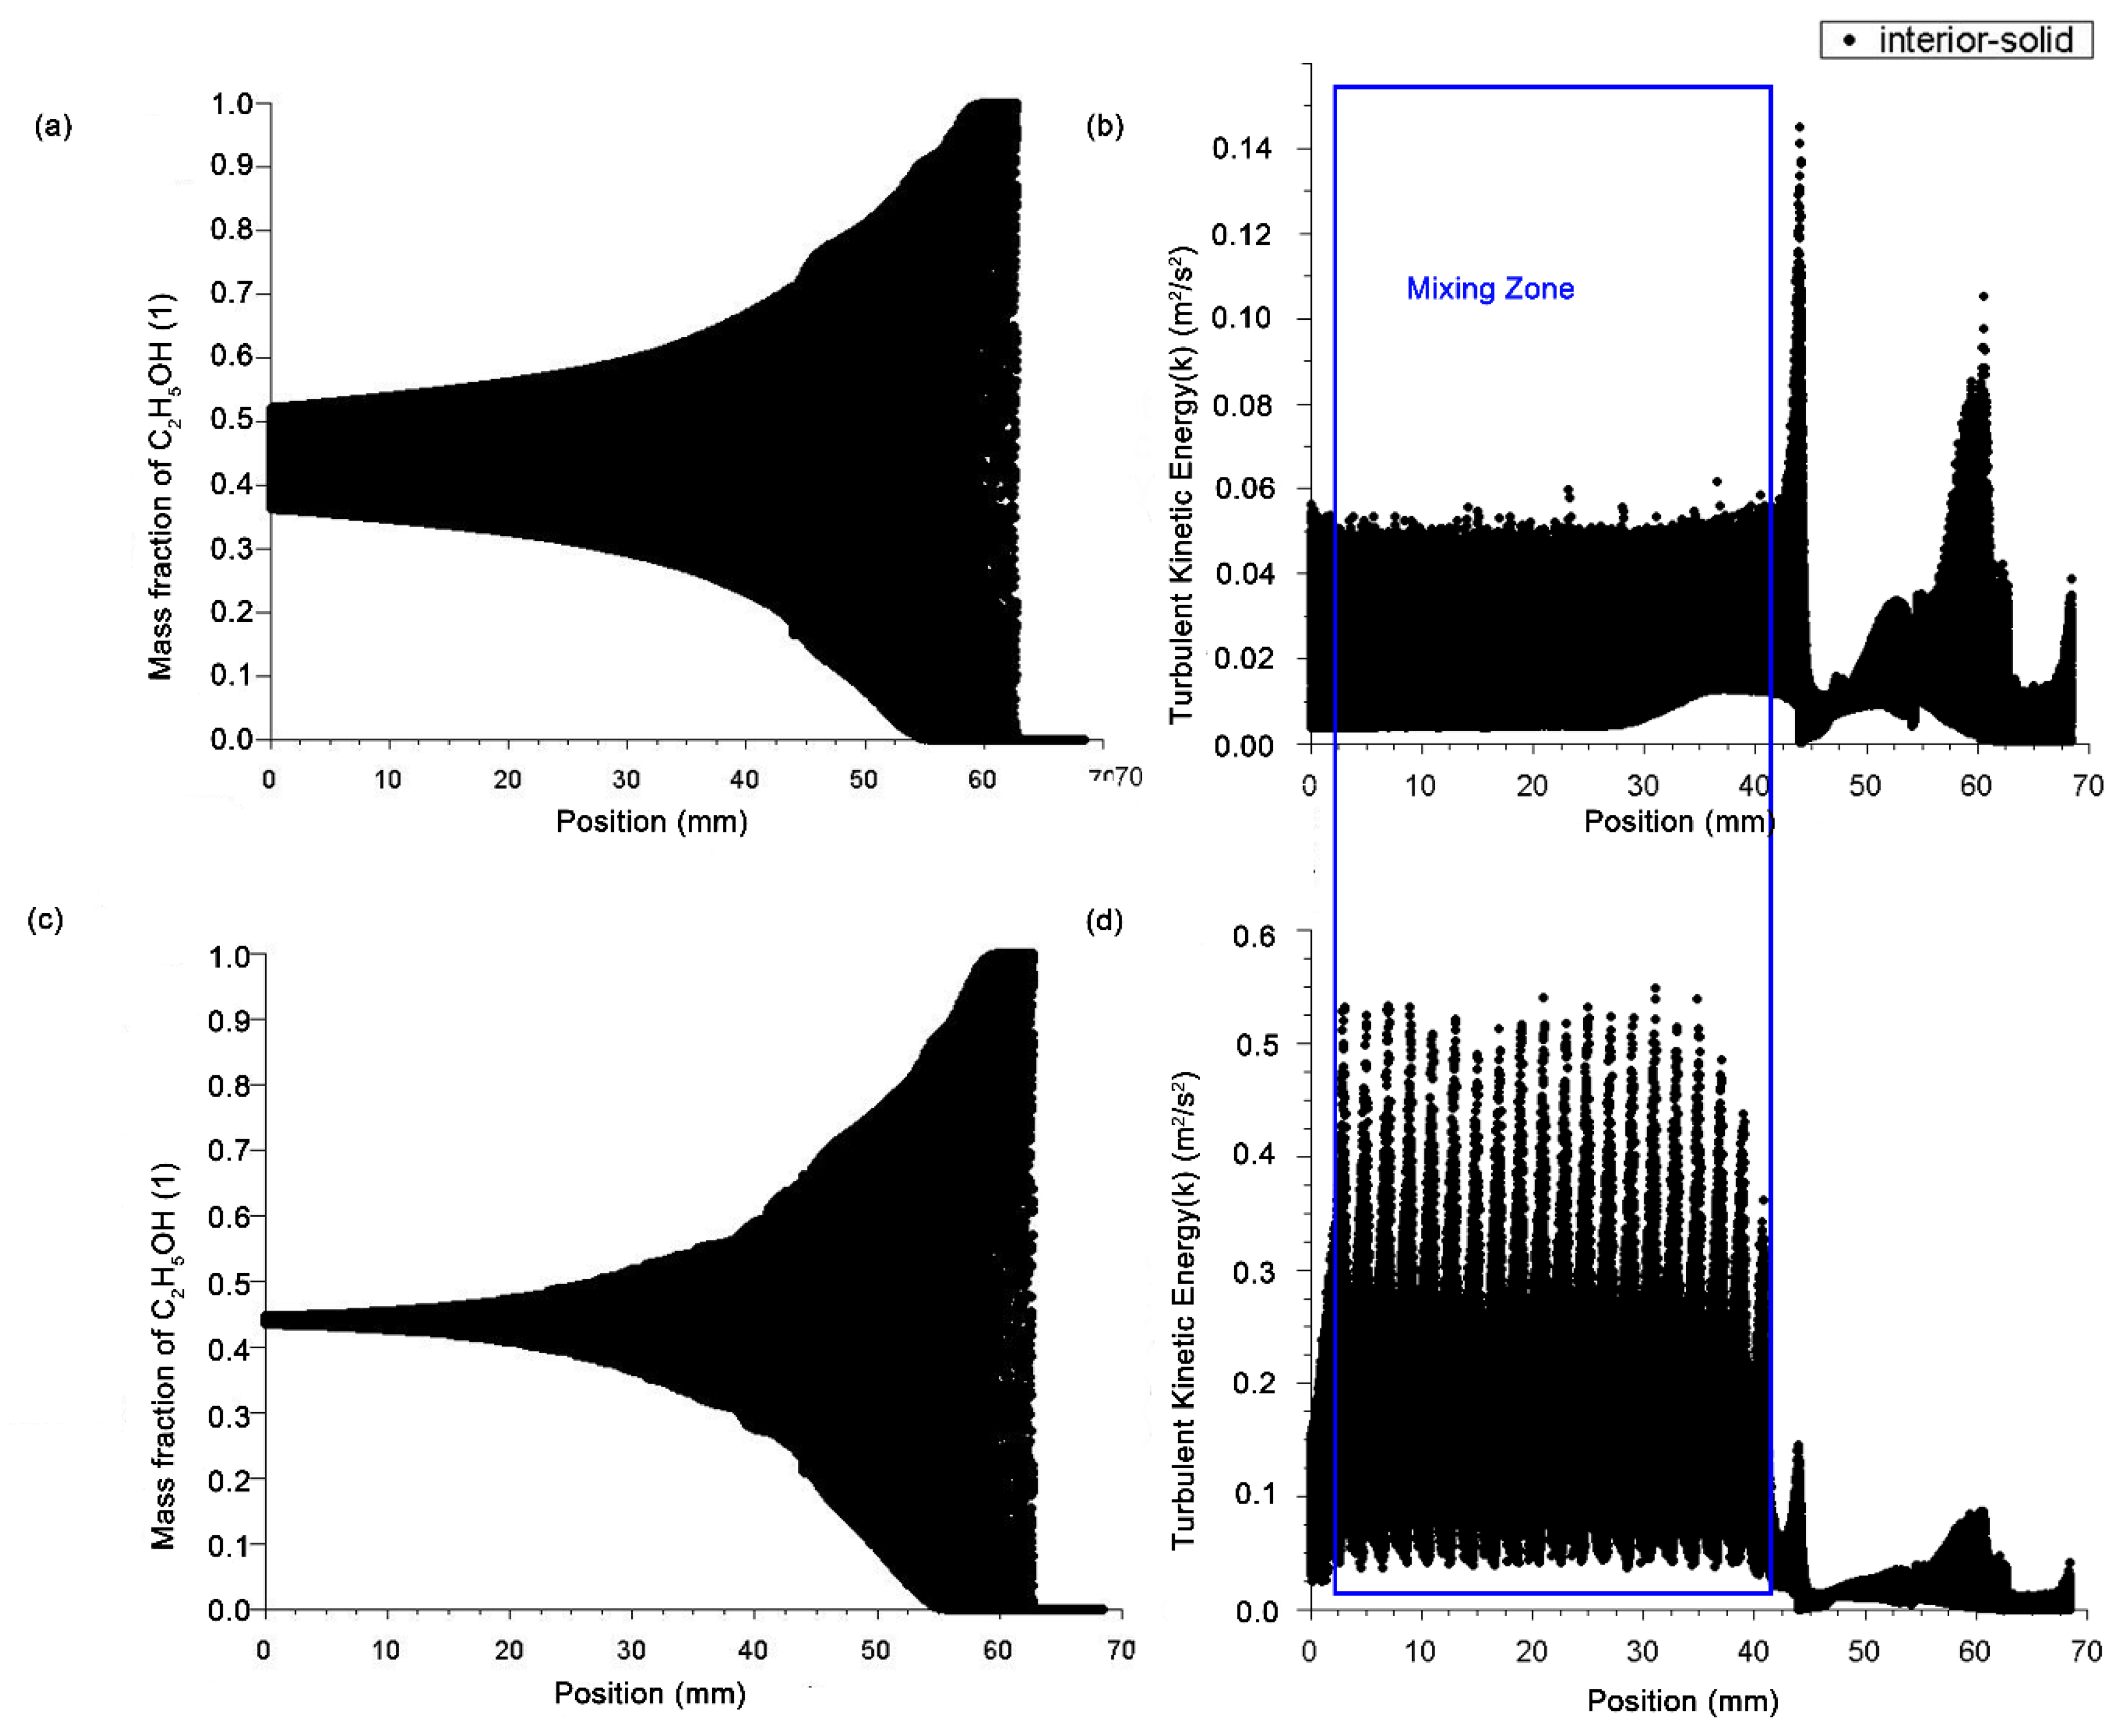
Figure 11 shows the comparison of mass fraction distribution of axial components and kinetic energy distribution of axial turbulence between the micro reacting pipe without obstacles and with obstacles designed in this paper.
The distribution of mass fraction of the component ethanol (left in Figure 11) demonstrates that the mass fraction of the ethanol in the micro reacting pipe with obstacles converged to the ideal point 0.4473625 earlier than the unobstructed pipe. Therefore, the obstacles designed in this paper can enhance the mixing efficiency of the micro reacting pipe.
The turbulent kinetic energy of the micro reacting pipe with obstacles in the mixing region is nearly an order of magnitude higher than that of the unobstructed micro reacting pipe as shown in the comparison of axial turbulent kinetic energy (right). Therefore, the fluid motion is more intense in the micro reacting pipe with obstacles. The mass and momentum exchange between the various fluid micro-clusters more frequently, which enhances the convection and diffusion of the micro reacting pipe and is beneficial to the improvement of the mixing efficiency.

4. Discussion

By comparing the micromixedness ratio (α) in Figure 7 and the mixing index (M) of the physical test in Figure 9a, the simulation results showed that the maximum mixing efficiency of the prediction was different from that of the experiment. The reasons for the deviation might be that the meshes and models were not suitable enough, the deviation dimensions and roughness of the actual internal structure of the molded parts were not considered in the simulation. Although both of them were positively correlated with the mixing efficiency, they were not uniform in dimension. Hence, only the qualitative analysis can be carried out. But the simulation results were consistent with the experimental results. The position of the turning point and the changing trend of the slope between every two points were accurately predicted, so the simulation still had sufficient credibility. [39].
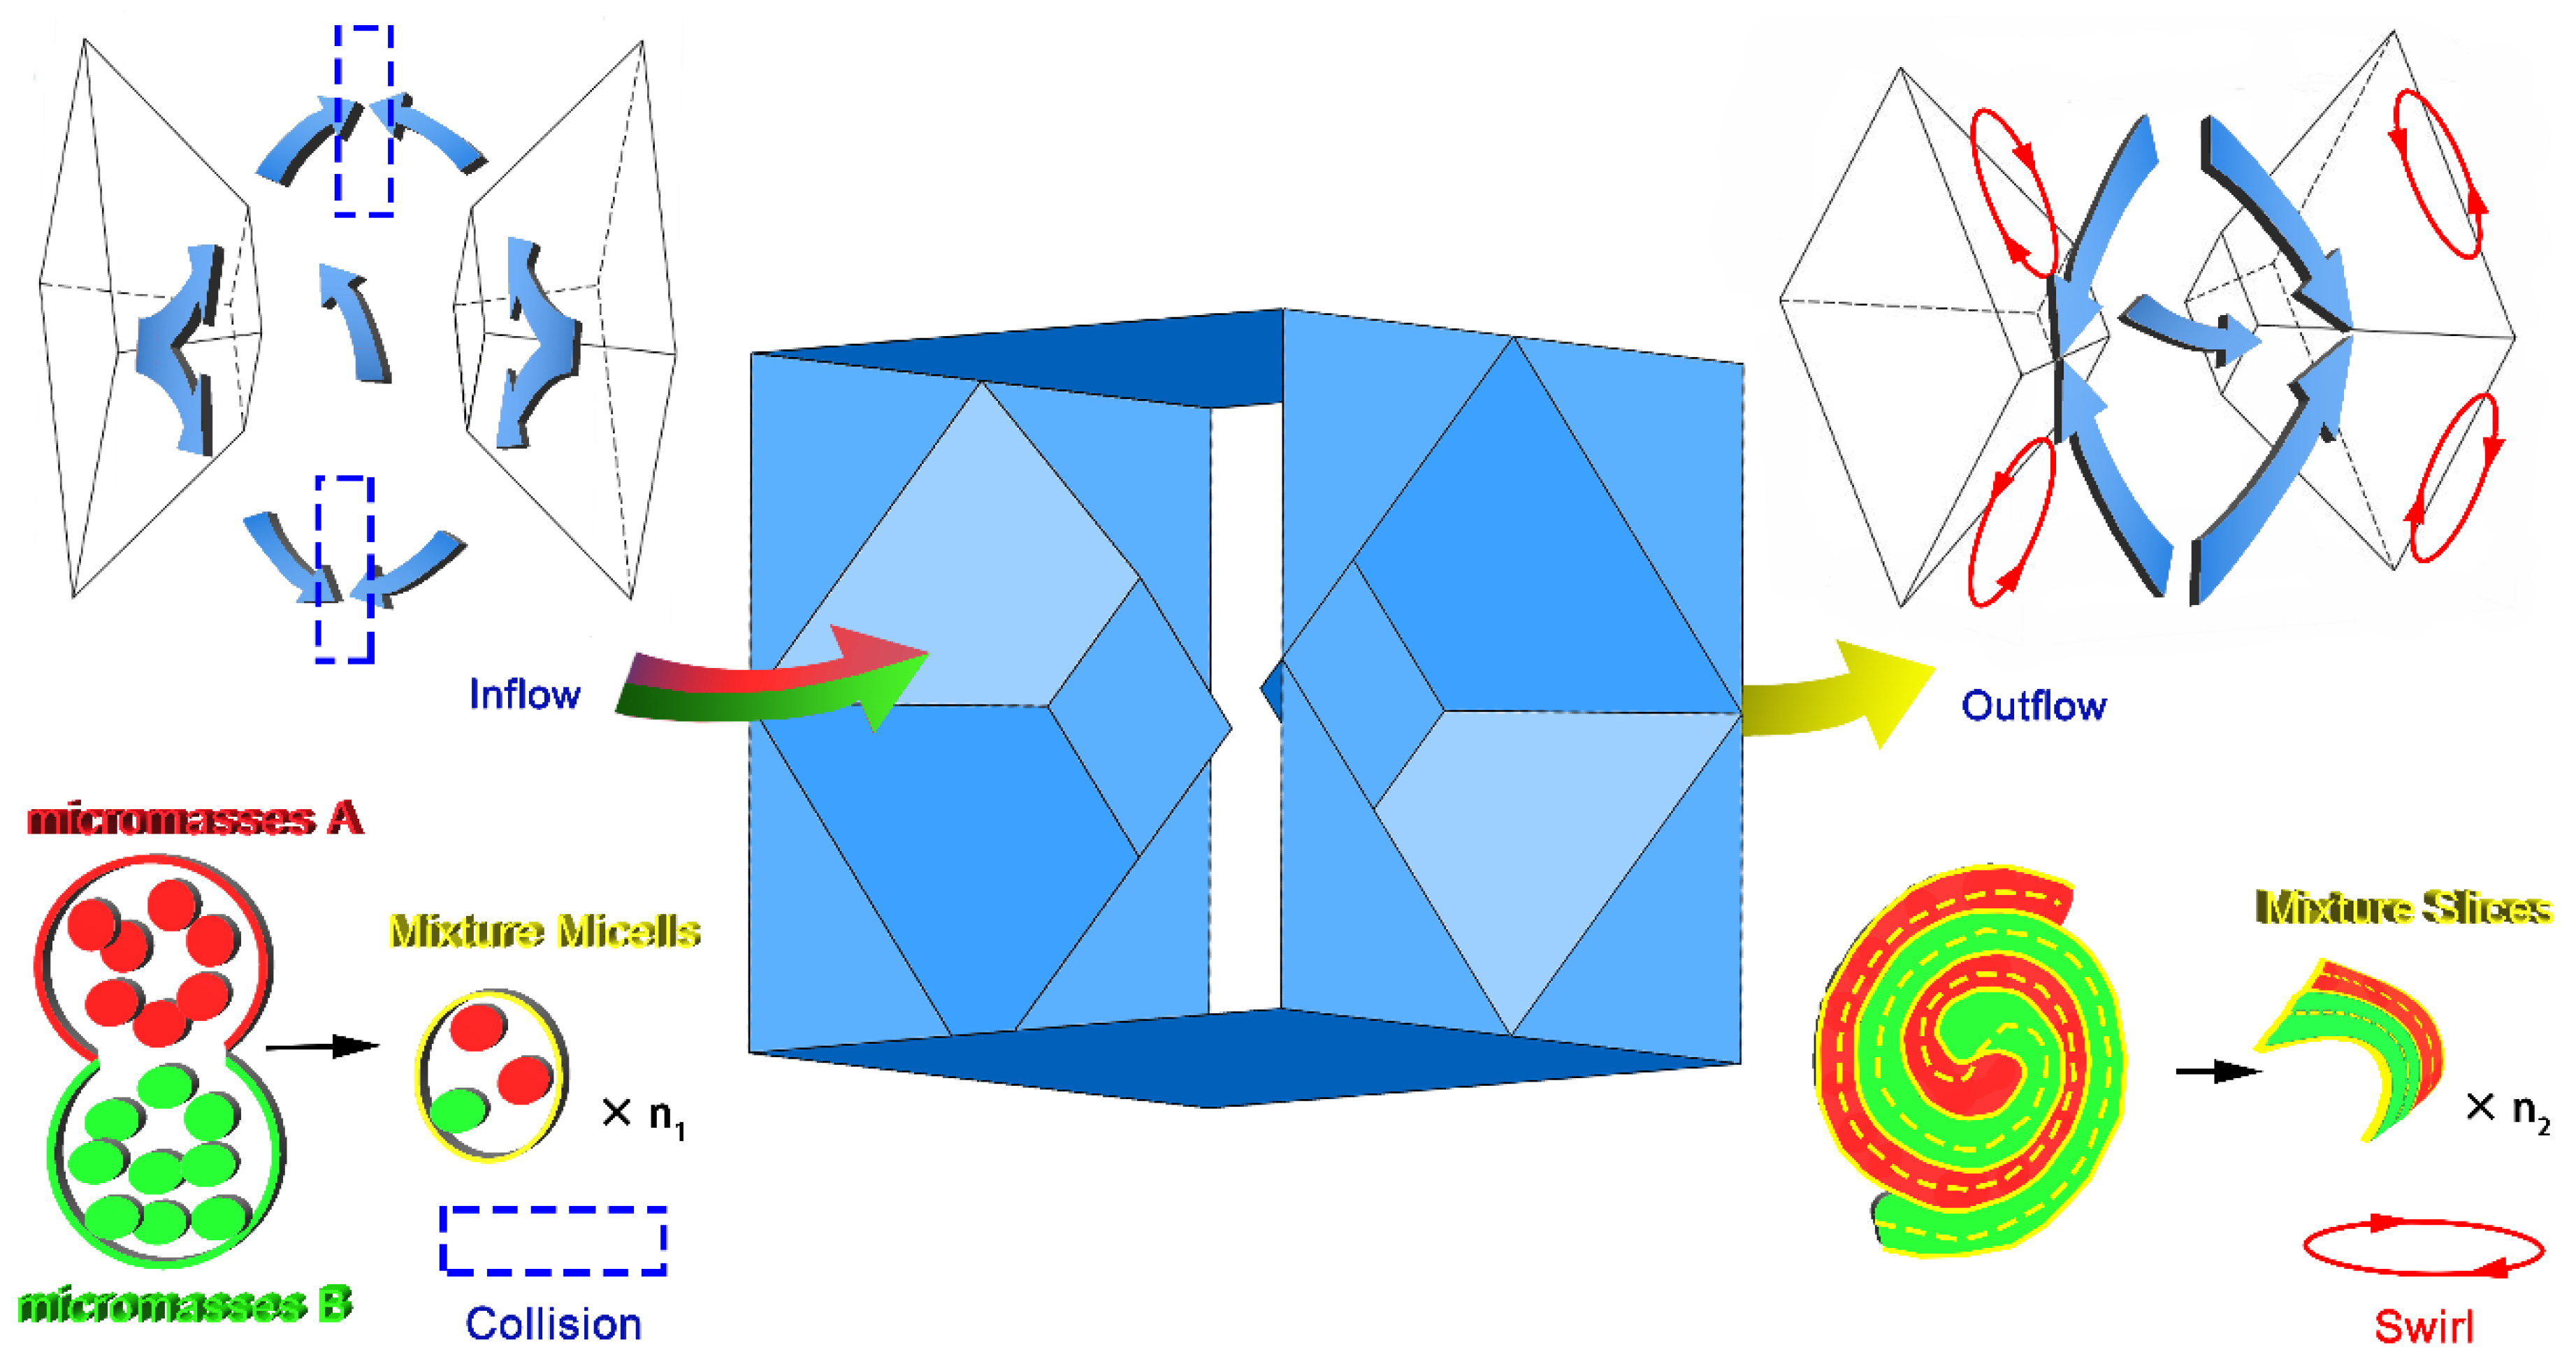
Figure 12 shows how splitting-collision mechanism works. There are two main mixing patterns influencing its mixing process, collision, and swirl. Besides, continuous fluid can be divided into huge amounts of micromasses which have different physical or chemical states based on hydrodynamics theory system.
When two micromasses collide, the components contained inside the micromasses will break through the surfaces of two micromasses, resulting in the mixing of two components. At the same time, a bigger micromass will turn into some smaller micromasses. The smaller micromasses have larger relative surface area, which increases the probability of contacting outer components and enhances the molecular diffusion caused by concentration differential.
Besides, the fluid revolves around a low-pressure point and runs along a helical line in swirls, where the fluid micromasses are teared into many thin and long slices by the normal and tangential force from pressure difference and viscous force. The mixture slices have a larger contact area between two micromasses, so it attains stronger molecule diffusion and higher mixing efficiency.
As the colliding process goes, the high-pressure zones appear at the converging zones in the central region due to the anti-force caused by colliding. Meanwhile, the obstacles do not obstruct the fluid any more after the fluid flow across the middle cross-section of obstacles. So, there are some low-pressure zones close to the back slopes. Then, the acceleration vectors point from the central region to surroundings. The acceleration vectors are against the velocity vectors resulting that the torques appear because not all acceleration vectors are on the same lines with velocity vectors. The torques cause swirls. Thus, in the paragraph after the middle cross-section of obstacles, the mixing behavior is the development of swirls as well as the collisions between the boundaries of different swirls.
According to the above design principles, there are many ways to design micro reacting pipes, however, only a kind of internal structure was discussed in this paper. As the cross-section of other micro reacting pipes in Figure 13, there are other developing directions of the shape of internal structure, such as obstacles with curved face or asymmetrical structure. The internal channel structure of the micro reacting pipe has a great influence on the mixing efficiency, and the appearance of the AM technology provides a wider optimization space for the design and manufacture of the micro reacting pipe, so it is worthy of further study by researchers in various fields. The wall thickness can influence the heat transfer efficiency, but during this simple chemical experiment, it can be ignored because of the high-impact material.
In addition, the structure designed in this paper requires the micro reacting pipe to be formed vertically to the substrate, and the most metal additive manufacturing machine has relatively small forming height. But the ratio of length to width of the micro reacting pipe is very large in industry, so it needs a lot of molding time, which should also be considered as an important factor in the design of micro reacting pipes in the future.

5. Conclusions

Three design criteria for the micro reacting pipe with a 3D inner structure in one piece for AM were proposed. Through CFD simulation, the optimization design of the micro reacting pipe was done with constraints of laser selective melting technology. The influence of the internal structure on fluid flow and mixing efficiency were discussed, including splitting-collision mechanism. Through the corrosion resistance test and compression resistance test, the suitable metal material and forming parameters in the industrial application were found out. Finally, the simulation results were verified by using the Villermaux–Dushman parallel competition reaction system in the practical experiment. Results showed that the mixing efficiency of the micro reacting pipe increased by 56.6%, the optimal determining size of the micro reacting pipe was 0.2 mm, and results of the simulation and practical experiment are consistent with each other.

Author Contributions

Conceptualization, X.C. (Xiaomin Chen), D.W. and J.M.; methodology, data curation, X.C. (Xiaomin Chen), X.C. (Xiaojun Chen) and J.M.; software, formal analysis, X.C. (Xiaomin Chen), J.M.; validation, X.C. (Xiaomin Chen), D.W. and W.D.; writing—original draft preparation, writing—review and editing, visualization, X.C. (Xiaomin Chen); resources, supervision, project administration, funding acquisition, D.W. All authors have read and agreed to the published version of the manuscript.

Funding

This research was funded by the National Natural Science Foundation of China (grant number:51775196); Guangdong Province Science and Technology Project (grant number: 2017B090912003, 2017A050501058); High-level Personnel Special Support Plan of Guang-dong Province (grant number: 2016TQ03 × 289); Guangzhou Pearl River New Talent Project (grant number: 201710010064); the Fundamental Research Funds for the Central Universities (Project No.2018ZD30).

Conflicts of Interest

The authors declare no conflict of interest.

References

  1. Luong, J.; Hua, Y.; Gras, R.; Yang, X.; Yang, P. Post-column reaction with a 3D-printed two-stage microreactor and flame ionization detection for carbon compound independent response in fast gas chromatography. J. Chromatogr. A 2020, 1609, 460. [Google Scholar] [CrossRef] [PubMed]
  2. Lin, W. Design and Application of Microreactor: Mixing of microfluidics, 1st ed.; Chemical Industry Press: Beijing, China, 2016; pp. 16–45. [Google Scholar]
  3. Liu, Z.; Zhang, P. Applications of microreactor in chemistry and chemical engineering. Chem. Ind. Eng. Prog. 2016, 35, 10–11. [Google Scholar]
  4. McPeak, K.; Opasanont, B.; Shibata, T.; Ko, D.; Becker, M.; Chattopadhyay, S.; Bui, H.; Beebe, T.; Bunker, B.; Murray, C.; et al. Microreactor Chemical Bath Deposition of Laterally Graded Cd1−xZnxS Thin Films: A Route to High-Throughput Optimization for Photovoltaic Buffer Layers. Chem. Mater. 2013, 25, 297–306. [Google Scholar] [CrossRef]
  5. Wiles, C.; Watts, P. Recent Advances in Micro Reaction Technology. Chem. Commun. 2011, 47, 6512–6535. [Google Scholar] [CrossRef]
  6. Zhang, F.; Marre, S.; Erriguible, A. Mixing intensification under turbulent conditions in a high pressure microreactor. Chem. Eng. J. 2020, 382, 94–101. [Google Scholar] [CrossRef] [Green Version]
  7. Jeon, W.J.; Shin, C.B. Design and simulation of passive mixing in microfluidic systems with geometric variations. Chem. Eng. J. 2009, 152, 575–582. [Google Scholar] [CrossRef]
  8. Shih, T.R.; Chung, C.K. A high-efficiency planar micromixer with convection and diffusion mixing over a wide Reynolds number range. Microfluid. Nanofluidics 2008, 5, 175–183. [Google Scholar] [CrossRef]
  9. Shi, H.; Nie, K.; Dong, B.; Chao, L.; Gao, F.; Ma, M.; Long, M.; Liu, Z. Mixing enhancement via a serpentine micromixer for real-time activation of carboxyl. Chem. Eng. J. 2020, 392. [Google Scholar] [CrossRef]
  10. Liu, Y.J.; Chen, P.Y.; Yang, J.Y.; Tsou, C.; Lee, Y.H.; Baldeck, P.L.; Lin, C.L. Three-Dimensional Passive Micromixer Fabricated by Two-Photon Polymerization. Sens. Mater. 2014, 26, 39–44. [Google Scholar]
  11. Schirmer, M.; Uhlemann, J.; Rebenklau, L.; Bauer, T.; Wolter, K.J. 3D-microfluidic reactor in LTCC. In Proceedings of the 2008 31st International Spring Seminar on Electronics Technology, Budapest, Hungary, 7–11 May 2008. [Google Scholar]
  12. Bhivgade, U.; Maralla, Y.; Bhanvase, B.A.; Sonawane, S. Hydrodynamic, Mass Transfer and RTD Studies of Fluid Flow in a Spiral Microreactor. J. Inst. Eng. (India) Ser. E 2019, 100, 139–146. [Google Scholar] [CrossRef]
  13. Naher, S.; Orpen, D.; Brabazon, D.; Poulsen, C.R.; Morshed, M.M. Effect of micro-channel geometry on fluid flow and mixing. Simul. Model. Pract. Theory 2011, 19, 1088–1095. [Google Scholar] [CrossRef]
  14. Ansari, M.A.; Kim, K.Y.; Anwar, K.; Kim, S.M. A novel passive micromixer based on unbalanced splits and collisions of fluid streams. J. Micromech. Microeng. 2010, 20, 1–10. [Google Scholar] [CrossRef] [Green Version]
  15. Wu, Z.; Chen, X. A novel design for 3D passive micromixer based on Cantor fractal structure. Microsyst. Technol. 2018, 5, 1–12. [Google Scholar] [CrossRef]
  16. Chen, X.; Li, T. A novel passive micromixer designed by applying an optimization algorithm to the zigzag microchannel. Chem. Eng. J. 2016, 313, 1406–1414. [Google Scholar] [CrossRef]
  17. Frazier, W.E. Metal Additive Manufacturing: A Review. J. Mater. Eng. Perform. 2014, 23, 1917–1928. [Google Scholar] [CrossRef]
  18. Wong, K.V.; Hernandez, A. A Review of Additive Manufacturing. ISRN Mech. Eng. 2012, 1–10. [Google Scholar] [CrossRef] [Green Version]
  19. Gu, D.D.; Meiners, W.; Wissenbach, K.; Poprawe, R. Laser additive manufacturing of metallic components: Materials, processes and mechanisms. Int. Mater. Rev. 2012, 57, 133–164. [Google Scholar] [CrossRef]
  20. Okafor, O.; Weilhard, A.; Fernandes, J.A.; Karjalainen, E.; Goodridgea, R.; Sans, V. Advanced reactor engineering with 3D printing for the continuous-flow synthesis of silver nanoparticles. React. Chem. Eng. 2017, 2, 129–136. [Google Scholar] [CrossRef]
  21. Fornells, E.; Murray, E.; Waheed, S.; Morrin, A.; Diamond, D.; Paull, B.; Breadmore, M. Integrated 3D printed heaters for microfluidic applications: Ammonium analysis within environmental water. Anal. Chim. Acta 2020, 1098, 94–101. [Google Scholar] [CrossRef]
  22. Meng, J.; Loh, N.H.; Fu, G.; Tor, S.B.; Tay, B.Y. Replication and characterization of 316L stainless steel micro-mixer by micro powder injection molding. J. Alloys Compd. 2010, 496, 293–299. [Google Scholar] [CrossRef]
  23. Liu, J.; Gao, Y.; Fan, Y.; Zhou, W. Fabrication of porous metal by selective laser melting as catalyst support for hydrogen production microreactor. Int. J. Hydrog. Energy 2020, 45, 10–22. [Google Scholar] [CrossRef]
  24. Kathryn, L.K.; Karen, A.T. Experimental Investigation of Numerically Optimized Wavy Microchannels Created Through Additive Manufacturing. J. Turbomach. 2018, 140, 021002. [Google Scholar]
  25. Santana, H.S.; da Silva, A.G.P.; Lopes, M.G.M.; Rodrigues, A.C.; Taranto, O.P.; Silva, J.L. Computational methodology for the development of microdevices and microreactors with ANSYS CFX. MethodsX 2020, 7, 82–103. [Google Scholar] [CrossRef] [PubMed]
  26. Jacob, C.S.; Curtis, K.S.; Karen, A.T.; Dominic, J.M. Build Direction Effects on Microchannel Tolerance and Surface Roughness. J. Mech. Des. 2015, 137, 111411. [Google Scholar]
  27. Investigation of crystal growth mechanism during selective laser melting and mechanical property characterization of 316L stainless steel parts. Mater. Des. 2016, 100, 291–299. [CrossRef]
  28. Wang, D.; Yang, Y.Q.; Liu, R.C.; Xiao, D.M.; Sun, J.F. Study on the designing rules and processability of porous structure based on selective laser melting (SLM). J. Mater. Process. Technol. 2013, 213, 1734–1742. [Google Scholar] [CrossRef]
  29. Launder, B.E.; Spalding, D.B. The numerical computation of turbulent flows. Comput. Methods Appl. Mech. Eng. 1974, 32, 269–289. [Google Scholar] [CrossRef]
  30. Fluent Inc. Fluent 6.0 Users Guide; Fluent Inc.: Lebanon, NH, USA, 2001. [Google Scholar]
  31. Ansari, M.A.; Kim, K. A numerical study of mixing in a microchannel with circular mixing chambers. AICHE J. 2009, 55, 2217–2225. [Google Scholar] [CrossRef]
  32. Guichardon, P.; Falk, L. Characterisation of micromixing efficiency by the iodide–iodate reaction system. Part, I. Experimental procedure. Chem. Eng. Sci. 2000, 55, 4233–4243. [Google Scholar] [CrossRef]
  33. Palmer, D.A.; Ramette, R.W.; Mesmer, R.E. Triodide ion formation equilibrium and activity coefficients in aqueous solution. J. Solut. Chem. 1984, 13, 673–683. [Google Scholar] [CrossRef]
  34. Commoner, B.; Lipkin, D. The Application of the Beer-Lambert Law to Optically Anisotropic Systems. Science 1949, 110, 41–43. [Google Scholar] [CrossRef] [PubMed]
  35. Foumier, M.C.; Falk, L.; Villermaux, J. A New Parallel Competing Reaction System for Assessing Micromixing Efficiency-Experimental Approach. Chem. Eng. Sci. 1996, 51, 5053–5064. [Google Scholar]
  36. Kjäldman, L.; Brink, A.; Hupa, M. Micro Mixing Time in the Eddy Dissipation Concept. Combust. Sci. Technol. 2000, 154, 207–227. [Google Scholar] [CrossRef]
  37. Hessel, V.; Löwe, H.; Schönfeld, F. Micromixers-a review on passive and active mixing principles. Chem. Eng. Sci. 2005, 60, 2479–2501. [Google Scholar] [CrossRef]
  38. Jiang, F.; Drese, K.S.; Hardt, S.; Küpper, M.; Schönfeld, F. Helical flows and chaotic mixing in curved micro channels. AICHE J. 2004, 50, 2297–2305. [Google Scholar] [CrossRef]
  39. Commenge, J.M.; Laurent, F. Villermaux-Dushman protocol for experimental characterization of micromixers. Chem. Eng. Process. Process. Intensif. 2011, 50, 979–990. [Google Scholar] [CrossRef]
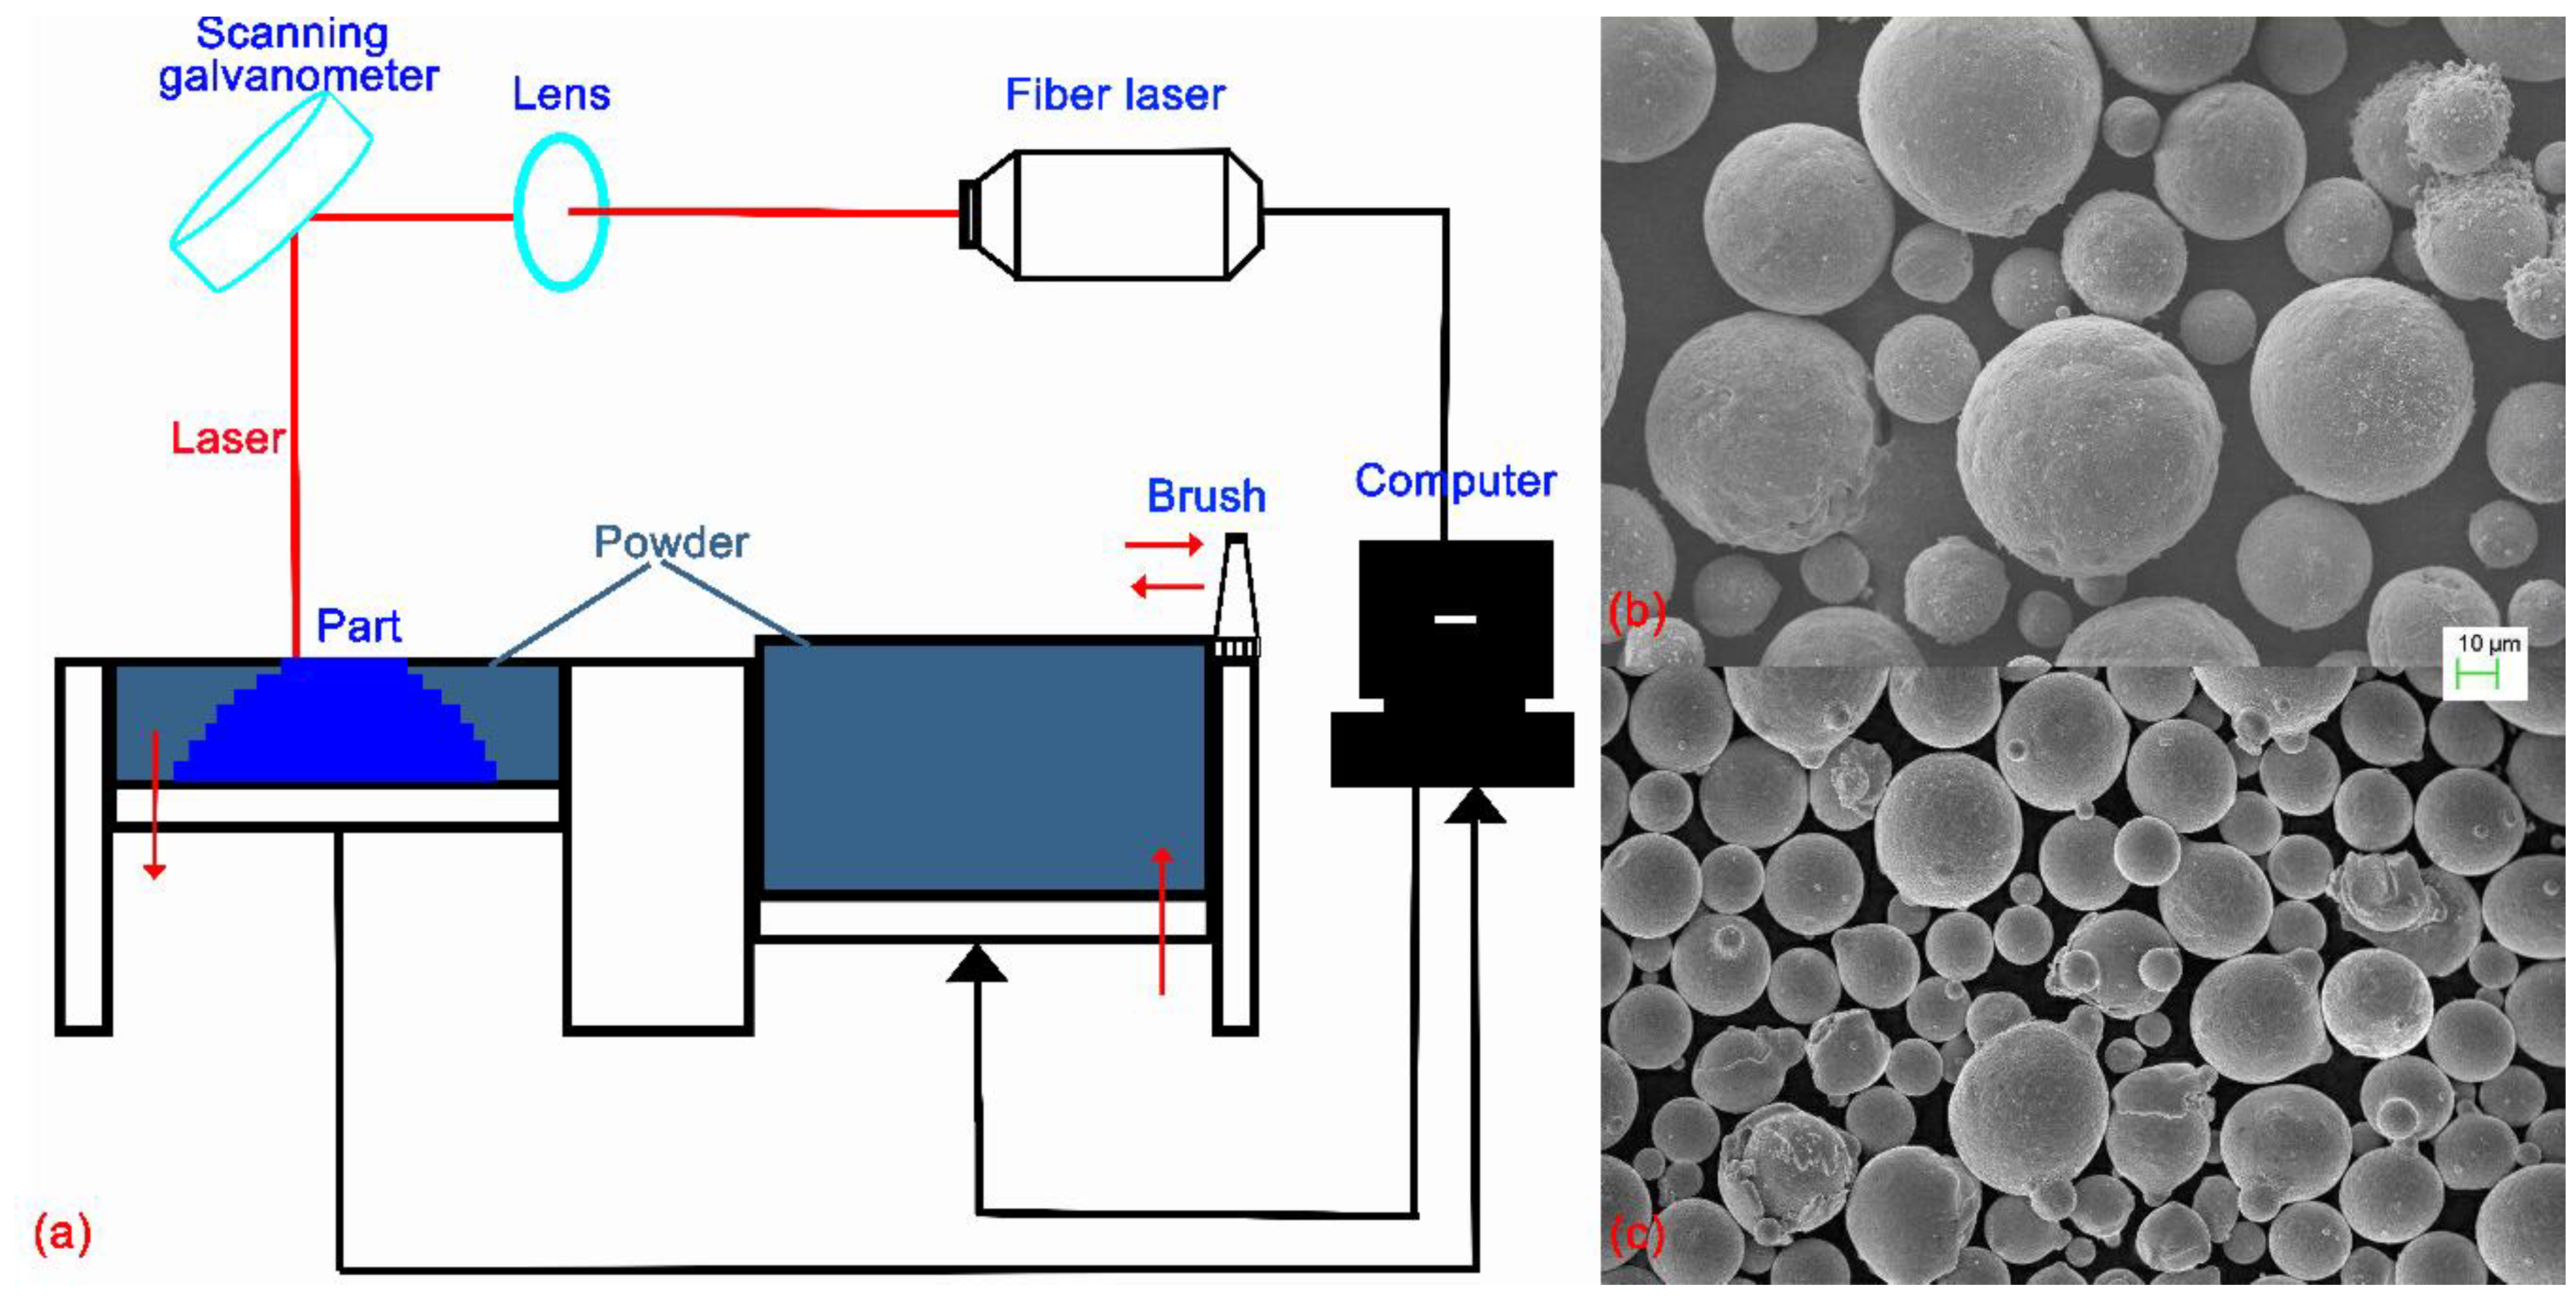
Figure 1. (a) The principle of L-PBF process; (b) The micromorphology images of 316LSS powder; (c) The micromorphology images of IN718 powder.
Applsci 10 03779 g001
Figure 2. The flow chart of the research: (a) overall process; (b) test platform model.
Applsci 10 03779 g002
Figure 3. The internal structure designed for the reaction pipe: (a) the isometric view; (b) the elevation view.
Applsci 10 03779 g003
Figure 4. Flow field model in simulation: (a) whole reacting pipe model; (b) shape of the cross-section.
Applsci 10 03779 g004
Figure 5. Selective laser melting of the micro reacting pipe and complex inner structure: (a,b) as-built micro reacting pipes; (c) the inner structure in the reacting pipe.
Applsci 10 03779 g005
Figure 6. Welded micro reacting pipe before the micromixedness testing.
Applsci 10 03779 g006
Figure 7. Micromixedness ratio of the micro reacting pipe with different determining size.
Applsci 10 03779 g007
Figure 8. Variation of the intensity of segregation with mixing time (Is = 0 represents completely homogeneous mixing).
Applsci 10 03779 g008
Figure 9. Mixing index and diffusion types in the reacting pipe: (a) mixing index of the micro reacting pipe with different determining size; (b) interaction of free diffusion and convection diffusion.
Applsci 10 03779 g009
Figure 10. Velocity vector diagram of different conditions: (a) velocity vector diagram of the free channel (axial); (b) watershed model of the unobstructed micro reacting pipe; (c) velocity vector diagram with obstruction (axial), (d,e) velocity vector diagram of two successive obstacles (vertical axis).
Applsci 10 03779 g010
Figure 11. Comparison diagram of a variation of the mass fraction of the component and the turbulent kinetic energy along the axial direction: (a) mass fraction of the component chart without obstacles; (b) turbulent kinetic energy chart without obstacles; (c) mass fraction of the component chart with obstacles; (d) turbulent kinetic energy chart with obstacles.
Applsci 10 03779 g011
Figure 12. Scheme of splitting-collision mechanism.
Applsci 10 03779 g012
Figure 13. Cross-section of the other micro reacting pipes with different internal structure.
Applsci 10 03779 g013
Table 1. Compositions of the IN718 and 316L Stainless Steel (wt. %).
MaterialCrFeMoSiMnNiTiAlPNbNCuOC
IN71819.2017.323.170.330.2352.910.650.540.105.160.140.13--
316LSS17.5Bal2.060.860.312.06------0.090.03
Table 2. Experimental results of corrosion resistance of IN718.
IDMass before the Experiment (g)Mass after the Experiment (g)Mass Loss (%)Duration (h)Medium
Sample 19.58149.58100.004224PBr3
Sample 29.58109.58100.000024PBr3
Sample 39.58109.57530.0595243% HCl
Sample 49.57539.57370.0167243% HCl
Table 3. Experimental results of corrosion resistance of 316LSS.
IDMass before the Experiment (g)Mass after the Experiment (g)Mass Loss (%)Duration (h)Medium
Sample 15.09095.08810.05524PBr3
Sample 25.08815.0881024PBr3
Sample 35.08815.07270.3027243% HCl
Sample 45.07275.05730.3036243% HCl
Table 4. Initial concentration of the chemical constituents in the experiment.
Chemical ConstituentsInitial Concentration (mol/L)
H+0.05/0.06
IO30.00233
H3BO30.1818
I0.01167
NaOH0.0909