Optimizing Height and Spacing of Check Dam Systems for Better Grassed Channel Infiltration Capacity

 ,
,  ,
,  ,
,  ,
,  and
and 
Abstract
Featured Application
Abstract
1. Introduction
2. Materials and Methods
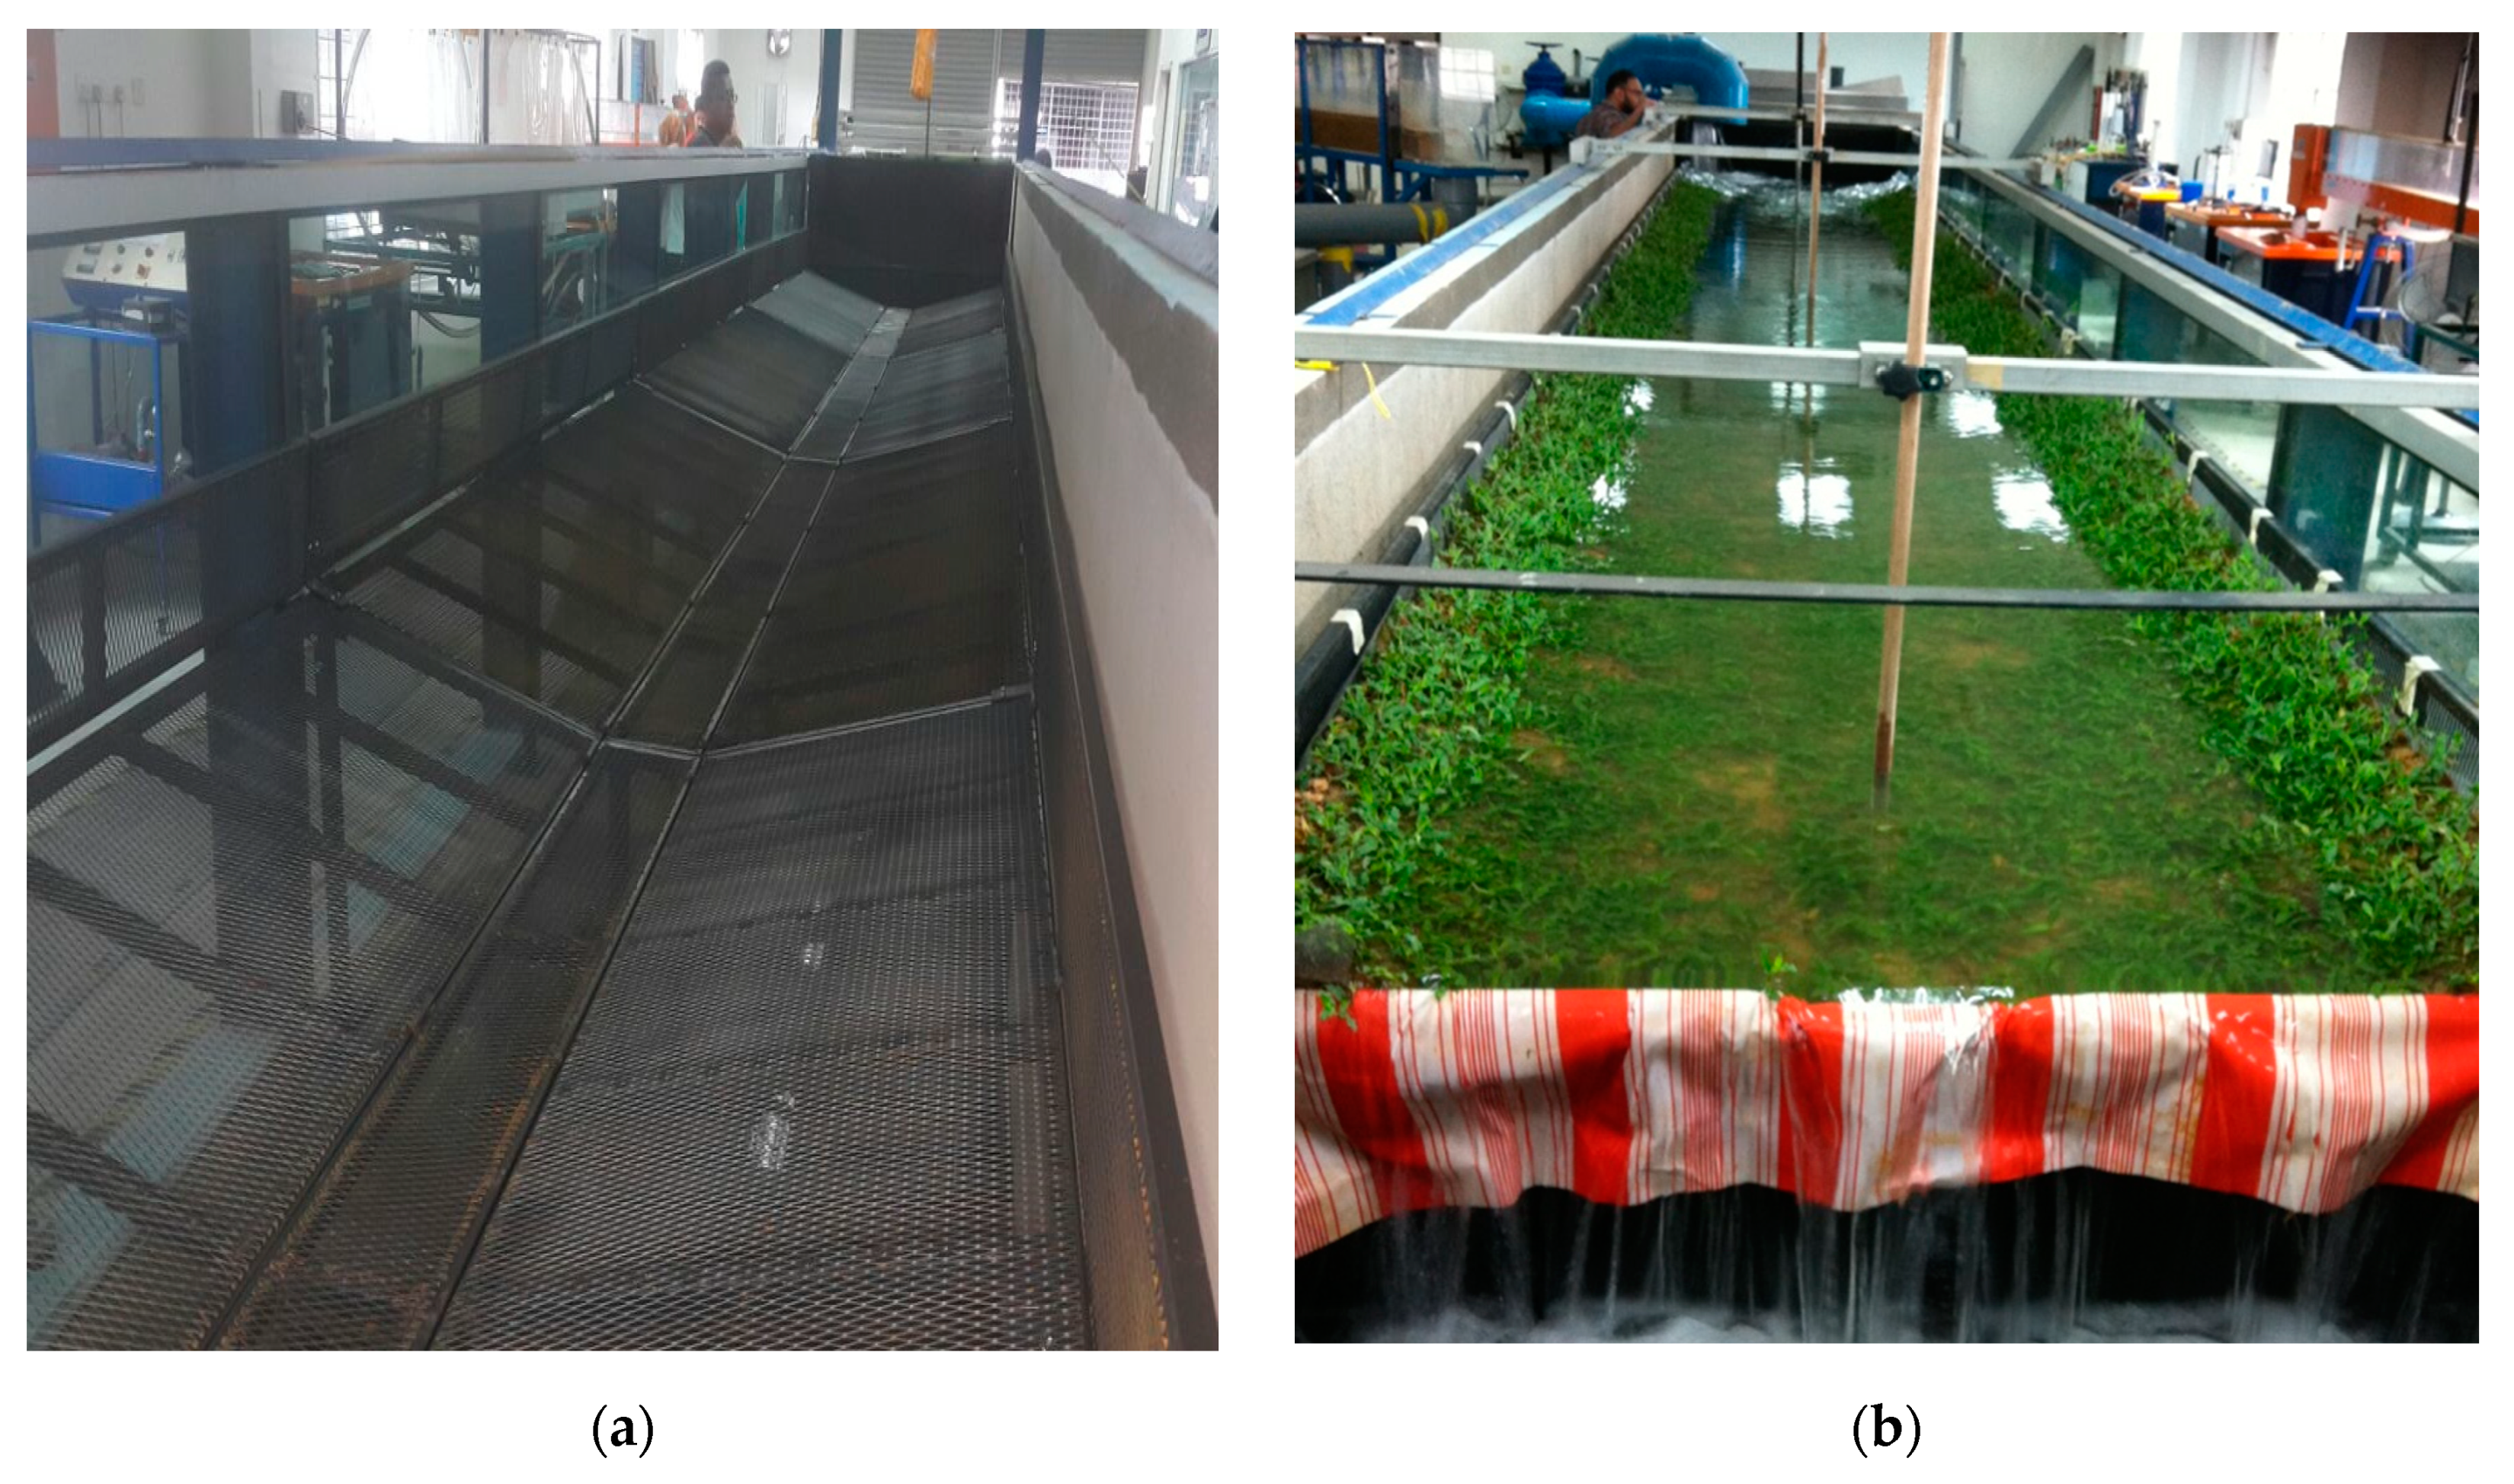
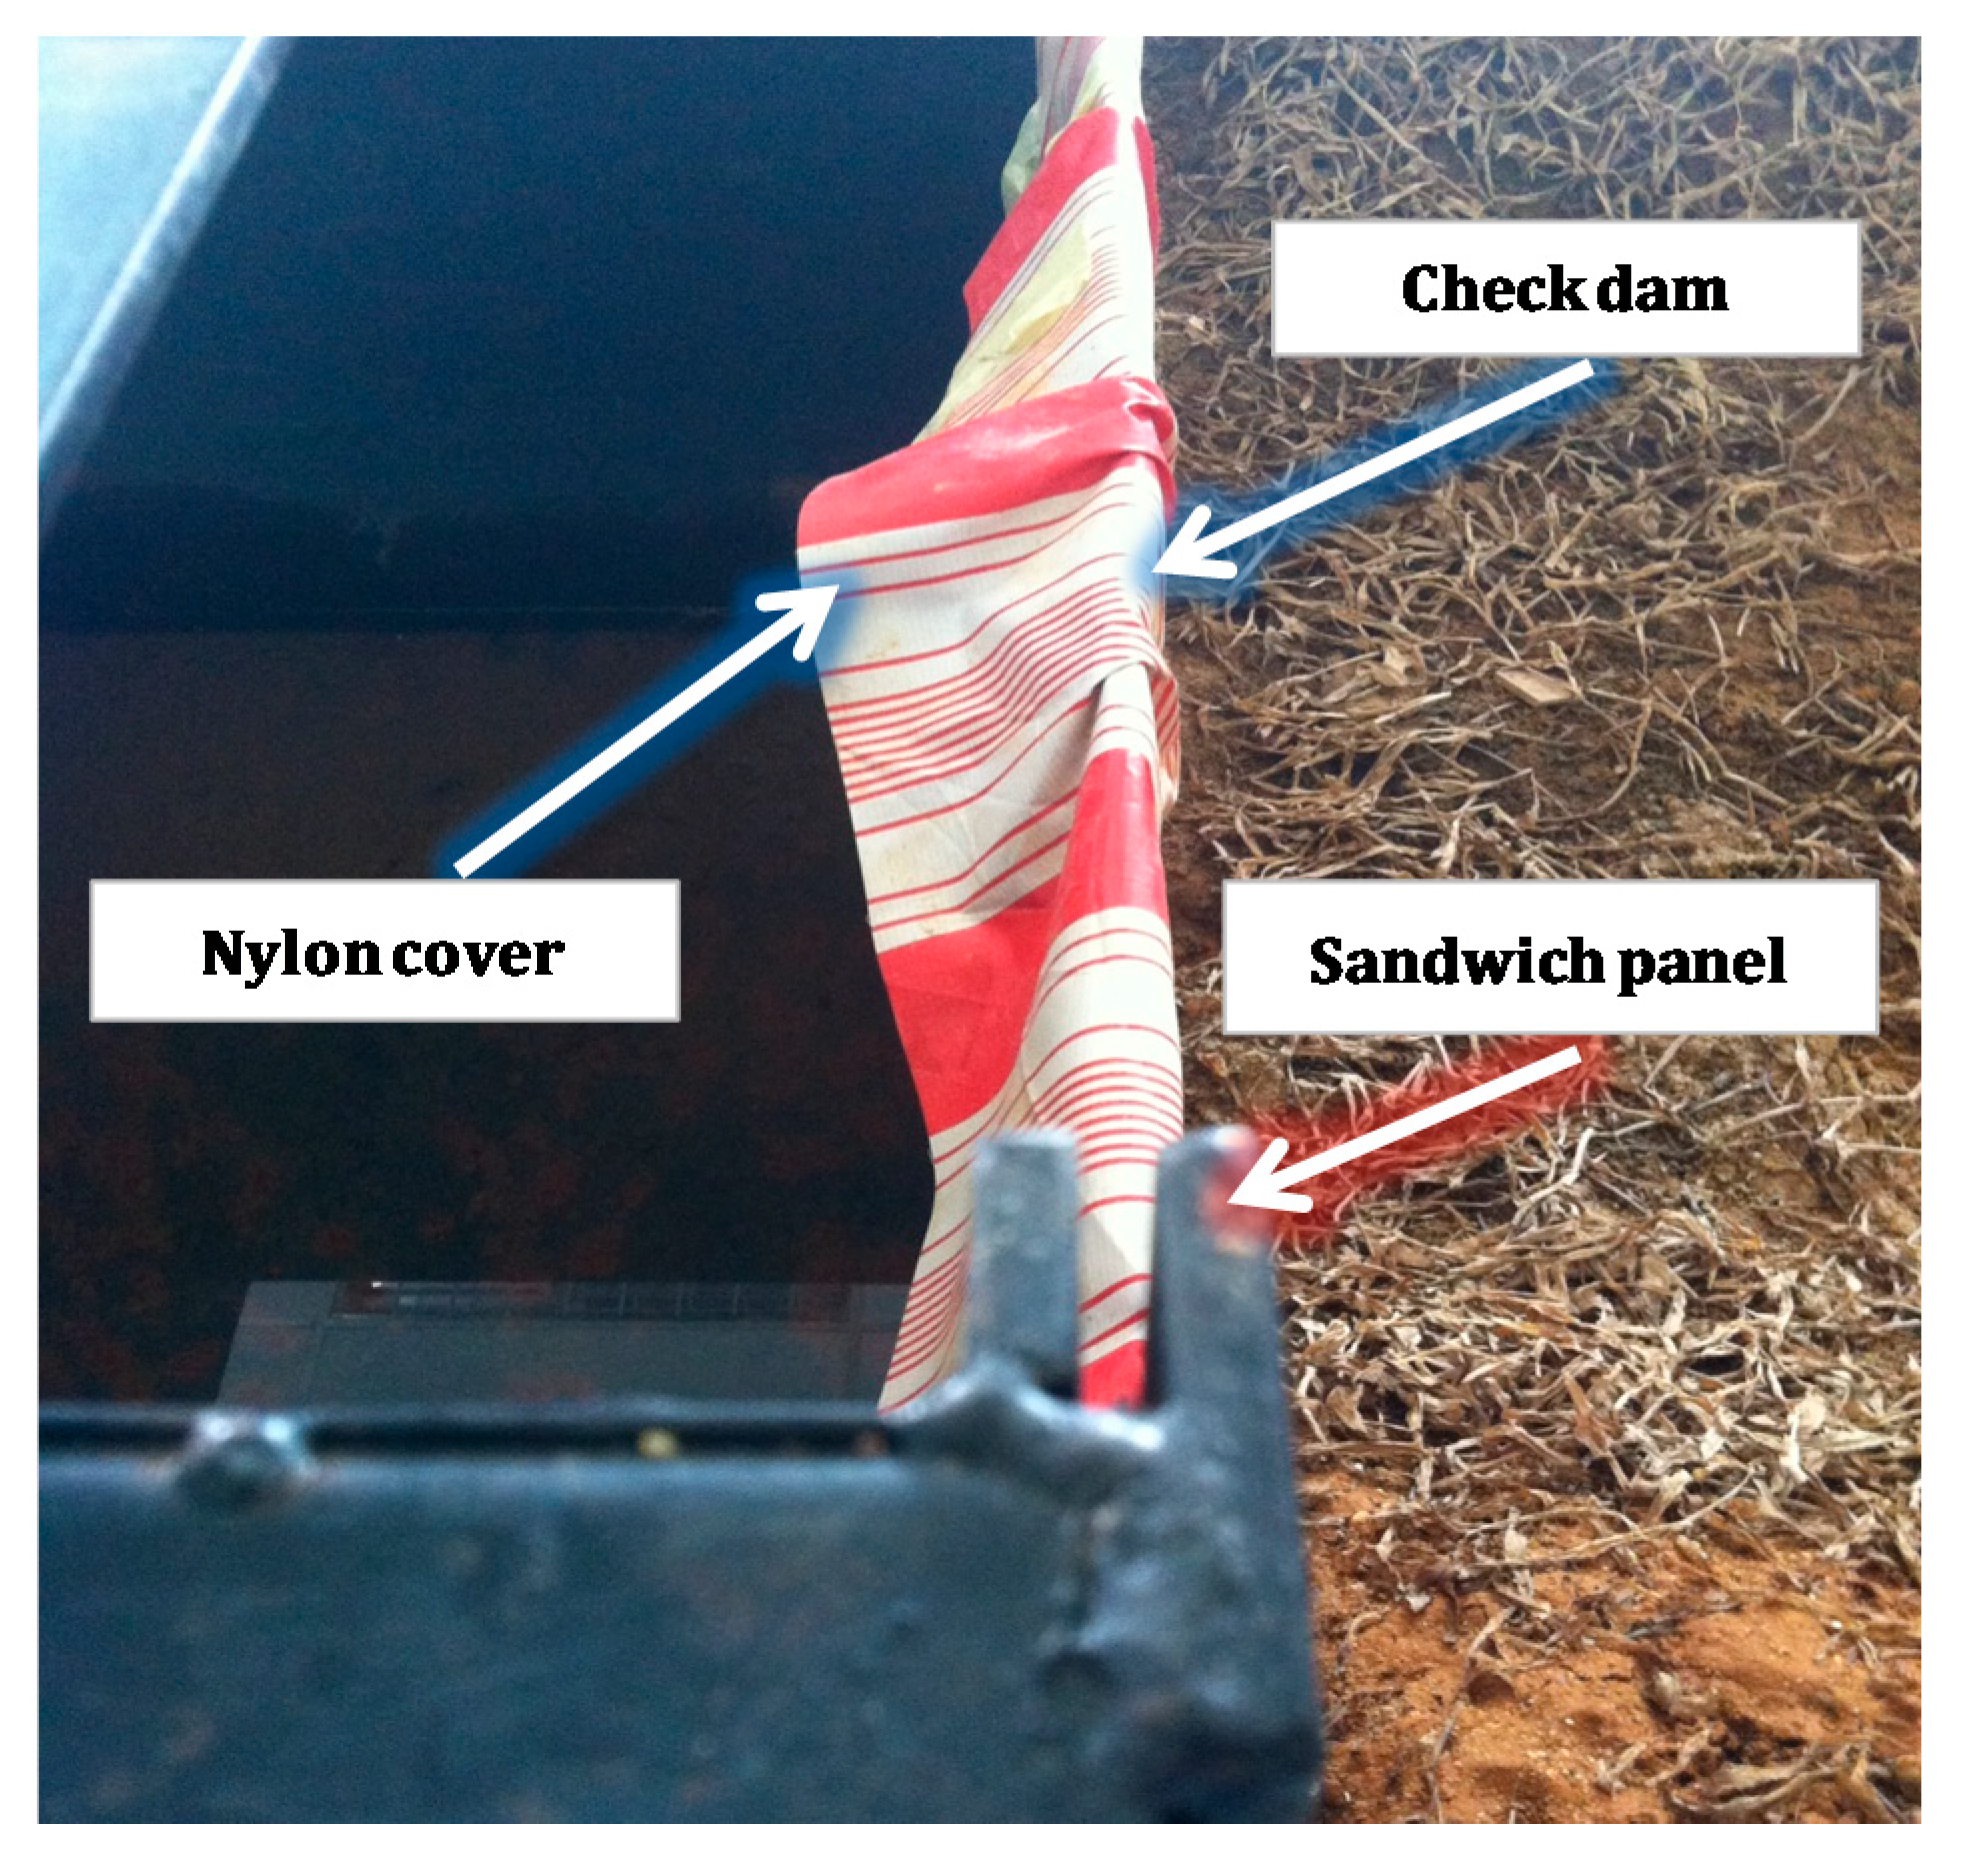
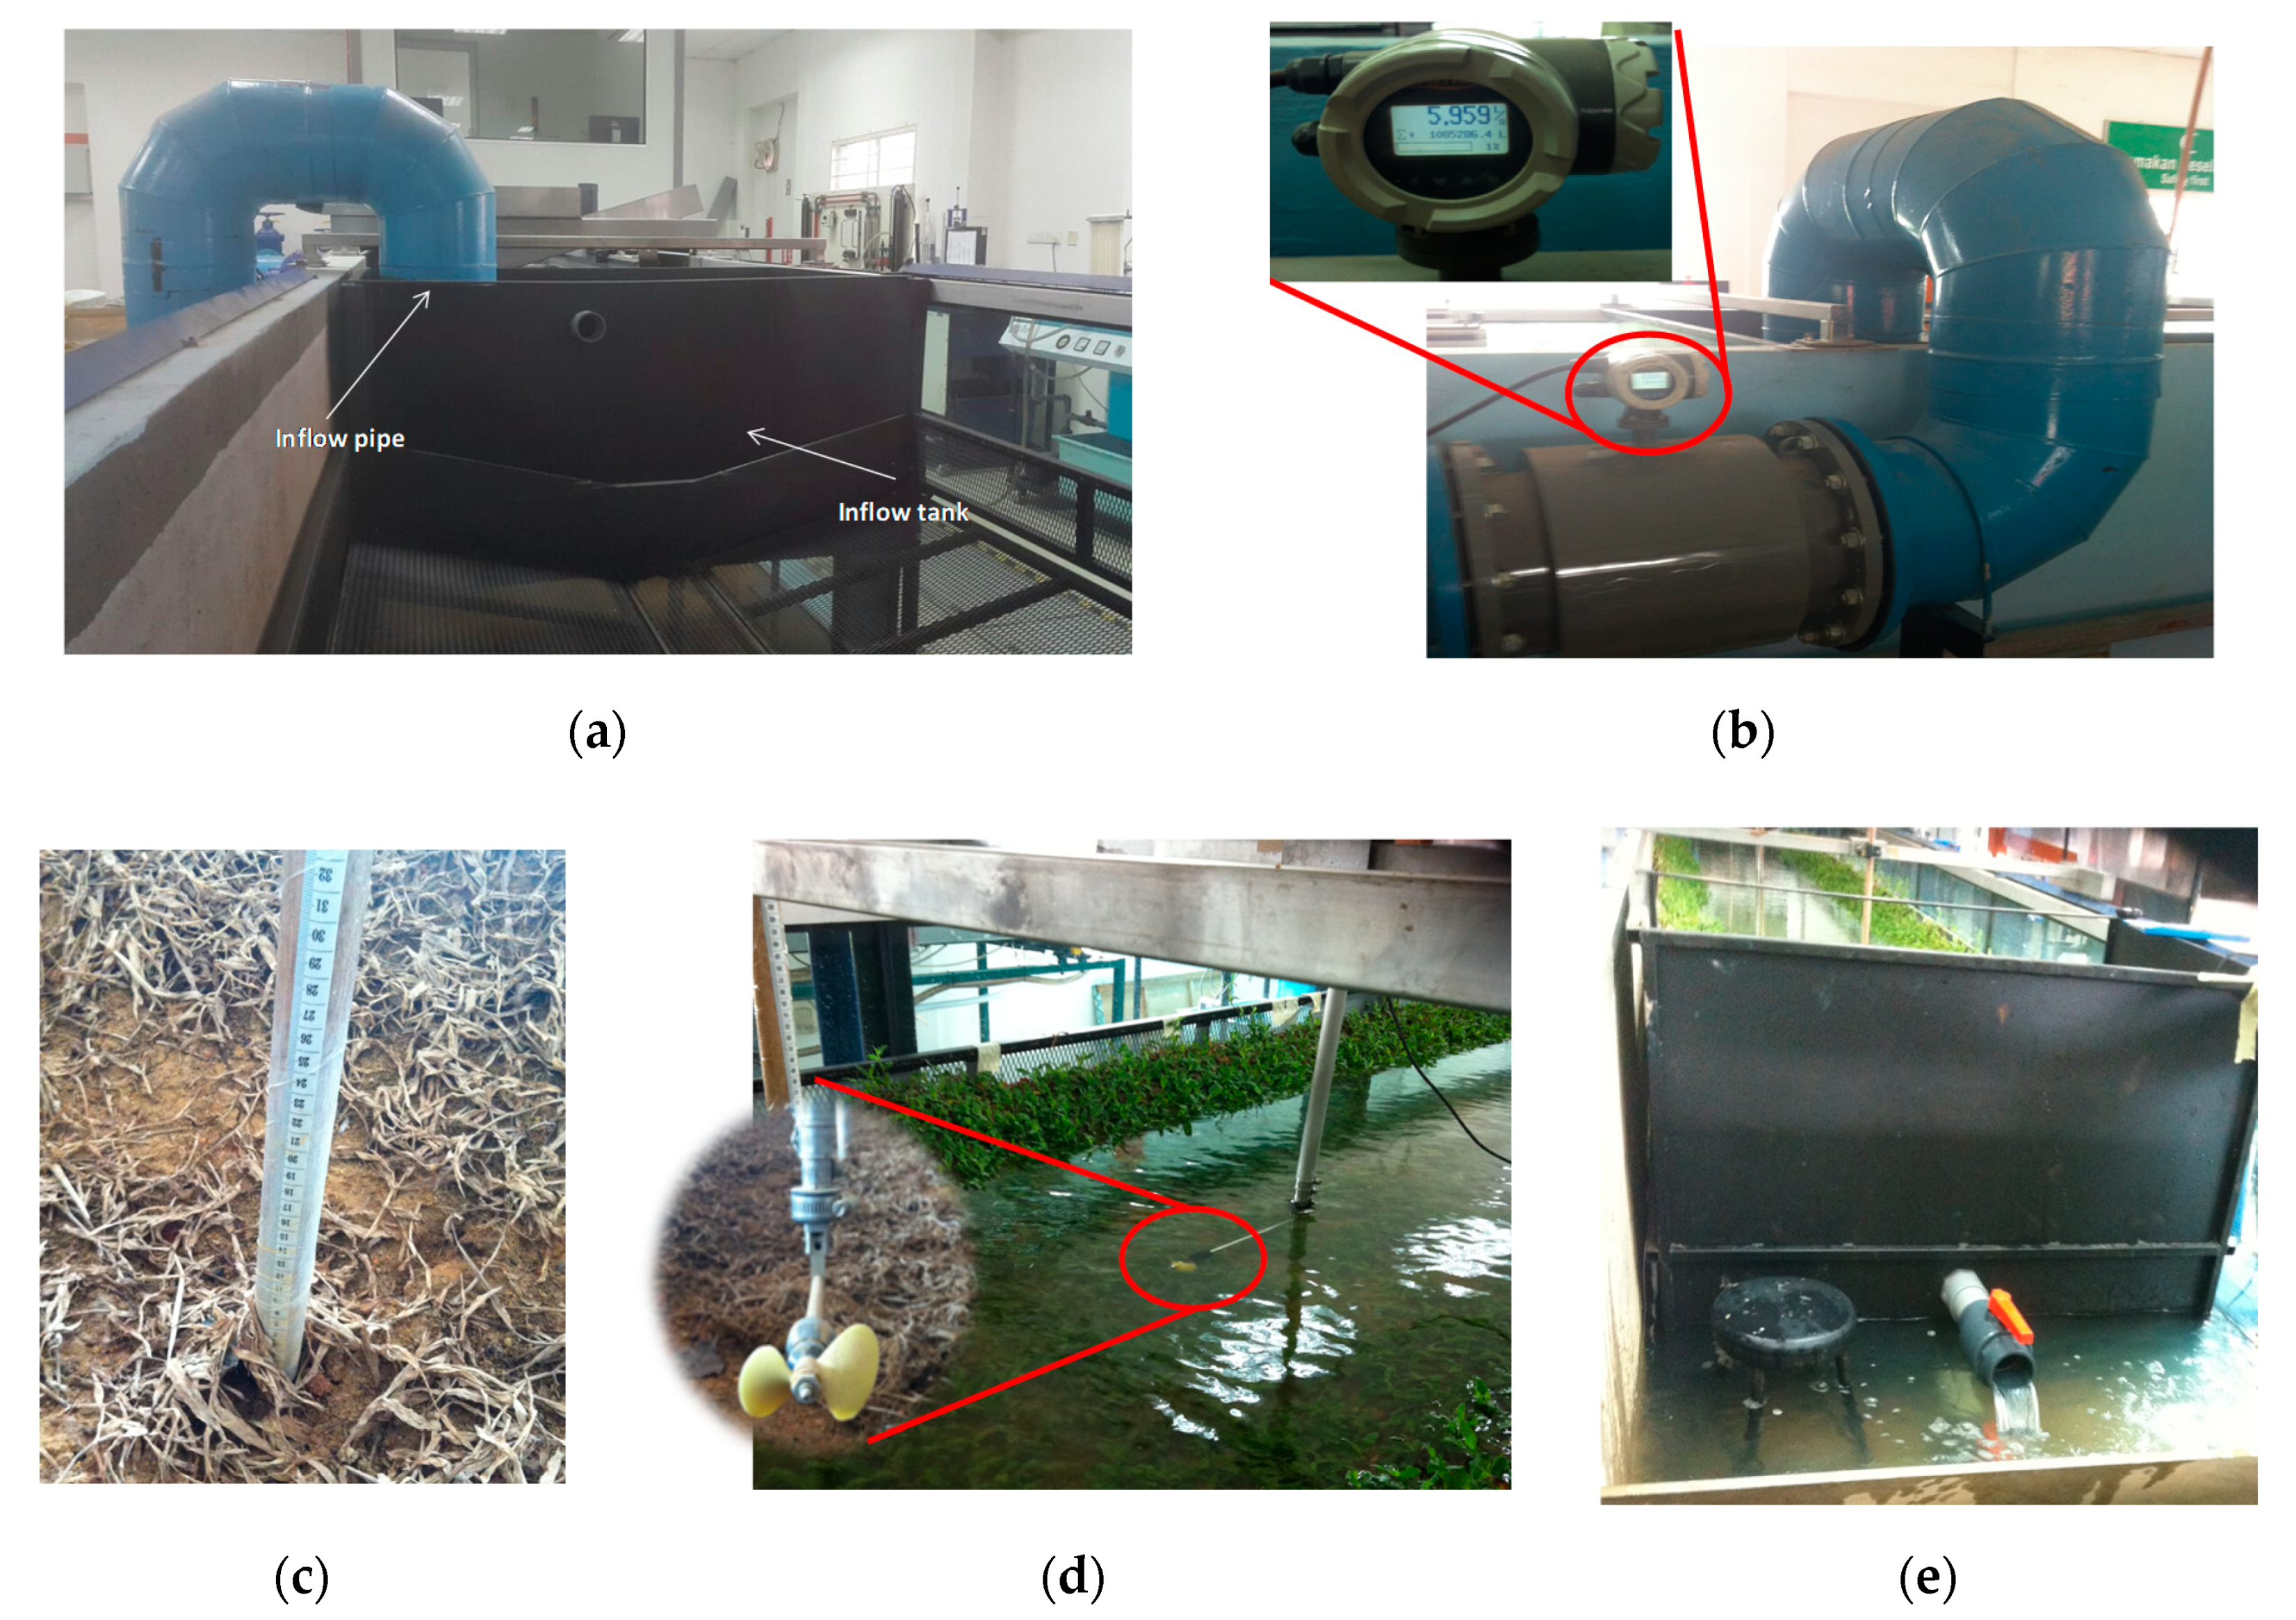
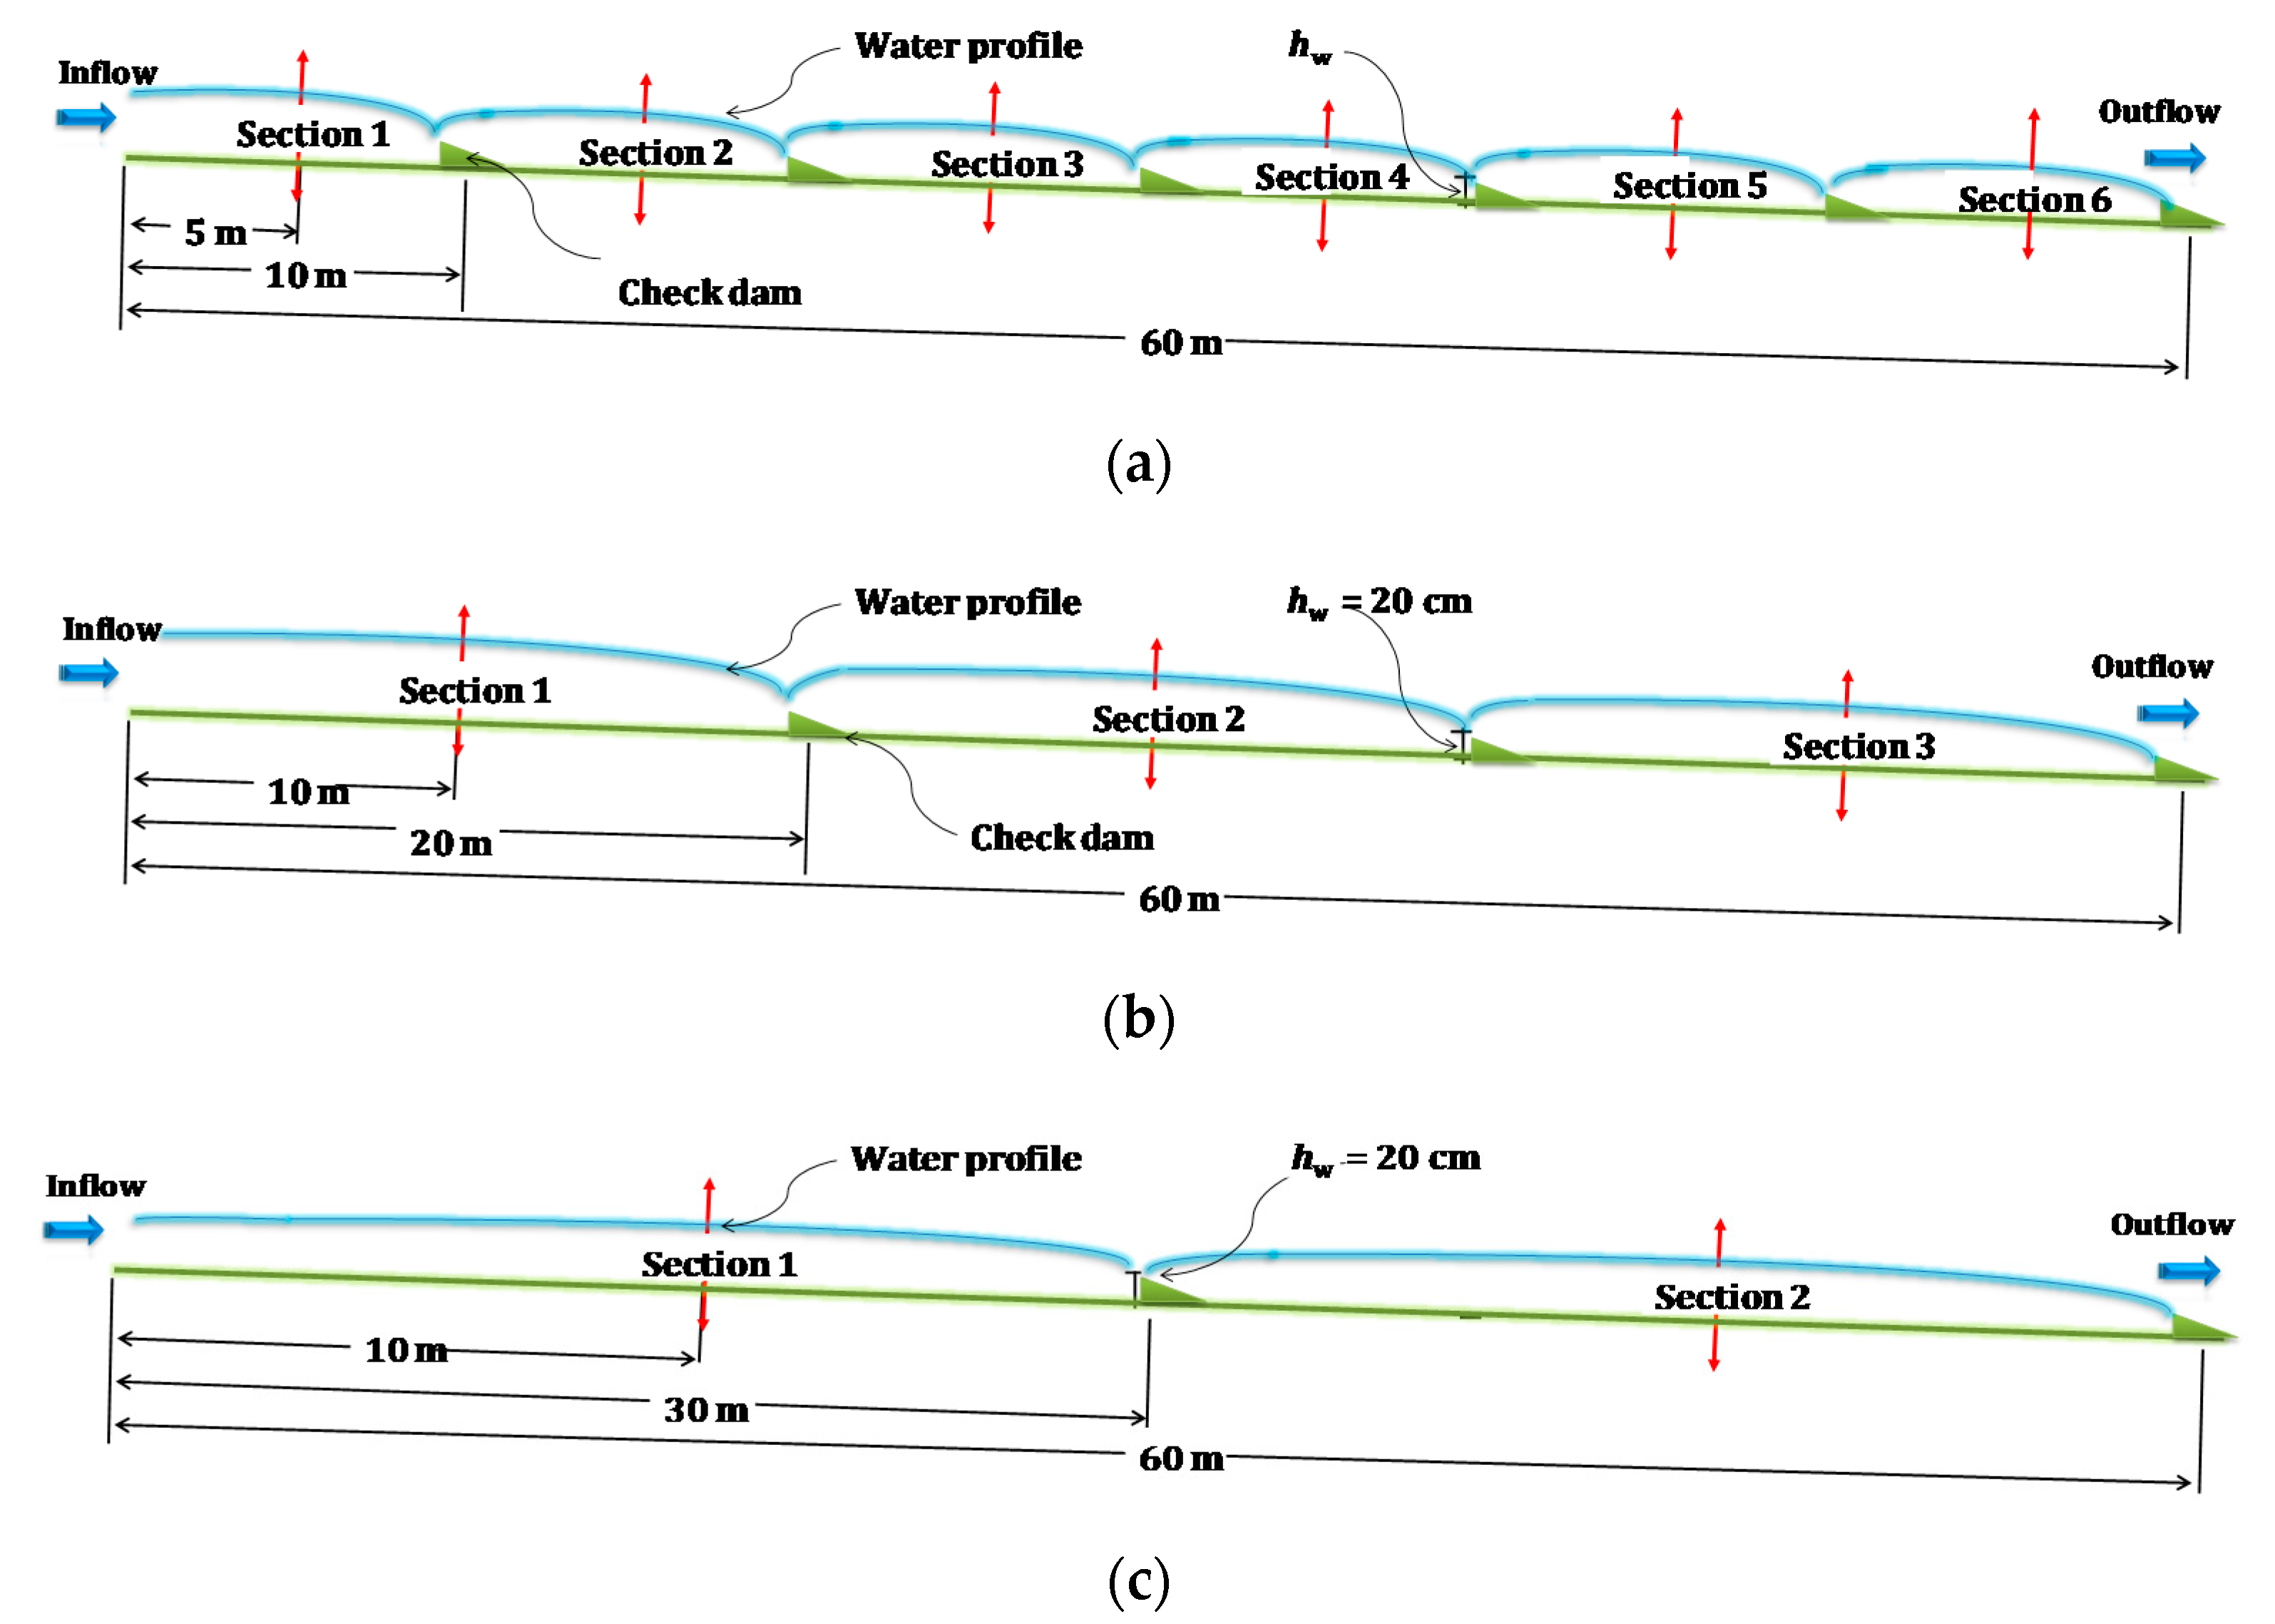
2.1. Experimental Tests
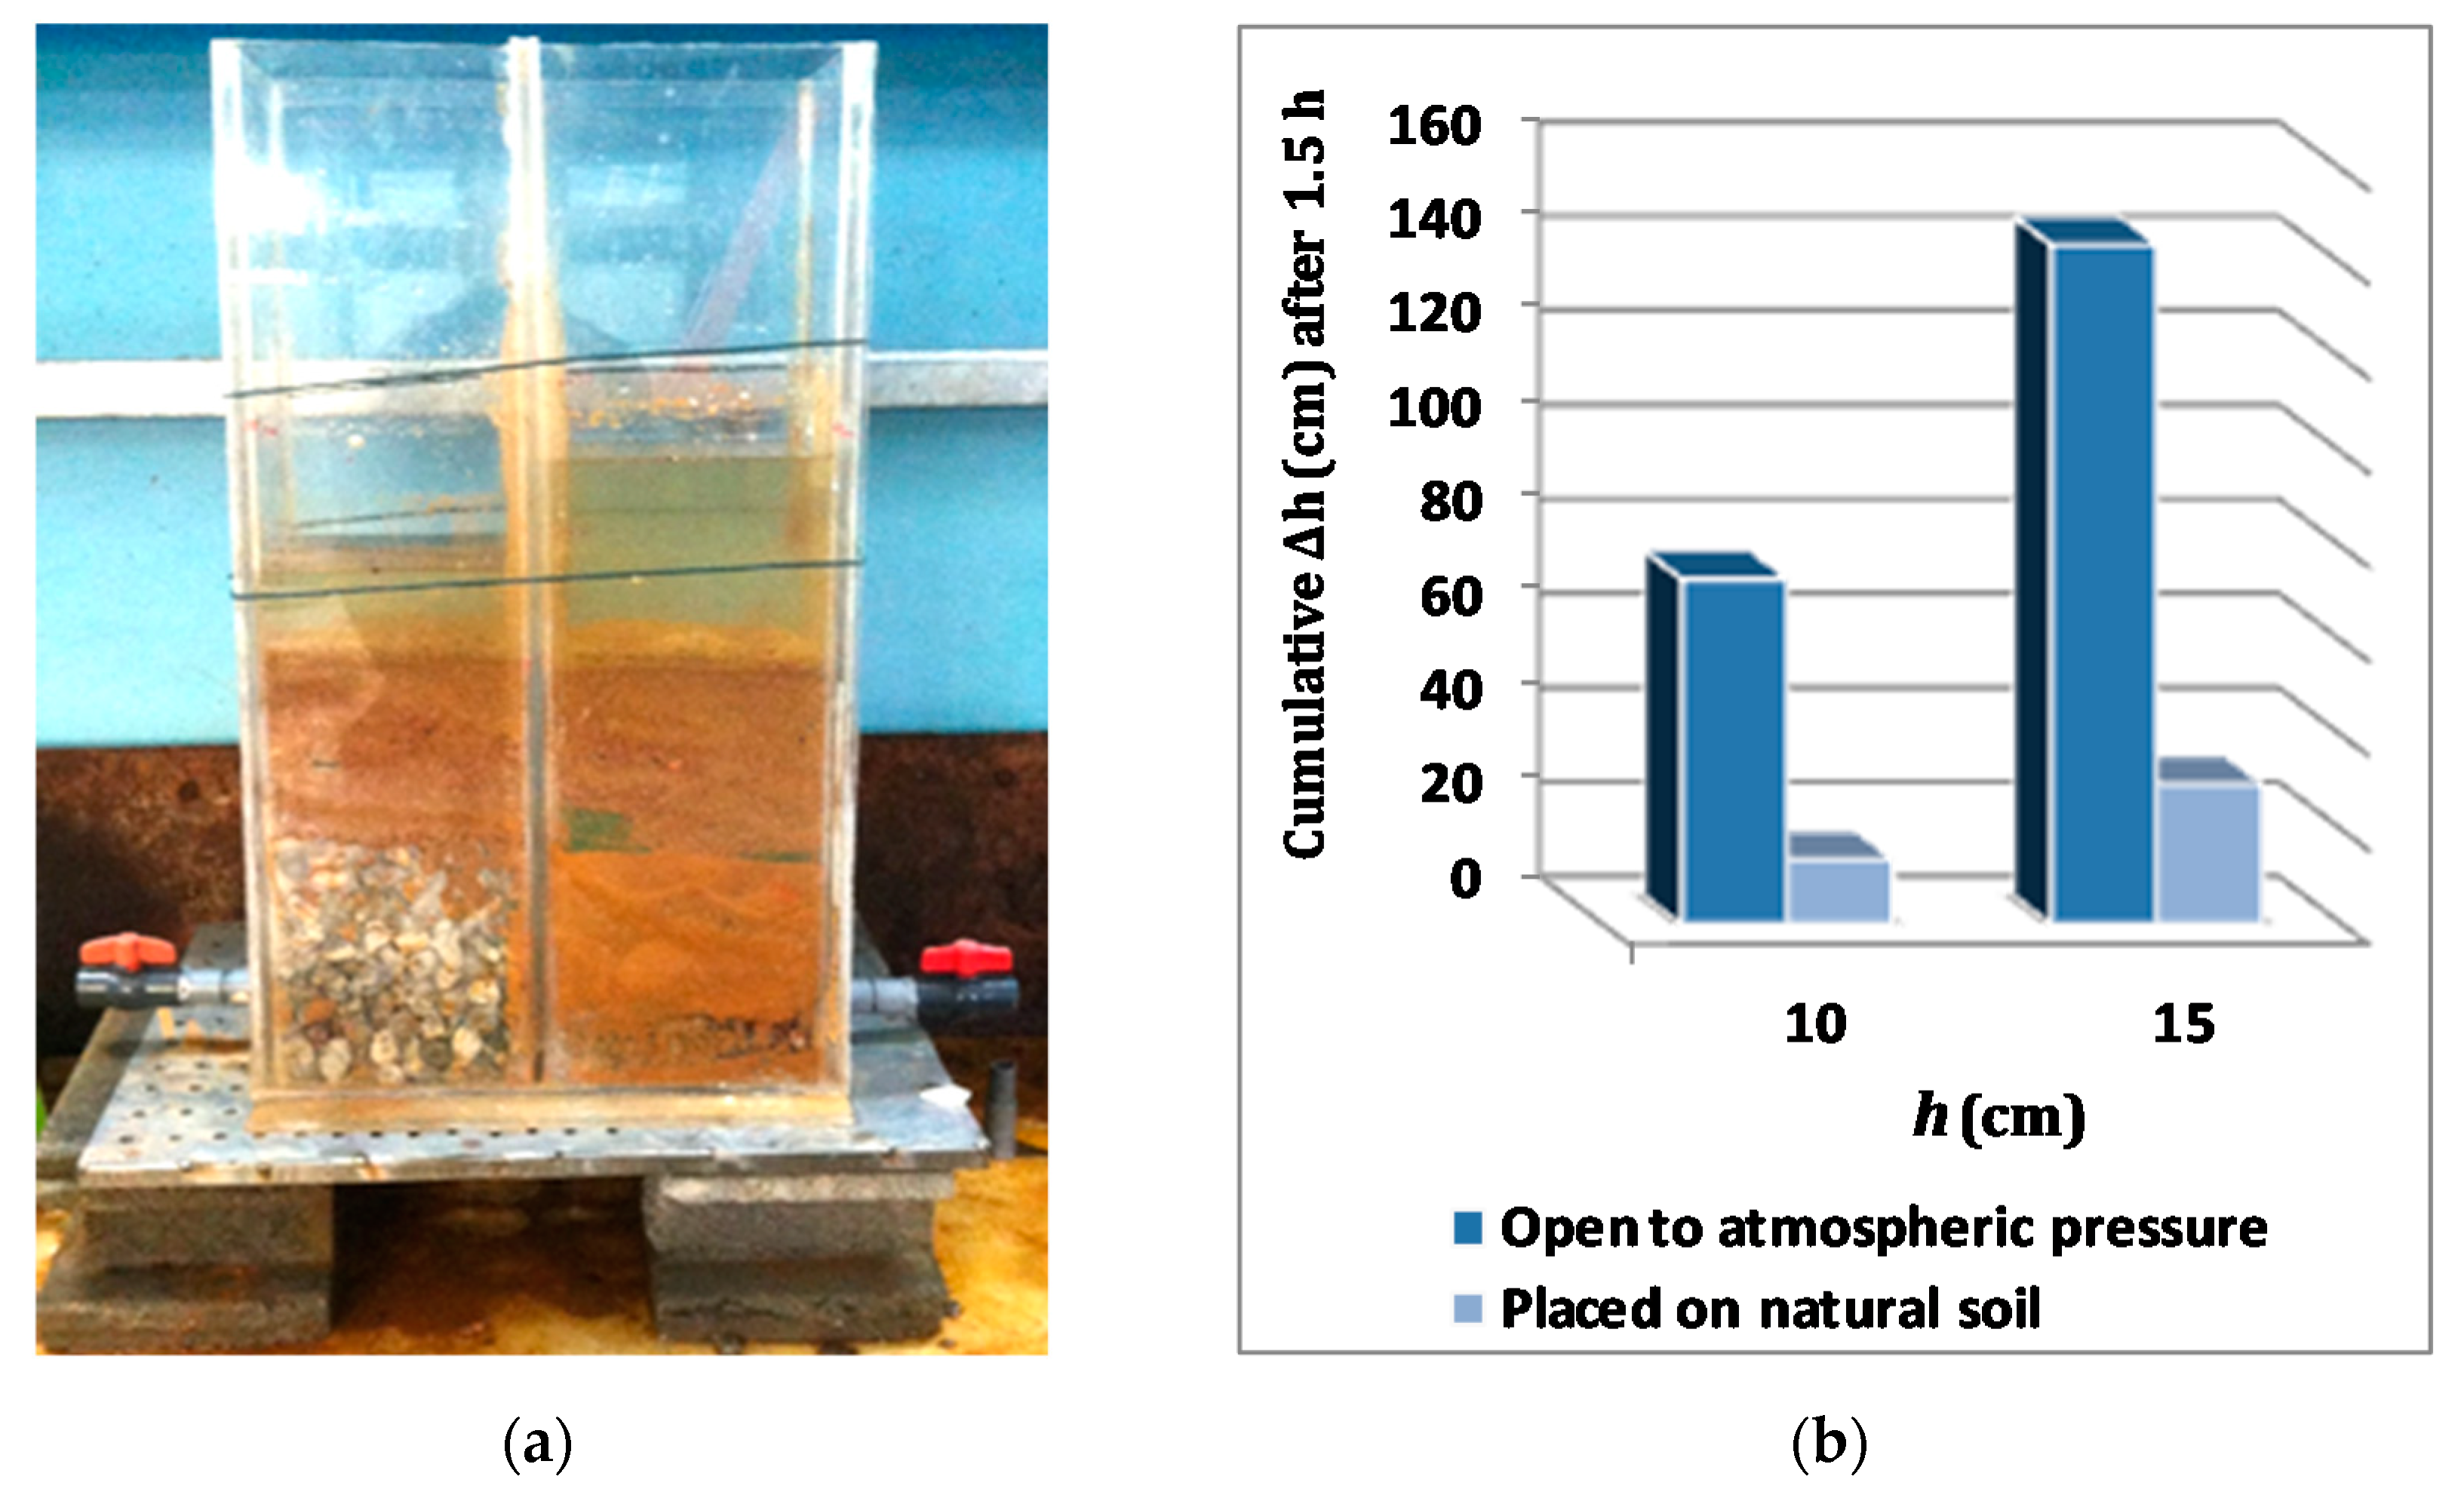
2.2. The Estimation of the Infiltration Rates
3. Results
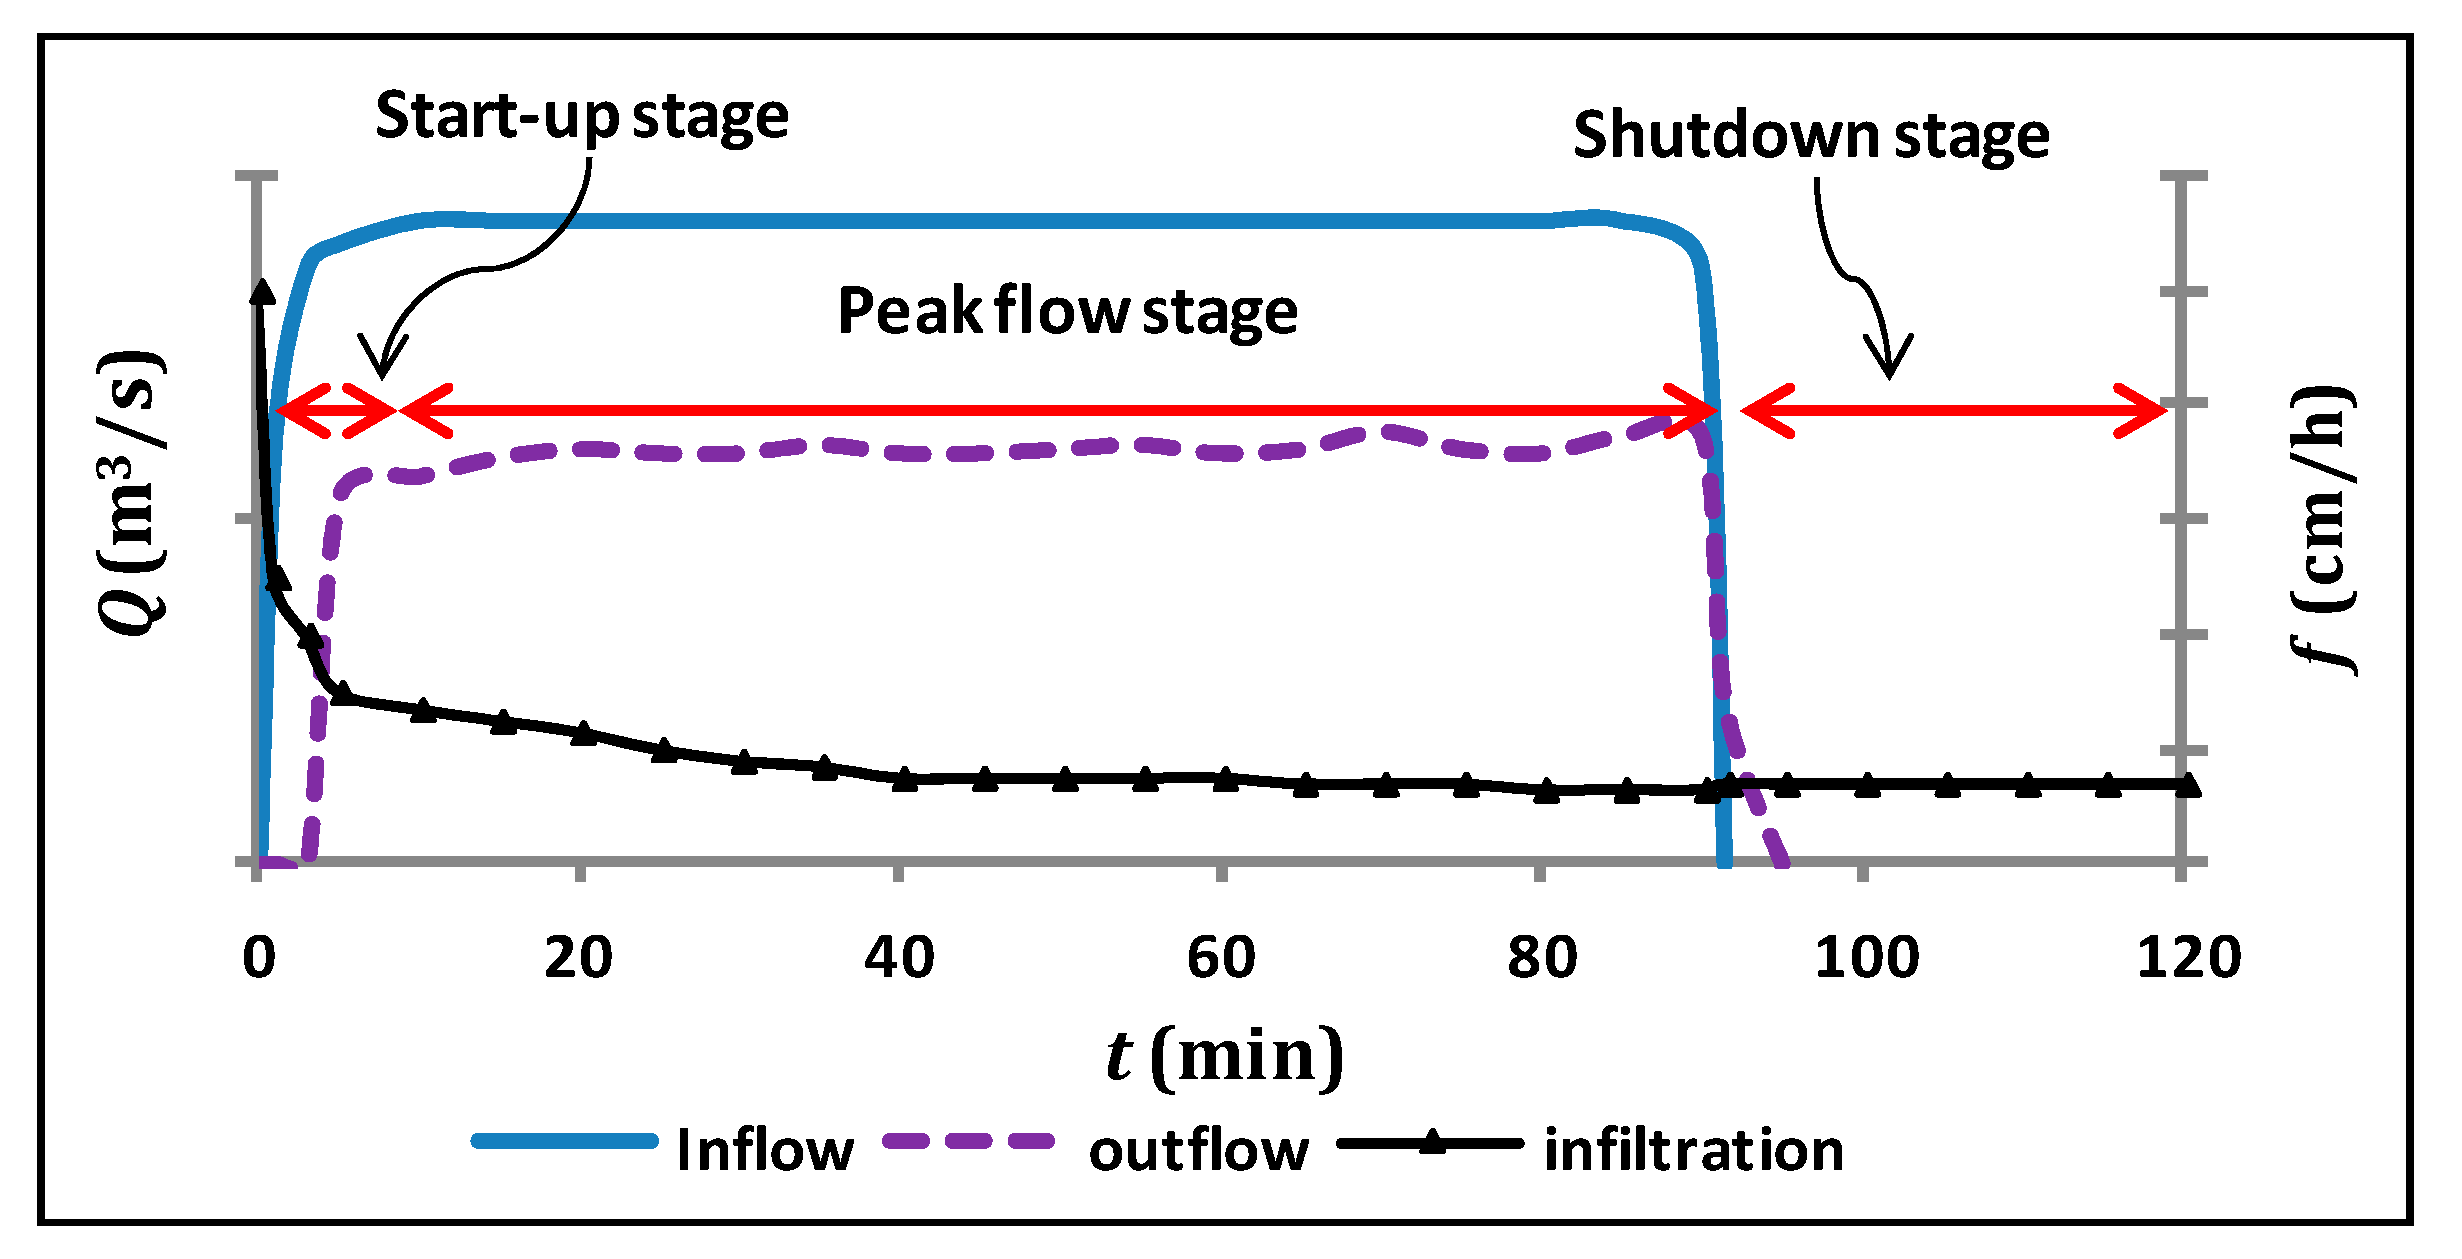
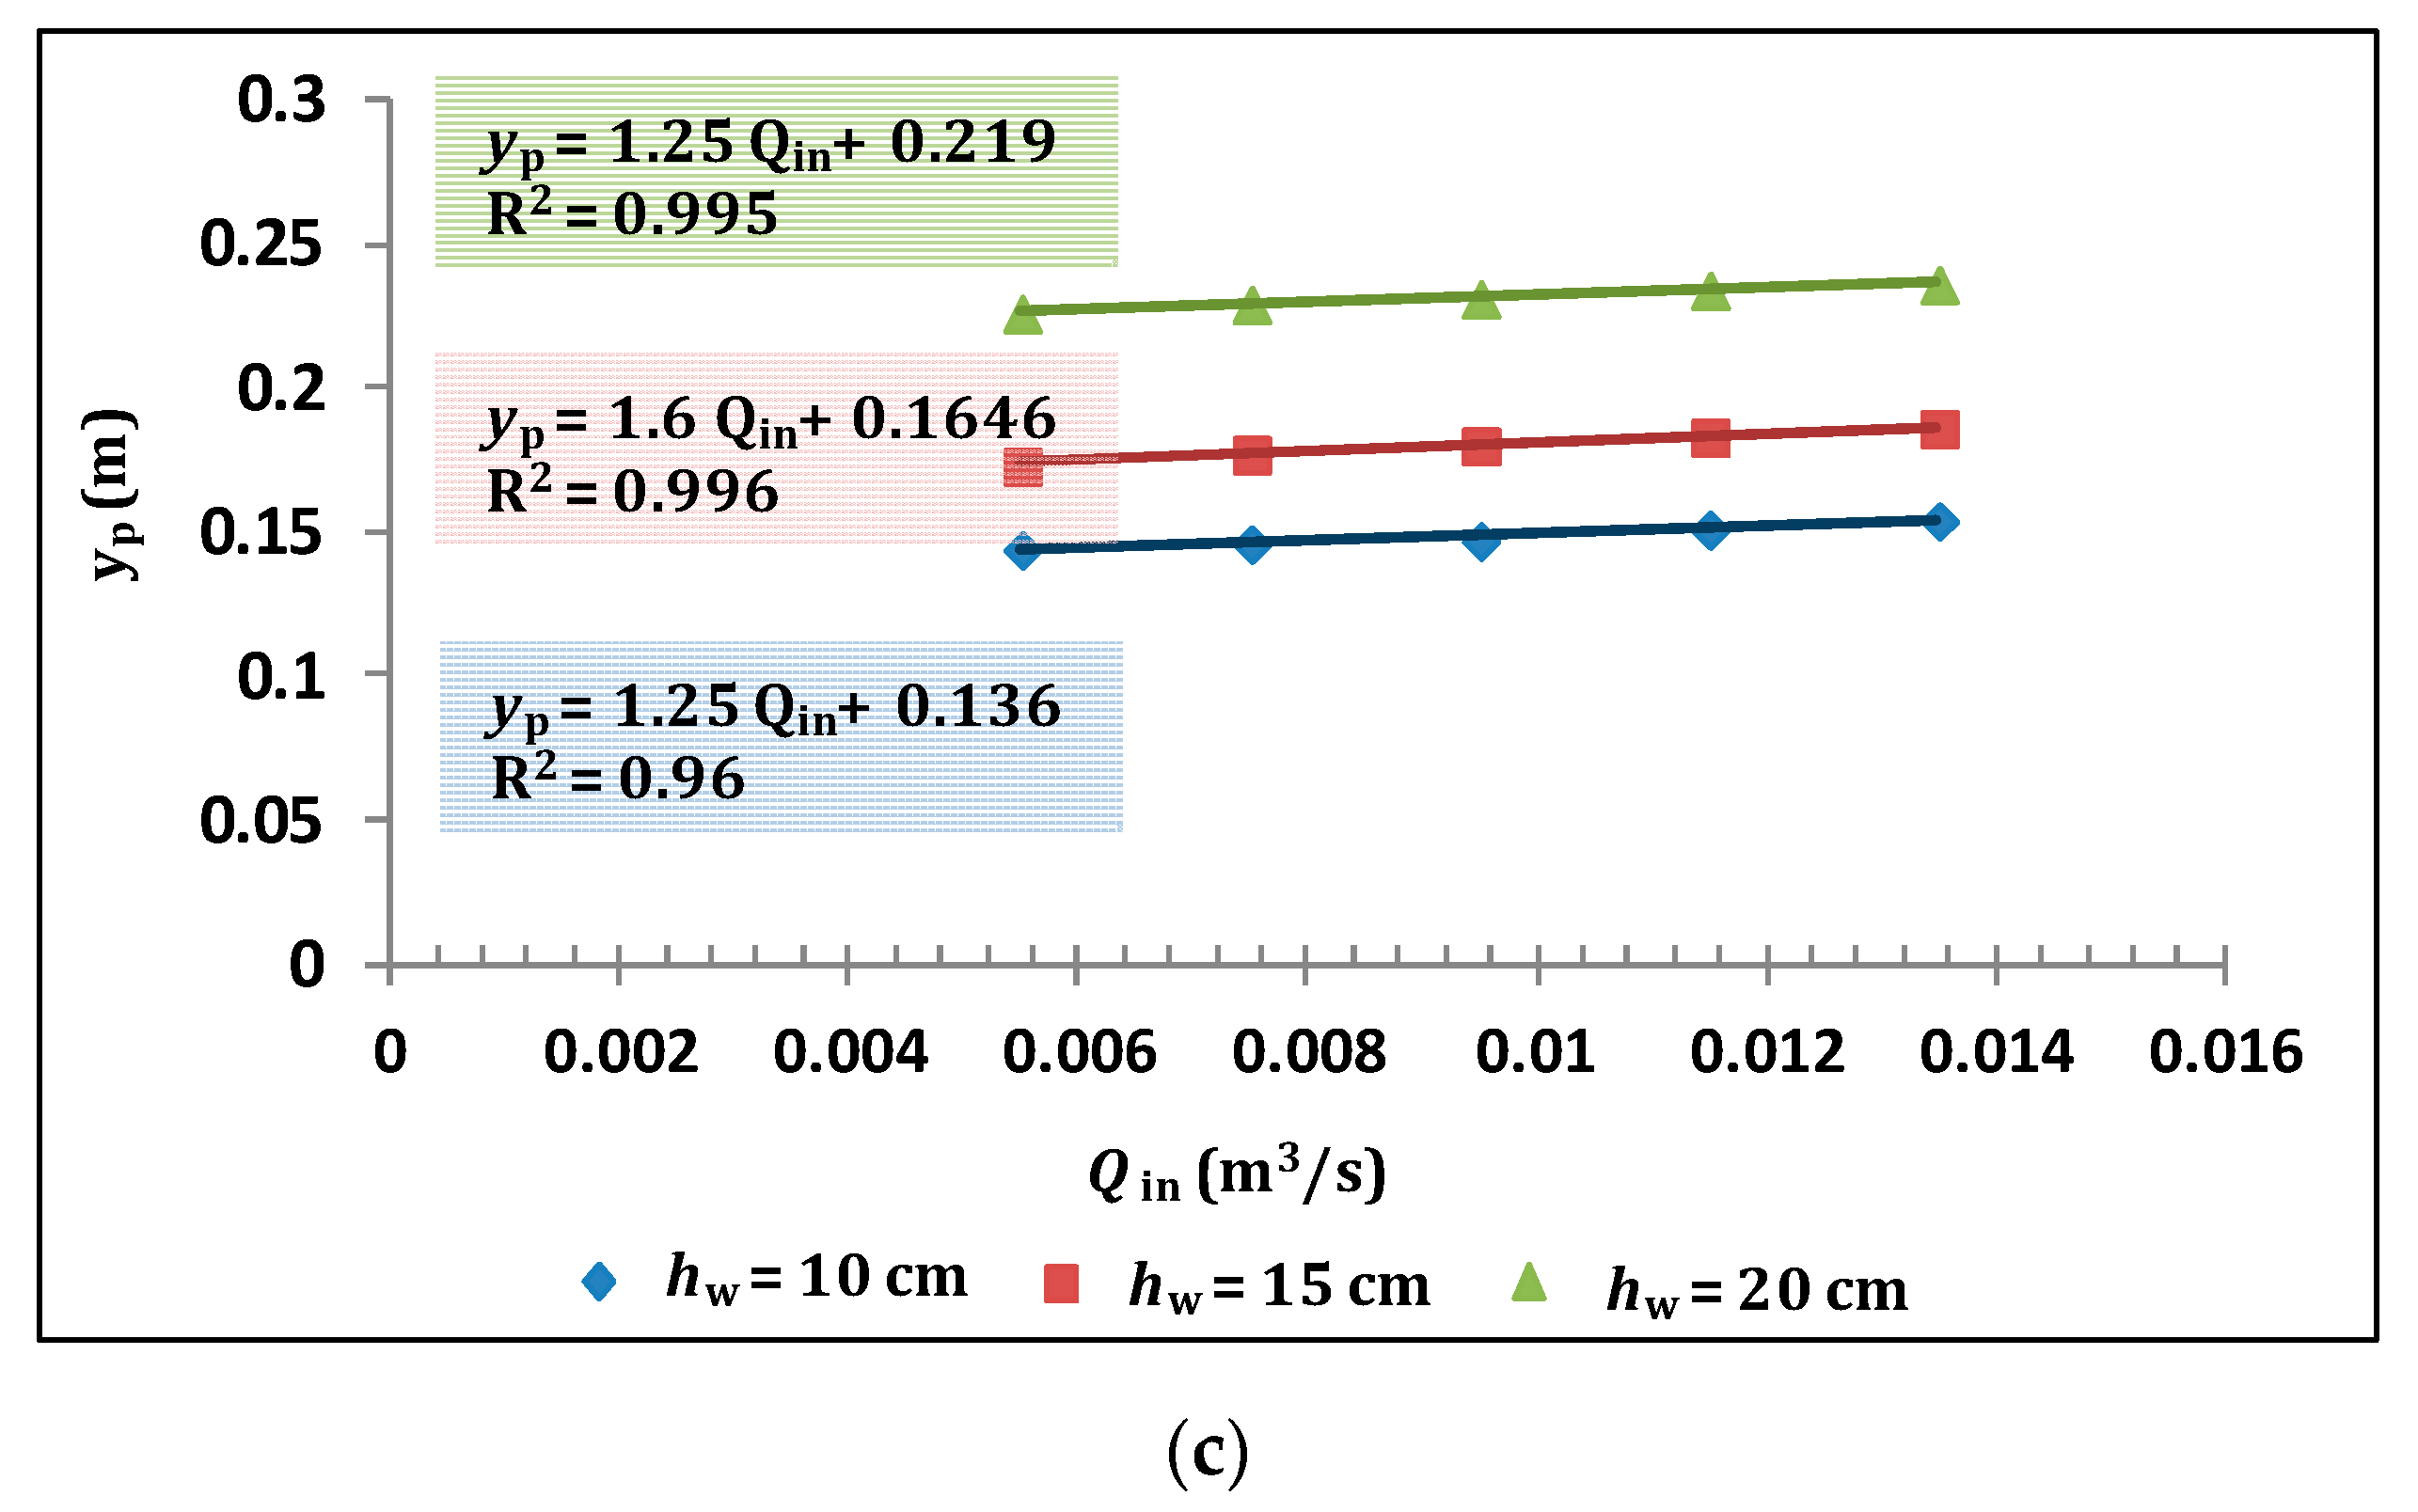
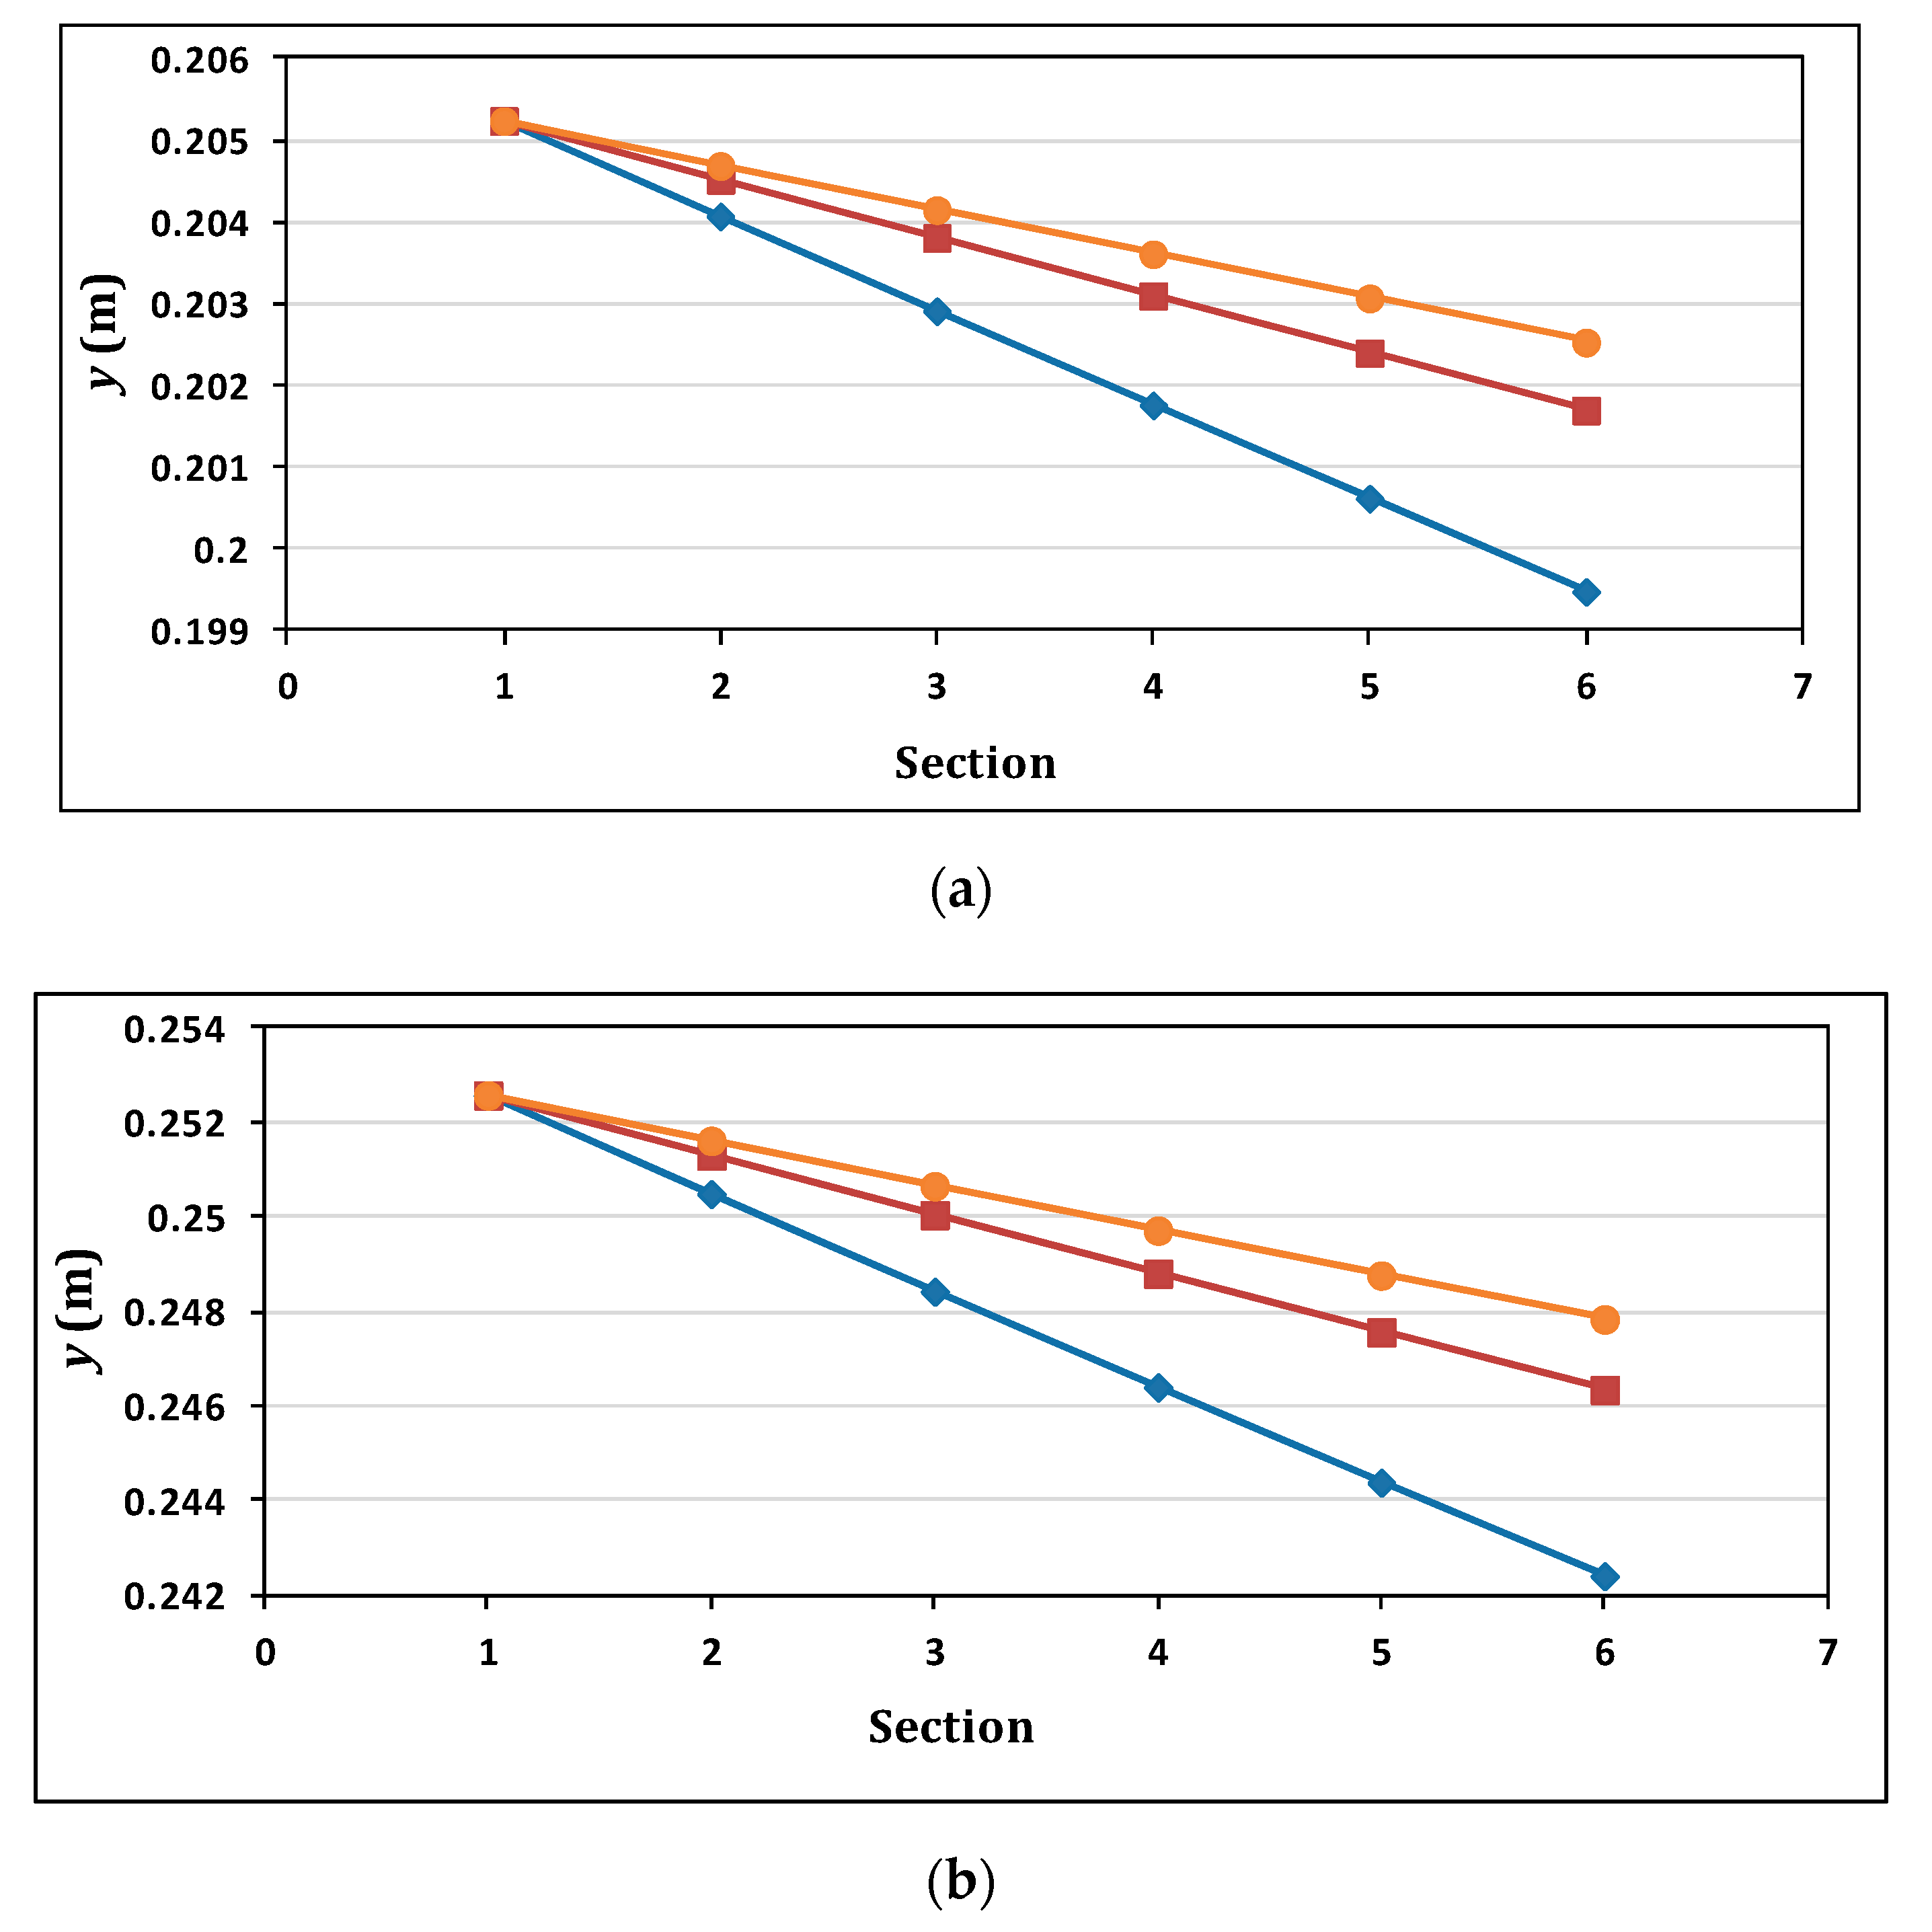
3.1. Flow Depth and Velocity for Different Check Dam Conditions
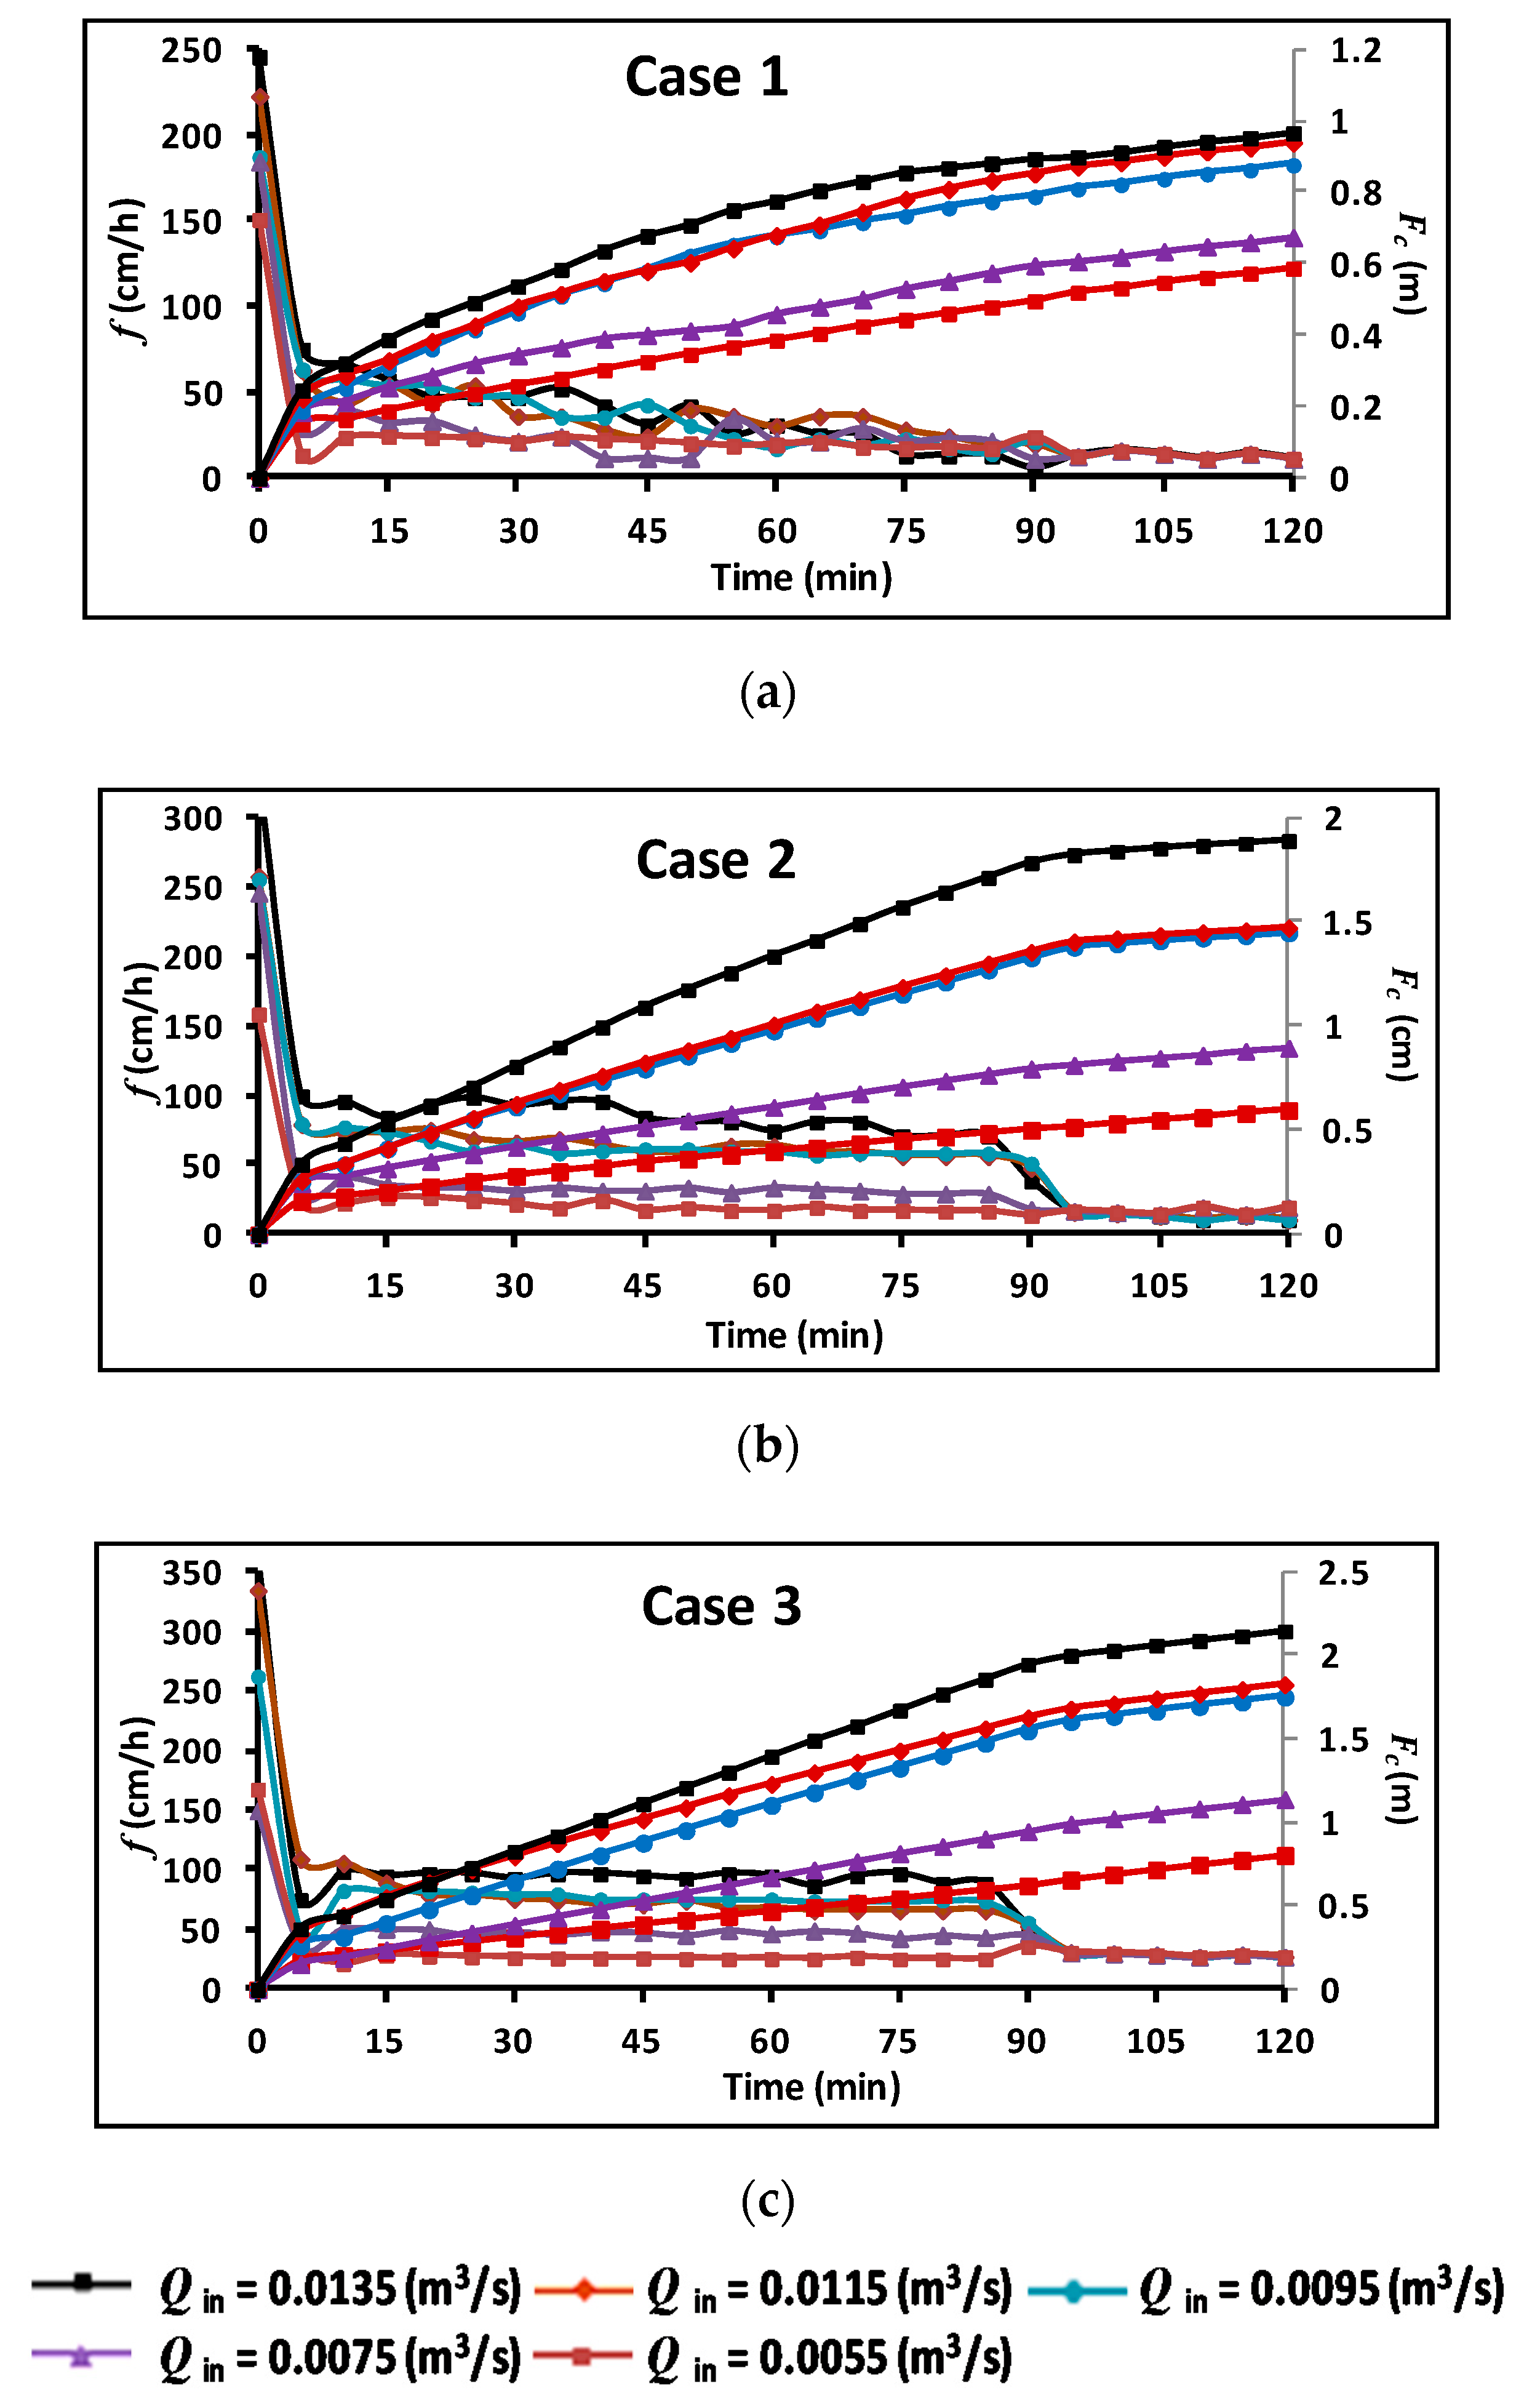
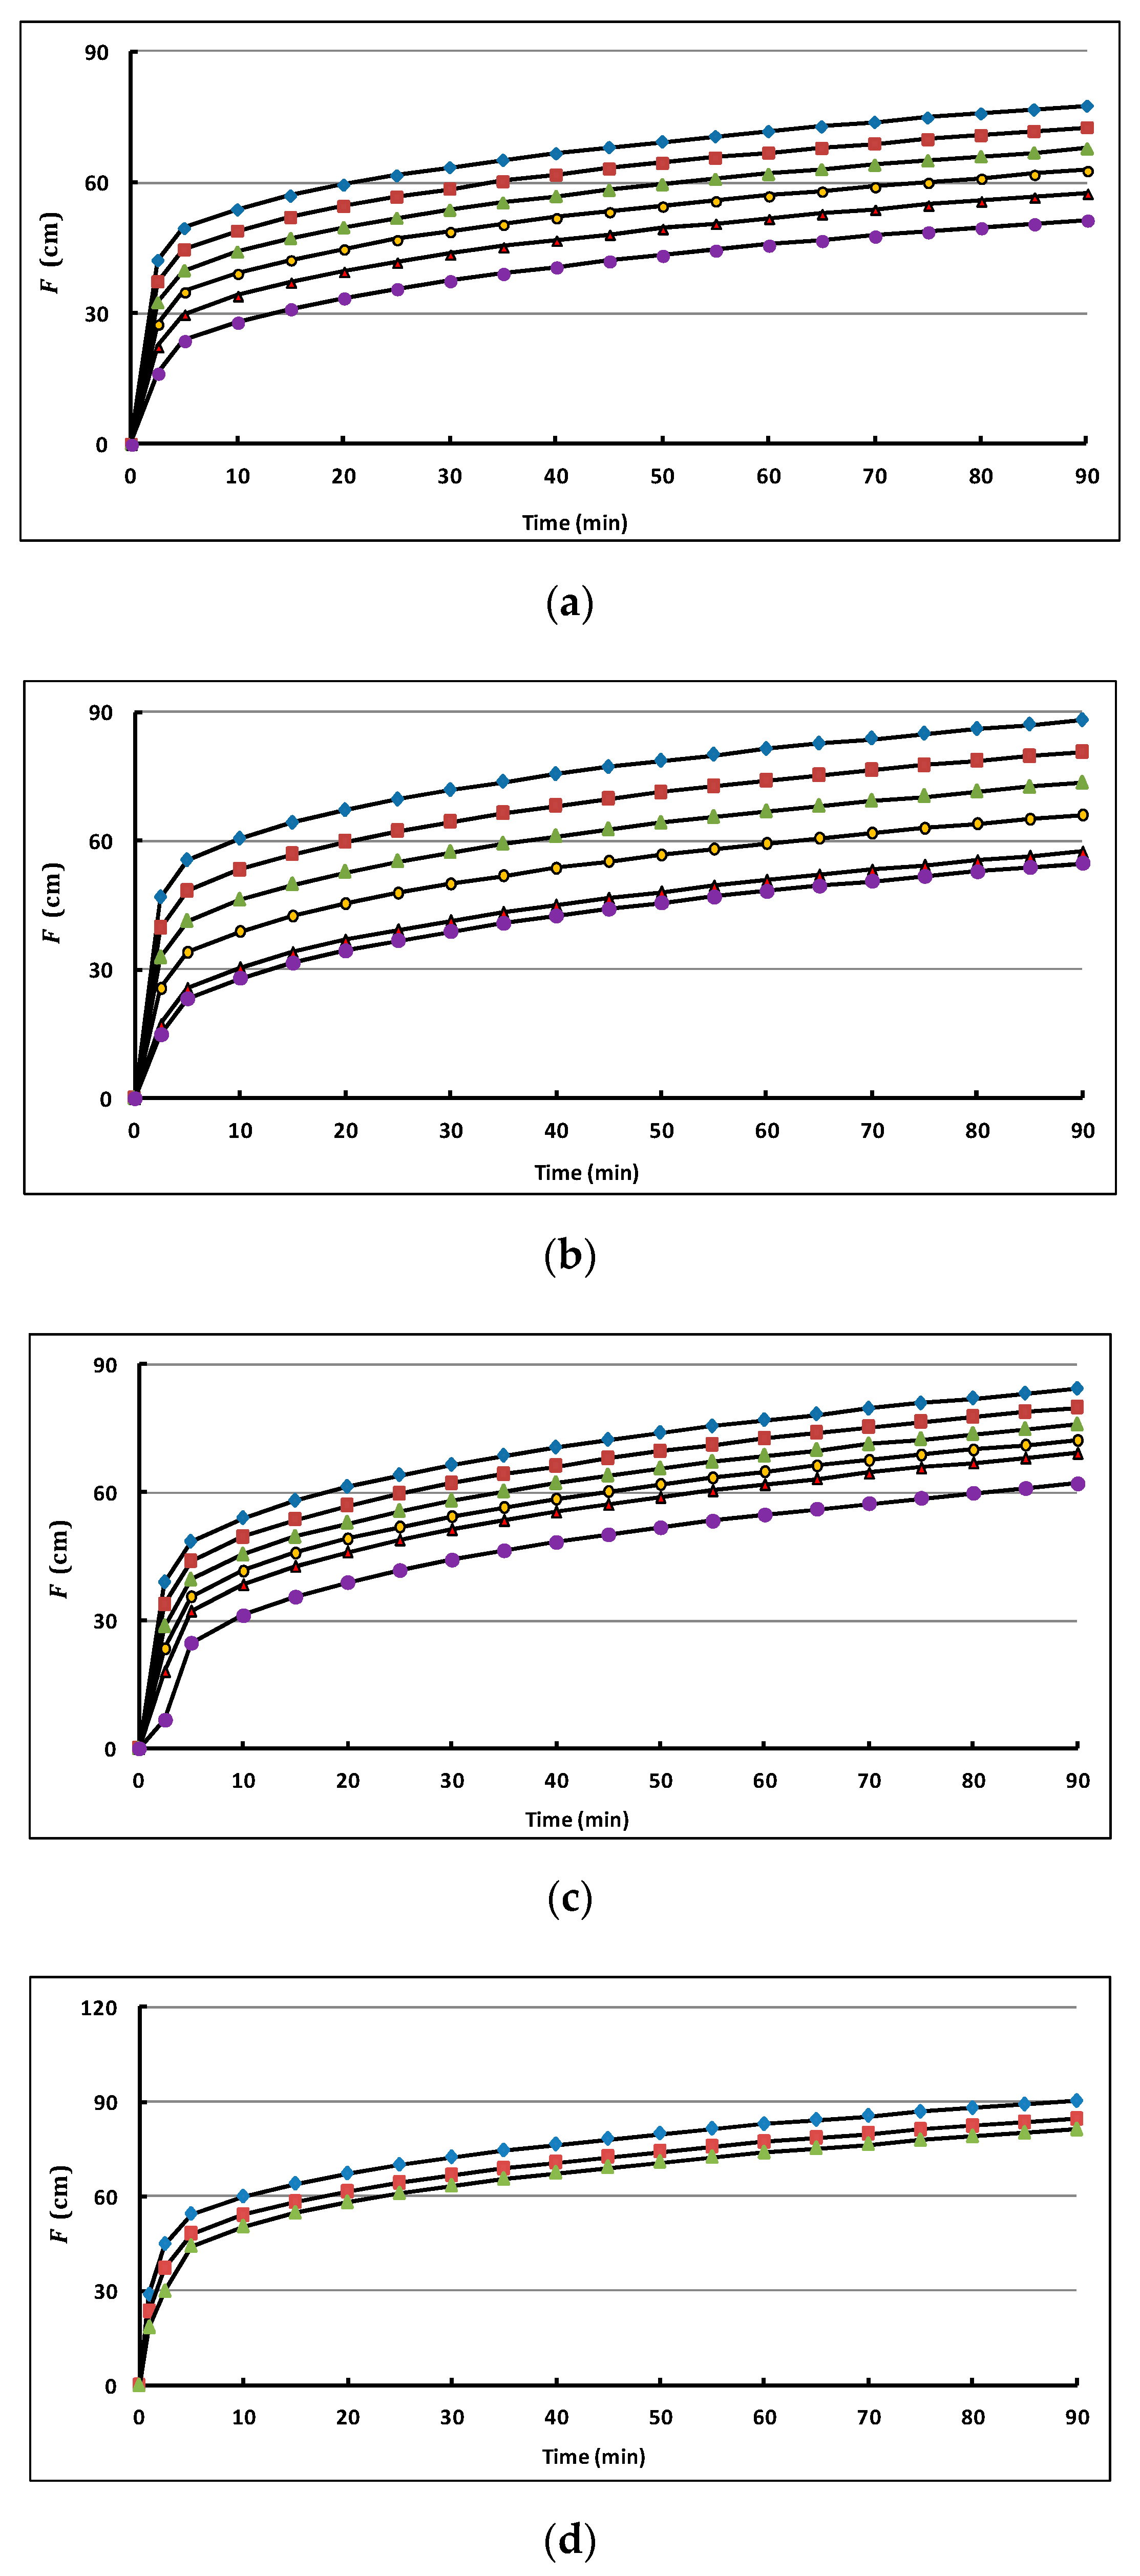
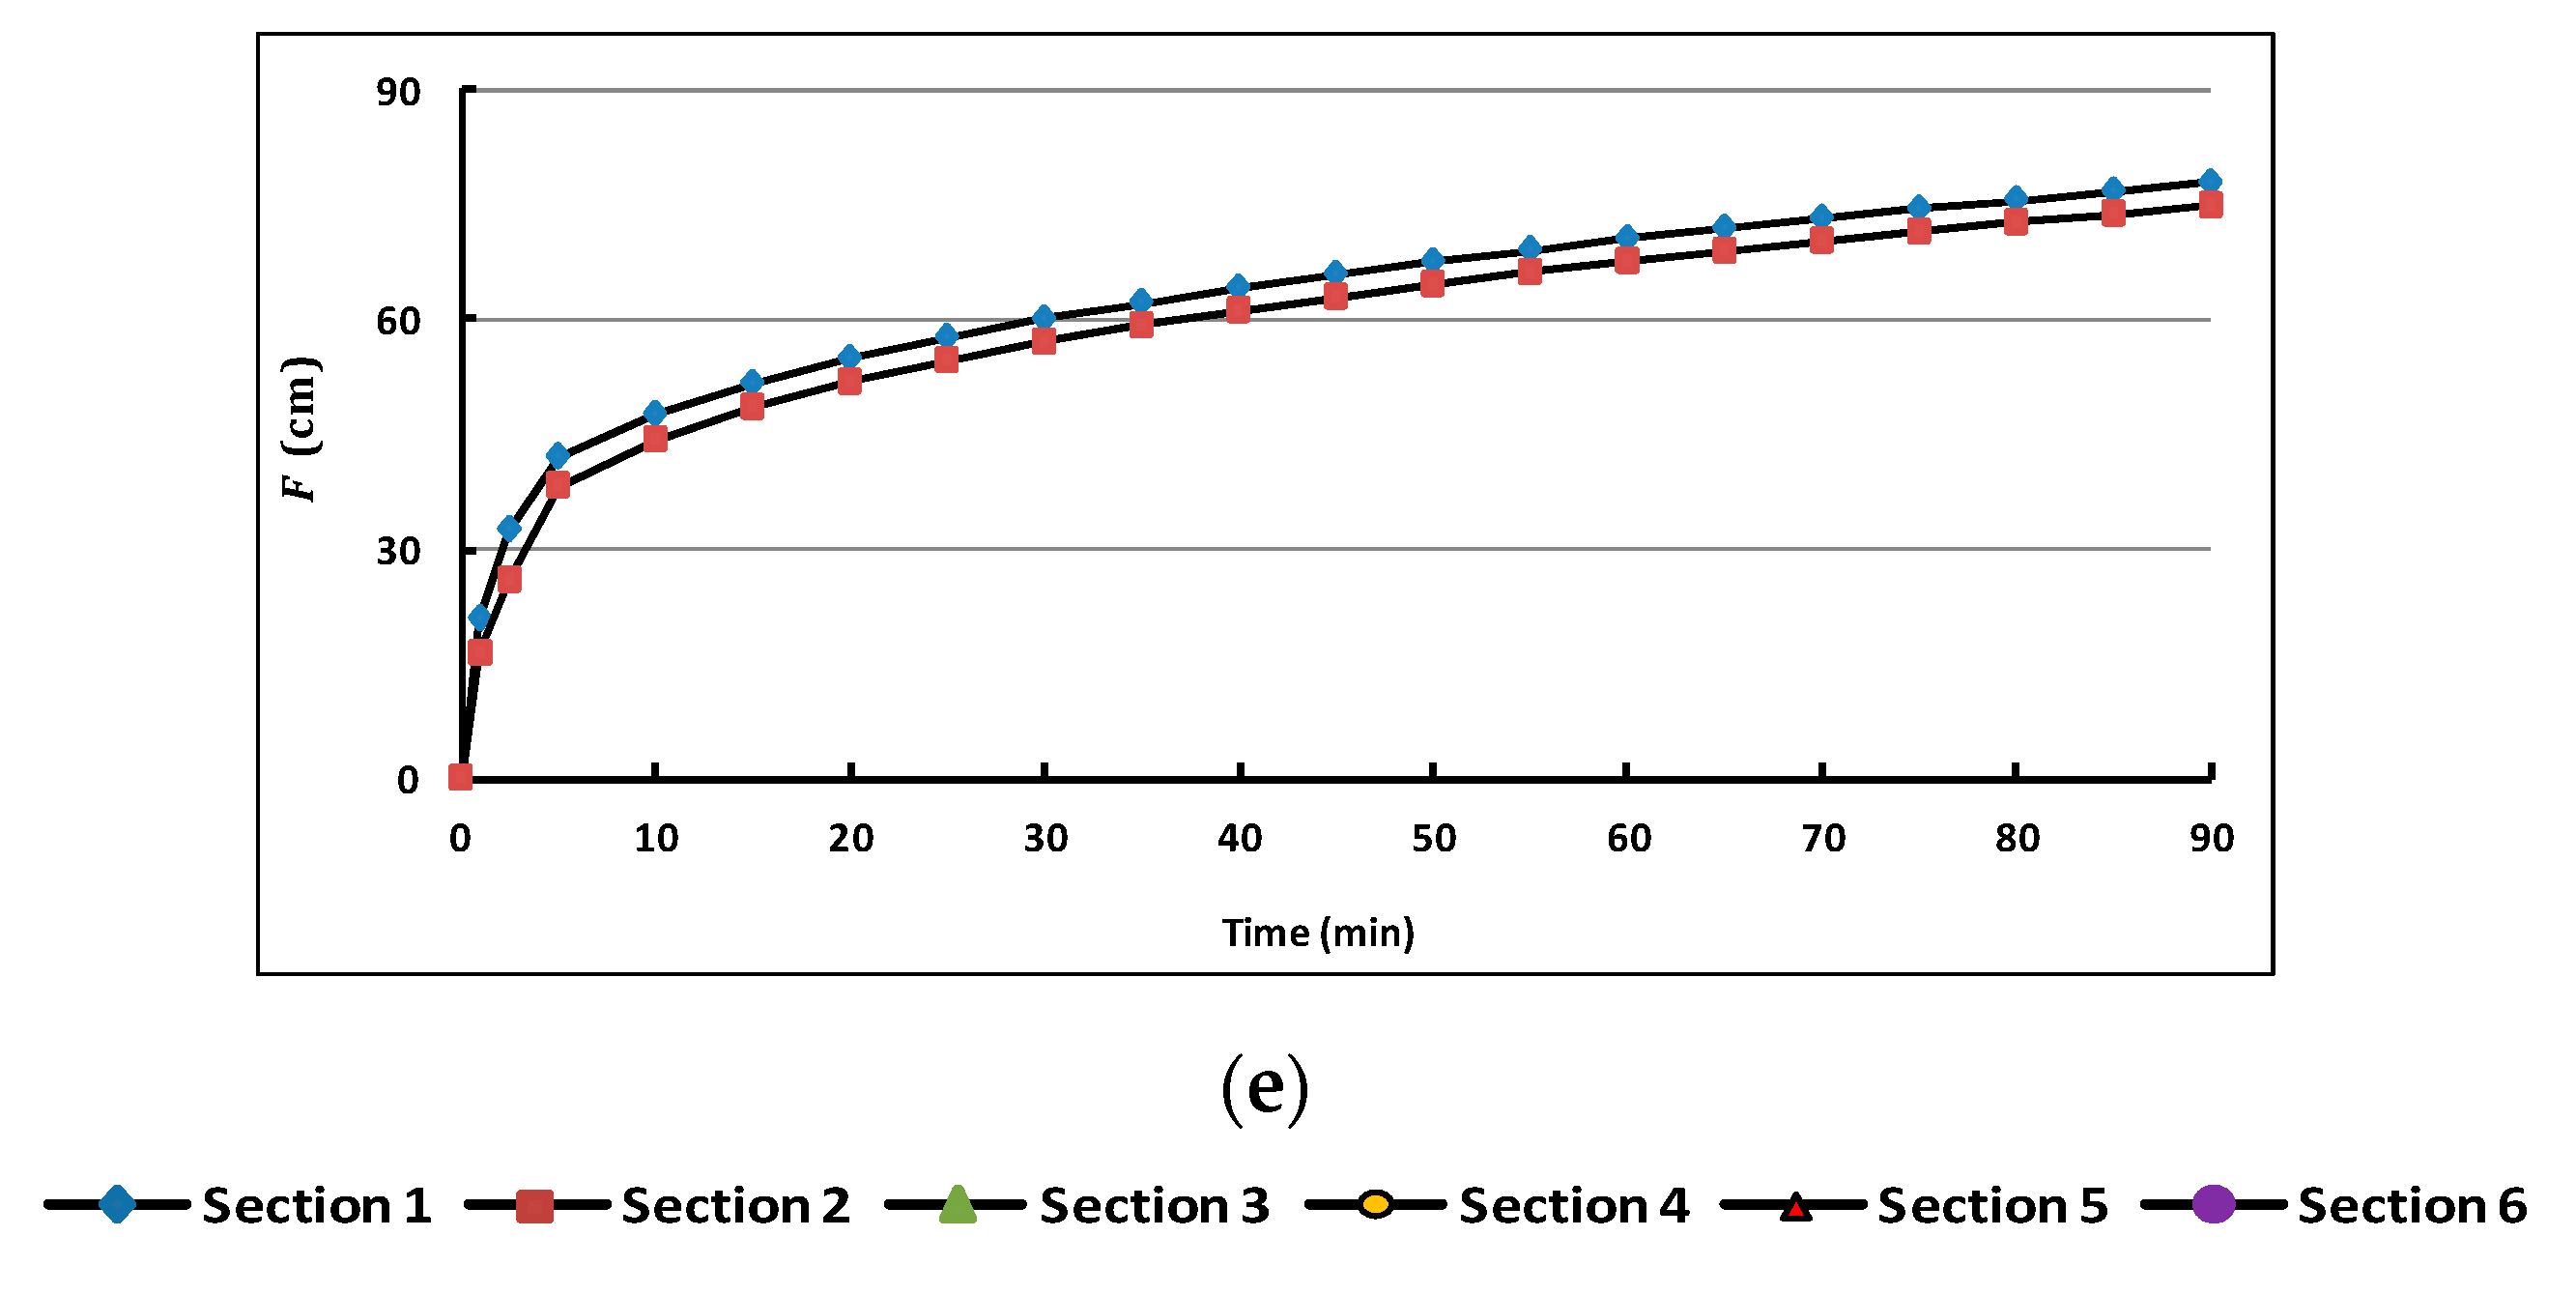
3.2. Infiltration Rates versus Check Dam Conditions
3.3. Developing Infiltration Model for a Grassed Channel with Check Dam
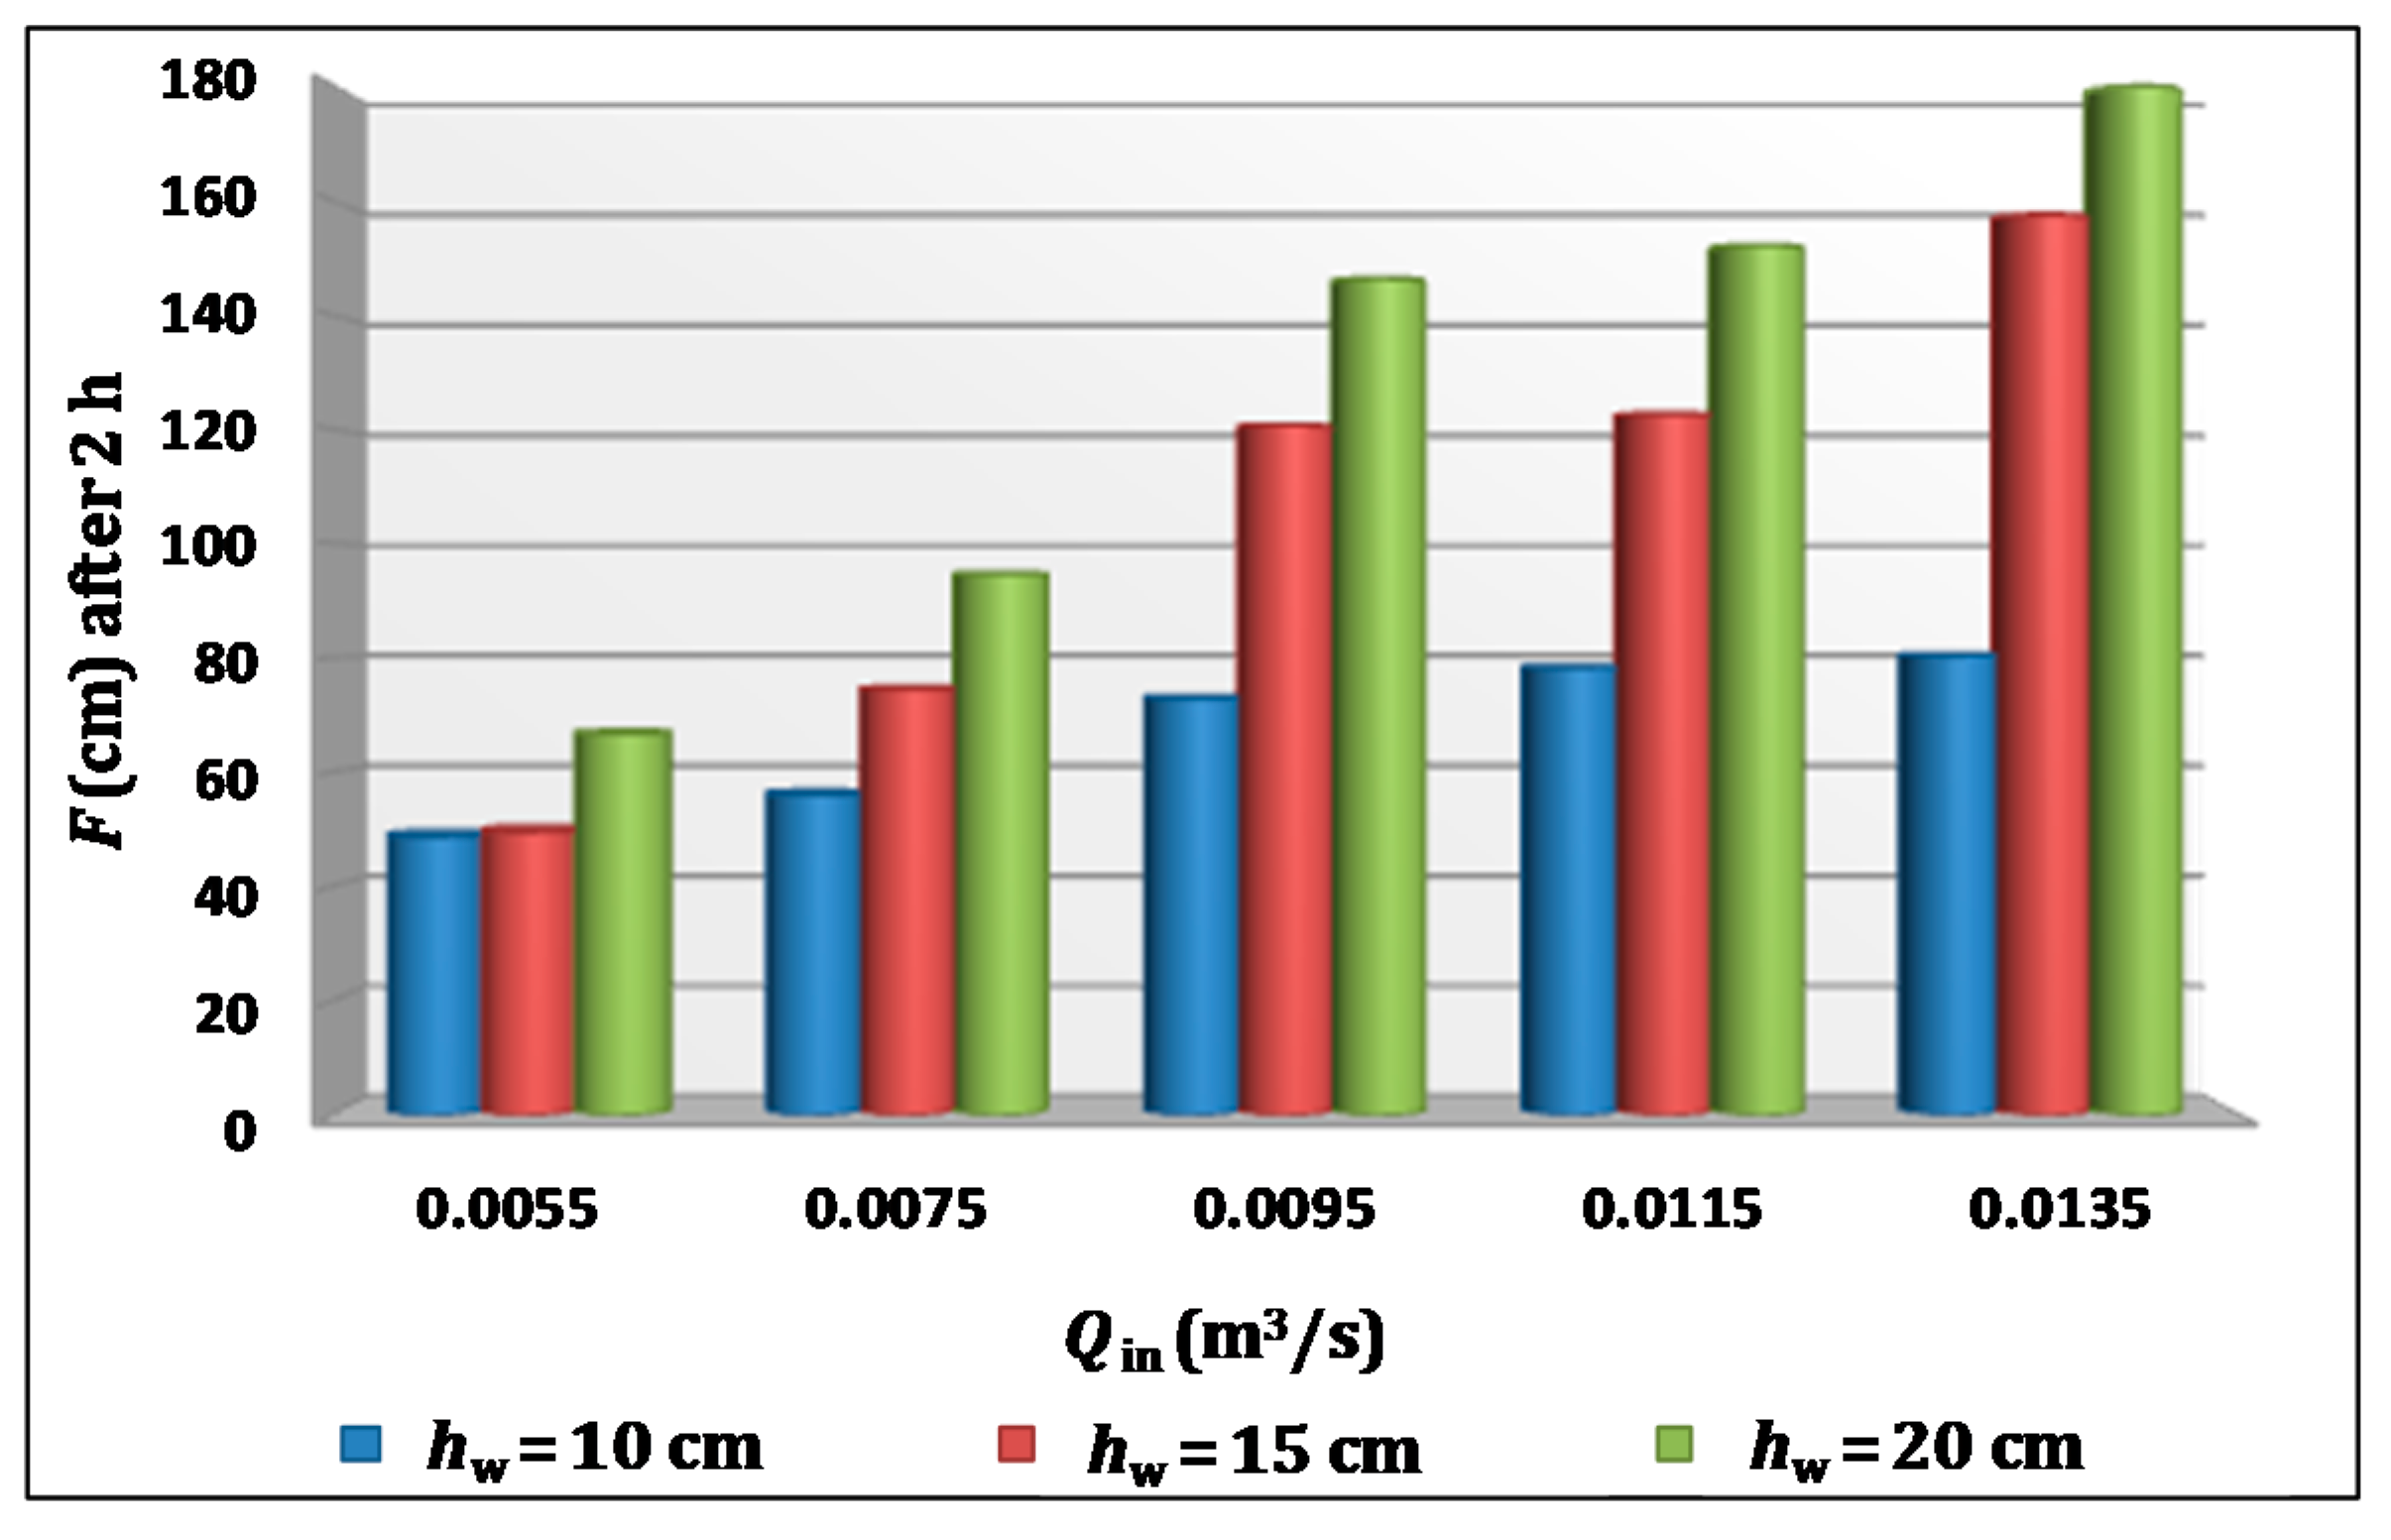
3.4. Influence of Check Dam Heights and Spacings on Infiltration Rate of Grassed Channel
4. Conclusions
Author Contributions
Funding
Conflicts of Interest
References
- Debo, T.N.; Reese, A. Municipal Stormwater Management; CRC Press: Boca Raton, FL, USA, 2002; ISBN 9781420032260. [Google Scholar]
- Boogaard, F.C.; Lucke, T.; Sommer, H.; De Beer, J.; Van De Giesen, N.C.; Van De Ven, F.H. Lessons Learned From Over Two Decades of Global Swale Use. In Proceedings of the 13th International Conference Urban Drainage, Kuching, Sarawak, 7–12 September 2014; pp. 1–9. [Google Scholar]
- Guo, J.C.Y. Urban Flood Mitigation and Stormwater Management; CRC Press: Boca Raton, FL, USA, 2017; ISBN 9781351980500. [Google Scholar]
- ASCE. Design and Construction of Urban Stormwater Management Systems; ASCE Manuals and Reports on Engineering Practice; American Society of Civil Engineers and Water Environment Federation: Reston, VA, USA, 2018; ISBN 9780872628557. [Google Scholar]
- Miguez, M.G.; Veról, A.P.; Carneiro, P.R.F. Sustainable Drainage Systems: An Integrated Approach, Combining Hydraulic Engineering Design, Urban Land Control and River Revitalisation Aspects. In Drainage Systems; InTech: London, UK, 2012. [Google Scholar]
- Yu, S.L.; Kuo, J.T.; Fassman, E.A.; Pan, H. Field test of grassed-swale performance in removing runoff pollution. J. Water Resour. Plan. Manag. 2001. [Google Scholar] [CrossRef]
- Shaw, L.; Yu, J.-T.K.; Elizabeth, A.; Fassman, H.P. Field Test of Grassed-Swale Performance in Removing Runoff Pollution. Techniques 2001, 127, 168–171. [Google Scholar]
- Ferguson, B.K. Stormwater Infiltration; CRC Press: Boca Raton, FL, USA, 2017; ISBN 9781351413596. [Google Scholar]
- Hassanli, A.M.; Beecham, S. Criteria for optimizing check dam location and maintenance requirements. In Check Dams, Morphological Adjustments and Erosion Control in Torrential Streams; Nova Science Publishers, Inc.: Hauppauge, NY, USA, 2013; pp. 11–31. ISBN 9781626188563. [Google Scholar]
- Jurries, D. Biofilters (Bioswales, Vegetative Buffers, & Constructed Wetlands) for Storm Water Discharge Pollution Removal; Department of Environmental Quality, Northwest Region Document: Portland, OR, USA, 2003. [Google Scholar]
- Manning, R. On the Flow of Water in Open Channels and Pipes. Trans. Inst. Civ. Eng. Irel. 1891, 20, 161–207. [Google Scholar]
- Akan, A.O. Open Channel Hydraulics; Elsevier: Amsterdam, The Netherlands, 2006; ISBN 9780750668576. [Google Scholar]
- Grinden, A. Numerical Modeling of Combined Hydraulics and Infiltration in Grassed Swales; Norwegian University of Science and Technology: Trondheim, Norway, 2014. [Google Scholar]
- Al-Janabi, A.M.S.; Ghazali, A.H.; Yusuf, B.; Mohammed, T.A. Permeable Channel Cross Section for Maximizing Stormwater Infiltration and Seepage Rates. J. Irrig. Drain. Eng. 2018, 144, 04018001. [Google Scholar]
- Abdurrasheed, A.S.; Yusof, K.W.; Takaijudin, H.; Ghani, A.A. Effects of Backwater on Hydraulic Performance Evaluation of Rainsmart Modules in Sustainable Drainage Systems. In Proceedings of the 4th International Conference on Water Resources, Langkawi, Malaysia, 17–21 July 2018. [Google Scholar]
- Afzalimehr, H.; Anctil, F. Velocity distribution and shear velocity behaviour of decelerating flows over a gravel bed. Can. J. Civ. Eng. 1999, 26, 468–475. [Google Scholar]
- Philip, J.R. The theory of infiltration. Soil Sci. 1958, 85, 278–286. [Google Scholar] [CrossRef]
- Schmid, B.H. On overland flow modelling: Can rainfall excess be treated as independent of flow depth? J. Hydrol. 1989, 107, 1–8. [Google Scholar] [CrossRef]
- Wallach, R.; Grigorin, G.; Byk, J.R. The errors in surface runoff prediction by neglecting the relationship between infiltration rate and overland flow depth. J. Hydrol. 1997, 200, 243–259. [Google Scholar]
- Elhanafy, H.; Copeland, G. The effect of water stage on the infiltration rate for initially dry channels. In Proceedings of the 2nd IMA International Conference on flood Risk Assessment, Glasgow, UK, 4–5 September 2007. [Google Scholar]
- Al-Janabi, A.M.S.; Yusuf, B.; Ghazali, A.H. Modeling the Infiltration Capacity of Permeable Stormwater Channels with a Check Dam System. Water Resour. Manag. 2019, 33, 2453–2470. [Google Scholar]
- Al-Janabi, A.M.S.; Ghazali, A.H.; Yusuf, B. Effects of Cross-Section on Infiltration and Seepage in Permeable Stormwater Channels. In GCEC 2017; Springer: Singapore, 2019; Volume 9, pp. 1495–1509. ISBN 2366-2557. [Google Scholar]
- Heber Green, W.; Ampt, G.A. Studies on Soil Phyics. J. Agric. Sci. 1911, 4, 1–24. [Google Scholar] [CrossRef]
- Richards, L.A. Capillary Conduction of Liquids through Porous Mediums. Physics (College Park Md.) 1931, 1, 318–333. [Google Scholar] [CrossRef]
- Kostiakov, A. On the dynamics of the coefficient of water percolation in soils and on the necessity for studying it from a dynamics point of view for purposes of amelioration. In Proceedings of the Transactions of the Sixth Commission of International Society of Soil Science, Part A; Martinius Nijhoff Publishers: Leiden, The Netherland, 1932; pp. 15–21. [Google Scholar]
- Horton, R.E. An Approach Toward a Physical Interpretation of Infiltration-Capacity. Soil Sci. Soc. Am. J. 1941, 5, 399–417. [Google Scholar] [CrossRef]
- Smith, R.E. The infiltration envelope: Results from a theoretical infiltrometer. J. Hydrol. 1972, 17, 1–21. [Google Scholar] [CrossRef]
- Turner, E.R. Comparison of Infiltration Equations and Their Field Validation With Rainfall Simulation; University of Maryland: Washington, DC, USA, 2006. [Google Scholar]
- Al-Janabi, A.M.S.; Ghazali, A.H.; Yusuf, B. Modified models for better prediction of infiltration rates in trapezoidal permeable stormwater channels. Hydrol. Sci. J. 2019, 64, 1918–1931. [Google Scholar]
- Al-Azawi, S.A. Experimental evaluation of infiltration models. J. Hydrol. (N. Z.) 1985, 24, 77–88. [Google Scholar]
- Sihag, P.; Tiwari, N.K.; Ranjan, S. Performance Evaluation of Infiltration Models. J. Indian Water Resour. Soc. 2018, 38. [Google Scholar]
- Furman, A.; Warrick, A.W.; Zerihun, D.; Sanchez, C.A. Modified Kostiakov Infiltration Function: Accounting for Initial and Boundary Conditions. J. Irrig. Drain. Eng. 2006, 132, 587–596. [Google Scholar] [CrossRef]
- Israelson, O.W.; Hanse, V.E. Irrigation Principles and Practices; John Wiley: New York, NY, USA, 1967. [Google Scholar]
- Mbagwu, J.S.C. Testing the Goodness of Fit of Selected Infiltration Models on Soils with Different Land Use Histories; Int. Cent. Theor. Physics: Trieste, Italy, 1993. [Google Scholar]
- Lal, R.; Shukla, M.K. Principles of Soil Physics; Books in Soils, Plants, and the Environment; Taylor & Francis: Oxfordshire, UK, 2004; ISBN 9780824751272. [Google Scholar]
- Shukla, M.K. Soil Physics: An Introduction; CRC Press: Boca Raton, FL, USA, 2013; ISBN 9781482216868. [Google Scholar]
- Kincaid, D.; Heermann, D.; Kruse, E. Application Rates And Runoff In Center-Pivot Sprinkler Irrigation. Am. Soc. Agric. Eng. Trans. 1969, 12. [Google Scholar] [CrossRef]
- Mishra, S.K.; Tyagi, J.V.; Singh, V.P. Comparison of infiltration models. Hydrol. Process. 2003, 17, 2629–2652. [Google Scholar] [CrossRef]
- Yusuf, B.; Al-Janabi, A.M.S.; Ghazali, A.H.; Al-Ani, I. Variations of infiltration capacity with flow hydraulic parameters in permeable stormwater channels. ISH J. Hydraul. Eng. 2020, 1–9. [Google Scholar] [CrossRef]
- Kresic, N. Hydrogeology and Groundwater Modeling, 2nd ed.; CRC Press: Boca Raton, FL, USA, 2006. [Google Scholar]


| Instruments | Application | Function |
|---|---|---|
| Upstream tank | Placed under the inflow pipe; some stones were placed in the bottom of it | Regulate inflow and reduce turbulence |
| Electronic flowmeter | Attached to the inflow pipe | Measure, regulate, and control the inflow rate |
| Staff gages | Fixed at three points along the channel as point 1: 5 m from upstream, point 2: middle of the channel, point 3: 5 m from downstream | Measure water level |
| Current meter | Movable among the three water level measurement points along the channel | Measure the mean flow velocities |
| Downstream tank with a valve | Placed after the check dam | Measure the outflow using the volumetric method |
| Case | Check Dam Height hw (cm) | Inflow Rate Q (m3/s) | Mean Velocity V (m/s) | Water Depth y (cm) at Peak | Time to Downstream td (min) | Time to Peak tp (min) | ||
|---|---|---|---|---|---|---|---|---|
| Point 1 | Point 2 | Point 3 | ||||||
| 1 | 10 | 0.0055 | 0.06 | 12.9 | 14.4 | 15.4 | 1.5 | 2.8 |
| 0.0075 | 0.08 | 13.2 | 14.6 | 16 | 1.33 | 2.17 | ||
| 0.0095 | 0.1 | 13.7 | 14.7 | 16.3 | 0.87 | 1.5 | ||
| 0.0115 | 0.115 | 14.1 | 15.1 | 16.6 | 0.8 | 1.38 | ||
| 0.0135 | 0.13 | 14.6 | 15.4 | 17.1 | 0.73 | 1.17 | ||
| 2 | 15 | 0.0055 | 0.04 | 15.5 | 17.3 | 19 | 1.5 | 4.86 |
| 0.0075 | 0.06 | 16.3 | 17.7 | 19.3 | 1.033 | 3.63 | ||
| 0.0095 | 0.07 | 16.8 | 18 | 19.6 | 0.87 | 2.07 | ||
| 0.0115 | 0.08 | 17.5 | 18.3 | 20 | 0.775 | 1.93 | ||
| 0.0135 | 0.095 | 18 | 18.6 | 20.3 | 0.75 | 1.92 | ||
| 3 | 20 | 0.0055 | 0.025 | 20.3 | 22.6 | 24.3 | 1.32 | 6.42 |
| 0.0075 | 0.035 | 20.9 | 22.9 | 24.6 | 1.016 | 4.88 | ||
| 0.0095 | 0.045 | 21.1 | 23.1 | 25.4 | 1 | 4.38 | ||
| 0.0115 | 0.05 | 21.5 | 23.4 | 24.9 | 0.87 | 3.13 | ||
| 0.0135 | 0.06 | 22 | 23.6 | 25.2 | 0.7 | 2.83 | ||
| Case | Height hd (cm) | Spacing Ld (m) | Number of Sections |
|---|---|---|---|
| 1 | 10 | 10 | 6 |
| 2 | 15 | 10 | 6 |
| 3 | 20 | 10 | 6 |
| 4 | 20 | 20 | 3 |
| 5 | 20 | 30 | 2 |
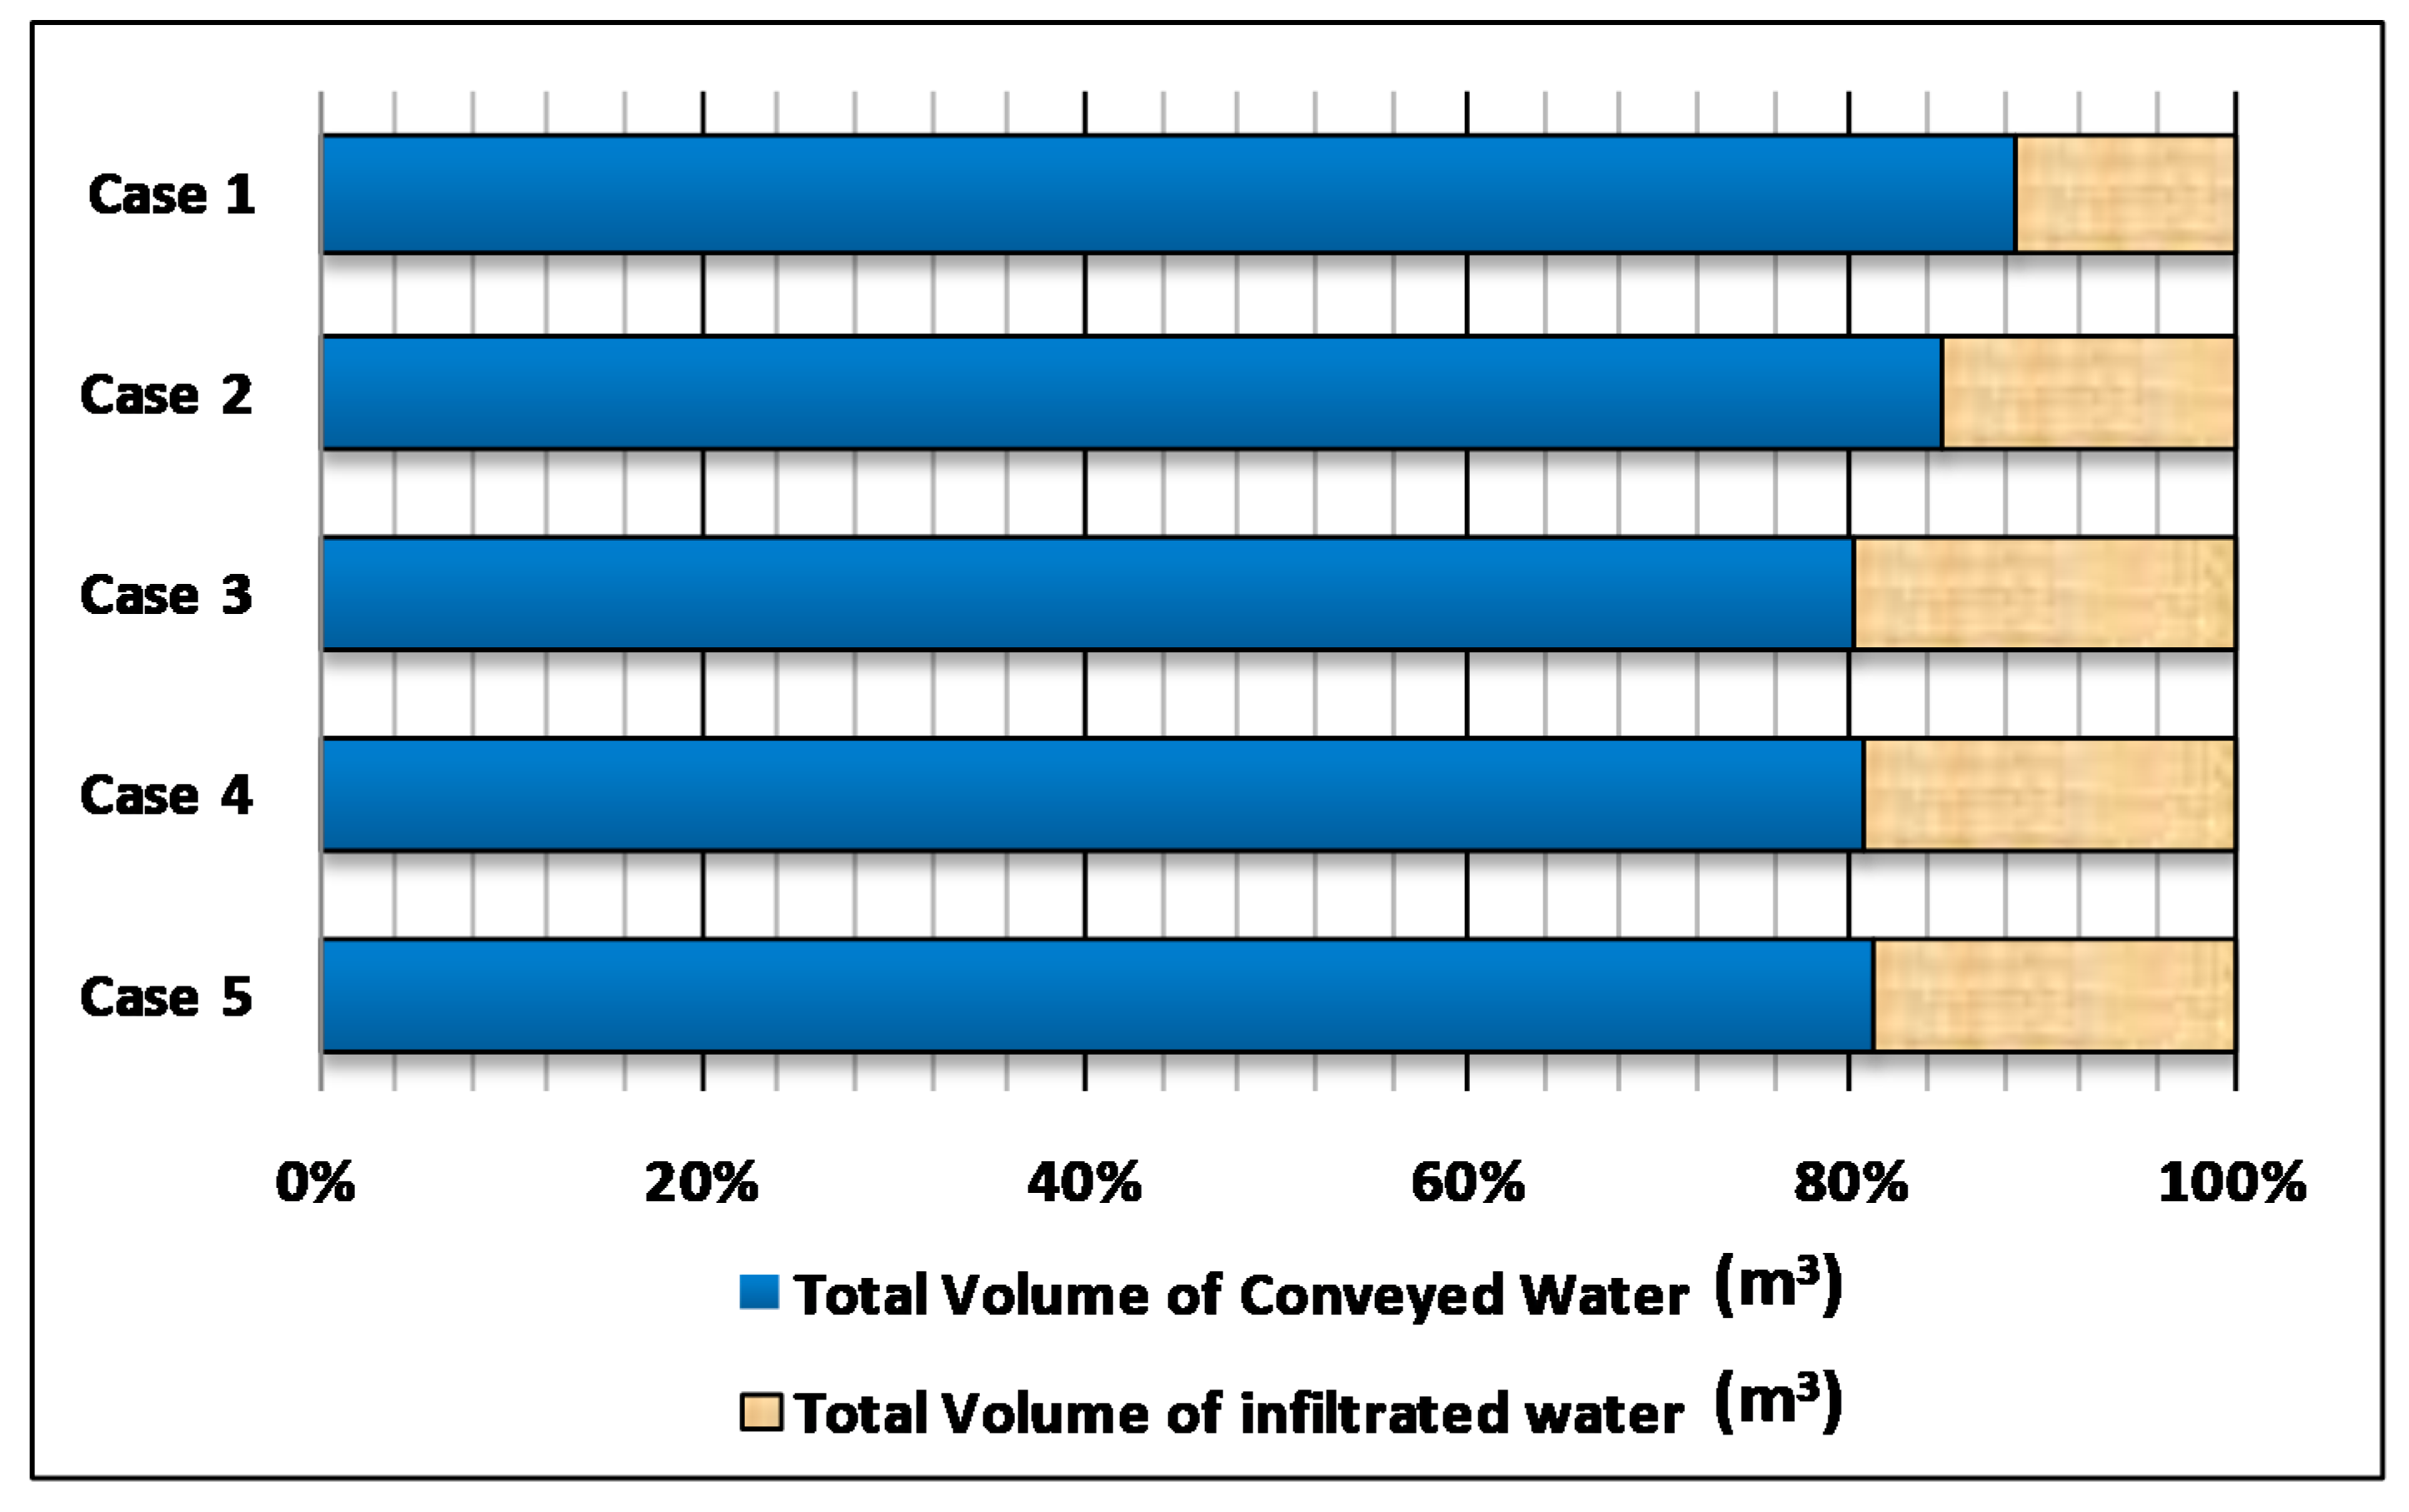
| Case | Total Inflow Volume (m3) | Total Outflow Volume (m3) | Total Infiltrated Volume (m3) |
|---|---|---|---|
| 1 | 297 | 262.7 | 34.3 |
| 2 | 297 | 251.5 | 45.5 |
| 3 | 297 | 237.4 | 59.6 |
| 4 | 297 | 239 | 58 |
| 5 | 297 | 241 | 56 |
© 2020 by the authors. Licensee MDPI, Basel, Switzerland. This article is an open access article distributed under the terms and conditions of the Creative Commons Attribution (CC BY) license (http://creativecommons.org/licenses/by/4.0/).
Share and Cite
Al-Janabi, A.M.S.; Ghazali, A.H.; Yusuf, B.; Sammen, S.S.; Afan, H.A.; Al-Ansari, N.; Shahid, S.; Yaseen, Z.M. Optimizing Height and Spacing of Check Dam Systems for Better Grassed Channel Infiltration Capacity. Appl. Sci. 2020, 10, 3725. https://doi.org/10.3390/app10113725
Al-Janabi AMS, Ghazali AH, Yusuf B, Sammen SS, Afan HA, Al-Ansari N, Shahid S, Yaseen ZM. Optimizing Height and Spacing of Check Dam Systems for Better Grassed Channel Infiltration Capacity. Applied Sciences. 2020; 10(11):3725. https://doi.org/10.3390/app10113725
Chicago/Turabian StyleAl-Janabi, Ahmed Mohammed Sami, Abdul Halim Ghazali, Badronnisa Yusuf, Saad Sh. Sammen, Haitham Abdulmohsin Afan, Nadhir Al-Ansari, Shamsuddin Shahid, and Zaher Mundher Yaseen. 2020. "Optimizing Height and Spacing of Check Dam Systems for Better Grassed Channel Infiltration Capacity" Applied Sciences 10, no. 11: 3725. https://doi.org/10.3390/app10113725
APA StyleAl-Janabi, A. M. S., Ghazali, A. H., Yusuf, B., Sammen, S. S., Afan, H. A., Al-Ansari, N., Shahid, S., & Yaseen, Z. M. (2020). Optimizing Height and Spacing of Check Dam Systems for Better Grassed Channel Infiltration Capacity. Applied Sciences, 10(11), 3725. https://doi.org/10.3390/app10113725