Statistical Error Propagation Affecting the Quality of Experience Evaluation in Video on Demand Applications

School of Electronic Engineering and Computer Science, Queen Mary University of London, Mile End Rd, London E1 4NS, UK
*
Author to whom correspondence should be addressed.
Appl. Sci. 2020, 10(10), 3662; https://doi.org/10.3390/app10103662
Submission received: 24 April 2020
/
Revised: 20 May 2020
/
Accepted: 21 May 2020
/
Published: 25 May 2020
(This article belongs to the Section Electrical, Electronics and Communications Engineering)
Abstract
:In addition to the traditional Quality of Service (QoS) metrics of latency, jitter and Packet Loss Ratio (PLR), Quality of Experience (QoE) is now widely accepted as a numerical proxy for the actual user experience. The literature has reported many mathematical mappings between QoE and QoS, where the QoS parameters are measured by the network providers using sampling. Previous research has focussed on sampling errors in QoS measurements. However, the propagation of these sampling errors in QoS through to the QoE values has not been evaluated before. This is important: without knowing how sampling errors propagate through to QoE estimates there is no understanding of the precision of the estimates of QoE, only of the average QoE value. In this paper, we used industrially acquired measurements of PLR and jitter to evaluate the sampling errors. Additionally, we evaluated the correlation between these QoS measurements, as this correlation affects errors propagating to the estimated QoE. Focusing on Video-on-Demand (VoD) applications, we use subjective testing and regression to map QoE metrics onto PLR and jitter. The resulting mathematical functions, and the theory of error propagation, were used to evaluate the error propagated to QoE. This error in estimated QoE was represented as confidence interval width. Using the guidelines of UK government for sampling in a busy hour, our results indicate that confidence intervals around estimated the Mean Opinion Score (MOS) rating of QoE can be between MOS = 1 to MOS = 4 at targeted operating points of the QoS parameters. These results are a new perspective on QoE evaluation and are of potentially great significance to all organisations that need to estimate the QoE of VoD applications precisely.
1. Introduction
The rise in popularity of Video-on-Demand (VoD) applications such as Netflix, Amazon and YouTube have resulted in an increase in traffic over the internet. Netflix alone has over 170 million paid subscribers in 2019 and is projected to grow significantly in the future [1]. The increase in traffic generated by VoD has motivated academic and industrial researchers to improve the infrastructure for better user experience. Researchers are now focusing on Quality of Experience (QoE) for quality evaluation of Over-The-Top (OTT) media applications, rather than just concentrating on the more traditional Quality of Service (QoS) metrics of latency, jitter and loss. Huawei and Telefonica are collaborating on projects such as end-to-end QoE evaluation, in which user perception will be key in shaping and improving their future services [2]. Other projects like Video QoE using Ubiquitous-video Mean Opinion Score (U-vMOS), are aiming at comprehensive real-time QoE evaluation for different network service providers [3]. Recently Witbe launched “Witbe on the go” that enables the user to determine the QoE at any location in London, for any service provider of VoD applications [4].
The fundamental performance of any packet network at layer 3 can be understood through the QoS parameters packet loss, latency (packet delay) and jitter. These QoS parameters are usually agreed in Service Level Agreements (SLAs) with the network or service providers. For this reason, network and service providers measure the network (either passively or actively) to monitor the levels of these QoS parameters. The most widely used technique is active measurements, which is achieved through packet probing. Active measurements employ statistical sampling and are therefore subject to sampling error [5,6,7].
QoE depends on the level of the QoS metrics, and these (QoS metrics) are therefore the independent variables. When any study in the physical, biological or psychological sciences measures how a dependent variable changes with an independent variable, there is always an attempt to capture how errors in the measurement or evaluation of the independent variable will affect the evaluation of the dependent variable [8,9,10]. In the case of this paper, the independent variable(s) are the QoS measures of PLR or jitter, or both combined. The dependent variable is QoE, measured on a MOS scale.
The fashion in which the sampling errors in QoS propagates to QoE depends on the mathematical function that links them. Considerable previous work, including Roshan [11], Khorsandroo et al. [12], Saputr and Hendrawan [13] and Pal and Vanijja [14], have already investigated how these QoS parameters affect the QoE for VoD applications. The authors in [11,12,15] report that the results of subjective tests can be evaluated as MOS and can be used to map QoE to different QoS parameters like PLR and jitter. All these studies concluded with their own independently derived mathematical relationship between QoE and QoS.
Since it is already established that QoS parameters can be measured actively and are subject to sampling errors, these errors propagate to QoE when evaluating QoE for different QoS parameters. There is currently no literature that report the propagation of the errors in independent QoS variable through to dependent variable QoE. This paper addresses that fundamental limitation in the literature associated with QoE evaluation in networks. We build on earlier work (mapping QoE to different QoS parameters) to show how sampling errors in the measured QoS metrics propagate through to the estimated QoE. The importance of this is that networks/service providers are provided with a technique through which they can bound errors in the estimated QoE when the QoE is derived from a pre-existing mathematical relationship between QoS and QoE. This is in contrast to the current situation in which QoS metrics are measured, and then QoE predicted from them, without any way to understand or bound the precision of these QoE predications.
In this paper, to ensure we are focusing on realistic values we use data acquired (using active packet sampling) by our industrial collaborator, Teragence. Teragence has collected all the QoS data measurements used in this research. Their data was composed of measurements of QoS parameters (packet loss and delay jitter) for cellular networks in the UK. We have used Teragence’s data in the following ways:
- We evaluated Goodness of Fit (GoF) tests to determine that the measured latency (delay) distributions are lognormal in shape—this information fed into programming our use of NetEm.
- We determined the correlation between PLR and jitter measurements. Our overall concern in studying correlation between QoS metrics is to determine how that correlation affects the error propagation to the dependent variable (QoE), so we consider the correlation between the independent variables of loss and jitter.
Within the field of packet networking research remarkably little has been published on the correlation between QoS metrics [16], and this paper also makes a contribution in this area by using the real network data provided by Teragence to evaluate actual correlation levels between QoS metrics.
We then propose a novel technique to quantify the statistical error in the evaluated QoE functions. The technique we use is in line with earlier work on how a dependent variable is affected by errors in the measurement of the independent variable(s)—the propagation of uncertainty. The sampling error (uncertainty) in QoE is expressed as 95% Confidence Intervals (CIs) because investigation into all scientific research reveals that 95% CIs are the default values for showing uncertainty in scientific results [17,18].
As we used NetEm in subjective testing, we have also evaluated the uncertainties caused by the sub-optimal performance of NetEm itself. We evaluated the effect of these errors on the QoE and again (for consistency) reported results as 95% confidence interval width. Moreover, we have also reported variations in the QoE due to perception of the users at different PLR levels using distributions and Standard deviation of Opinion Score (SOS).
The remaining paper is organised as follows: In Section 2, we present related literature elaborating the dependence of QoE of VoD on QoS parameters and highlight the possible causes of sampling errors in QoS measurements. Section 2 also presents the literature related to the need for uncertainty analysis. Section 3 describes the methodology followed in this research, while results and discussion of the outcomes of this research was presented in Section 4. Finally, Section 5 concludes this paper and discusses the scope of future work.
2. Related Work
As reported by Cisco [19], video data transmission has variable-bitrates. This results in periods of spikes in traffic followed by periods of low traffic transmission, and hence video traffic is considered as bursty. Conventionally, User Datagram Protocol (UDP) is more suitable for the task of video transmission. However as the type of video traffic became more dynamic with the introduction of new types of codecs and an increase in the user bandwidth and larger receiver buffers for accommodating extra TCP traffic, UDP has been replaced by TCP for new video applications like YouTube [20]. VoD applications working over both UDP and TCP show great dependence on the network QoS parameters like packet loss and jitter. As reported in [11,12,13,14,15], the increase in PLR and jitter results in degradation of video quality.
Researchers in [11,12] have demonstrated the effect of PLR on the QoE of VoD applications. Using subjective QoE evaluation, they concluded that the QoE of VoD degrades for increasing PLR levels. The author of [11] reported QoE as an exponential function of PLR and presented results for different age groups. Similarly, the authors of [12] used NetEm to evaluate the subjective QoE at different PLR levels. They reported QoE as a power-law function of PLR for MPEG-4 video codec over UDP. Moreover, Pal and Vanijja [14] reported how PLR and jitter affect different VoD frames, encoded using different codecs. Using recently developed codecs like VP-9 and H.265 and subjective testing, the authors of [14] demonstrated that QoE degrades for increasing PLR levels. They also reported QoE as exponential, logarithmic and polynomial functions of PLR. Similarly, the authors in [21] captured the data for different types of data traffic from mobile applications and presented the QoE of different application for different QoS parameters like PLR, delay and throughput. They also address the limitations of presenting QoE as Mean Opinion Score (MOS) and presented their results as the slope of the QoE for a certain QoS parameters and for different multimedia services.
As reported in [14], the QoE for VoD using the VP-9 codec degrades rapidly for small increments in jitter, and the relationship was found to be an exponential function. In contrast the authors in [15] report that QoE showed less sensitivity to increasing jitter magnitudes and decays slowly when jitter was increased. They presented their subjective QoE as a power-law function of jitter. This difference shows that different codecs, testbeds and regression algorithms yield different QoE and jitter models. Moreover, ref. [22] studies the combined effect of PLR and jitter on QoE of VoIP applications. The authors map their subjectively acquired QoE to PLR and jitter using polynomial regression and presented their results as 1st and 2nd order polynomials. We tried to reproduce the results of the polynomials by using different operating points (commonly used QoS magnitudes) of PLR and jitter but the published polynomial results were not reproducible, and hence the model is not used in this research for further analysis. No similar attempt has been reported mapping QoE to a multi-variable function of both PLR and jitter for VoD in the literature.
Subjective QoE is commonly evaluated using MOS [11,12,13,14,15]. The quantification of QoE as MOS has many limitations as highlighted by the authors in [23], and they represented QoE as Quantiles to elaborate the meaning of the perception to QoE evaluators. Evaluating perception just based on MOS is not necessarily representative as MOS represents a mean of the score and hides significant information about the underlying data set; hence presenting the QoE as Quantiles or distributions as done in [24] is more informational than using MOS alone. We propose a related idea here: to present the QoE with confidence intervals at certain QoS operating points for better understanding of perception of VoD applications and to overcome the limitations imposed by the wide use of MOS alone.
As discussed in [11,12,13,14,15], network QoS impacts the QoE of VoD significantly. Hence, it is important to measure QoS parameters accurately. Network measurement techniques are technically mature and discussed in detail in [6,7,25], but their accuracy is still the subject of ongoing research. Network measurement techniques were examined for statistical accuracy in [7]. The authors of [7] reported that the measurements of packet delay results in low accuracy when measuring a congested network using packet probes. The authors of [25] attempted to measure the packet loss using probes and reported that increasing the probe frequency compromises the accuracy of the measurement. A similar challenge was presented in [26] which reported that increasing the sampling rate causes probes to interfere with application traffic thus making the measurements prone to error. Roughan [27] has also reported bounds on the accuracy and precision of sampling packet loss, and has tried to quantify the error in packet loss using statistical techniques. The size of the probes, sampling frequency of the probes and the load on the network can also cause inaccurate measurements as presented in [28].
Since QoE can be presented as a mathematical function of one or more QoS parameters, it is possible to work out the sampling error propagated to QoE, if the sampling error in the measurements of QoS parameters is quantified. The detailed study of analytical propagation of error in a function, ref. [8], concludes that if the independent variables have errors in their measurements, then these measurement errors propagate to the dependent variable(s). In all branches of science and engineering, it is considered to be vital to quantify this uncertainty when quantifying the magnitude of the dependent variables.
Uncertainty Analysis
Uncertainty analysis is vital for all measurements and, as reported by the National Physical Laboratory, measurements are only complete with a complete reference to the uncertainty in the measurand [9]. In common with [5,6], we consider the uncertainty that derives from measuring QoS parameters using sampling. Since QoE can be represented as a mathematical expression in terms of QoS parameters using the uncertainty propagation techniques presented in [10], the uncertainty in QoE is investigated. The evaluation of the propagated uncertainty is commonly used in different fields of biochemistry [8], physics [9] and psychology [10].
In this paper, the propagation of the uncertainty depends upon the mathematical model that relates QoE to QoS metrics, and whether the QoS parameters under observation are considered to be independent of each other or correlated. Our analysis of real network measured data has shown that they are in fact correlated. A viable uncertainty analysis for correlated variables requires the distribution of the uncertainty in each variable.
3. Methodology
We present a methodology that was adapted to quantify the propagated uncertainty in QoE due to statistical errors in QoS parameter measurements. The QoS parameters considered in this paper are PLR and jitter. In this work, we considered PLR as purely random Bernoulli process, and jitter is defined as the standard deviation of the delay distribution.
3.1. Capturing QoS Measurements
The cellular measurement data used in this work was captured by Teragence using sampling. The captured data consist of measurements of PLR, delay, jitter, the location of the mobile device and the mobile operator. We did not consider delay, location and the mobile operator in this work, as PLR and jitter are relatively stronger influencing factors of the QoE of VoD applications [29]. All the measurements used in this paper were treated as anonymous in accordance with the privacy policy of the UK.
The measurements use packet probing via the android mobile application installed in the user device. The probing packets travels through the network and are captured at the servers, where the packets are processed to retrieve different measurements and are stored in a database. The administered access to the database was provided to us by Teragence to use their measurement data for analysis in this paper. We cannot disclose the details of the setup further due to commercial confidentiality.
3.2. Sampling Error in Packet Loss Ratio
In this paper, we assume that PLR is a random process that follows a Bernoulli distribution as reported in [7,11], i.e., loss is modelled as a simple random process. The probability for the packet to be dropped is p and the probability for the packet being successfully being received is . Since the whole population of the packets is not available, and the measurements are taken by sampling, the asymptotic standard error of is used, see Equation (1).
where, p = packet loss probability and n is the number of samples.
3.3. Sampling Error in Jitter
In this paper, as in [14,15], we focus on jitter as being the standard deviation of the delay distribution. We used measurement data from Teragence to determine the delay distribution of the samples. It was found that the delay distribution follows a lognormal distribution.
In [30] the authors derived an expression for the standard error of the estimated standard deviation of a sample. Since the standard deviation is a measure of variation, and in such case the type of distribution does not affect the analysis [10]. From this, we used Equation (2) to determine the uncertainty in jitter (standard error of the standard deviation)
In Equation (2), n represents the sample size and shows the standard deviation of jitter. The standard error of the jitter will be used in the appropriate formula as the measure of uncertainty for jitter in this paper.
3.4. Correlation of Packet Loss and Jitter
As described earlier QoS parameters can exhibit correlation and this correlation can be quantified using the Pearson Correlation Coefficient (PCC) or the Spearman Rank Correlation Coefficient (SRCC). PCC measures linear correlation between quantities while SRCC evaluates non-linear correlation.
We calculated the PCC and the SRCC from the QoS measurement data acquired from the measurements for different UK network service providers. Both the PCC and the SRCC can be any value between −1 and 1, where −1 shows that the two quantities are completely negatively correlated and 1 shows that they are completely positively correlated, while 0 means that there is no correlation between the two quantities.
We used a million data points for each of the 4 leading UK network providers over a period of almost one month and then calculated the PCC and the SRCC between the PLR and jitter measurements. The data sets were anonymous in alignment with data privacy rules, and the measurements of jitter and PLR were used to calculate the results presented in Table 1.
We found that all 4 major UK network providers exhibit different levels of linear and non-linear correlation. Table 1 also shows further that the jitter and PLR exhibit non-trivial (10–40%) levels of correlation. This makes it critical to take this correlation in account while investigating the propagation of the uncertainty in QoE. Therefore, we considered the correlation between PLR and jitter to evaluate propagated statistical error in QoE. Later, our results show that although there is a noticeable linear correlation between QoS parameters, this correlation has insignificant effect on propagated error in QoE of VoD applications.
3.5. QoE Models for Video on Demand Applications
VoD applications like video streaming employing UDP were used to map the effect of changing QoS parameters on QoE. We used the Linux-based network emulator NetEm to change the magnitudes of PLR and jitter. Our testbed includes a host Dell computer streaming the video to the subject Dell computer via NetEm via Ethernet cables. VLC was used as a media player to stream the video between the host and subject machines.
We decided not to make use of default NetEm delay distributions due to their limitations as mentioned in [31]. Rather we used measurement data from Teragence to determine the delay distribution. It was found that the empirical delay distribution follows a lognormal distribution. Different delay distributions were obtained from the empirical data, and these provided a platform to generate delay distributions whose inherent variability provided different realistic “jitter patterns” for the emulations.
At the initial testing of the NetEm testbed, it was observed that larger jitter values (larger than half of the mean delay) introduce packet reordering in the emulated packets. Since we only wanted to see the impact of jitter without packet reordering, we increased the rate function in NetEm. We also added a constant delay to the distribution so that, jitter values never get larger than half of mean delay. This ensures that the jitter patterns remained the same without packet reordering. However, it does increase the mean delay of the delay distributions. This does not affect the outcome of the experiments since a constant delay is not an influencing factor for QoE of video streaming as reported in [29]. We tested this by streaming the test video using constant delay and no effect on quality was recorded apart from longer start time.
A 2 min long video of a car advertisement was used in this study fulfilling the spatial and temporal information requirements mentioned in ITU-T recommendation P.910 [32]. The video was encoded using lossless H.264 and a frame rate of 30 fps was configured. The resolution was set to 720p and fixed bitrate of 1200 kbps was used in all experiments. Moreover, the lighting of the room was set according to ITU-T recommendation BT.500 [33] and the subjective testing was carried out using ITU recommendation P.910 for subjective multimedia testing.
We used subjective testing to evaluate the QoE of video streaming at different PLR and jitter magnitudes. A minimum of 4 subjects are recommended by ITU-T for subjective testing of videos in P.910. We use 26 subjects in this investigation with ages between 18 and 45 and with no visual disabilities. Each subject was shown the video at five different operating points of PLR and jitter without telling them the network configuration to avoid bias. At the end of the video, the subjects were asked to rate the video according to Absolute Category Rating scale and the rating were used to calculate the MOS at that network configuration. Only one network parameter was changed at one time to see the effect of each parameter on QoE individually. No prior training was required and the total time taken by 1 subject was almost 25 min.
The collected data of MOS and regression analysis was used to derive the QoE expressions in terms of PLR and jitter. Since this is not the main focus of this research and we will not go into details of the performance of these models and see [11] for details. From these experiments, Equations (3) and (4) present QoE in terms of PLR and jitter, respectively.
In Equation (3) PLR is measured as a ratio of lost packets to total sent packets. The fitting parameters for regression were Sum of Squares Due to Error (SSE) = 0.12, R-square = 0.89 and adjusted R-square as 0.92.
In Equation (4) jitter is measured in milliseconds and the fitting parameters for the regression were SSE = 0.11, R-square = 0.92 and adjusted R-Square = 0.94.
The SSE shows the error between the original QoE data and the fitted curve. The magnitude of the fitting parameters (SSE, R-square) indicates that the models are indeed good but not optimal. We understand these errors will also result in variations of QoE at certain operating points of PLR and jitter. We will not focus on these fitting errors in this research and will concentrate on the sampling errors in QoS measurements that propagate to estimated QoE. In addition to this, there are inherent variations in QoE due to fluctuations in the subjective perception of subjects. These variations were analysed, and the observations were reported later in this paper.
3.6. Our Approach to Evaluating Uncertainty in QoE due to Statistical Errors in QoS Measurements
We adapted the relationship reported in [8] to evaluate the uncertainty in QoE due to sampling error in QoS metrics is given here as Equation (5).
In Equation (5), PCC (PLR,jitter) is the Pearson Correlation coefficient between PLR and jitter calculated from the data set. It can be seen from this equation that the partial differential of QoE with respect to PLR and jitter is a key factor in evaluating the uncertainty in QoE, here evaluated as asymptotic standard error of QoE.
It can be seen from Figure 1 that, if the shape of the functional relationship between QoE and QoS is known, then for any small change in QoS, the resultant change in QoE can be determined. To find the propagated uncertainty we calculate partial derivative of QoE w.r.t QoS parameters and the asymptotic standard errors of PLR and jitter.
The approach to calculate the propagated uncertainty also depends on whether the dependent variables are completely independent of each other or have some correlation between them. If the measured values of PLR and jitter are considered to be independent of each other then the model proposed in Equation (5) can be simplified.
Since, we have already established that PLR and jitter has considerable (20–30%) correlation between them, we evaluate the asymptotic standard errors of QoE using Equation (5).
3.7. Using Confidence Intervals to Model Uncertainty in QoE
In this paper, we used 95% confidence interval because it is most commonly used by researchers for instance [23]. The confidence intervals depend on the sample size used in the study. In cases with the sample size smaller than 30, the T-distribution is used to evaluate the confidence intervals. In studies where the sample size is >30, the approximation of standard Normal distribution is used [17,18]. In this work, we used all the sample sizes to be >30. Thus, we will use standard normal distribution (Z-distribution) to evaluate confidence intervals, see Equation (6).
where: is the mean QoE as evaluated at the operating point, Z is the critical value for standard normal distribution and is 1.96 for 95% confidence interval and is the asymptotic standard error of QoE.
4. Results
Initially, we calculated the first derivative of the QoE (PLR) function and QoE (jitter) function presented in Section 3.5 as Equations (3) and (4), respectively. At targeted operating points for PLR and jitter, we calculated the first derivative of the functions. Our preliminary analysis reveals that uncertainty in QoE is highly dependent upon PLR and is almost completely unaffected by the shape of the jitter function, as it decays slowly. Consequently, we used 1000 operating point ranging from 0 to 0.05 for PLR and used only 4 operating points for jitter. We presented the first derivative w.r.t PLR at five operating points of PLR in Table 2 and the first derivative w.r.t jitter at operating points of jitter in Table 3.
The results presented in Table 2 and Table 3 supports the observation made in the preliminary analysis that the QoE of VoD applications is highly dependent upon the QoE’s response to change in PLR in comparison to the QoE’s response to change in jitter. Another interesting finding from Table 2 and Table 3 is that, for both PLR and jitter, when the magnitude of the operating points increases, the first derivative decreases. This supports the general shape of the QoE vs. QoS function as being close in nature to the one displayed in Figure 1 in Section 3.6.
Another important factor that affects the propagated uncertainty in QoE due to variations in PLR and jitter measurements is the sample size. We investigate the effect of different sample sizes on the magnitude of the resulting uncertainty in QoE. In this paper, we use 400, 800 and 1200 samples because the UK Government [34] recommends 800 samples per busy hour, and we consider it prudent to also consider a range above and below that recommended sample size.
4.1. Statistical Error Propagation in QoE considering Correlation between PLR and Jitter
We carried out an analysis to estimate the correlation between QoS parameters as presented in Table 4. We found that on average the UK network service providers have around 20–40% linear correlation (PCC) between their measured PLR and jitter. This level of correlation is significant and hence we considered it to evaluate the propagated asymptotic standard error of QoE for VoD applications.
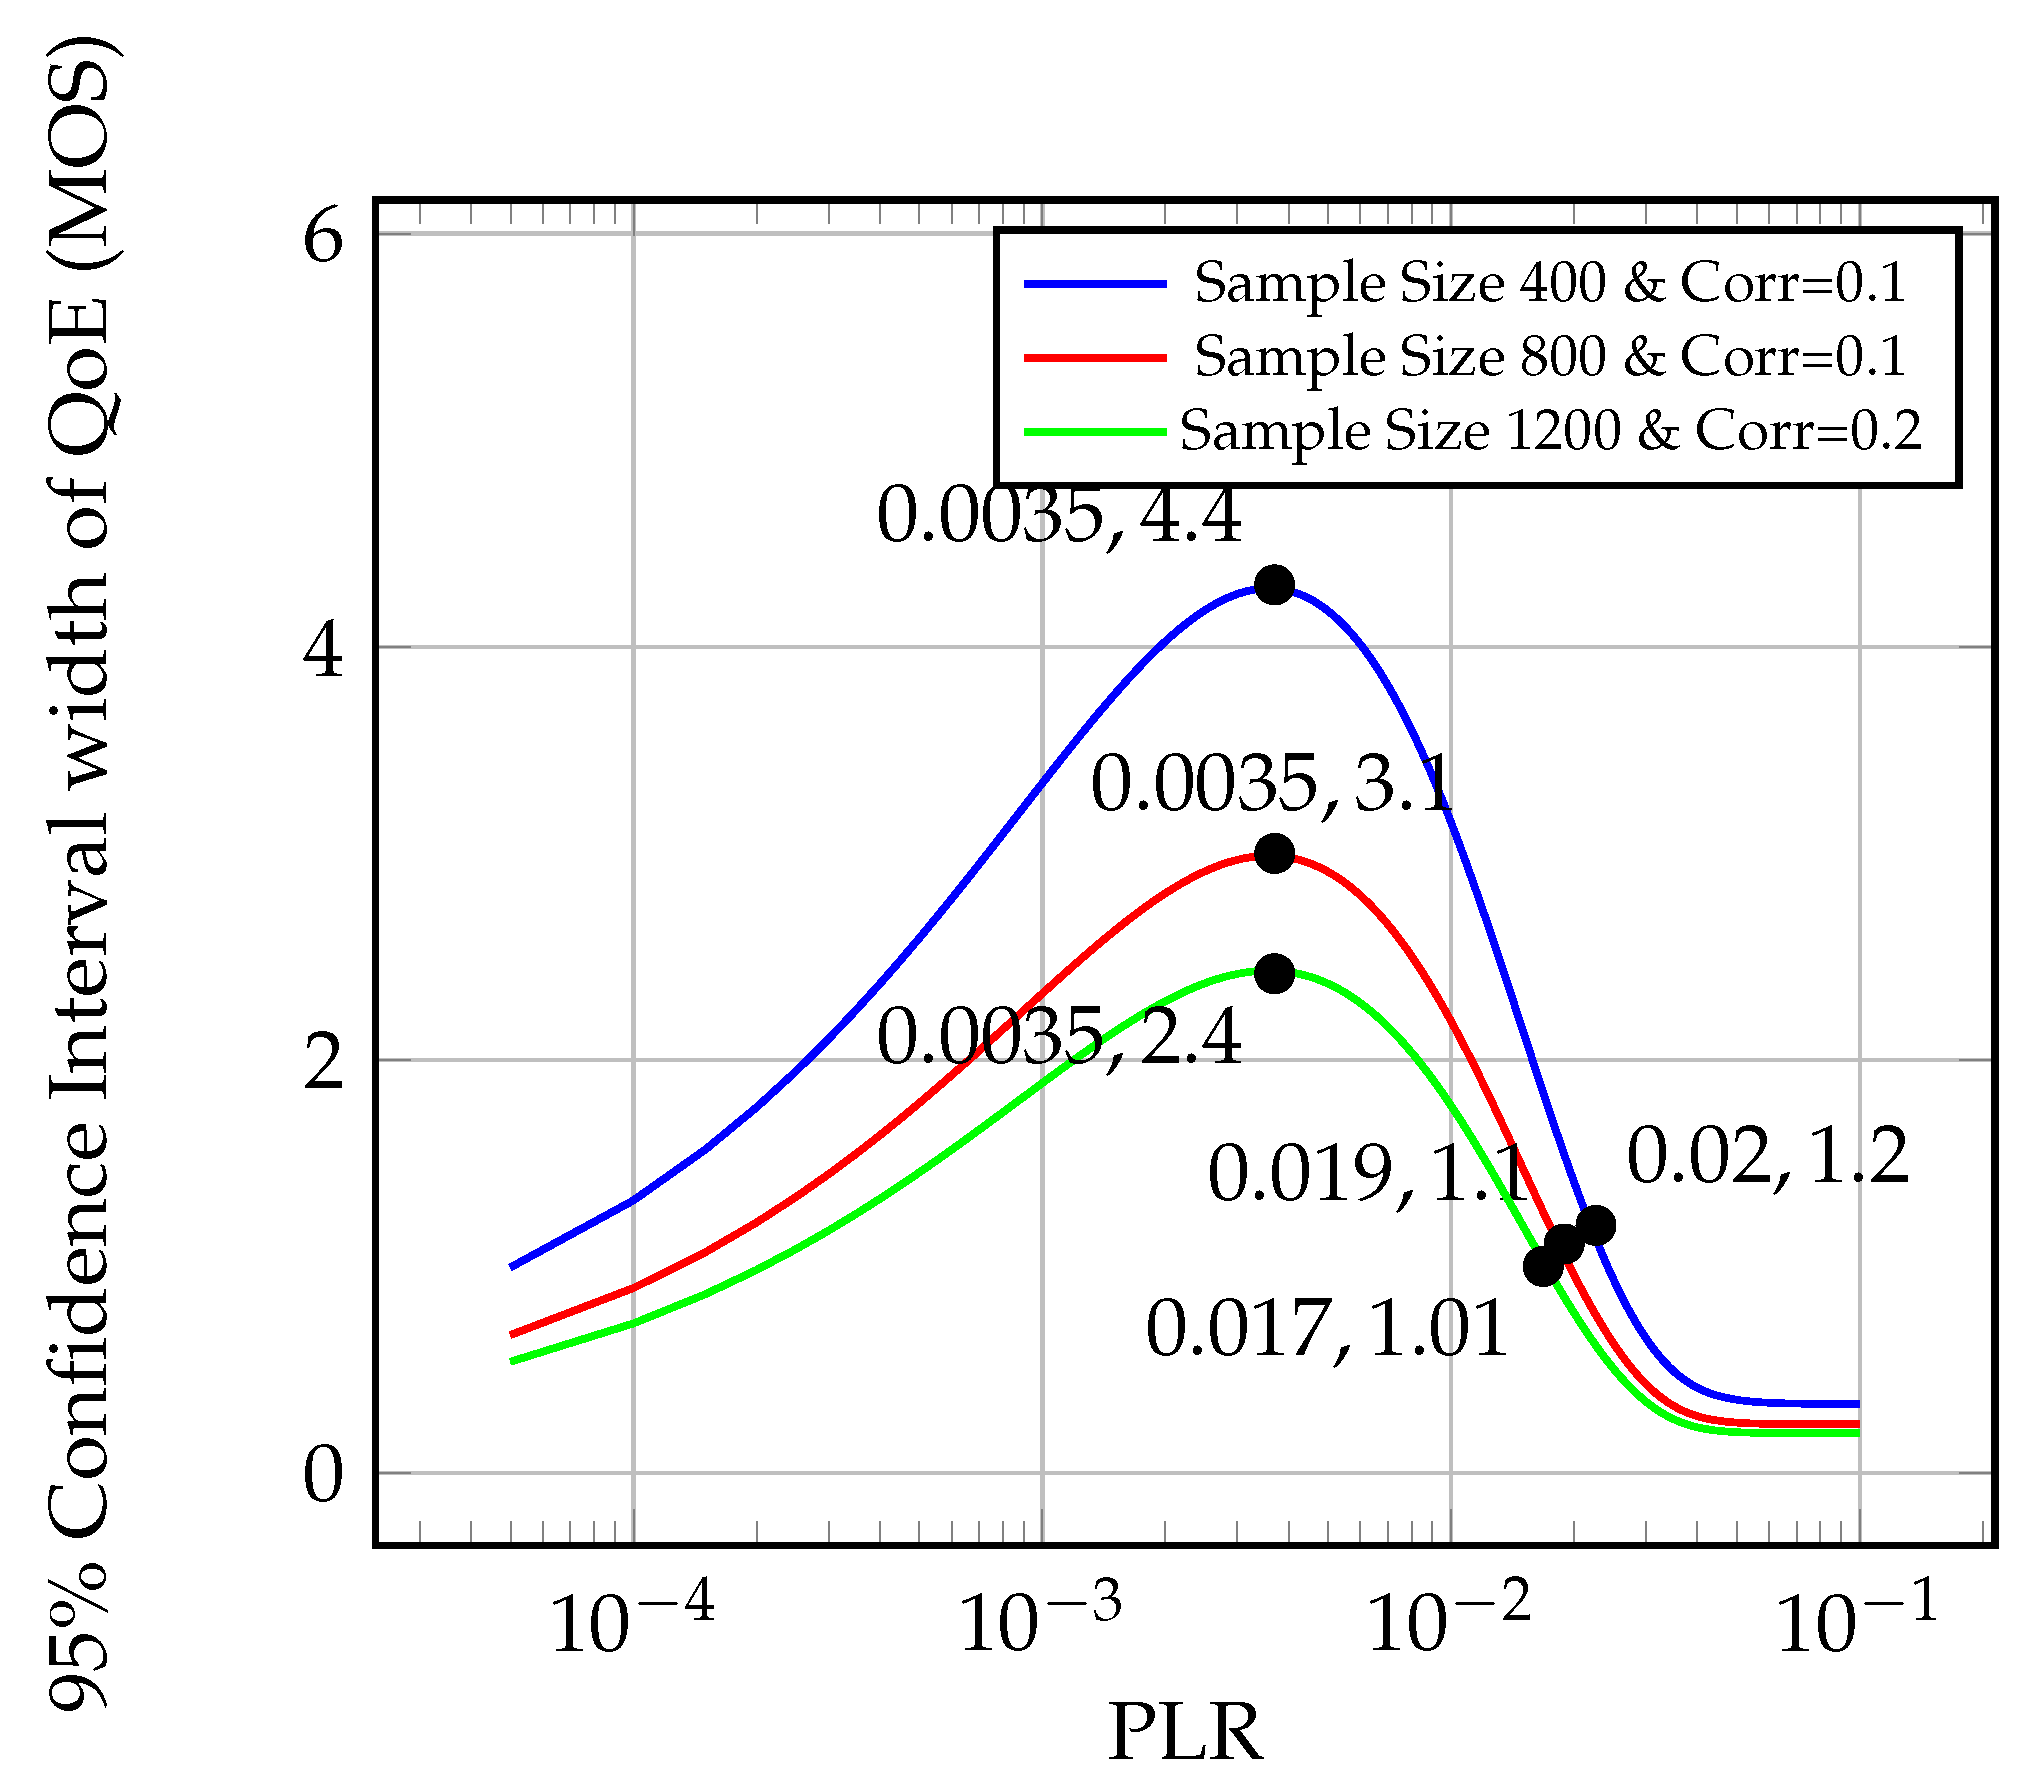
We took the sample sizes of 400, 800 and 1200 from the population of the commercially measured data. The measurements were anonymised by following the privacy policy and they were distributed over a period of almost 50 h. Using the evaluated PCC and Equation (5), we calculated the asymptotic standard error of the QoE at different operating points of PLR and jitter. This was used to evaluate the confidence interval width around mean QoE at operating points of PLR and jitter. The resulting confidence interval width of the QoE at a certain operating point of jitter was plotted against PLR and are presented in Figure 2 and Figure 3.
Based on further analysis we found that the confidence interval width is not affected by the jitter magnitude for the model presented in Equation (4). Hence, we only used the lower and upper limiting two values of jitter (10 ms and 80 ms) in our results for this model.
The trend in confidence interval width of QoE vs. PLR at all operating points of jitter is the same. We observe that:
- Uncertainty (measured as CI width) in QoE has a peak somewhere between PLR = 0.001 and PLR = 0.01: this has great significance for network and service operators, as the mean PLR written into most SLAs is around the value of PLR > 0.001 and PLR < 0.01 [35].
- Uncertainty (measured as CI width) in QoE rises to a peak between PLR = 0.001 and PLR = 0.01, and then rapidly diminishes as PLR either increases or decreases.
- This shape is constant regardless of the jitter value, from very small (10 ms) to very large (80 ms) jitter values.
- The shape is also consistent regardless of the values of PCC, from very small (10%) to relatively larger (30%).
- The absolute predicted values of 95% CI width in QoE decreases for increasing sample size. However, for sample size 800 (UK sampling guideline) CI width in QoE is large and peaks at around 3 units of MOS.
The CI width of the QoE is large between PLR > 0.001 and PLR < 0.01. PLR = 0.001 to PLR = 0.01 is the most common operational magnitude of PLR in real network operation and are recorded in the SLAs for VoD applications [35]. For instance, for sample size 800 the propagated CI width is 3 MOS units at PLR = 0.0035. This means that if we sequentially evaluate MOS at PLR = 0.0035 we know that 95% of these evaluated MOS values will lie between MOS = 4 and MOS = 1. This is significant uncertainty in the evaluated QoE. This signifies that it is very important to consider the sampling errors to evaluate QoE more accurately.
Moreover, at relatively low and high PLR values the CI width was found to be significantly lower when compared to PLR > 0.001 and PLR < 0.01. This is because at very low PLR levels (PLR ≈ 0) perceived quality is consistently high (MOS = 5) and critically the value of is very small. The same holds true for high PLR levels (PLR > 0.05) where the QoE is consistently low (MOS = 1) and again is very small; hence, in both cases the propagated statistical errors are very small. Whereas in the region between PLR > 0.001 and PLR < 0.01, is large and hence the propagated errors in QoE are significantly larger. A very similar observation was reported in [36] where authors showed that the QoE varies mostly in the middle of the scale. Additionally, this is attributed to the use of an exponential function to model QoE, as exponential functions inherently have more variations at low PLR and are consistently low at high PLR levels.
Figure 2 and Figure 3 support our preliminary analysis, and it can be seen that with such a large increase in jitter values from 10 ms to 80 ms there is no significant change in the QoE confidence interval width. This does not mean that jitter does not affect the QoE of VoD applications, as increase in jitter magnitude results in degradation of QoE for VoD as demonstrated in Figure 1. Moreover, the slope of the QoE (jitter) function is significantly steeper at jitter = 10 ms as compared to the slope at jitter = 80 ms. Even then >> at all jitter magnitudes. It means that the propagated statistical errors in QoE depends almost entirely upon the variations in QoE with PLR (which is large) while the statistical error in QoE with jitter is relatively small and can be considered to be insignificant for the models used in this paper.
We extended this error propagation analysis further and considered a more sensitive QoE (jitter) model of VoD. This published model presented in Equation (7) shows a greater value for increasing jitter values, such that for jitter = 1 ms the MOS = 5 and it rapidly degrades to MOS = 1 when the jitter increases to 5 ms [14]. Another reason for choosing this model is that it is also an exponential function, similar to the QoE (jitter) function used in this investigation.
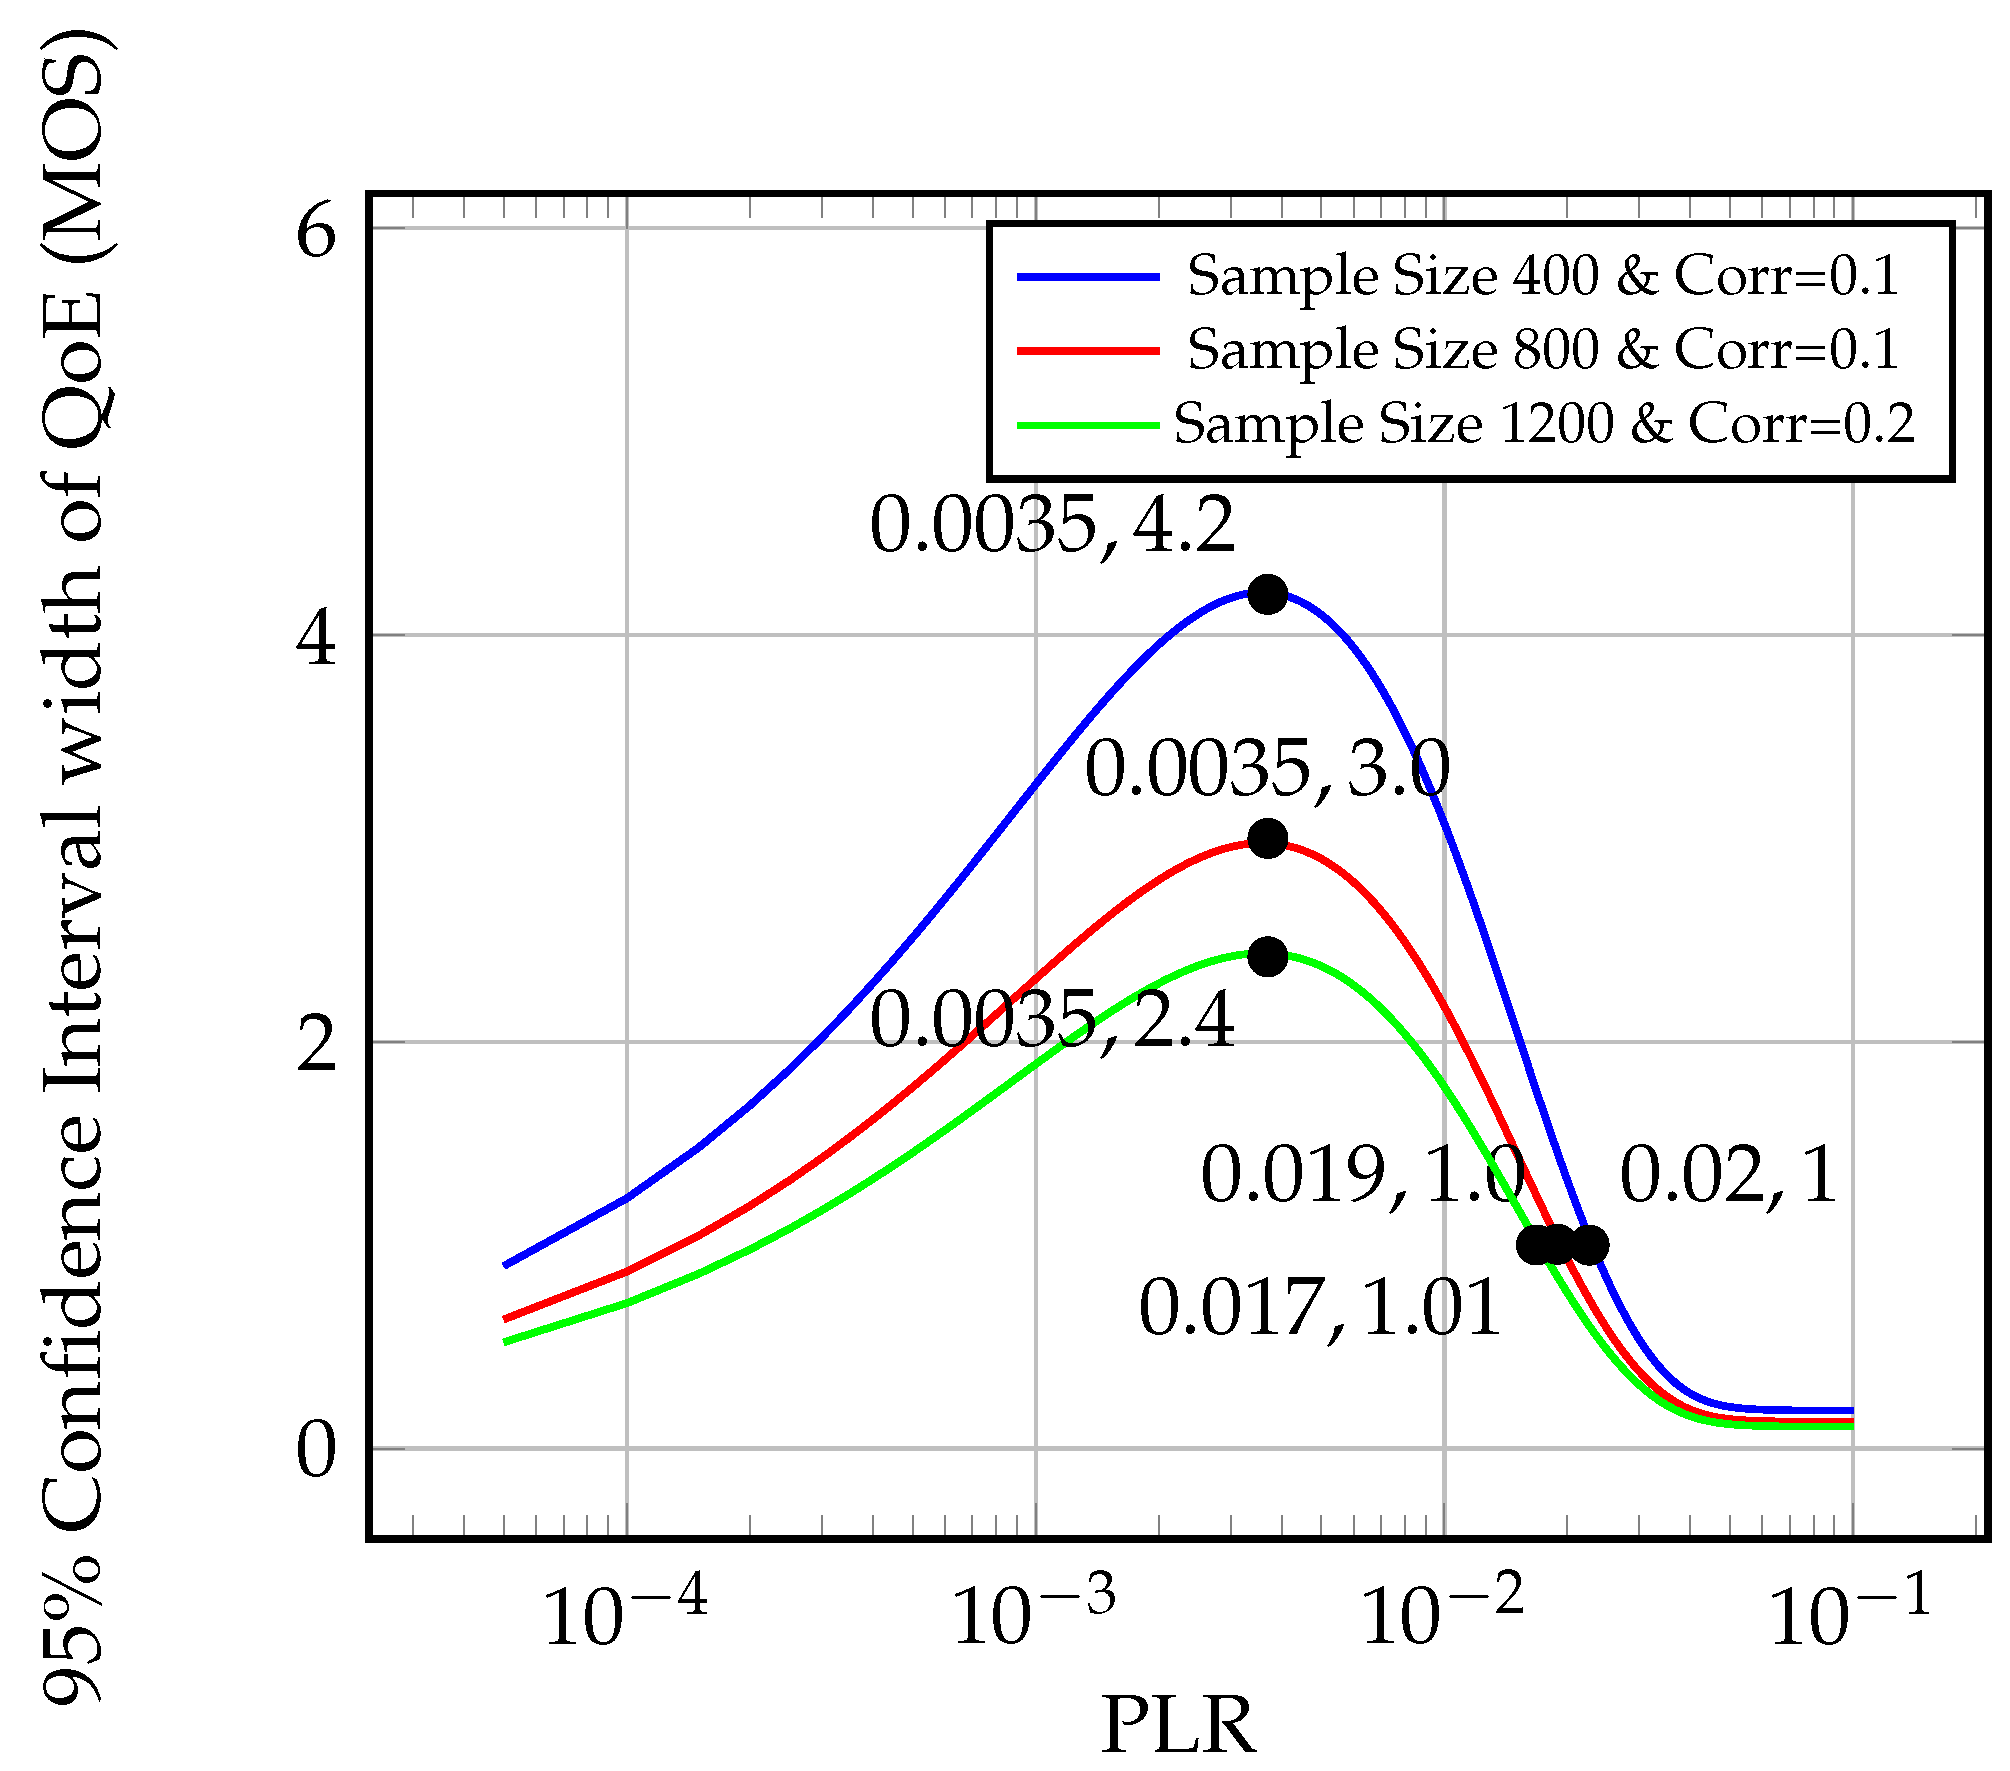
We evaluated this model using the same methodology and used Equation (5) to work out the asymptotic standard error and then confidence interval width of QoE for different operating points of PLR and jitter. Similarly, we used the lower and upper limiting two values of jitter (1 ms and 5 ms) in our results for this model. The results were plotted against PLR and presented in Figure 4 and Figure 5.
It is important that, the results from using this new jitter model (shown in Figure 4 and Figure 5) show insignificant variations from the results in Figure 2 and Figure 4. It is evident from Figure 2, Figure 3, Figure 4 and Figure 5 that even using the more sensitive exponential function of QoE (w.r.t. jitter), the CI width of QoE of VoD application is not significantly affected. We examined this by using two different QoE (jitter) models: one (Equation (4)) in which QoE degrades gradually with increasing jitter and second (Equation (7)) in which QoE degrades sharply with increasing jitter. For instance, of Equation (4) at jitter = 10 ms is −0.06 whereas, of Equation (7) at jitter = 1 ms is −2.42. Finding the ratio of slopes of Equation (4) and Equation (7) reveals that the slope of the QoE (jitter) model in Equation (7) is ≈50 times greater than the slope of QoE (jitter) model in Equation (4). Even with a significant increase in for Equation (7) no significant increase in propagated CI width of QoE was seen in Figure 4 and Figure 5. This is because of >> for both cases. Thus, for the VoD application modelled in this work using an exponential function the propagated statistical errors do not depend on jitter.
Although, there is around 10–40% correlation observed in all cases, in none of the cases the propagated confidence interval width of QoE changes significantly as a function of correlation. This can be explained using Equation (5) for both jitter models, where we can see that is squared and as described before the magnitude of is significantly higher than and hence the propagation of uncertainty for VoD QoE is mainly dependent upon the rapid change in QoE with PLR (about the operating point) rather than much slower change in QoE with jitter or correlation about the chosen operating points.
These results are a critical contribution to the process of QoE assessment, but are limited to the QoE evaluation of VoD applications modelled. The proposed technique can be used to model other multimedia applications, perhaps also as modelled using different mathematical functions i.e., power-law or polynomial. In addition, the results presented here consider QoE as a function of PLR and jitter separately. The analysis of correlation shows that they have a weak tendency to appear together and, in that case, the propagated errors in QoE will vary from the presented results in this work. For VoD applications modelled using an exponential function, we observed that the propagated statistical error show insignificant dependence on jitter, but in cases when jitter appears with PLR, we would expect different results for propagated errors.
4.2. Propagated Uncertainty in QoE due to Sub-Optimal Performance of NetEm
Another source of uncertainty in the evaluated QoE can be due to sub-optimal operation of NetEm to achieve the targeted QoS parameters, especially PLR. NetEm configures PLR by randomly dropping the packets and thus for a certain PLR setting a different number of packets can be dropped by NetEm in different experiments, even with the same PLP see [37]. This results in an uncertainty in the PLR that can also propagate to the evaluated QoE.
To monitor this variation in PLR using NetEm, we streamed the video 30 times at 5 different PLR configurations and recorded the traffic sent using Wireshark. We used the data collected by Wireshark to evaluate the standard error in PLR due to the sub-optimal operation of NetEm. In addition, we calculated the relative standard error in PLR by taking the ratio of the standard error to the PLR configuration. We then used Equation (5) and the standard error in PLR to evaluate the propagated error in QoE due to NetEm variations in PLR. The evaluated results were used to calculate the confidence intervals and are presented in Table 4.
The results in Table 4 show that, as the targeted PLR increases, the standard error in PLR due to NetEm increases. This is caused by the random process by which NetEm drop packets. This means that at higher PLR levels, there is a higher quantitative variation in the number of packets lost in comparison to a lower PLR configuration. On the other hand, the relative standard error in PLR decreases for increasing PLR levels. This shows that there is a higher relative variation in PLR from the targeted values at smaller PLR configurations. For instance, the relative standard error in PLR was higher at PLR = 0.05% and PLR = 0.1%, and as discussed earlier, these are the key operating points of PLR because QoE shows great sensitivity to PLR at these levels.
Moreover, the results in Table 4 show that the propagated statistical errors in QoE due to standard error in PLR because of the sub-optimal performance of NetEm are quantitatively insignificant. These propagated errors are relatively higher at lower PLR levels than at higher PLR levels. The small magnitudes of propagated standard errors and CI width show that the uncertainties imposed by the sub-optimal performance of NetEm do not affect the QoE evaluation significantly. This indicates that the sampling errors in QoS measurements affect QoE evaluation significantly as compared to errors due to the sub-optimal performance of NetEm.
Furthermore, we model jitter using custom delay distributions, as described earlier in Section 3. After evaluating the results in Section 4.1, we observed that uncertainty in jitter does not affect the propagated statistical errors in QoE of VoD modelled using an exponential function. Therefore, we didn’t evaluate the errors in jitter caused by the sub-optimal performance of NetEm.
4.3. Variation in QoE Evaluation Due to Perception
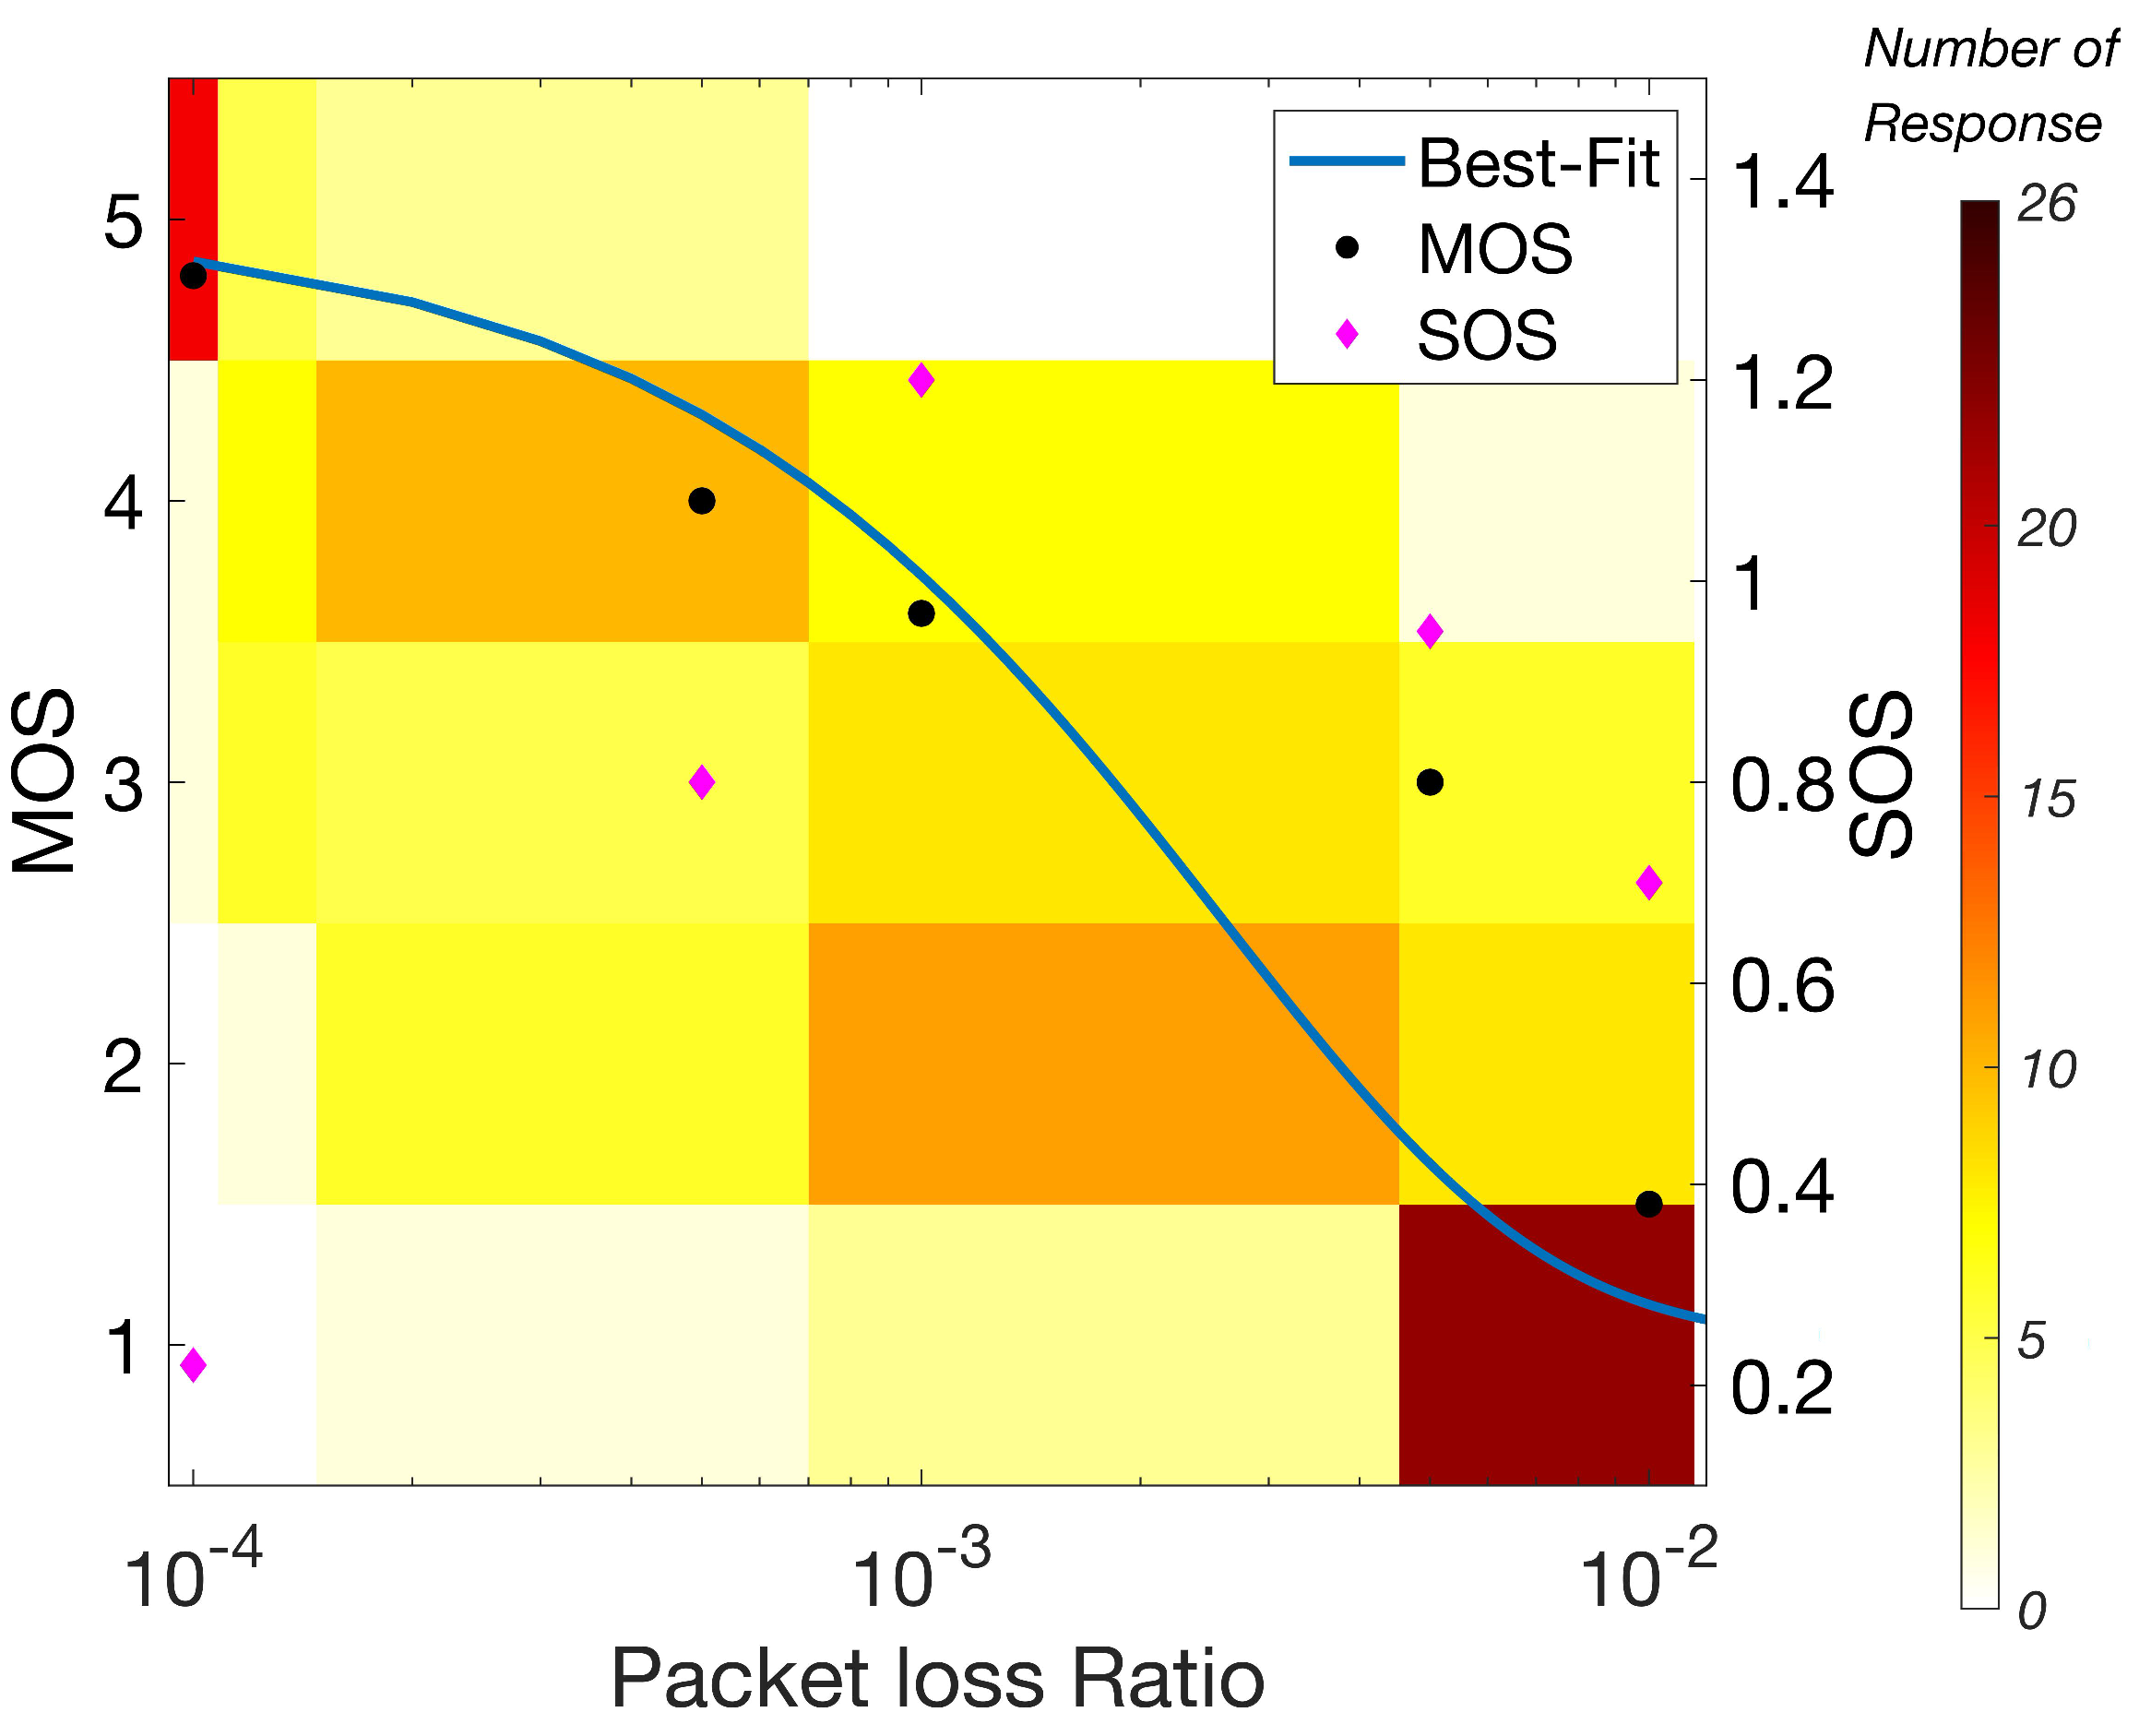
Different users perceive quality differently even if the underlying QoS parameters remain unchanged. These variations in the perception can result in fluctuations in QoE and can be addressed by finding the standard deviation of the Opinion Score (SOS) at a certain QoS configuration as recommended in [36]. Moreover, presenting the individual score of each user can show the distribution of the QoE at a certain PLR. In Figure 6, we addressed this by plotting the MOS, SOS and QoE distributions vs. PLP at 10ms jitter. Using these results, we tried to evaluate the effect of variations in perception at different PLR values and then compare them with the propagated sampling errors and propagated NetEm error in QoE.
In Figure 6 it can be seen that SOS is maximum between PLR = 0.001 and PLR = 0.01 and decreases sharply on both sides. This shows that user-rating exhibits more consistency at lower and higher magnitudes of the PLR. The opinion score distribution also highlights this finding, for instance at PLR < 0.0001, 25 subjects out of 26 ranks the video Good (MOS = 4) or Excellent (MOS = 5). The same is true for higher values of PLR as for PLR > 0.02, 25 subjects rank it Bad (MOS = 1). The region between PLR = 0.001 and PLR = 0.01 is of great interest for most service providers as it is the average magnitude of PLP agreed in the SLA, and the results show that user perceptions tends to vary significantly in this region. For instance, at PLR = 0.005, the MOS is equal to 3 but there are equal number of subjects that rank the video as MOS 4 or above and MOS 2 below.
Moreover, the SOS peak occurs in the same region that has the steepest slope of the MOS function. This shows the significance of using SOS and QoE score distribution rather than using MOS alone, as MOS loses a lot of important information by averaging the user score. In addition, SOS can be used to evaluate user-diversity as reported by author in [36]. The results in Figure 6 show that a small fluctuation in user-ratings at a particular network scenario can result in non-trivial SOS values. For instance, in the case of PLR = 0.0001, only two out of 26 subjects ranked video quality other than Excellent (MOS = 5), and this results in a SOS of 0.23. This poses a challenge to quantitively relate SOS to user-diversity for studies using a smaller number of subjects. In addition, most of the subjective studies do not employ a large number of subjects, as subjective tests can be expensive, laborious and time-consuming. Thus, it is useful to consider QoE distributions to evaluate user perception more accurately.
5. Conclusions
QoE is now widely accepted as providing a numerical proxy for actual user experience, and the literature has reported many mathematical mappings between QoS and QoE. Additionally, some papers have reported an evaluation of the statistical errors that arise when estimating QoS by sampling. However, no papers have reported on how error in sampling the QoS metrics propagates statistical error into the estimated QoE, which is vital for understanding how reliable are these estimated values of QoE.
In this paper we use state-of-the-art commercially measured loss and jitter values. From these we determine how to set up delay distributions in our network emulator, NetEm. We analysed the uncertainty in QoS due to suboptimal performance of NetEm and determined its effect on the QoE evaluation. Our results for this show that the errors due to NetEm do not significantly affect the QoE evaluation—for instance, the uncertainty in PLR increases at higher PLR configurations but at higher configuration QoE is closely consistent to MOS = 1. This shows that NetEm inaccuracies have a relatively trivial effect on QoE evaluation.
Our analysis has shown that the statistical error in the QoE is almost entirely the result of sampling error in PLR and not the sampling error in jitter. We evaluated the sampling error that arises during QoS measurements and determined the correlation between PLR and jitter. We used the theory of error propagation to evaluate the error that arises in the estimated subjective QoE and (in line with normal scientific practice) represented this error as 95% confidence interval width. To align our results with actual recommended networking practice we employed UK Government guidelines for the number of packet samples that are to be taken in a busy hour of network operation.
We found that the magnitude of the sampling error (expressed as QoE CI) changes significantly at different operating points. For instance, at very high or very low PLR operating points the propagated uncertainty is very small. However, at the key operating points around PLR = 0.001 and PLR = 0.01 the propagated uncertainty is significantly larger. A very similar observation was made when studying the variation in perception using SOS. The SOS was higher in the key range of operating points of PLR and diminishes rapidly on both sides. Most commercial SLAs specify a target PLR of 0.001 (on average) [35], so our discovery that this is a critical point around which QoE uncertainty is largest is potentially of great significance.
To date we have limited our attention to VoD, and it is for VoD that we have derived all our numerical results. However, sampling error is not application dependent, and so we anticipate that, whatever the application, error in sampling QoS metrics will result in sampling error being propagated to the estimated QoE values. Sizing the significance of this propagated error for different application types is a very interesting and significant area for future work.
Future Work
The results presented here are limited to QoE evaluation of VoD applications modelled using exponential functions. We planned to use the proposed approach on other video streaming applications i.e., passive gaming video streaming, video conferencing to reach a generic conclusion about how sampling errors in QoS affect QoE evaluation of different video applications. We also propose to use different modelling functions like power-law and polynomial functions to determine how modelling technique affects the propagated statistical errors in QoE.
Moreover, in this work, we considered the QoE models for loss and jitter separately in Equations (3) and (4). Our results show that PLR effects propagated statistical error significantly as compared to jitter. This work shows that jitter and PLR are weakly correlated and has a tendency to appear together but this work does not evaluate the statistical errors when they exist together. For separate jitter and PLR models, this correlation has an insignificant effect on propagated errors in QoS. We propose to extend this further to evaluate QoE such that we considers the correlation and then see how the statistical errors differ from the results presented in this work.
Furthermore, in this work, we have emulated packet loss as a random Bernoulli process. This poses limitations to the analysis as it does not mimic the real network behaviour. We propose to model and emulate bursty packet loss that takes place in real networks. In future, we planned to model QoE using bursty packet loss and compare the propagated statistical errors of newly yielded models with the current QoE model presented in this work.
Author Contributions
The idea of this project was proposed by J.S. and A.W. designed the experiments and carried out the analysis. N.A. contributed towards data analysis and correlation. All authors contributed towards writing and reviewing of the final manuscript. All authors have read and agreed to the published version of the manuscript.
Funding
No External funding was given for this research.
Acknowledgments
We are grateful to the School of Electronic Engineering and computer at the Queen Mary University of London for their help and support in this project. We extend our thanks to Raul Mondragon and Karen Shoop for their contributions in the project. We will also like to thank Teragence for their collaboration and providing us with the active measurement data.
Conflicts of Interest
There is no conflict of interest declared by this research or authors.
Abbreviations
The following abbreviations are used in this manuscript:
| ACR | Absolute Category Rating |
| CI | Confidence Interval |
| GoF | Goodness of Fit |
| ITU-T | International Telecommunication Union-Telecom |
| MOS | Mean Opinion Score |
| OTT | Over-the-Top |
| PCC | Pearson Correlation Coefficient |
| PLR | Packet Loss Ratio |
| QoE | Quality of Experience |
| QoS | Quality of Service |
| SLA | Service level Agreement |
| SOS | Standard deviation of Opinion Score |
| SRCC | Spearman Rank Correlation Coefficient |
| SSE | Sum of Squared estimate of Errors |
| UDP | User Datagram Protocol |
| TCP | Transport Control Protocol |
| VoD | Video-on-Demand |
References
- Watson, A. Number of Netflix Paying Streaming Subscribers World–Wide from 3rd Quarter 2011 to 4th Quarter 2019. Available online: https://www.statista.com/statistics/250934/quarterly-number-of-netflix-streaming-subscribers-worldwide (accessed on 12 February 2020).
- Telefonica: One Step Ahead in E2E QoE Assurance. Available online: https://www.huawei.com/uk/industry-insights/outlook286/customer-talk/hw_279053 (accessed on 24 August 2019).
- Wireline Video QoE Using U-vMOS. Available online: https://ovum.informa.com/$\sim$/media/informa-shop-window/tmt/files/whitepapers/huawei_wireline_video_online.pdf (accessed on 20 February 2020).
- Witbe QoE Snapshot #5—What Is The BEst neighborhood in London to Watch Videos on Mobile Devices? Available online: http://www.witbe.net/2019/05/14/snapshot5 (accessed on 1 March 2020).
- Timotijevic, T.; Leung, C.M.; Schormans, J. Accuracy of measurement techniques supporting QoS in packet-based intranet and extranet VPNs. IEE Proc. Commun. 2004, 151, 89–94. [Google Scholar] [CrossRef]
- Lan, H.; Ding, W.; Gong, J. Useful Traffic Loss Rate Estimation Based on Network Layer Measurement. IEEE Access 2019, 7, 33289–33303. [Google Scholar] [CrossRef]
- Parker, B.; Gilmour, S.G. Optimal design of measurements on queueing systems. Queueing Syst. 2015, 79, 365–390. [Google Scholar] [CrossRef] [Green Version]
- Ferrance, I.; Frenkel, R. Uncertainty of Measurement: A Review of the Rules for Calculating Uncertainty Components through Functional Relationships. The Clinical biochemist. Rev. Aust. Assoc. Clin. Biochem. 2012, 33, 49–75. [Google Scholar]
- Bell, S. Beginner’s Guide to Uncertainty of Measurements; National Physics Laboratory: Teddington, UK, 2013; pp. 1–10. [Google Scholar]
- Harding, B.; Tremblay, C.; Cousineau, C. Standard errors: A review and evaluation of standard error estimators using Monte Carlo simulations. Quant. Methods Psychol. 2014, 10, 107–123. [Google Scholar] [CrossRef]
- Roshan, M. Experimental Approach to Evaluating QoE. Ph.D. Thesis, Queen Mary University of London, London, UK, 2018. [Google Scholar]
- Khorsandroo, S.; Noor, R.; Khorsandroo, S. A generic quantitative relationship between quality of experience and packet loss in video streaming services. In Proceedings of the 2012 Fourth International Conference on Ubiquitous and Future Networks (ICUFN), Phuket, Thailand, 4–6 July 2012; pp. 352–356. [Google Scholar]
- Saputra, Y.M. The effect of packet loss and delay jitter on the video streaming performance using H.264/MPEG-4 Scalable Video Coding. In Proceedings of the 2016 10th International Conference on Telecommunication Systems Services and Applications (TSSA), Denpasar, Indonesia, 6–7 October 2016; pp. 1–6. [Google Scholar]
- Pal, D.; Vanijja, V. Effect of network QoS on user QoE for a mobile video streaming service using H.265/VP9 codec. Procedia Comput. Sci. 2017, 111, 214–222. [Google Scholar] [CrossRef]
- Ickin, S.; Vogeleer, K.D.; Fiedler, M. The effects of Packet Delay Variation on the perceptual quality of video. In Proceedings of the IEEE Local Computer Network Conference, Denver, CO, USA, 10–14 October 2010; pp. 663–668. [Google Scholar]
- Koukoutsidis, I. Public QoS and Net Neutrality Measurements: Current Status and Challenges Toward Exploitable Results. J. Inf. Policy 2015, 5, 245–286. [Google Scholar] [CrossRef]
- McDonald, J.H. Handbook of Biological Statistics. Available online: http://www.biostathandbook.com/confidence.html (accessed on 6 May 2020).
- Briggs, W. Uncertainty: The Soul of Modelling, Probability and Statistics; Springer: Berlin/Heidelberg, Germany, 2016; pp. 140–200. [Google Scholar]
- Video Quality of Service (QOS) Tutorial. Available online: https://www.cisco.com/c/en/us/support/docs/quality-of-service-qos/qos-video/212134-Video-Quality-of-Service-QOS-Tutorial.pdf (accessed on 1 January 2020).
- Verma, S. Flow Control for Video Applications, in Internet Congestion Control; Morgan Kaufmann Publishers: Burlington, MA, USA, 2015; pp. 173–180. [Google Scholar]
- Xu, Z.; Zhang, A. Network Traffic Type-Based Quality of Experience (QoE) Assessment for Universal Services. Appl. Sci. 2019, 9, 4107. [Google Scholar] [CrossRef] [Green Version]
- Orosz, P.; Skopko, T.; Nagy, Z. A No-reference Voice Quality Estimation Method for Opus-based VoIP Services. Int. J. Adv. Telecommun. 2014, 7, 12–21. [Google Scholar]
- Hossfeld, T.; Heegard, P.E.; Varela, M. QoE beyond the MOS: Added Value Using Quantiles and Distributions. In Proceedings of the 2015, Seventh International Workshop on Quality of Multimedia Experience (QoMEX), Pylos-Nestoras, Greece, 26–29 May 2015; pp. 1–6. [Google Scholar]
- Seufart, M. Fundamental Advantages of Considering Quality of Experience Distributions over Mean Opinion Scores. In Proceedings of the 2019 Eleventh International Conference on Quality of Multimedia Experience (QoMEX), Berlin, Germany, 5–7 June 2019; pp. 1–6. [Google Scholar]
- Mondragon, R.; Moore, A.; Pitts, J.; Schormans, J. Analysis, simulation and measurement in large-scale packet networks. IET Commun. 2009, 3, 887–905. [Google Scholar] [CrossRef]
- Sommers, J.; Barford, P.; Duffield, N. Improving accuracy in end-to-end packet loss measurement. In Proceedings of the 2005 Conference on Applications, Technologies, Architectures, and Protocols for Computer Communications, Philadelphia, PA, USA, 22–26 August 2005; pp. 157–168. [Google Scholar]
- Nguyen, H.X.; Roughan, M. Rigorous Statistical Analysis of Internet Loss Measurements. IEEE Trans. Netw. 2013, 21, 734–745. [Google Scholar] [CrossRef] [Green Version]
- Wahid, A.A.; Schormans, J. Bounding the maximum sampling rate when measuring PLP in a packet buffer. In Proceedings of the 2013 5th Computer Science and Electronic Engineering Conference (CEEC), Colchester, UK, 17–18 September 2013; pp. 115–118. [Google Scholar]
- ITU. ITU-T Rec. G.1032, “Influence Factors on Gaming Quality of Experience”; ITU: Geneva, Switzerland, 2017. [Google Scholar]
- Ahn, S.; Fessler, J.A. Standard Errors of Mean, Variance, and Standard Deviation Estimators. 2003. Available online: https://web.eecs.umich.edu/fessler/papers/files/tr/stderr.pdf (accessed on 15 December 2019).
- Jurgelionis, A.; Laulajainen, J.-P.; Hirvonen, M.; Wang, A.I. An Empirical Study of NetEm Network Emulation Functionalities. In Proceedings of the 20th International Conference on Computer Communications and Networks (ICCCN), Maui, HI, USA, 31 July–4 August 2011. [Google Scholar]
- ITU. ITU-R Rec.P.910 Subjective Video Quality Assessment Method for Multimedia Applications; ITU: Geneva, Switzerland, 2018. [Google Scholar]
- ITU. ITU-R Rec.BT.500 Methodologies for the sUbjective Assessment of the Quality of Television Images; ITU: Geneva, Switzerland, 2019. [Google Scholar]
- PSN Quality of Service (QoS) Testing and Reporting. Available online: https://www.gov.uk/government/publications/psn-quality-of-service-qos-testing-and-reporting/psn-quality-of-service-qos-testing-and-reportingtest-requirements (accessed on 10 December 2019).
- ITU. Telecommunication Development Sector. Quality of Service Regulation Manual; ITU: Geneva, Switzerland, 2017. [Google Scholar]
- Hossfeld, T.; Schatz, R.; Egger, S. SOS: The MOS is not enough! In Proceedings of the 2011 Third International Workshop on Quality of Multimedia Experience, Mechelen, Belgium, 7–9 September 2011. [Google Scholar]
- Lübke, R.; Büschel, P.; Schuster, D.; Schill, A. Measuring accuracy and performance of network emulators. In Proceedings of the 2014 IEEE International Black Sea Conference on Communications and Networking (BlackSeaCom), Odessa, Ukraine, 27–30 May 2014; pp. 63–65. [Google Scholar]
Figure 1.
Propagation of uncertainty in Quality of Experience (QoE) due to fluctuation in Quality of System (QoS).
Figure 1.
Propagation of uncertainty in Quality of Experience (QoE) due to fluctuation in Quality of System (QoS).
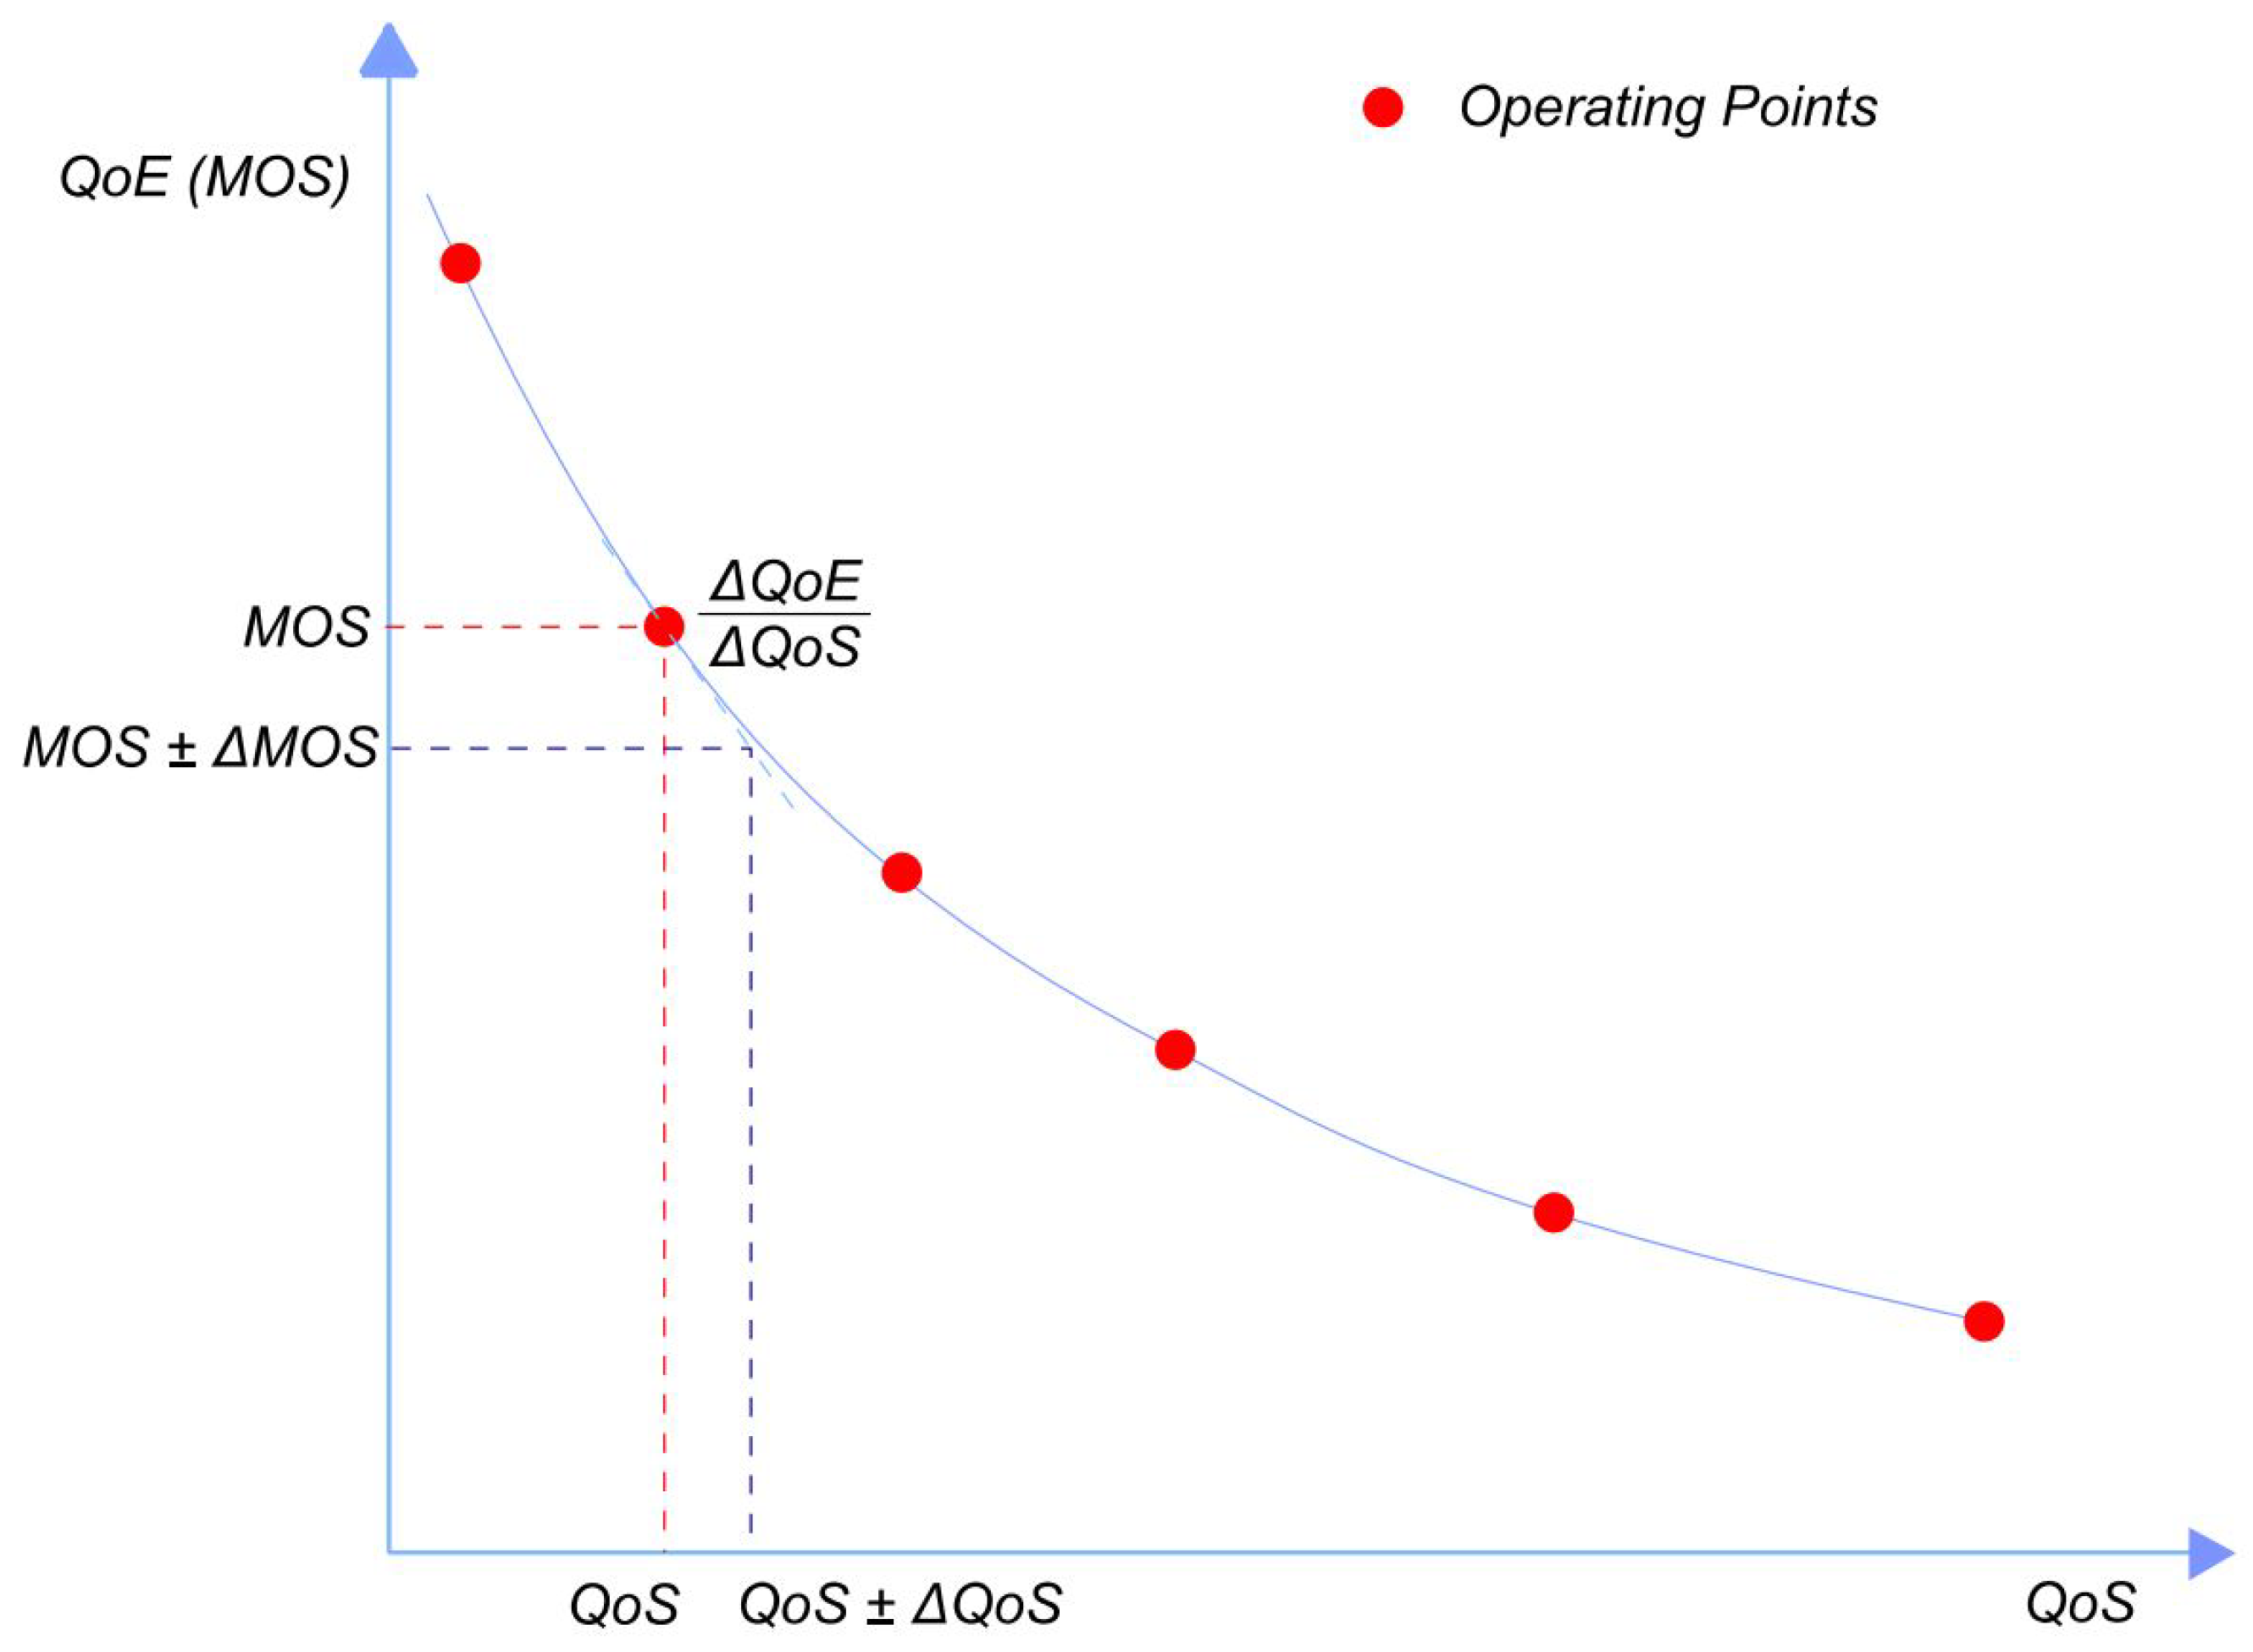
Figure 2.
Propagated uncertainty in QoE vs. PLR at jitter = 10 ms with correlation.

Figure 3.
Propagated uncertainty in QoE vs. PLR at jitter = 80 ms with correlation.
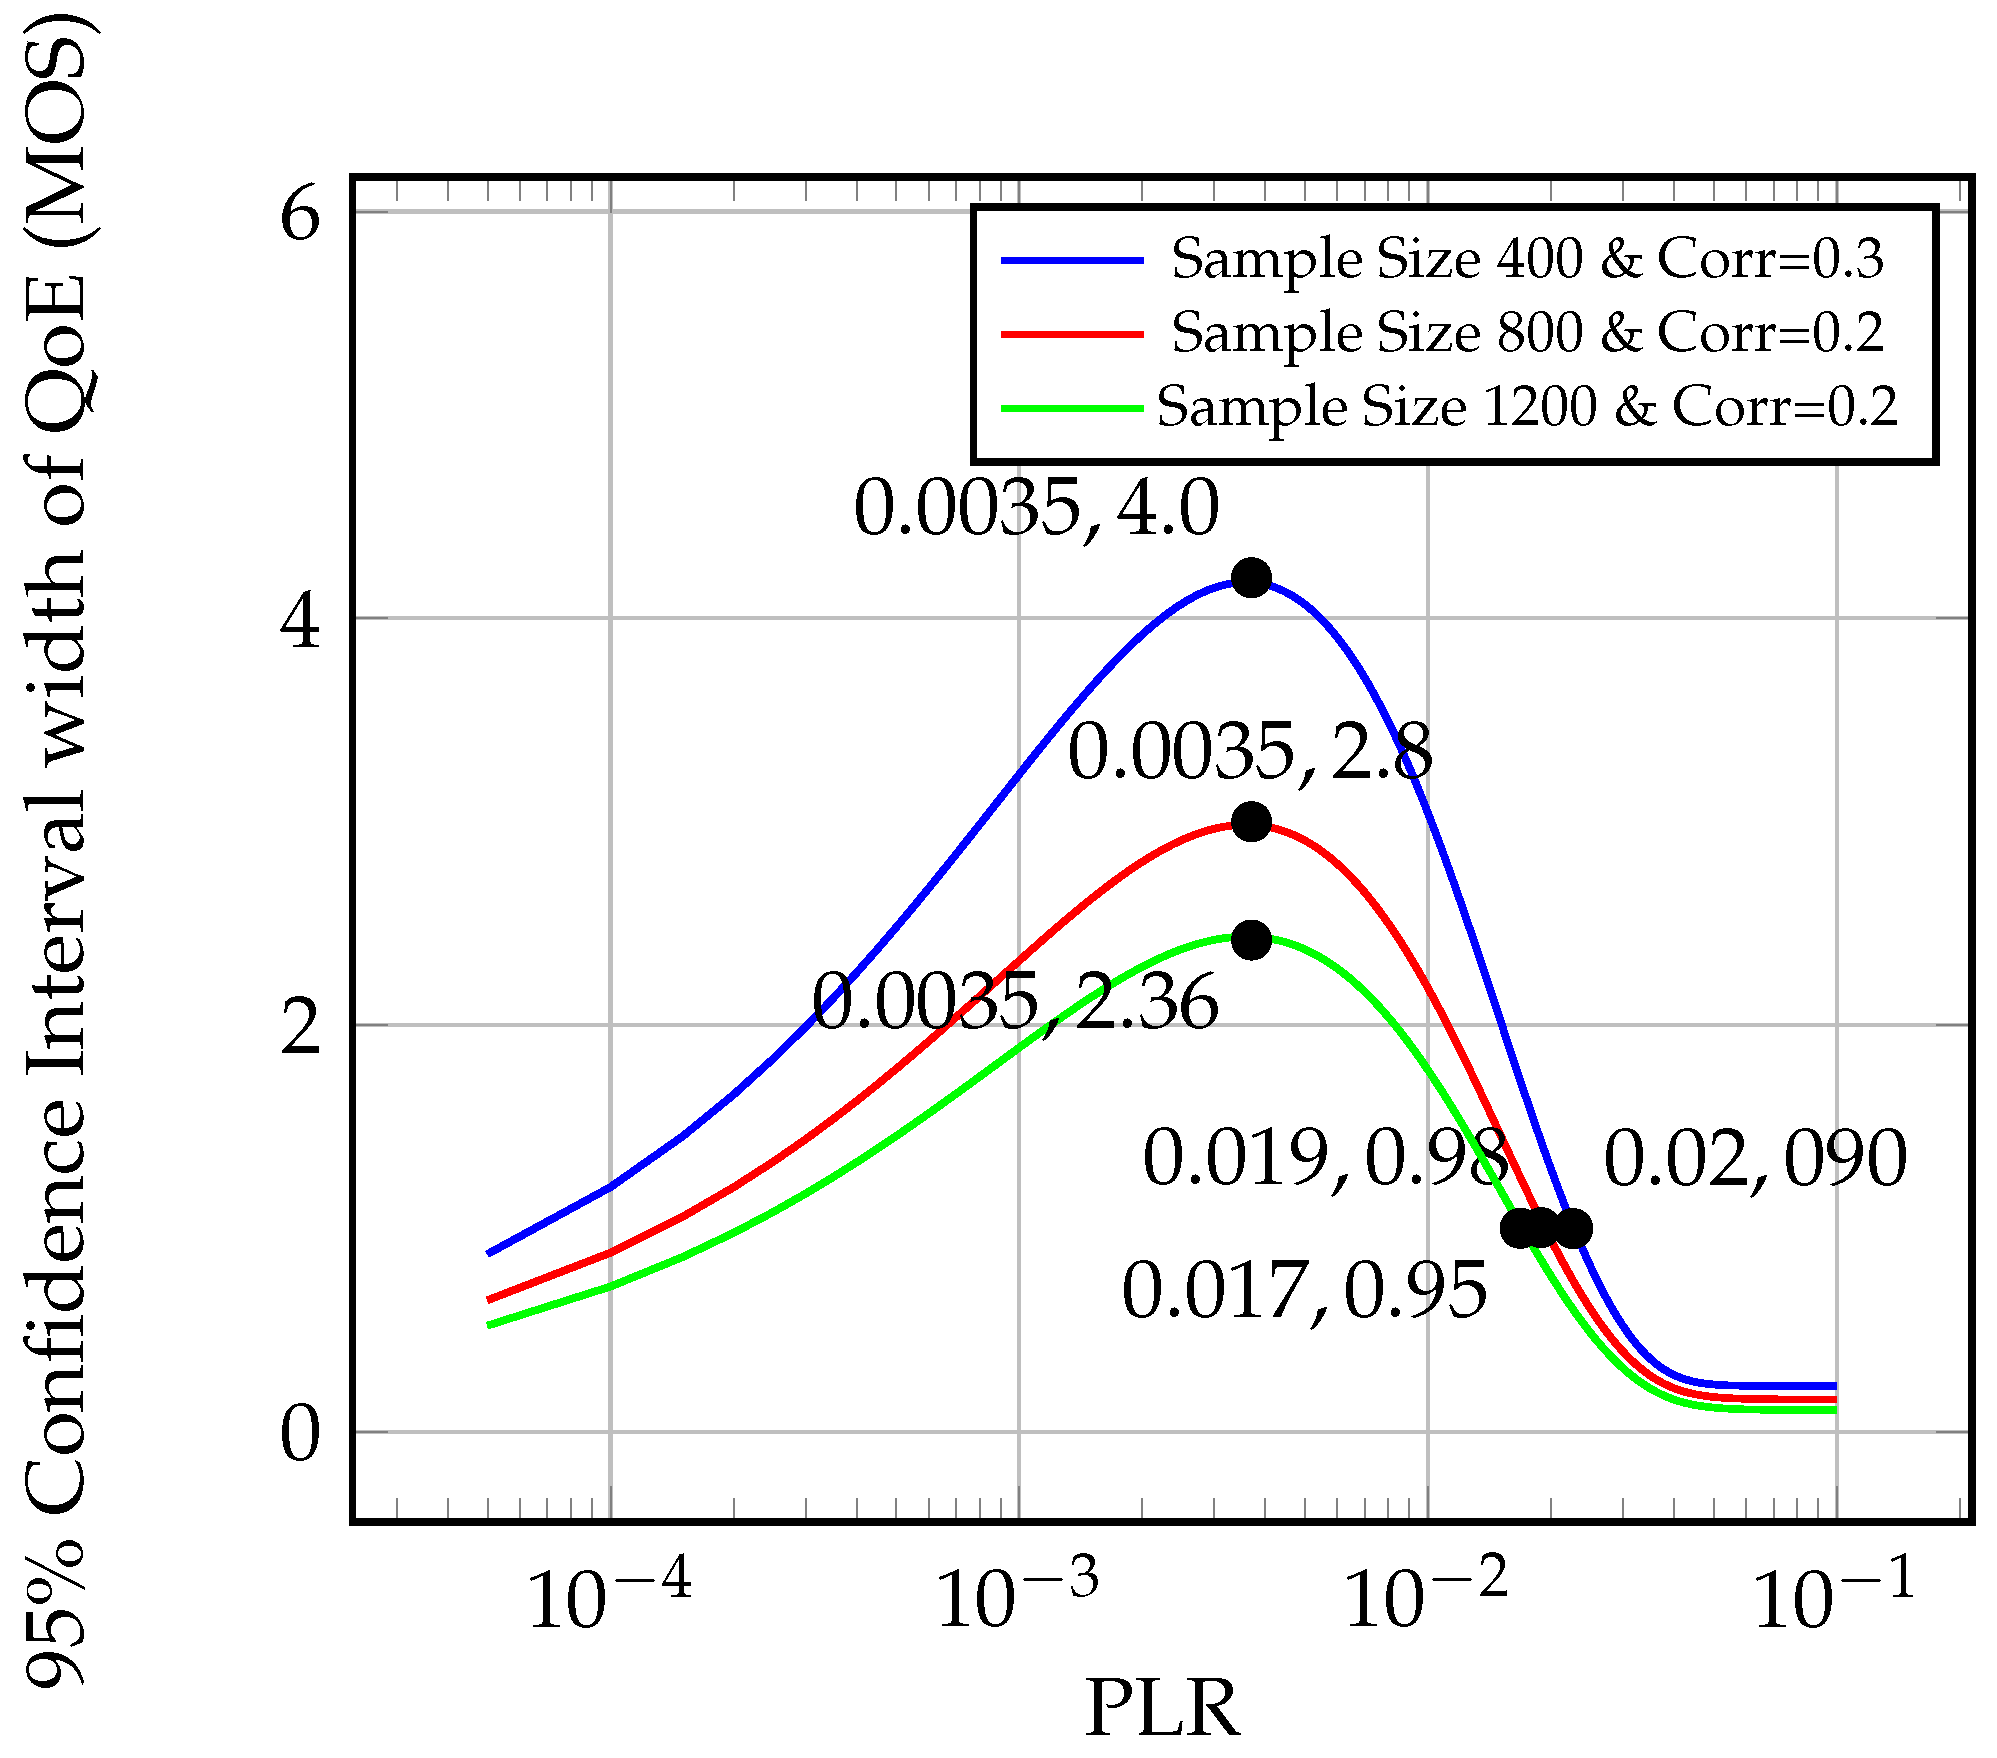
Figure 4.
Propagated uncertainty in QoE vs. PLP at jitter = 1 ms with correlation using jitter model [14].
Figure 4.
Propagated uncertainty in QoE vs. PLP at jitter = 1 ms with correlation using jitter model [14].

Figure 5.
Propagated uncertainty in QoE vs. PLP at jitter = 5 ms with correlation using jitter model [14].
Figure 5.
Propagated uncertainty in QoE vs. PLP at jitter = 5 ms with correlation using jitter model [14].
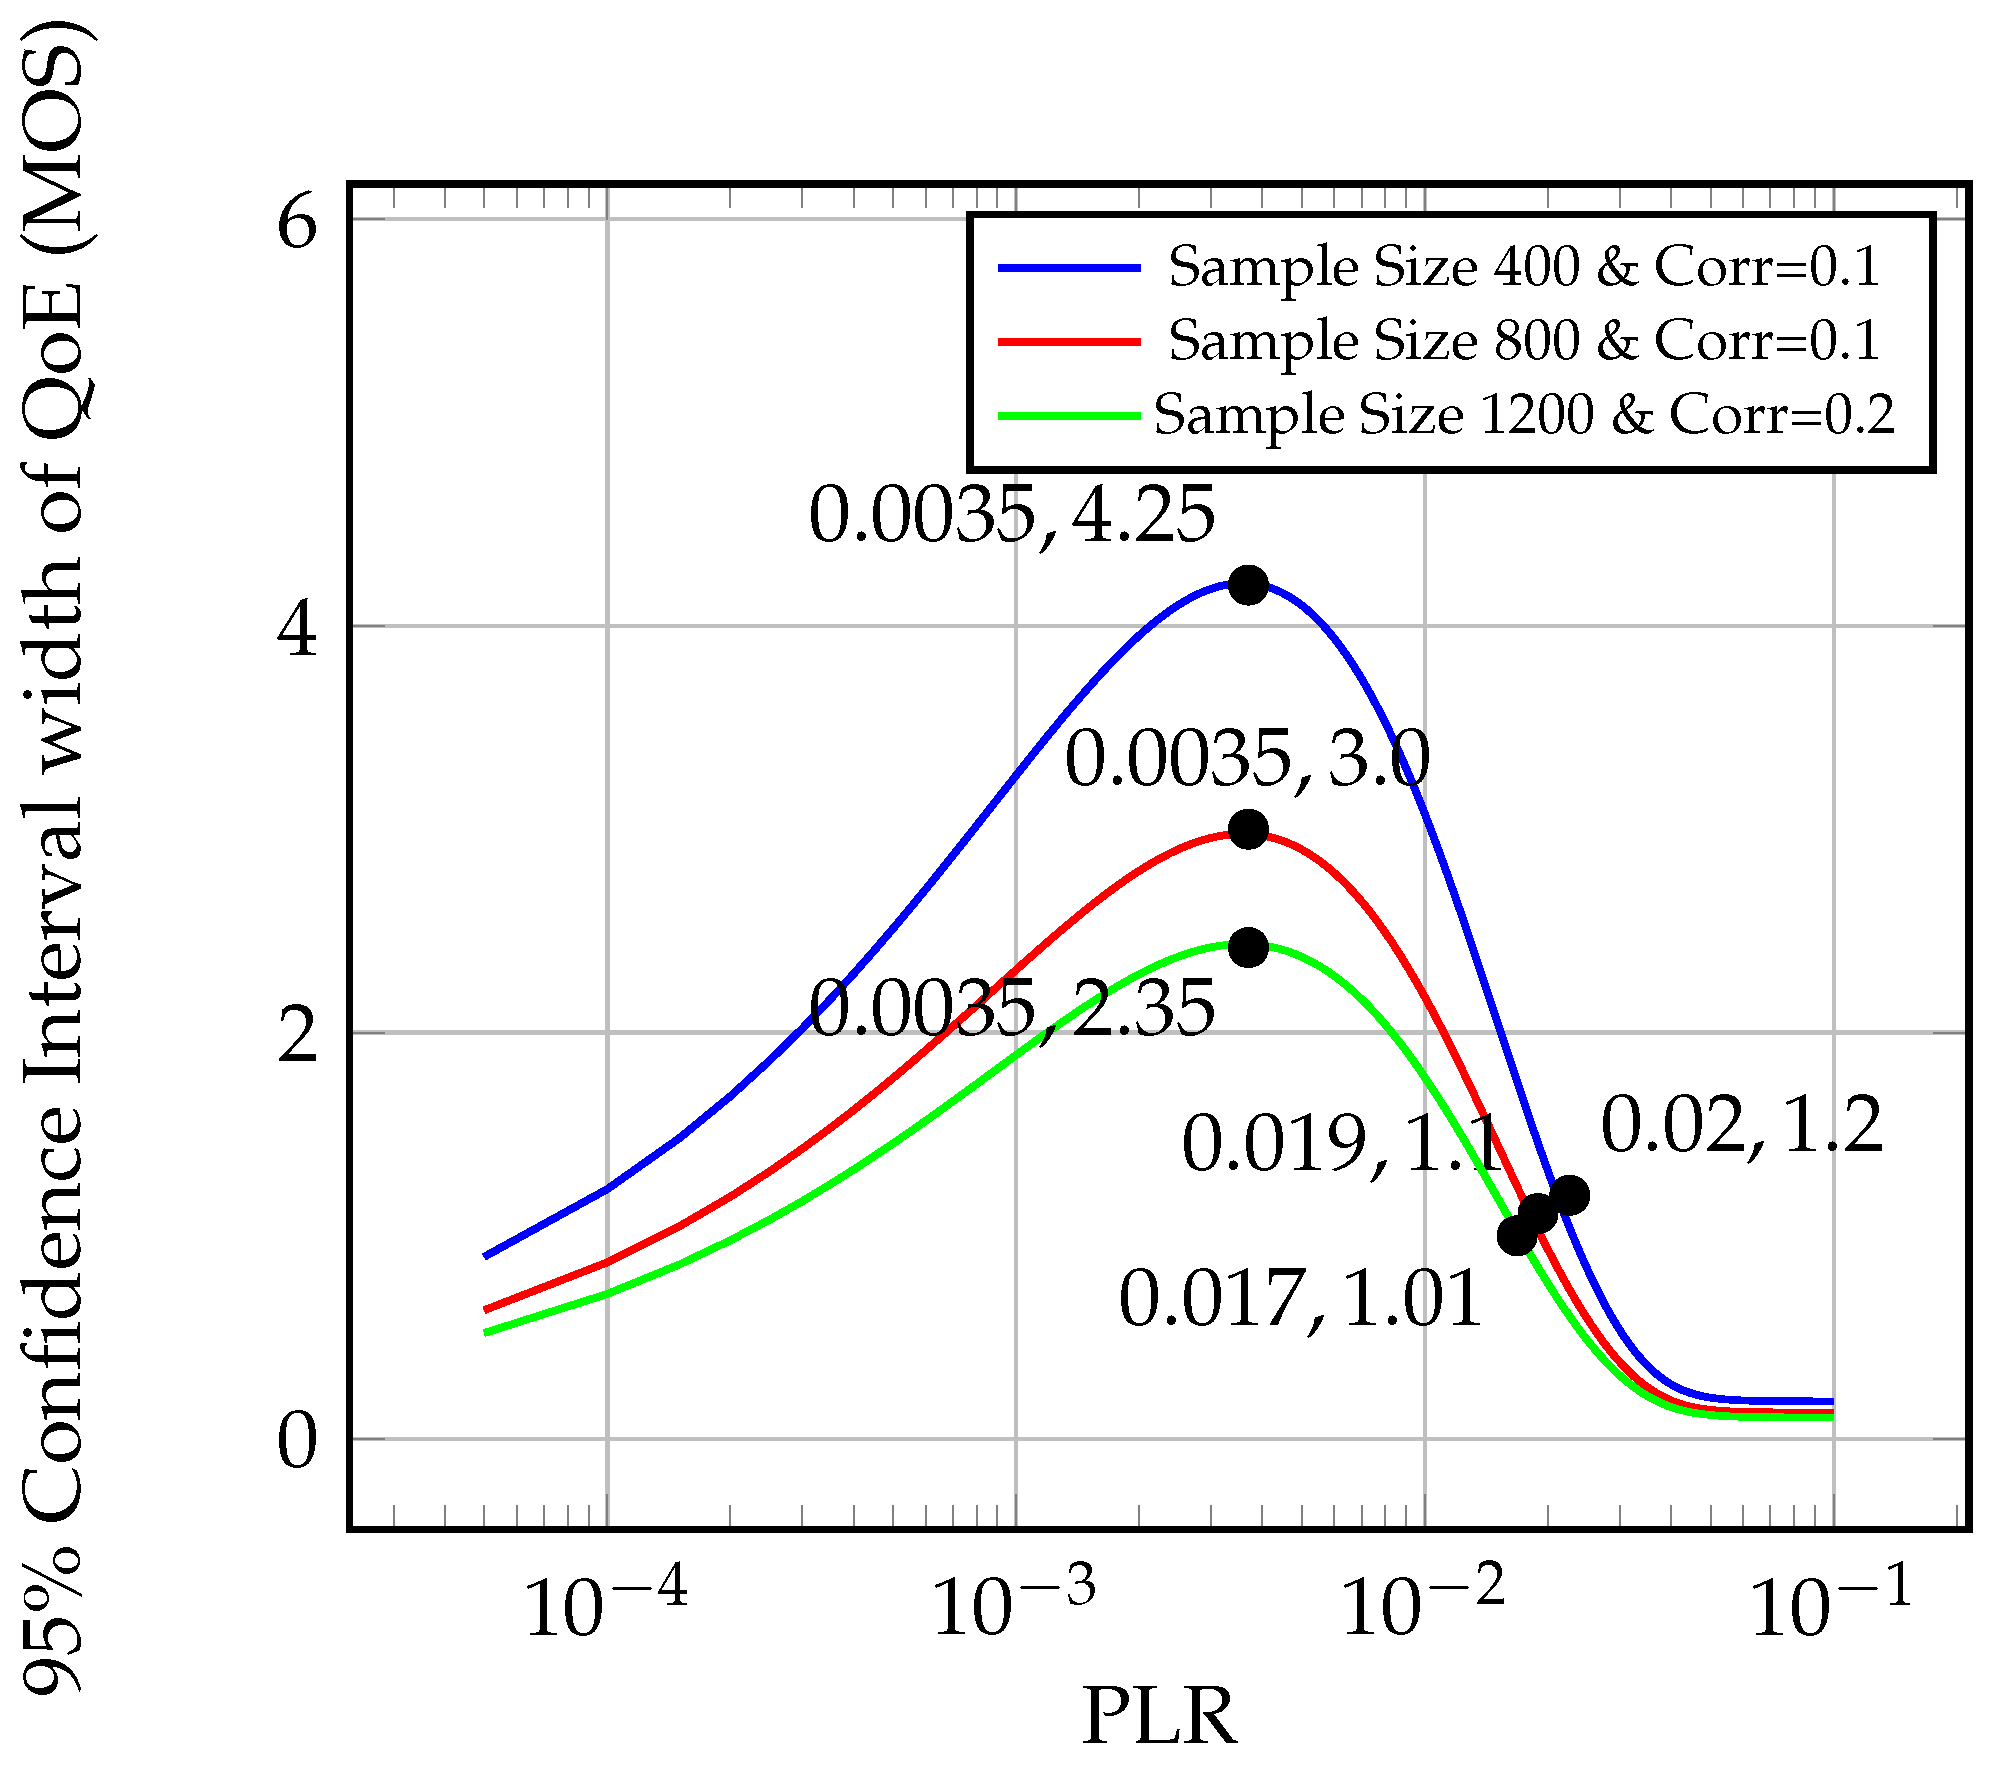
Figure 6.
Heatmap of variation in perception of QoE of subjects at different PLR scenarios.


Table 1.
Linear and non-linear correlation coefficients between packet loss ratio (PLR) and jitter.
| Service Providers | PCC between Jitter and PLR | SCC between Jitter and PLR |
|---|---|---|
| A | 0.22 | 0.18 |
| B | 0.19 | 0.16 |
| C | 0.28 | 0.19 |
| D | 0.35 | 0.25 |
Table 2.
First derivative of QoE w.r.t PLR at operating points.
| PLR Operating Points | (MOS) |
|---|---|
| 0.0005 | −562.7 |
| 0.001 | −519.8 |
| 0.005 | −293.4 |
| 0.01 | −155.2 |
| 0.05 | −1.6 |
Table 3.
First derivative of QoE w.r.t jitter at operating points.
| Jitter Operating Points (ms) | (MOS/ms) |
|---|---|
| 10 | −0.06 |
| 20 | −0.05 |
| 40 | −0.03 |
| 80 | −0.01 |
Table 4.
NetEm PLR uncertainty and propagated error in QoE.
| PLR Configuration (%) | Absolute Standard Error in PLR (%) | Relative Standard Error in PLR | Propagated Standard Error in QoE (MOS) | Propagated CI Width of QoE (MOS) |
|---|---|---|---|---|
| 0.05 | 0.016 | 0.320 | 0.10 | 0.40 |
| 0.10 | 0.015 | 0.150 | 0.10 | 0.40 |
| 0.50 | 0.036 | 0.072 | 0.12 | 0.45 |
| 1.0 | 0.074 | 0.074 | 0.23 | 0.50 |
| 5 | 0.160 | 0.032 | 0.02 | 0.10 |
© 2020 by the authors. Licensee MDPI, Basel, Switzerland. This article is an open access article distributed under the terms and conditions of the Creative Commons Attribution (CC BY) license (http://creativecommons.org/licenses/by/4.0/).
Share and Cite
MDPI and ACS Style
Wahab, A.; Ahmad, N.; Schormans, J. Statistical Error Propagation Affecting the Quality of Experience Evaluation in Video on Demand Applications. Appl. Sci. 2020, 10, 3662. https://doi.org/10.3390/app10103662
AMA Style
Wahab A, Ahmad N, Schormans J. Statistical Error Propagation Affecting the Quality of Experience Evaluation in Video on Demand Applications. Applied Sciences. 2020; 10(10):3662. https://doi.org/10.3390/app10103662
Chicago/Turabian StyleWahab, Abdul, Nafi Ahmad, and John Schormans. 2020. "Statistical Error Propagation Affecting the Quality of Experience Evaluation in Video on Demand Applications" Applied Sciences 10, no. 10: 3662. https://doi.org/10.3390/app10103662
Note that from the first issue of 2016, this journal uses article numbers instead of page numbers. See further details here.