1. Introduction
Laser pumped atomic magnetometers have been studied since the 1980s [
1,
2,
3,
4], and gradually evolved from experimental researches to practical applications [
5,
6,
7,
8]. Compared with the discharge lamp, the laser with far better monochromaticity and higher intensity can improve the signal-to-noise ratio and therefore the sensitivity of the atomic magnetometer [
9,
10,
11,
12]. However, the central frequency of the laser is easily affected by the environment and can drift away from the resonant frequency of the atomic transition without proper frequency-stabilization mechanism, which induces the light shift. In particular, the fluctuations of the laser frequency and intensity are main limitation that determines the sensitivity of the laser pumped atomic magnetometer for measuring low-frequency oscillating magnetic field signals and also affects the accuracy of the magnetometer through the light-shift effect, which is proportional to the laser frequency detuning and laser intensity. So, a frequency- and intensity-stabilized laser source is highly required for optical pumping and detection of the laser pumped atomic magnetometers.
Traditional laser pumped atomic magnetometers are usually equipped with a laser-frequency stabilization system. Typical laser-frequency stabilization systems include the saturated absorption spectroscopy [
13,
14], dichroic atomic vapor laser lock (DAVLL) [
15,
16], polarization spectroscopy [
17], and modulation transfer spectroscopy [
18]. All these schemes need an additional atomic reference cell, which makes the atomic magnetometer system more complicated. Furthermore, since the parameters (light intensity, gas discharge power, environmental temperature and vapor cell pressure) of reference cells are generally not the same as those of atomic sensors, thus the central frequency of the laser is difficult to lock to the required one. These issues will lead to systematic errors. Apart from using an additional reference cell, other alternative methods can also be exploited to stabilize the laser frequency. For example, the atomic alignment to the orientation-conversion (AOC) effect [
19] has been used to suppress light shift in laser pumped
4He magnetometer [
9]. The saturated absorption spectroscopy and the magnetic resonance using circularly polarized light also can be implemented in the same cell [
20]. But these methods all need an additional lock-in amplifier, which makes the atomic magnetometer system more complicated.
In this paper, we propose a compact
4He magnetometer system, which measures ambient magnetic field in the magneto-optical double-resonance (MODR) configuration and simultaneously stabilizes the laser frequency by using the inhomogeneous light shifts in the same cell. As the laser beam is absorbed by the
4He atoms, it generates light-intensity spatial gradient along the propagation direction, resulting in inhomogeneous light shifts at different positions [
21]. The inhomogeneous distribution of light shifts in the laser pumped
4He magnetometer is analyzed theoretically and verified experimentally. The characteristics of inhomogeneous light shifts show that the variation of amplitude of the in-phase component is approximately proportional to the laser-frequency detuning, which can be used for laser-frequency stabilization. This method can also be applied to other atomic magnetometers. The compact and portable atomic magnetometers are well suited to measure geomagnetic field and space magnetic field.
The rest of this paper is organized as follows. In
Section 2, we describe the experimental setup. In
Section 3, we give the theoretical analysis and simulation on inhomogeneous light shifts, which cause the the asymmetric line shape of the MODR signal. In
Section 4, we discuss the experimental results.
Section 5 is the conclusion.
2. The Experiment Setup
The experimental setup is shown in
Figure 1 and is a typical laser pumped
4He magnetometer under the conventional MODR configuration. The laser emitted from a fiber laser (FL) has a wavelength of about 1083 nm. A beam expander (BE) is inserted into the path to expand the waist diameter to 12 mm (
) in order to increase the signal amplitude.
A half-wave plate (HWP) and a polarizer (P) are used to adjust the pumping light intensity and then a quarter-wave plate is used to convert the linear polarization to the circular polarization. The circularly polarized pumping light passes a 70 mm 4He atomic cell with diameter being 50 mm and with low-pressure being 0.3 Torr. The cell is discharged by power source with 33 MHz to produce the metastable-state 4He atoms. The MODR signal is driven by a weak oscillating magnetic field , which is perpendicular to the propagation direction of the pumping light. The weak oscillating magnetic field is generated by a pair of Helmholtz coils (HC). To suppress the fluctuations of the external magnetic field, both the cell and the coils are located in a five-layer magnetic shield. A bias magnetic field , parallel to the propagation direction of the pumping light, is generated by another coil inside the magnetic shield (not shown). The strength of the bias magnetic field is about 11,320 nT in our experiment.
For MODR configuration magnetometer of type, the circularly polarized resonant light passes through the 4He gas and polarizes the metastable 4He atoms. The polarized 4He atoms form a macroscopic magnetic moment parallel to the direction of the bias magnetic field . Scanning the frequency in the Helmholtz coils, an absorption signal is detected with the photodiode. When the frequency is equal to the magnetic resonance frequency (Larmor frequency) , the light absorption is at its maximum. A small sinusoidal signal with a frequency of 1.3 kHz is applied to modulate the frequency and the absorption signal is demodulated with a lock-in amplifier (LIA). The LIA acts as a narrow band-pass filter around the reference signal frequency. For each frequency component of the magnetic resonance signal, the LIA generates two output components, respectively in-phase and in-quadrature. The in-phase component is referred to as , while the quadrature component is referred to as , where R is the amplitude of the (demodulated) magnetic resonance signal and is the phase difference between the detection signal and the reference signal.
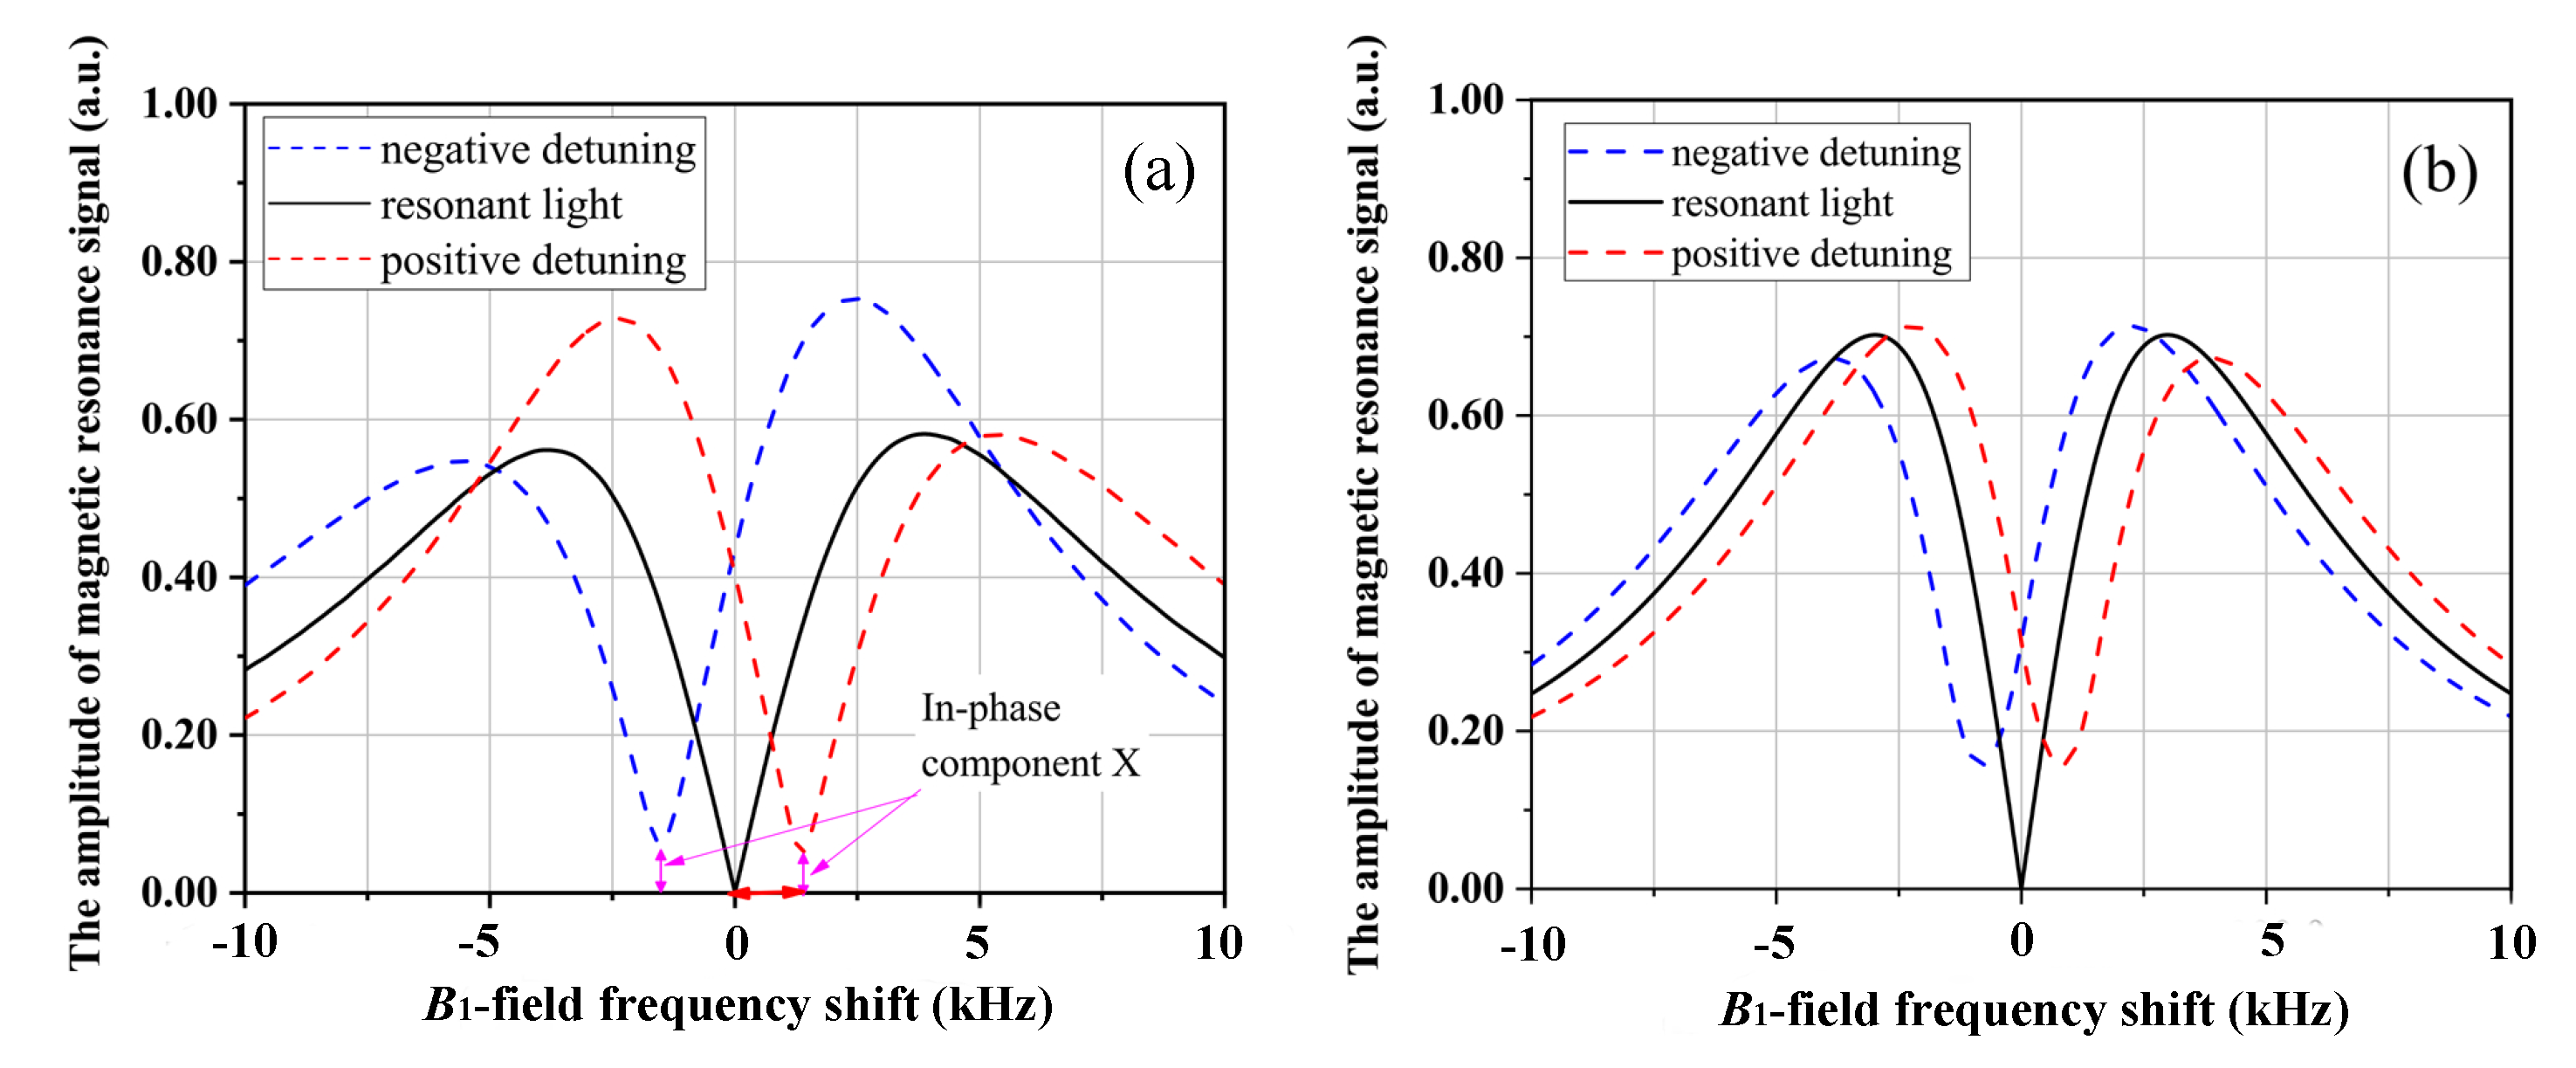
According to this experimental setup, the power of the pumping light is set to 3 mW. The wavelength of the laser is about 1083.205 nm and it can be adjusted through the piezoelectric transducer (PZT). By scanning the frequency
of the frequency synthesizer (FS), the demodulated signal amplitude
R is shown in
Figure 2a. It can be seen that, when the laser frequency is resonant, the line shape of the magnetic resonance signal is symmetric and the maximum absorption is zero. When the laser frequency is detuned, the line shape becomes asymmetric and the value of
R is not zero. Since the quadrature component
Y is a dispersive function of the scanning frequency
, we use this quadrature component to lock the Larmor frequency with the help of Helmholtz coils and measure the bias magnetic field
along the z direction. The in-phase component vanishes if the laser frequency is resonant. However, when the laser is detuned, the in-phase component does not vanish due to the inhomogeneous light shifts in the vapor cell, and can be utilized as the feedback control for laser-frequency stabilization.
3. Theoretical Analysis and Simulation
The light shift, normally referring to the frequency shift of an atomic magnetic resonance, originates from the AC Stark effect caused by the oscillating electric field of the pumping light [
22,
23]. It was systematically and theoretically studied by Barrat and Cohen-Tannoudji, who showed that the atomic ground-state transition frequencies can be shifted by two distinct processes involving real and virtual absorption of light [
24]. Light shift can be decomposed into vector light shift (VLS) and tensor light shift. In our experiments, since the laser wavelength is near
line (2
S
∼2
3P
0) and there is only one sublevel for the excited state 2
3P
0, only the virtual light shift needs to be taken into consideration, and acts on the Zeeman sublevels like a fictitious magnetic field [
25]. The light shift depends on both the frequency and intensity of the light field [
26], given by
where
is the light intensity at the position
z and
is the shift related to laser frequency
. In this work, we demonstrate that the VLS in the cell depends on the local light intensity, rather than the total light power averaged over the cell volume.
Here, we assume that the atoms within a volume element with very small length
experience approximately the same light intensity and the local light intensity is given by
where
is the initial light intensity incident on
,
n is the numbers density of the metastable
4He atoms,
is the absorption cross section,
is the (dichroic) monitoring cross section,
is the polarization in the volume element [
12,
27]. The optical absorption of the polarized
4He atoms in the cell gradually weakens along the light-propagation direction
z. This means that the light shift will be greater where the beam enters the cell than where it exits. The centers of the magnetic resonance signals are shifted differently in every volume
because of different light shifts. The amplitude of the magnetic resonance signal
R is the superposition of all the absorption signals of all the volume.
According to Ref [
27,
28], we have
where
is the equilibrant angular momentum when no magnetic field is applied,
and
are respectively the total longitude and transverse relaxation rates, and
is the gyromagnetic ratio of the metastable
4He atoms. The variation of
with
is an absorption curve with the maximum absorption at
. The local light shift
is different for each
unit, and thus results in a different absorption maximum for each
unit. The signal line shape of laser absorption by the polarization
4He in the cell can be thought of as the superposition of several
units and behaves asymmetric. With Equations (1)–(3), the magnetic resonance signal is calculated and is shown in
Figure 2b. If the light intensity gradient is not considered, the absorption line is shifted symmetrically even though the laser frequency is detuned. If the light intensity gradient is considered, as shown in
Figure 2b (blue or red line), not only the frequency shift exists but also the amplitude of the demodulated magnetic resonance signal is not zero at the maximum absorption. We use the relation between the in-phase component and the laser detuning to lock the laser frequency.
4. Results after Laser-Frequency Stabilization
In order to investigate the variation of the in-phase component, we changed the laser detuning over a large range. As shown in
Figure 3, the laser-frequency detuning is changed from −0.45 GHz to 0.6 GHz centered on the
line of
4He atoms. The in-phase component is nearly linear with the laser detuning. On both sides of the resonance frequency, the sign of the in-phase component is opposite, which can be used to feedback and lock the laser frequency. The bias magnetic field
is detected by the laser pumped
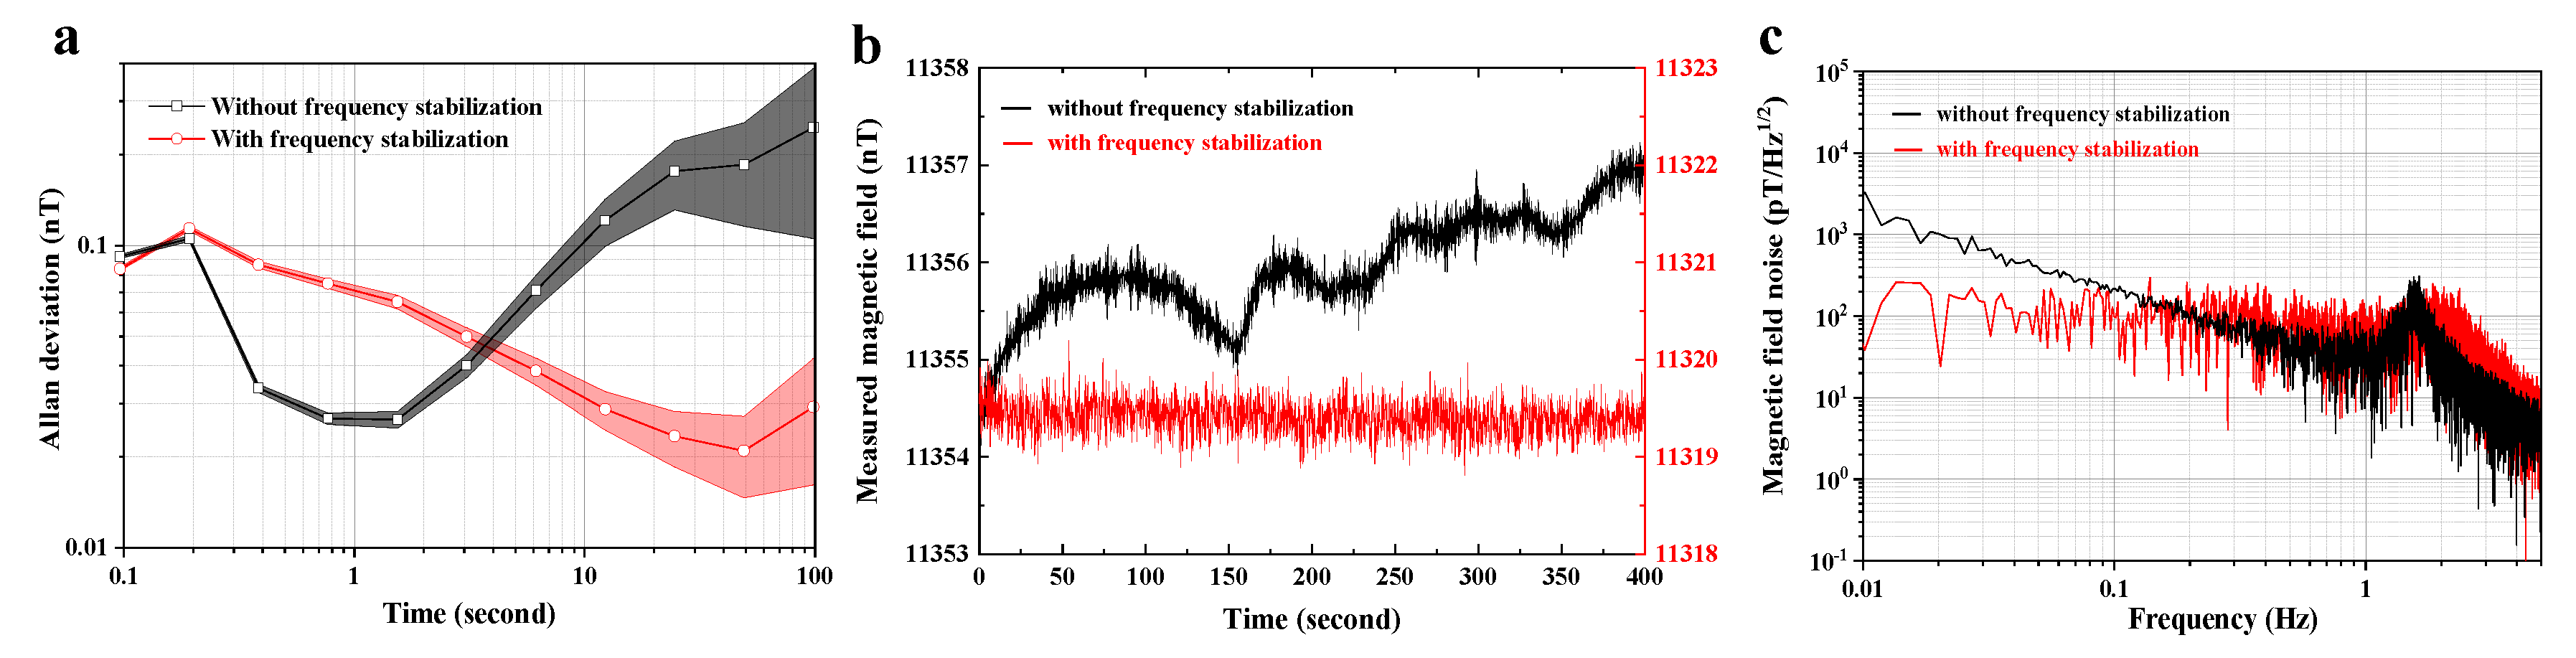
4He magnetometer with and without laser-frequency stabilization. Here, the bandwidth of our magnetometer system is about 5 Hz. As shown in
Figure 4a, the black line is the Allan deviation of the measured magnetic field without laser-frequency stabilization, which is falling first and then rising quickly, indicating that several kinds of noises caused by different physical mechanisms exist simultaneously including the drift of the frequency of pumping laser [
29]. For comparison, the red line is the Allan deviation of the measured magnetic field with laser-frequency stabilization through the in-phase component feedback control.
From the measurement time 0.2 s to 50 s, the Allan deviation is falling continuously thanks to the laser frequency fluctuation suppression, demonstrating a better system stability. However, although the simple method performs well, we have observed an increased Allan deviation for the measurement time smaller than ∼3 s. This is because that the parameter settings of the PID controller is optimized to suppress the long-term drift of the laser frequency. Such a conclusion is well supported by
Figure 4b,c, both of which show clearly that after laser frequency stabilization, the long-term frequency drift is suppressed while the short-term fluctuation increased.
However, the in-phase signal also depends on the
-field frequency shift, as shown in
Figure 2a. A change in the bias field
will introduce an offset to the in-phase signal. In order to operate the magnetometer in an environment with changing magnetic fields, we shall adjust the loop bandwidth of the PID2 in control of the in-phase component to be smaller than that of the PID1 which controls the
-field frequency. By properly choosing the parameters of the two PIDs, the adjustment rate of the
-field frequency is higher than that of the in-phase component, and the
-field frequency is still resonant when the magnetometer is operated in an environment with changing magnetic fields. Under this condition, the
-field frequency shift has negligible effects on the amplitude of the in-phase component.
In order to illustrate that the in-phase component signal for laser frequency stabilization has no dependence on the strength of the bias magnetic field when the
-field is resonant, we change the bias magnetic field and record the amplitude of the in-phase component signal simultaneously. The measurement result is given in
Figure 5, which indicates that the in-phase component signal has no dependence with respect to the magnetic field strength. It should be noted that, for larger magnetic field, the increased magnetic field gradient inside the shield could distort the profile of the magnetic resonance signal, change the in-phase component, and in turn affect the performance of the laser frequency stabilization.
There are also some other error sources that can affect the in-phase signal, i.e., the laser intensity fluctuations, the magnetic field gradient, the phase shift setting in the lock-in amplifier and the collision shift, in future work these issues will be addressed in more detail.

 ,
, 


