Article

A Vibration Isolation System Using the Negative Stiffness Corrector Formed by Cam-Roller Mechanisms with Quadratic Polynomial Trajectory

1
School of Mechanical Engineering and Automation, Northeastern University, Shenyang 110819, China
2
School of Mechanical Engineering, Shenyang University of Technology, Shenyang 110870, China
*
Authors to whom correspondence should be addressed.
Appl. Sci. 2020, 10(10), 3573; https://doi.org/10.3390/app10103573
Submission received: 24 April 2020 / Revised: 16 May 2020 / Accepted: 19 May 2020 / Published: 21 May 2020
(This article belongs to the Section Acoustics and Vibrations)

Abstract

:
The vibration isolator equipped with a negative stiffness corrector (NSC) excels at vibration isolation, but its stiffness often presents complex nonlinearity which needs to be approximated in calculation. To avoid the harmful effects of approximate stiffness, the NSC formed by the cam-roller mechanism with a quadratic polynomial trajectory (QCRM) is proposed to construct the vibration isolation system. From the inherent geometrical relationship in the structure, the generation mechanism of high-static-low-dynamic stiffness is analyzed, and the quasi-zero stiffness (QZS) condition of the system is derived. Based on the dynamic model of the QZS vibration isolator, the functions of response characteristics are solved by the harmonic balance method. Then, the absolute displacement transmissibility with different parameter values, and the vibration isolation performance under sinusoidal, multi-frequency wave, and random excitations are discussed. The simulated results show that the stiffness expression of the proposed QZS vibration isolator is directly a quadratic function, which removes the calculation error caused by approximate stiffness at large displacement and broadens the available isolation displacement range. Introducing the QCRM-NSC can significantly suppress the low-frequency vibration and resonance response without changing the load-bearing capacity of the vibration isolator. Under various excitations, the vibration isolation performance of the QZS vibration isolator all outperforms the linear counterpart.

1. Introduction

Vibrations occur in many engineering applications. In most cases, they are undesirable and harmful, as they shorten the service life of equipment and even cause serious accidents [1]. Recently, with the rapid development of sophisticated industry, such as high-speed trains [2], precision optical instruments [3] and stealth submarines [4], the requirements on the vibration environment have become increasingly strict. Considering the contradiction between the load-bearing capacity and the low-frequency vibration isolation of traditional linear vibration isolators, nonlinear theory is widely adopted for better isolation performance [5].
Nonlinear vibration isolation systems can be implemented without additional energy, and constructed in a variety of interesting ways. Air springs [6], polycal wire ropes [7], bio-inspired X-shaped structures [8], and fluidic origami structures [9] are all effective designs to achieve the expected vibration isolation. The use of a negative stiffness corrector (NSC) to develop nonlinear isolators on the basis of linear isolators is also an attractive issue in the vibration control field. In this type of nonlinear vibration isolator, the static stiffness is high, but the dynamic stiffness drops to extremely low and can even realize the quasi-zero stiffness (QZS). This means that introducing an NSC will reduce the natural frequency without increasing the static deflection of the original system, which is beneficial to vibration isolation.
The early NSC, whose dynamic model was established and fully analyzed in [10,11], consists of a pair of inclined linear springs. Buckled beams are another choice for negative stiffness structure due to their elastic property [12,13]. Nonlinear magnet metamaterials and honeycomb configurations are also incorporated in negative stiffness structures to reduce friction and deformation during vibration isolation [14] or to isolate shocks [15]. As the theory of negative stiffness becomes mature, the use of NSCs to suppress vibration in many practical applications have been discussed. Papaioannou et al. [16] installed the vibration isolator with a negative stiffness element in a passenger vehicle. In their research, five different isolators were compared under different seated passengers and excitations from rough roads. Yang et al. [17] introduced a negative stiffness adjusting mechanism into the suspension system of trucks with an all-floating cab. Their simulation results presented that the vibration of the cab with the nonlinear suspension system is significantly attenuated, and the suspension travel space is utilized due to the controllable deflection. Li and Xu [18] conducted their study on a double-layer QZS vibration isolation floating raft system which expands the isolation region to a very low-frequency. Zhou et al. [19] used permanent magnets as a negative stiffness corrector to construct the QZS vibration isolator, aiming to weaken the vibrations of the infant in an incubator during neonatal transport. For the flexible structures, such as stay cables, a negative stiffness damper was proposed to mitigate the damage caused by vibrations. Zhou and Fang [20] investigated the matching of the negative stiffness and viscous damping in that passive equipment and revealed its vibration control mechanism from the perspective of energy.
Clearly, it has been well proven that adding the NSC to a vibration isolator can improve the isolation performance. In literature, however, the vibration isolator applying an NSC often has the nonlinear stiffness with a complex analytical expression [10,11,14,16,17,18,19,21,22,23,24,25,26,27] which needs to be approximated by the Taylor series expansion before solving its dynamic characteristics, including frequency response function, bounded response area and peak amplitude. In fact, the strong nonlinearity makes the vibration isolator with NSC sensitive to parameters and prone to instability. When the response of the vibration isolation system is small enough, it is reliable to adopt the Taylor series expansion with low order to simplify the stiffness of the system. On the contrary, this kind of approximation is difficult to satisfy the accuracy requirement under large vibrations. The errors will lead to the deviation against actual isolation performance, the mismatch of structure parameters and isolated mass, and the limitation on working displacement of isolators. The changes of the predicted vibration responses caused by stiffness error have been presented in [21,22]. Increasing the order of Taylor series expansion, the accuracy can be improved, while the difficulty and cost of calculation will be raised.
In order to avoid the above approximation error problem in dynamic analysis of nonlinear vibration isolators, a novel cam-roller type negative stiffness corrector is proposed in this paper. In manufacturing and automobile engineering, the cam and its profile theory have been widely used [28,29]. Vibration isolators with cam-roller mechanisms (CRMs) present superior isolation capabilities [16,23,24], but the cams in the existing CRMs all have the semicircular trajectory, which results in a complicated stiffness and fails to exploit the advantage that cam contours are easy to design. Therefore, for the desired stiffness characteristics, the NSC constructed in this paper employs the cam-roller mechanism with a quadratic polynomial trajectory (QCRM), and the nonlinear vibration isolator with this QCRM-NSC is established. Then, according to the static model of the vibration isolator, the simple quadratic polynomial stiffness of the NSC and the QZS condition of the isolator are given without stiffness approximation. Both the dynamic response and the vibration isolation performance under different excitations show that the nonlinear QZS vibration isolator with the special QCRM-NSC can effectively suppress the transmission of vibrations.

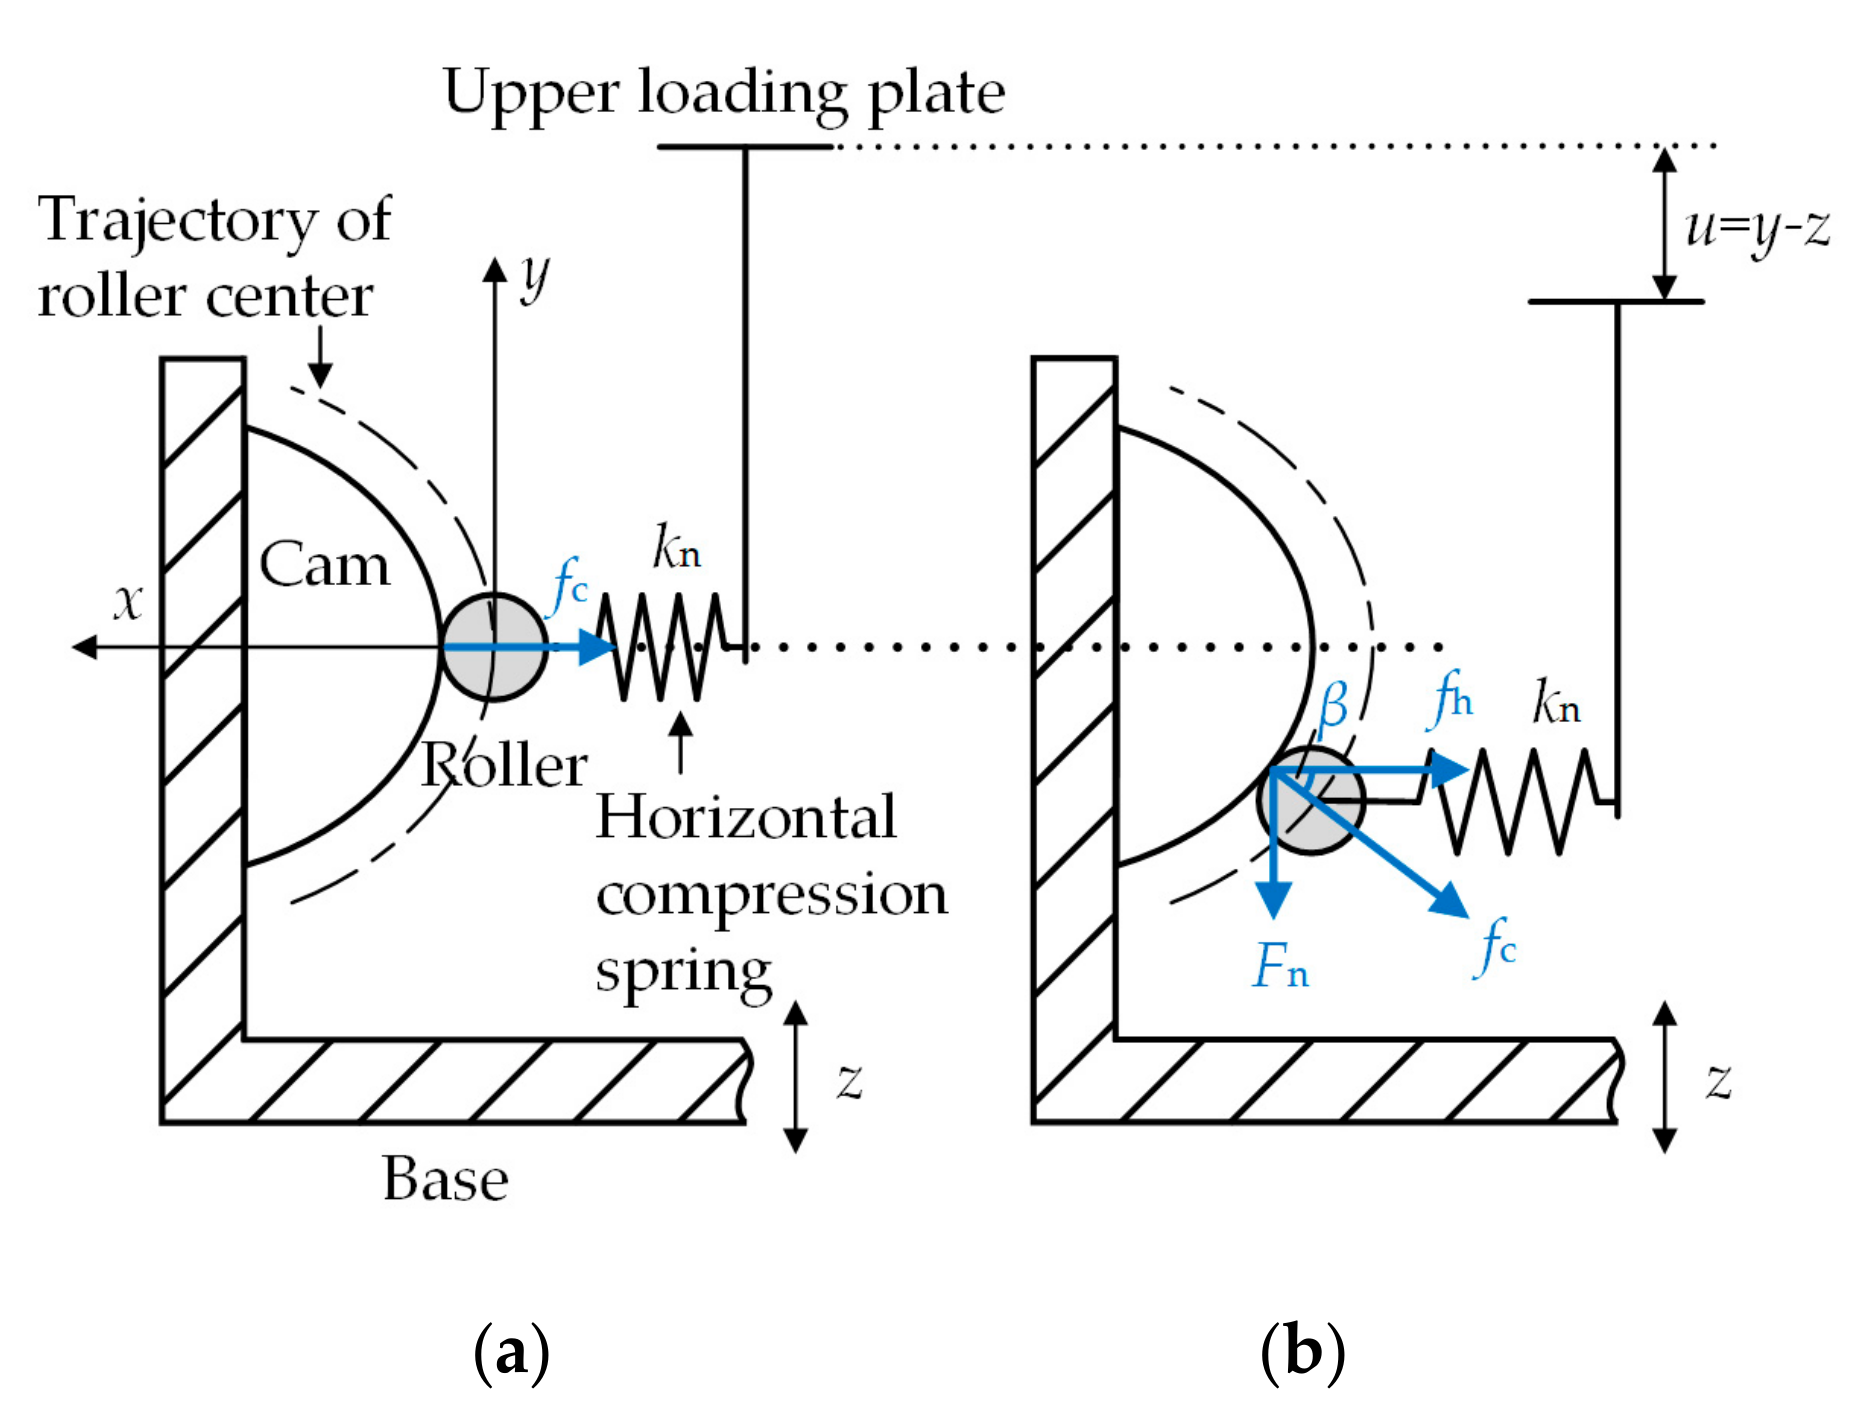
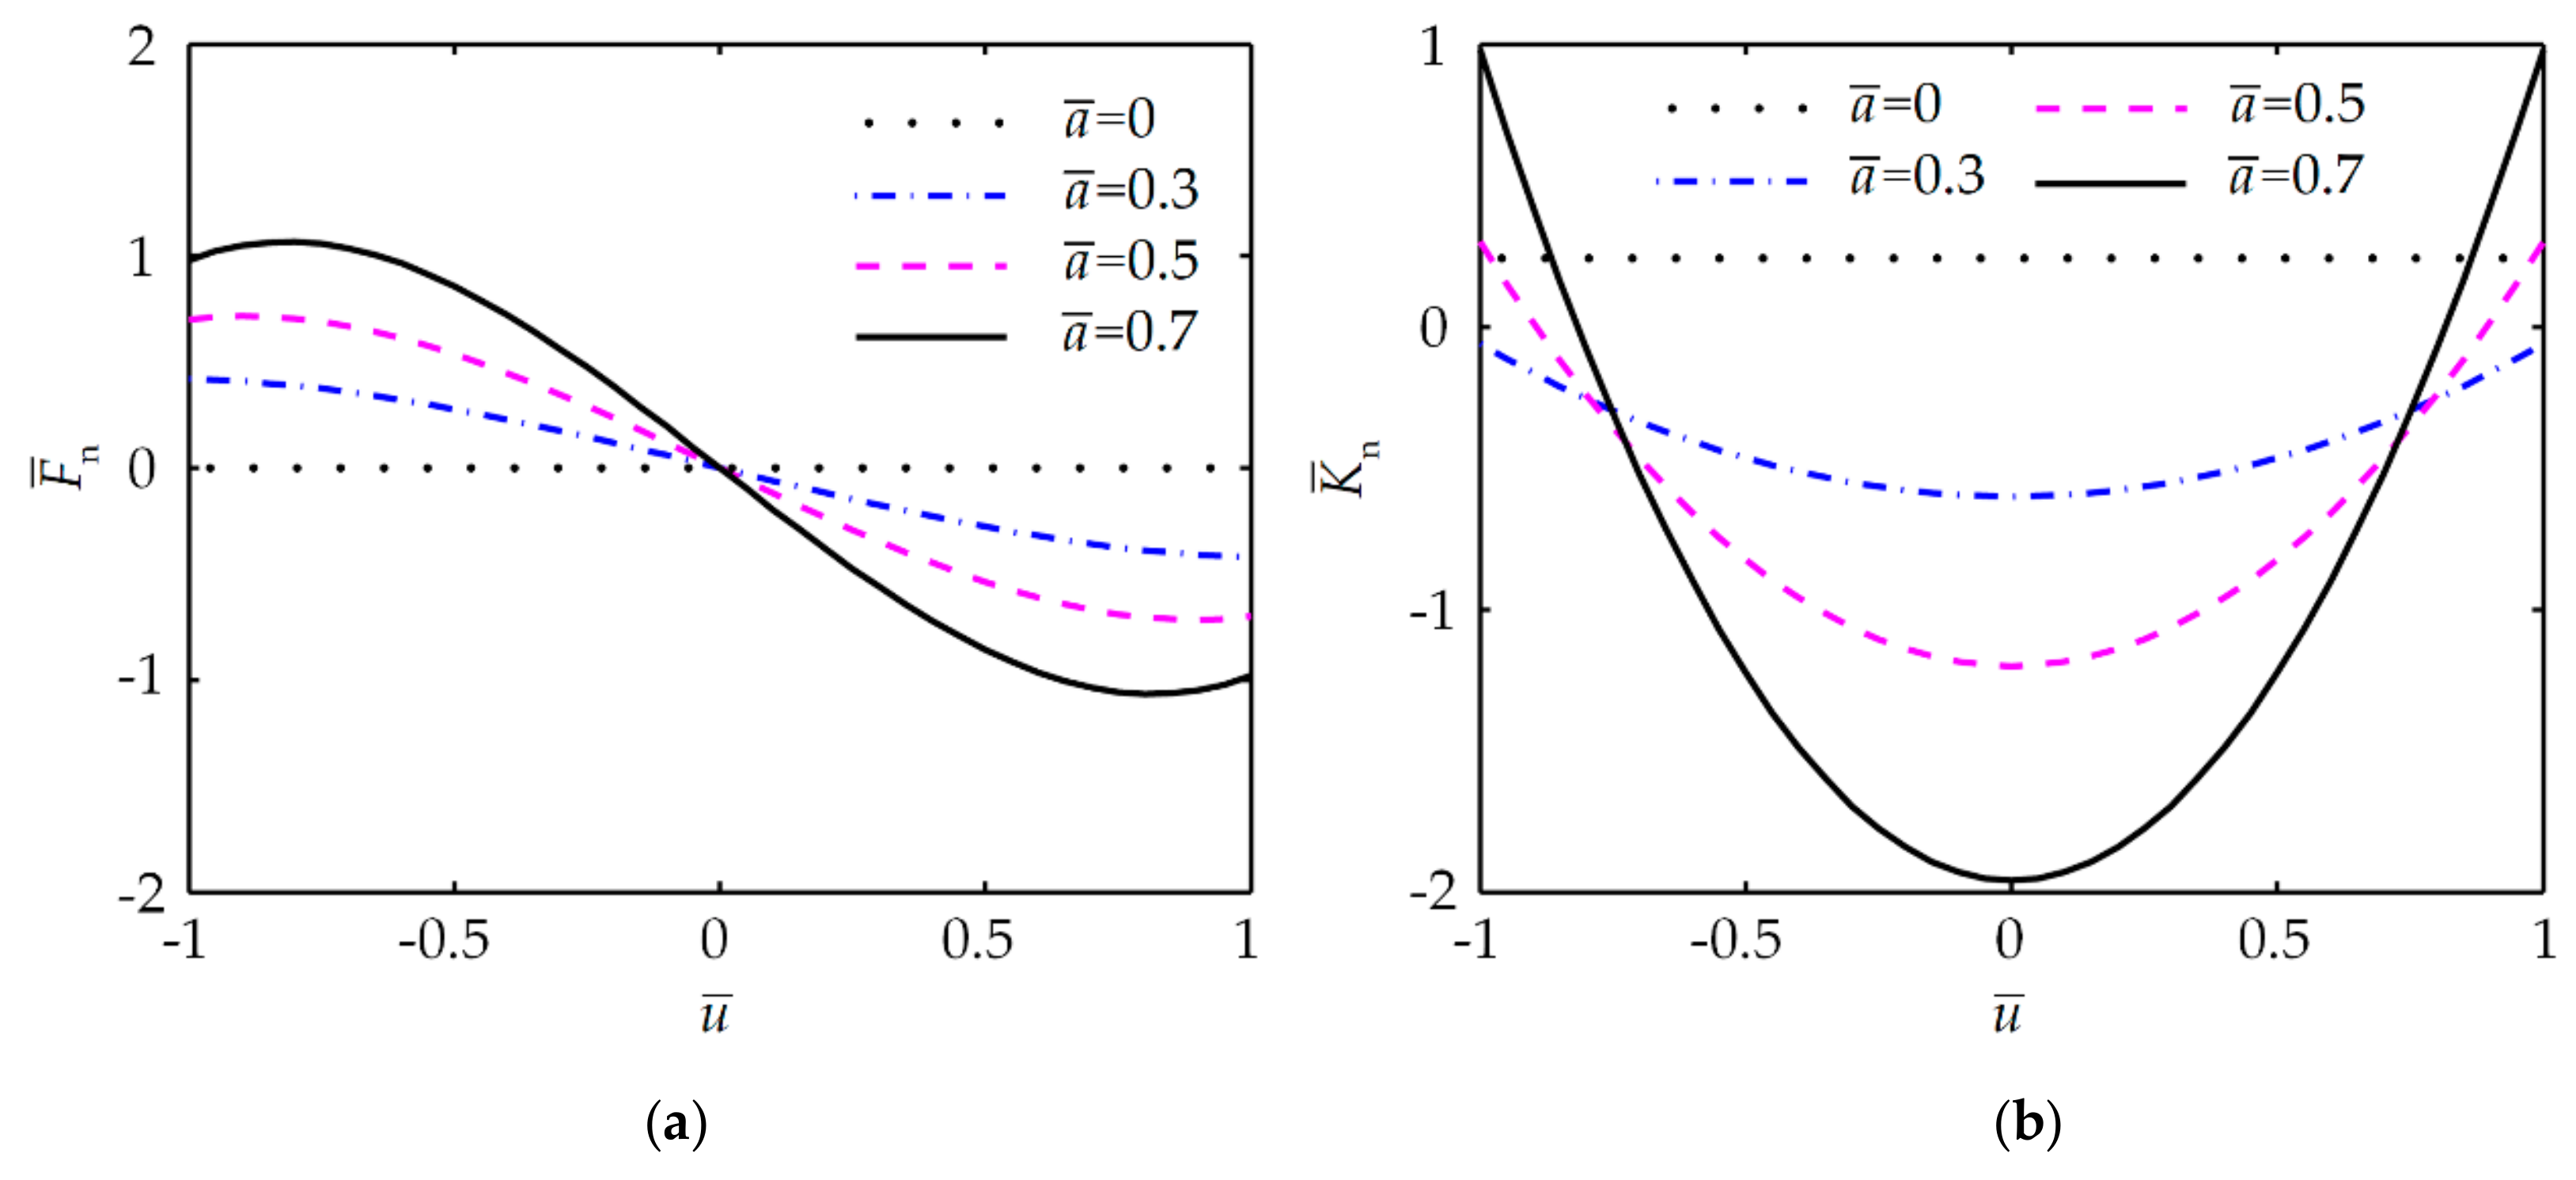
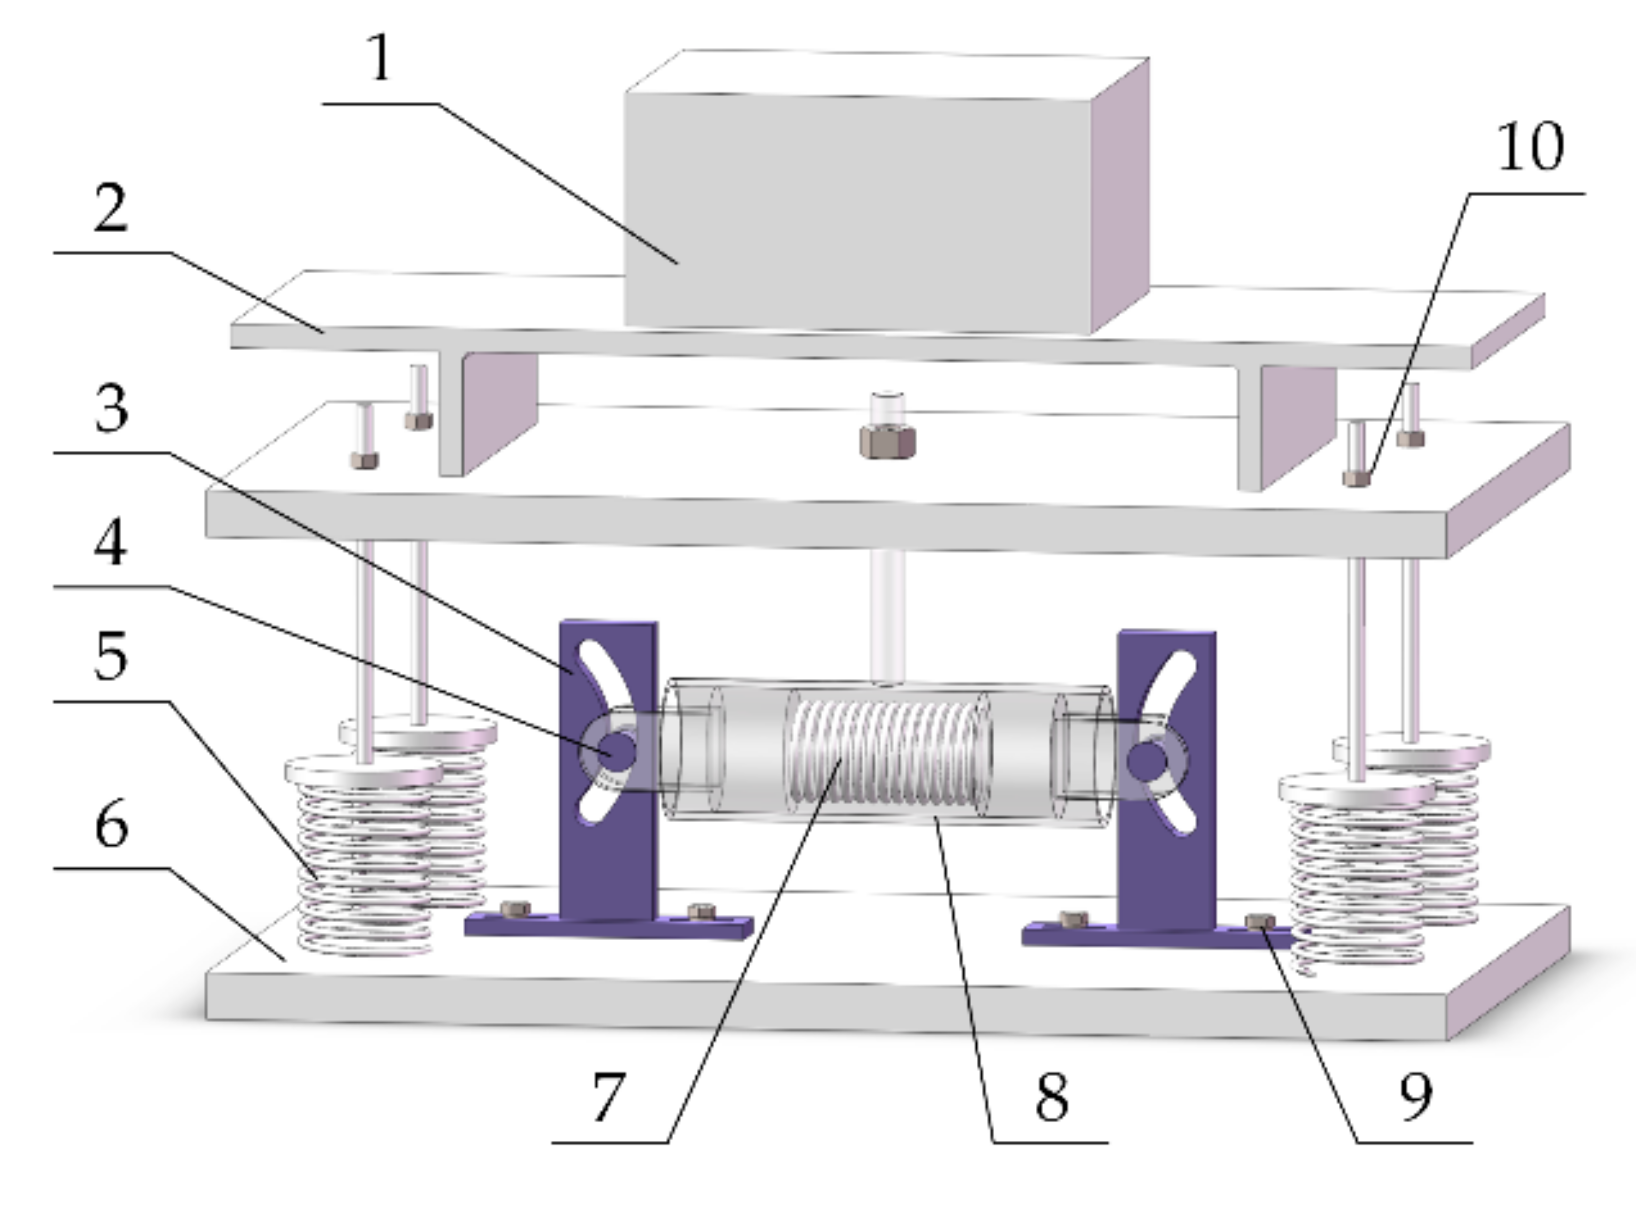
2. NSC Formed by CRMs with Quadratic Polynomial Trajectory

In nonlinear vibration isolators, the NSC and the positive supporting structure are usually connected in parallel along the vibration isolation direction. Figure 1 illustrates the principle of the NSC in an isolation system for vertical vibration. When the vibration isolator just bears the rated mass, it moves down from the position shown in Figure 1a to the static equilibrium position in Figure 1b,c. At this time, the NSC only generates restoring force in the horizontal direction, so the load-bearing capacity of the vibration isolator, here provided by a vertical linear spring, will not be affected. When isolating vibrations, the NSC begins to deviate from the static equilibrium position, as shown in Figure 1d, and produces a vertical component force in the same direction as the movement of the isolated object. The new component force is related to displacement and results in a reduction in the dynamic stiffness of the system. Actually, the NSC, as a part of the stiffness unit, together with the supporting spring determines the stiffness characteristics of the vibration isolator. The NSC makes the stiffness of the vibration isolator nonlinear. It does not interfere with the static stiffness provided by the supporting spring, but changes the dynamic stiffness during vibration by the superposition of a variable vertical restoring force. Correspondingly, the force-displacement principles of the linear supporting spring, the NSC and the entire vibration isolation system are given in Figure 2. At the working range pointed out on the curves, the negative stiffness offsets part of the positive stiffness, and makes the system possess ultra-low dynamic stiffness while maintaining the static supporting capacity unchanged.
The NSCs formed by QCRMs are indicated by dash-line boxes in Figure 1c,d. The rollers in the NSC, which have the same displacement as the isolated object, are installed on the upper loading platform by horizontal springs. As the rollers move along the quadratic polynomial trajectory of the cam mounted on the baseplate, the compression length of the horizontal springs is affected, enabling the NSC to provide a varying force to the vibration isolation system.
The main function of the cam is to convert the vertical displacement along the vibration direction into the horizontal displacement of rollers, and then the direction of the elastic reaction force of the rollers back into the vertical direction. In CRM-NSCs, since the cam contours are easy to design and have regularity, their trajectory functions can be derived inversely according to the desired stiffness characteristics of the vibration isolator. In fact, both the negative stiffness structures with inclined-springs [10] and with link-springs [25] can be transformed into the unified form constructed by CRMs.
To further understand the QCRM-NSC in our research, the forces between a set of cam and roller are illustrated in Figure 3. Define y as the absolute displacement of the roller with the upward positive direction, and only consider the vibration in the vertical direction. The roller center at the static equilibrium position in Figure 3a is set as the origin of y, which is on the horizontal centerline of the cam. When the base of the vibration isolation is subjected to an external excitation z, there is a vertical relative displacement u = yz between the roller and the cam, as shown in Figure 3b. Based on the integrated model in [26] and the purpose of cubic nonlinear restoring force, the trajectory of the roller center with respect to u is defined as the quadratic function:
x ( u ) = a u 2
where x is the compression deformation length of the horizontal spring caused by u, and a is the quadratic coefficient of the trajectory.
The pressure of the horizontal spring keeps the roller in contact with the cam. So, the cam generates the force fc on the roller along the normal direction, which is equal to the force of the roller acting on the cam and opposite in direction. The horizontal component force fh of fc depends on the stiffness kn and total deformation length of the horizontal spring, which can be obtained as:
f h ( u ) = k n ( x a Δ y 2 δ n )
where δn is the pre-compressed length of the horizontal spring without the rate mass, and Δy, the static vertical displacement caused by rated mass, is selected as the maximum working displacement.
The angle between the horizontal force and the normal vector of the roller center trajectory is defined as β. Its tangent value can be obtained as tanβ = 2au by differentiating x with respect to u. Then, the vertical component force Fn on the roller, namely the force exerted on the upper loading platform by the QCRM, can be gained as:
F n ( u ) = f h tan β = 2 a 2 k n u 3 2 a k n ( a Δ y 2 + δ n ) u
When the horizontal spring has the largest compression length, tanβ = 0 which satisfies the requirement that there is no vertical component force at the equilibrium position.
Nondimensionalizing Equation (3), the non-dimensional force-displacement relationship can be expressed as:
F ¯ n ( u ¯ ) = 2 a ¯ 2 u ¯ 3 2 a ¯ 2 u ¯ 2 a ¯ δ ¯ n u ¯
where F ¯ n = F n / ( k n Δ y ) is the non-dimensional vertical force on the roller, u ¯ = u / Δ y is the non-dimensional relative displacement, a ¯ = a Δ y is the non-dimensional quadratic coefficient, and δ ¯ n = δ n / Δ y is the non-dimensional pre-compressed length of the horizontal spring.
Next, differentiating Equation (4) with respect to u ¯ , the non-dimensional stiffness K ¯ n is also obtained as:
K ¯ n ( u ¯ ) = 6 a ¯ 2 u ¯ 2 2 a ¯ 2 2 a ¯ δ ¯ n
The non-dimensional force-displacement characteristics and non-dimensional stiffness for different δ ¯ n and a ¯ are plotted in Figure 4 and Figure 5. At the static equilibrium position ( u ¯ = 0 ), the restoring force provided by the QCRM is equal to zero and changes direction, and correspondingly the negative stiffness is symmetrical and reaches the minimum. Then, with the displacement moving away from the symmetric point, both the force and stiffness increase. From Figure 4, it can be found that for a fixed a ¯ , the change of δ ¯ n will shift the stiffness curves longitudinally, but not change their shape. Raising δ ¯ n can broaden the negative stiffness region and provide a lower negative stiffness. In Figure 5, a ¯ is varied, but δ ¯ n is fixed. The curvature of the stiffness curves is determined by a ¯ , while the stiffness values at some points on the curves change little, for example u ¯ = ± 0.85 . The decrease of a ¯ extends the negative stiffness region but causes the minimum of the negative stiffness to increase. The curves drawn by dotted line correspond to the case where a ¯ = 0 . Actually, the value of a ¯ cannot be zero. Meanwhile, according to Equation (5), the second derivative of K ¯ n is greater than zero. Therefore, the negative stiffness must be a concave function, so that when the vibration isolator is far from the static equilibrium position, the total stiffness of the system can remain non-negative to avoid the instability in [27]. Properly selecting δ ¯ n and a ¯ can provide negative stiffness throughout the whole displacement range.

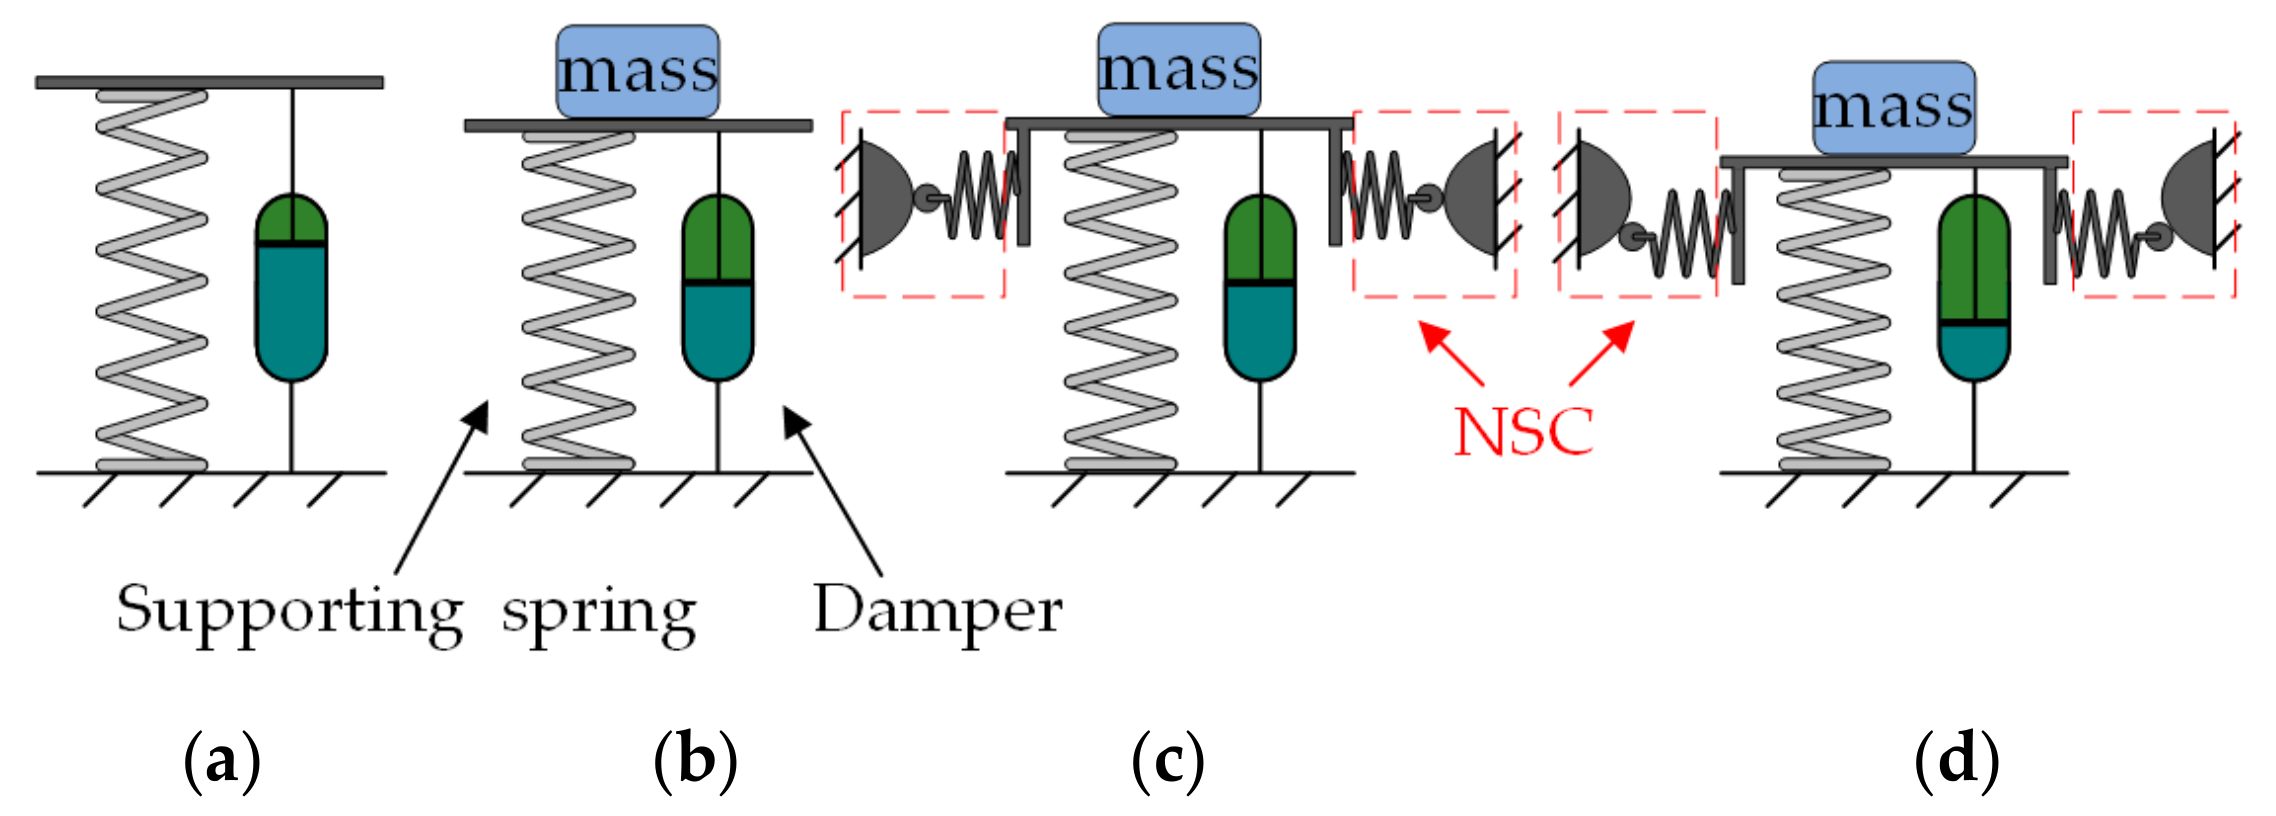
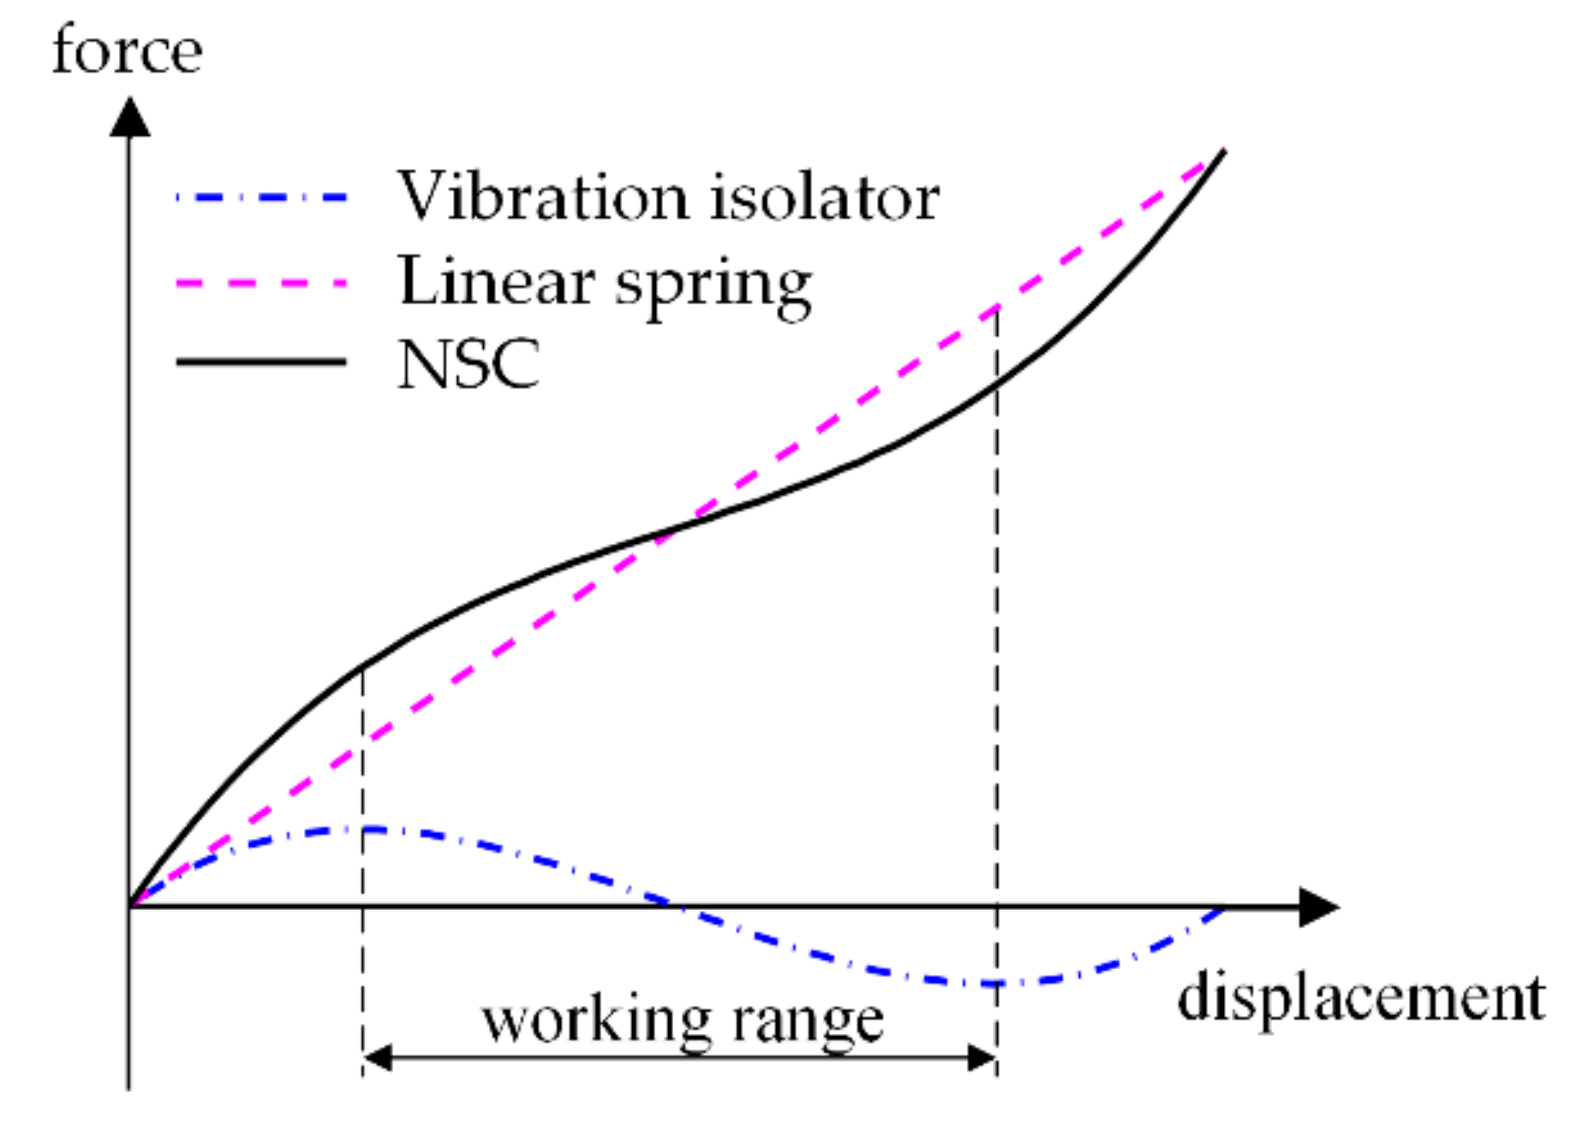
3. Nonlinear Vibration Isolator with Negative Stiffness Corrector

3.1. Modelling of Nonlinear Vibration Isolator

The proposed nonlinear vibration isolation system is mainly composed of the positive stiffness mechanism, the QCRM-NSC, the upper loading platform (2), and the baseplate (6), as shown in Figure 6. The positive stiffness mechanism here consists of four vertical linear springs (5) which are fixed on the corners of the baseplate to carry the rated mass m (1) and ensure the reliability of the vibration isolator. The QCRM-NSC is designed based on the principle described in Section 2 and located in the middle of the isolator. As the important components of the NSC, two grooved cams (3) are symmetrically mounted on the baseplate. After being connected by the horizontal compression linear spring (7), the rollers (4) contacting with the cams are horizontally installed under the upper platform (2) by the hollow tube (8). The pre-compression of the horizontal spring can be adjusted by the nuts (9) at the bottom of the cams. Vertical adjustment nuts (10) are also adopted to eliminate the interference of static load error on the static equilibrium position of the vibration isolator.
Since the positive stiffness mechanism and the NSC are connected in parallel, the sum of their restoring forces is the total restoring force of the entire vibration isolator. When the stiffness of each vertical spring is kv, the force-displacement characteristic can be written as:
F k ( u ) = 4 a 2 k n u 3 4 a k n ( a Δ y 2 + δ n ) u + k p u
where Fk is the restoring force provided by the vibration isolator, kp = 4kv is the total stiffness of the positive stiffness mechanism, and Δy = mg/kp.
Dividing both sides of Equation (6) by kpΔy, the non-dimensional restoring force F ¯ k of the isolator can be derived as:
F ¯ k ( u ¯ ) = 4 r a ¯ 2 u ¯ 3 4 r a ¯ 2 u ¯ 4 r a ¯ δ ¯ n u ¯ + u ¯
where r = kn/kp is the stiffness ratio, and the other non-dimensional parameters have the same definitions with those in Equation (4).
Then, the non-dimensional stiffness K ¯ is obtained by differentiating Equation (7) with respect to the non-dimensional displacement u ¯ , as:
K ¯ ( u ¯ ) = 12 r a ¯ 2 u ¯ 2 4 r a ¯ 2 4 r a ¯ δ ¯ n + 1

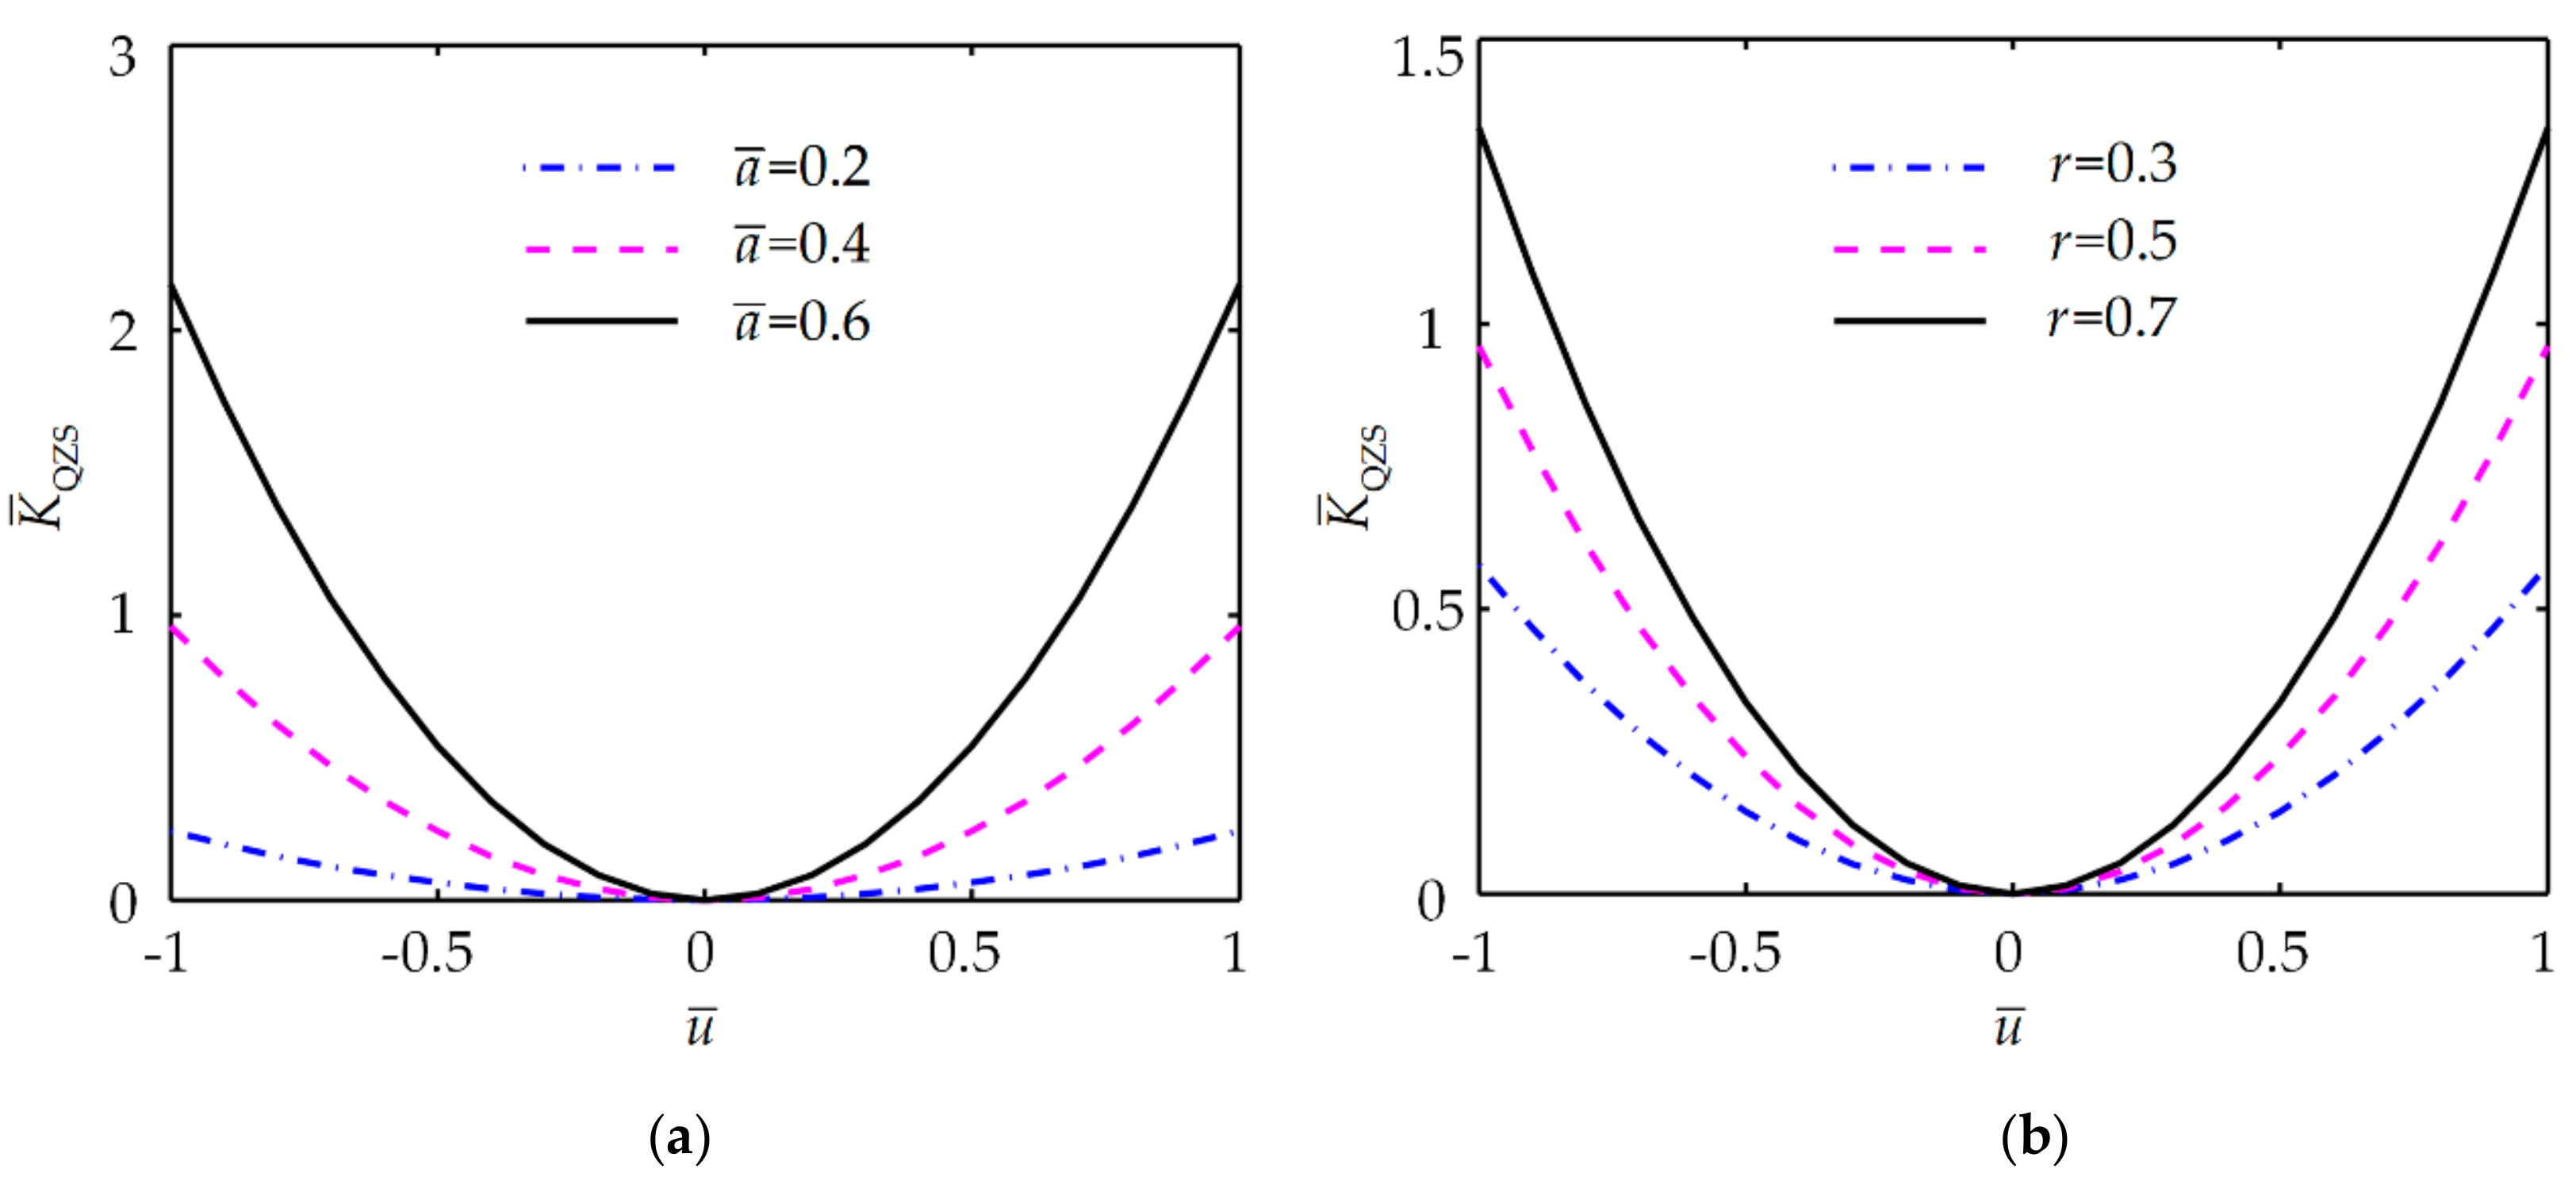
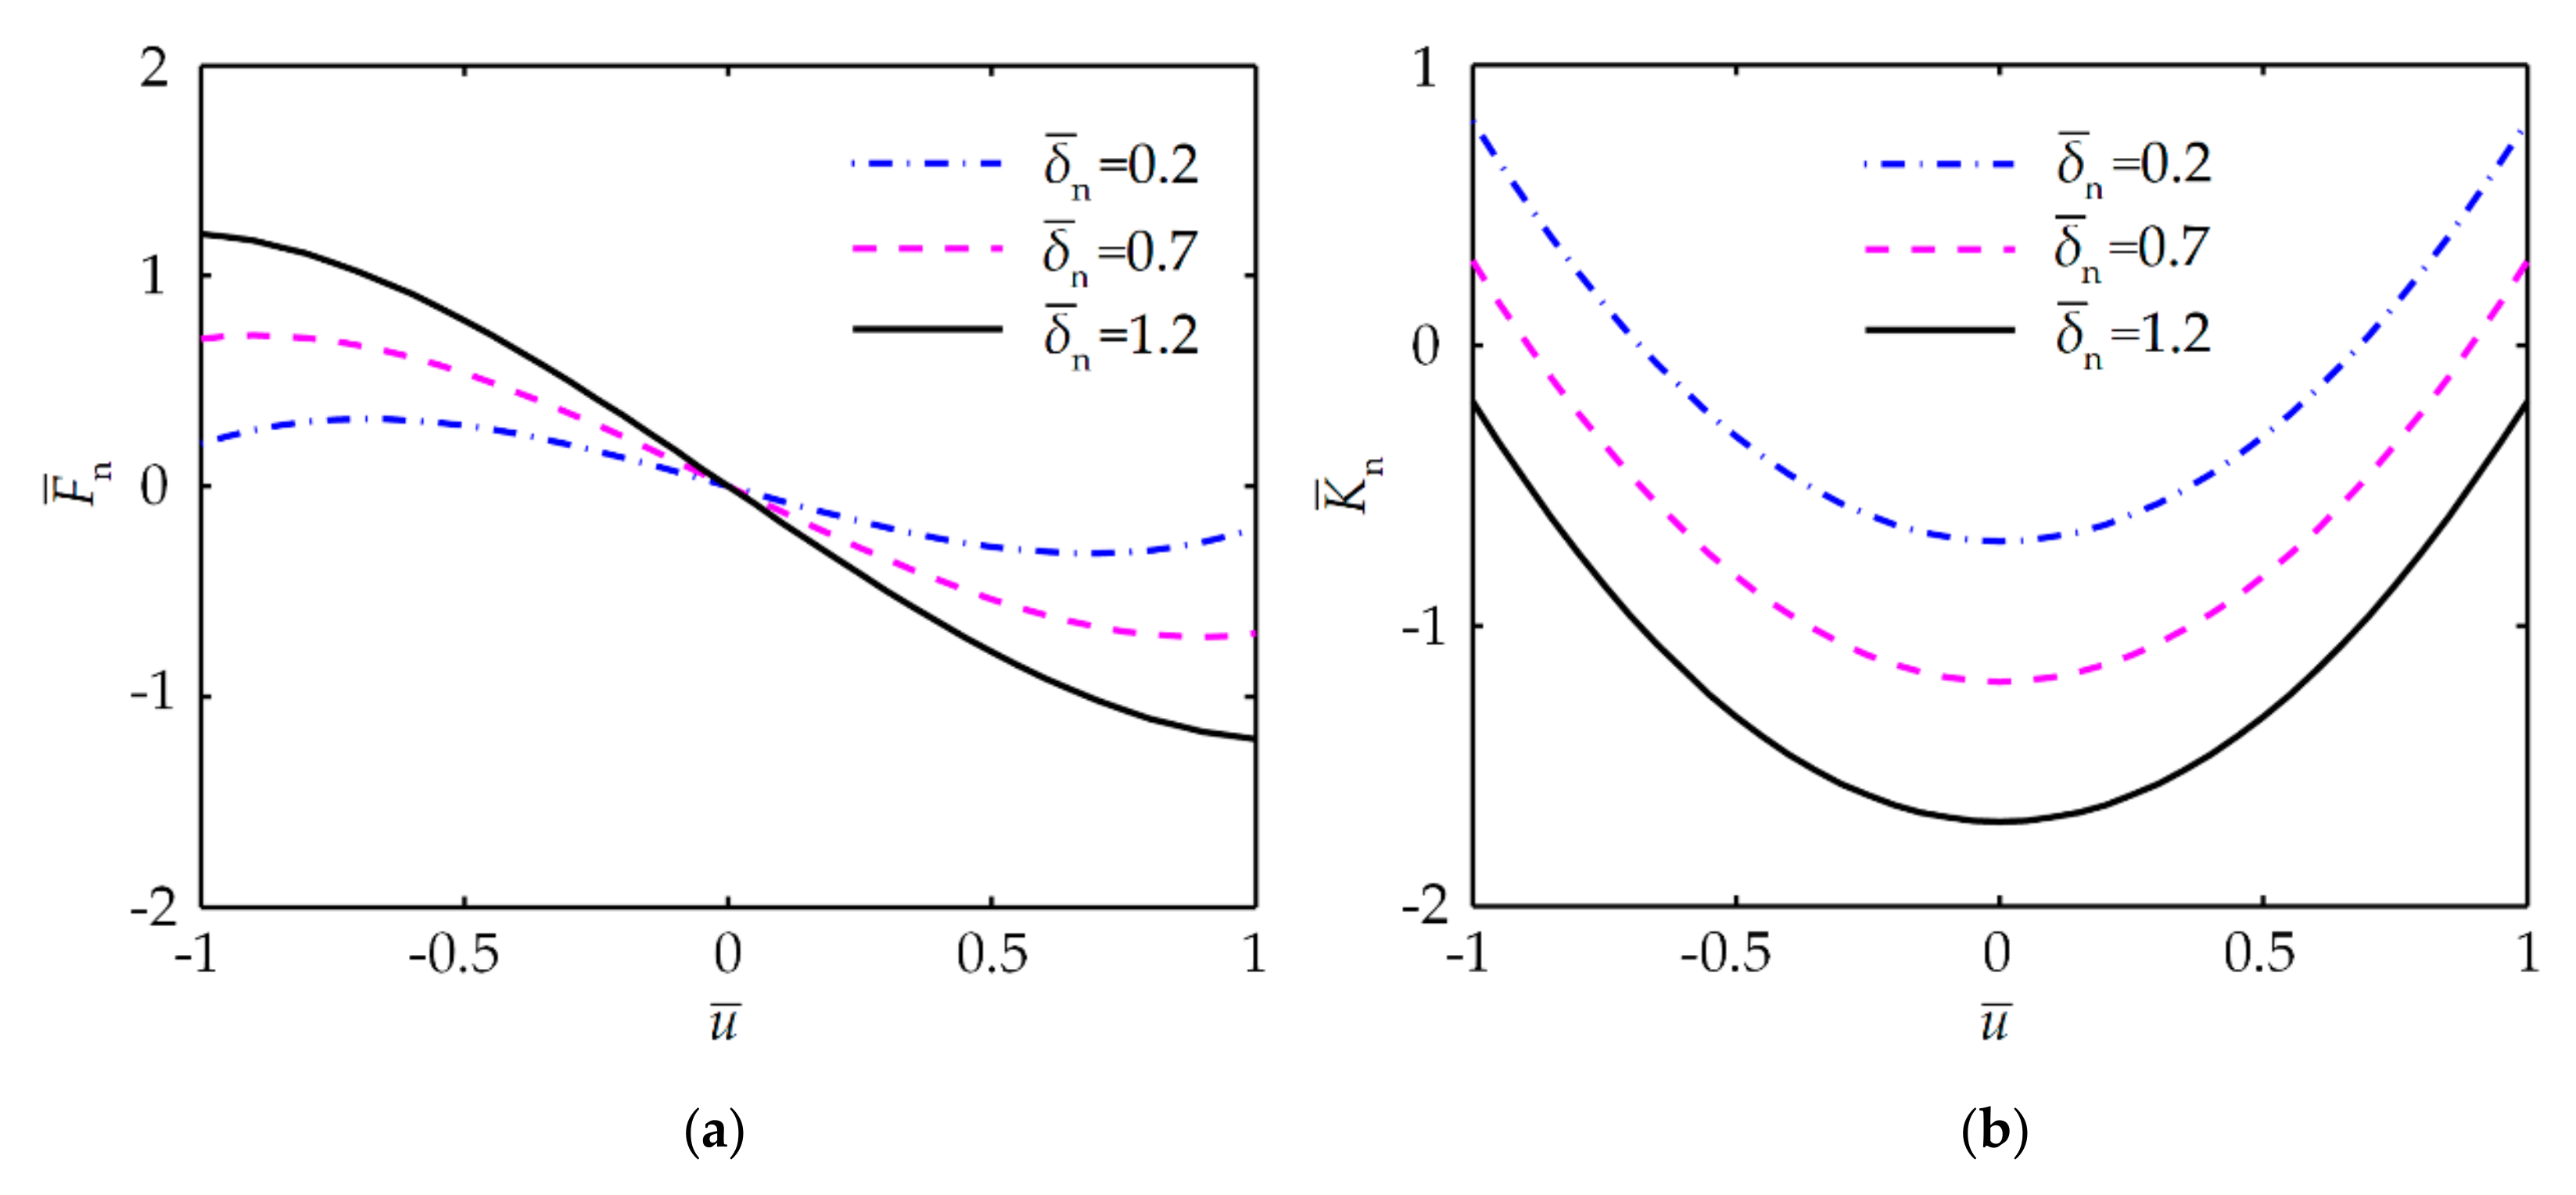
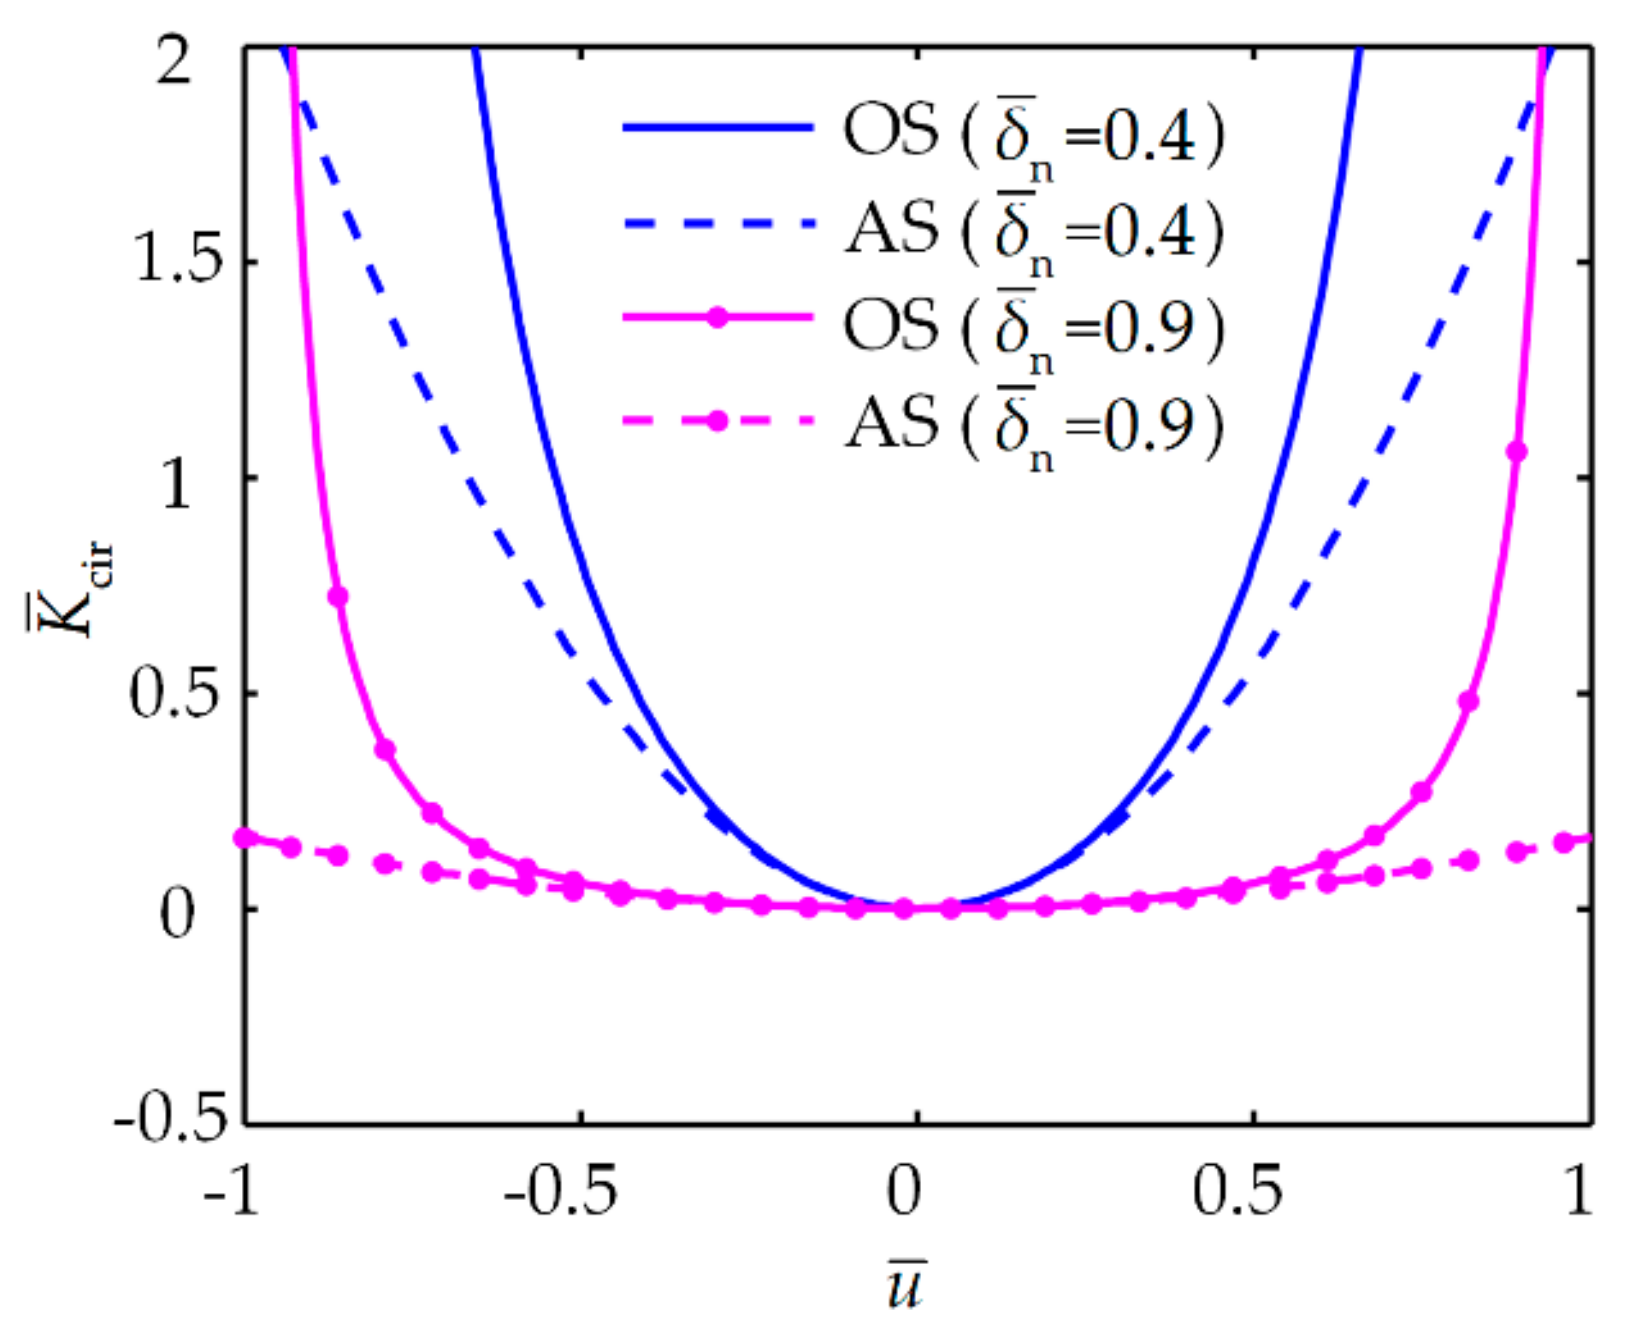
3.2. Condition for Quasi-Zero Stiffness

The nonlinearity of K ¯ makes the vibration isolation system possess high-static-low-dynamic stiffness characteristic. Furthermore, it is possible for negative stiffness to completely offset all the positive stiffness, so as to achieve the QZS. Therefore, by setting the Equation (8) to zero at the static equilibrium position, that is, K ¯ ( u ¯ = 0 ) = 0 , the required relationship that gives the system QZS characteristic can be obtained as:
δ ¯ nQZS = 1 4 r a ¯ a ¯
With such a configuration, the non-dimensional stiffness of the QZS system is reformulated as:
K ¯ QZS ( u ¯ ) = 12 r a ¯ 2 u ¯ 2
From the non-dimensional stiffness curves for different a ¯ and r in Figure 7, it can be found that the QZS is realized under different stiffness characteristics. Increasing the stiffness ratio and the quadratic coefficient can both get a larger range of low dynamic stiffness near the zero-stiffne.

4. Dynamics and Isolation Performance of the Vibration Isolator

4.1. Dynamic Equation

Based on Newton’s second law and the structure in Figure 6, the motion equation of the vibration isolation system exposed to the base displacement excitation z ( t ) = Z cos ( ω t ) with amplitude Z and frequency ω is established as:
m d 2 u d t 2 + c d u d t + 4 a 2 k n u 3 4 a k n ( a Δ y 2 + δ n ) u + k p u = m ω 2 Z cos ( ω t )
where c is the damping coefficient in the vertical direction.
Considering the QZS condition in Equation (9), the non-dimensional form of Equation (11) is obtained as:
d 2 u ¯ d τ 2 + 2 ξ d u ¯ d τ + 4 a ¯ 2 r u ¯ 3 = Ω 2 Z ¯ cos ( Ω τ )
where the new non-dimensional transformation parameters are defined as Ω = ω ω 0 , ω 0 = k p m , τ = ω 0 t , ξ = c 2 m ω 0 , z ¯ ( τ ) = Z ¯ cos ( Ω τ ) and Z ¯ = Z Δ y .
Here, the harmonic balance method (HBM) [30], an approximate analytical algorithm, is used to acquire dynamic characteristics of the isolation system. Since the primary resonance response is of interest, the steady solution to Equation (12) for u ¯ can be written as:
u ¯ = A ¯ cos ( Ω τ + θ )
where A ¯ and θ are the amplitude and phase of the response, respectively. Substituting Equation (13) into Equation (12) and making the coefficients of sin(Ωτ) and cos(Ωτ) equal to zero, the following relations can be obtained:
2 ξ Ω A ¯ + Ω 2 Z ¯ sin θ = 0 3 a ¯ 2 r A ¯ 3 Ω 2 A ¯ Ω 2 Z ¯ cos θ = 0
By the nature of trigonometric function, Equation (14) can be combined as the implicit amplitude-frequency equation:
( A ¯ 2 Z ¯ 2 ) Ω 4 + ( 4 ξ 2 A ¯ 2 6 a ¯ 2 r A ¯ 4 ) Ω 2 + 9 a ¯ 4 r 2 A ¯ 6 = 0

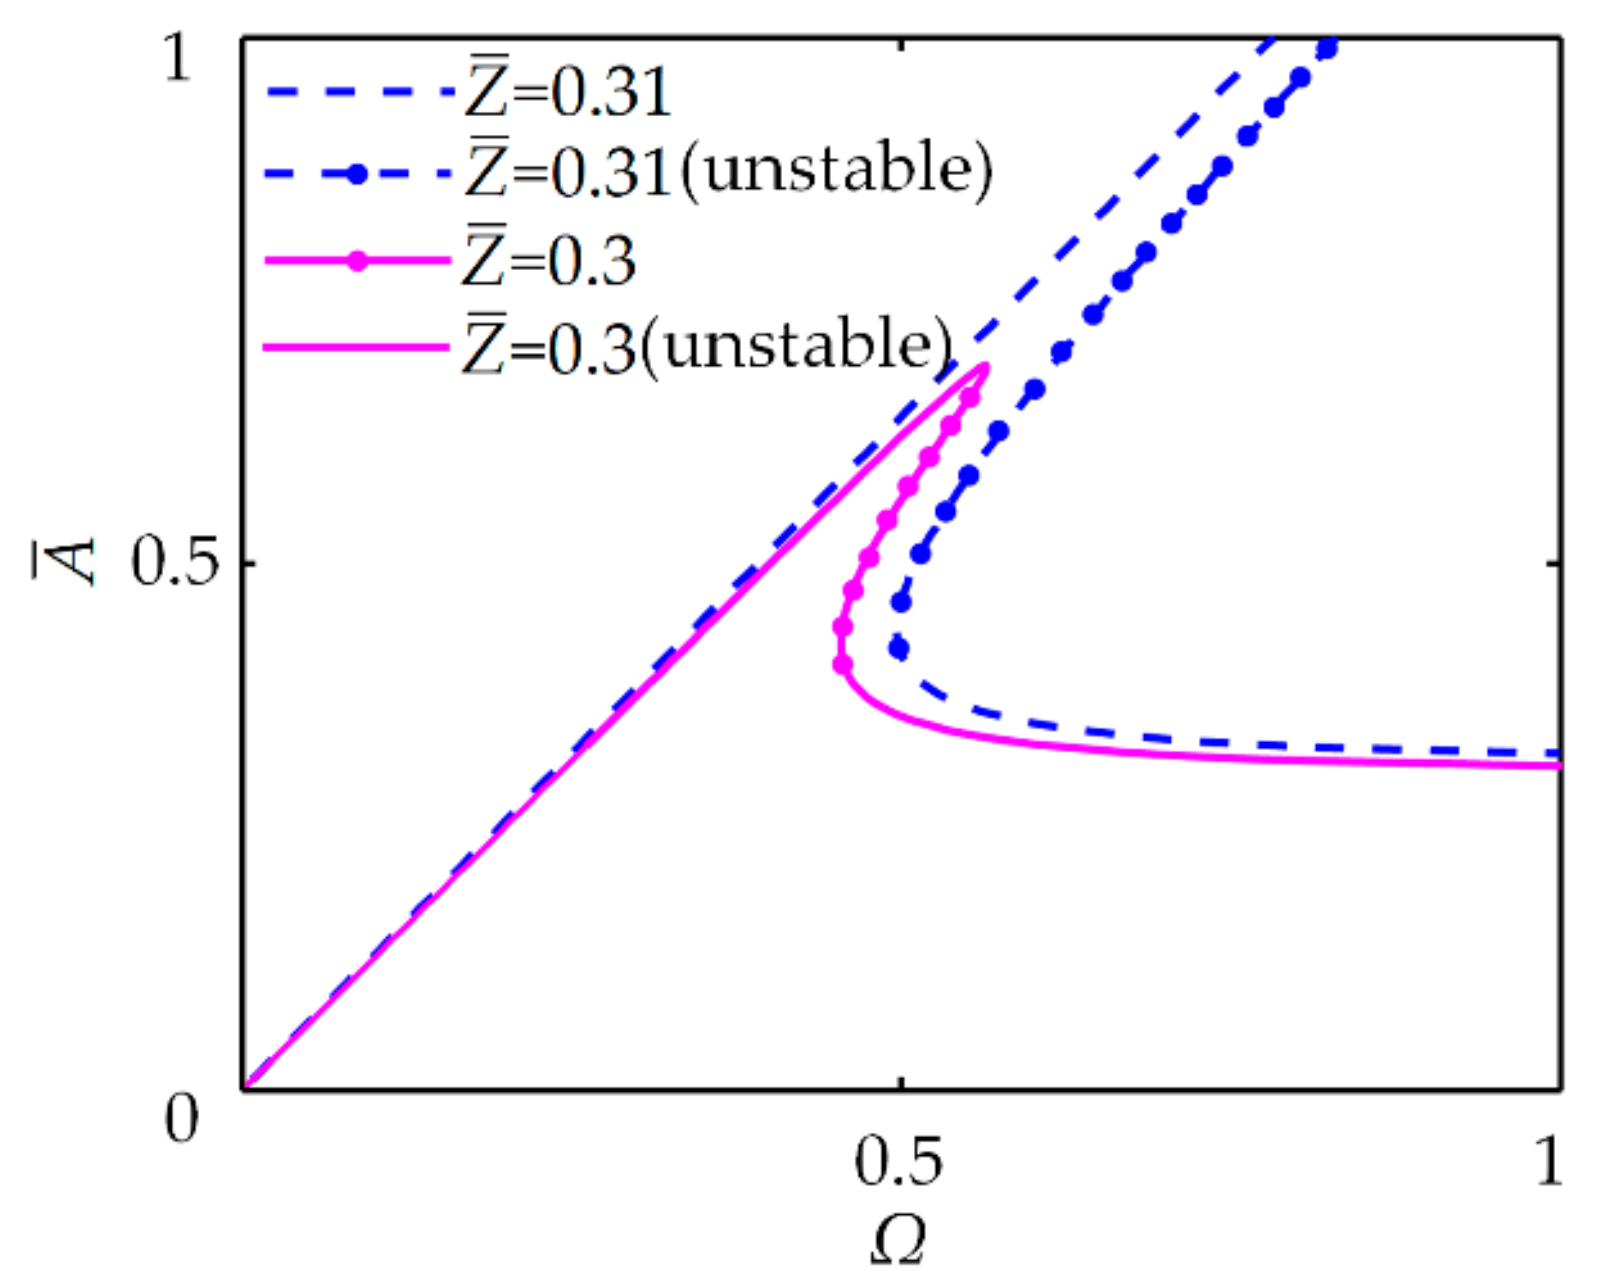
4.2. Frequency Response Characteristics and Stability

From Equation (15), the positive solutions for non-dimensional excitation frequency Ω can be obtained as:
Ω 1 , 2 = ( 3 a ¯ 2 r A ¯ 4 2 ξ 2 A ¯ 2 ) ± A ¯ 2 4 ξ 4 12 ξ 2 a ¯ 2 r A ¯ 2 + 9 Z ¯ 2 a ¯ 4 r 2 A ¯ 2 A ¯ 2 Z ¯ 2
Equation (16) implies the relationships between Ω and A ¯ during the steady-state response which are often plotted by frequency response curve (FRC). Based on this relationship, the following response features of the vibration isolation system can be predicted in the form of formulas.
The peak amplitude of vibration response occurs when Ω has a unique solution. Hence, the peak amplitude A ¯ peak and the corresponding excitation frequency Ωpeak under QZS condition are:
A ¯ peak = 2 ξ 2 12 ξ 2 a ¯ 2 r 9 Z ¯ 2 a ¯ 4 r 2
and
Ω peak = 18 ξ 6 a ¯ 2 r Z ¯ 2 12 ξ 8 12 ξ 6 45 ξ 4 a ¯ 2 r Z ¯ 2 + 54 ξ 2 a ¯ 4 r 2 Z ¯ 4 81 4 a ¯ 6 r 3 Z ¯ 6
In resonance response, the backbone curve, drawn by the peak amplitude points (Ωpeak, A ¯ peak ), can be formulated as:
Ω b = 3 a ¯ 2 r A ¯ 4 2 ξ 2 A ¯ 2 A ¯ 2 Z ¯ 2
When the square root of the denominator in Equation (17) is not positive, A ¯ peak does not exist. To ensure the maximum response of the system is bounded, the parameters should be satisfied that:
3 a ¯ 2 r Z ¯ 2 4 < ξ
In a nonlinear system, the jump phenomenon is always unavoidable. To investigate the stability of the steady-state response in Equation (13), a small disturbance e ¯ ( τ ) is added in the harmonic solution. Then, A ¯ cos ( Ω + θ ) + e ¯ ( τ ) is substituted into Equation (12) without considering the higher terms of e ¯ , resulting in:
e ¯ ( τ ) + 2 ξ e ¯ ( τ ) + 6 a ¯ 2 r A ¯ 2 ( 1 + cos 2 ( Ω τ + θ ) ) e ¯ ( τ ) = 0
Therefore, the unstable solution of Equation (12) at steady state is given as:
Ω 4 + ( 4 ξ 2 12 a ¯ 2 r A ¯ 2 ) Ω 2 + 27 a ¯ 4 r 2 A ¯ 4 = 0
Two FRCs of the vibration isolation system are plotted in Figure 8 to illustrated the transition of response from bounded to unbounded. Z ¯ is chosen as the variable parameter, and the maximum response is bounded when Z   < 3.079 with a ¯ = 0.45 , r = 1 and ξ = 0.12. At Z ¯ = 0.3, the FRC bends to the right as Ω grows, which denotes the hardening stiffness characteristic of the system. The unstable response region between the jump-down and the jump-up frequencies appears on the inclined side of the resonant response. As Z ¯ increases to 0.31, the FRC still has right bend and unstable region, but the maximum response of the system changes to unbounded.
In order to prove the vibration isolation capability of the QZS isolator, the equivalent linear vibration isolator is also given in this paper for comparison. When only the QCRM-NSC is removed but the other structures remain unchanged in Figure 6, the motion equation of the equivalent linear vibration isolation system can be derived as:
d 2 u ¯ d τ 2 + 2 ξ d u ¯ d τ + u ¯ = Ω 2 Z ¯ cos ( Ω τ )
The response of the linear system can be easily obtained as:
A ¯ l = Ω 2 Z ¯ ( 1 Ω 2 ) 2 + 4 ξ 2 Ω 2

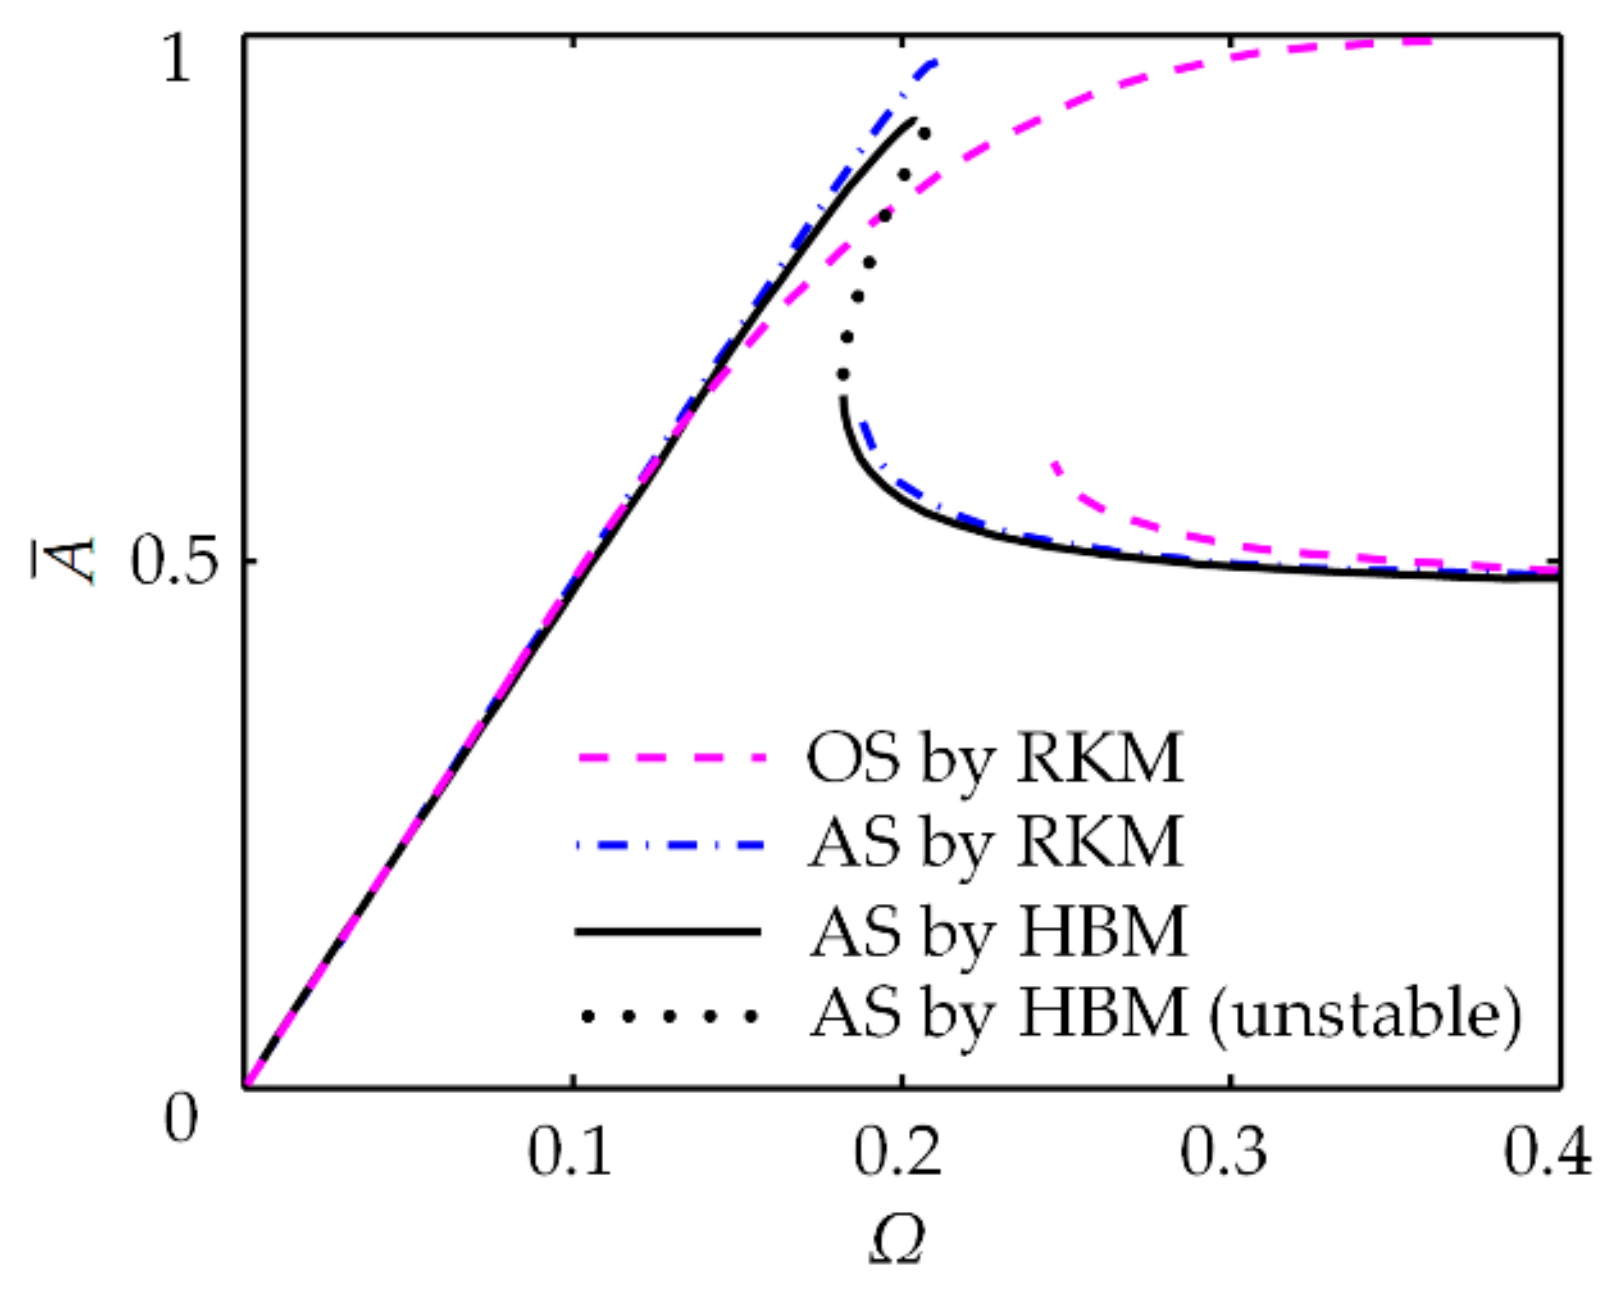
4.3. Advantage of QCRM in Calculation Accuracy

Unlike the classic NSC whose complex stiffness needs to be approximated by the Taylor series expansion in dynamic analysis, the NSC composed of QCRMs can directly provide the negative stiffness in the form of a quadratic polynomial. In this subsection, the NSC with a semicircular cam trajectory is exemplified and compared to show the harmful effects of stiffness approximation on response prediction and parameter selection. Except for its positive stiffness element constructed by the same arrangement in Figure 6, the structure and derivation of its negative stiffness was detailed in [23]. Hence, the non-dimensional stiffness of the NSC with a semicircular cam trajectory is obtained as:
K ¯ cir = 1 1 δ ¯ cir 1 + δ ¯ cir 1 ( 1 u ¯ 2 ) 3 / 2
Its approximate stiffness from a second order Taylor expansion at the equilibrium point is:
K ¯ cir * = 3 ( 1 δ ¯ cir ) 2 δ ¯ cir u ¯ 2
where δ ¯ cir is the non-dimensional pre-compressed length of the horizontal spring in the NSC with a semicircular cam trajectory, and equal to 2kv/kn under the QZS condition.
Figure 9 shows the comparisons between the non-dimensional original stiffness (OS) and the non-dimensional approximate stiffness (AS) with different δ ¯ cir . It can be found that the approximation accuracy is determined by both the structure parameter and the displacement. When δ ¯ cir = 0.4, the approximation error is large, and only a very small part of the displacement around u ¯ = 0 can meet the calculation requirement. When δ ¯ cir = 0.9 (the choice of [23]), the approximation accuracy around small displacement is improved, but the error is still obvious at large displacement. The error caused by the stiffness approximation will reduce the reliability of the dynamic analysis of the vibration isolation system. To make matters worse, the choice of structure parameters and the working range of isolation displacement are limited to ensure that calculation results are acceptable. Higher order Taylor approximation can improve this issue, but it is rarely used because of the increased computational cost. By contrast, the stiffness provided by the QCRM-NSC is a quadratic function directly. This means that analysis under arbitrary displacements and parameters is reliable and easy to implement. The simple stiffness expression also facilitates the study of the NSC in isolators with nonlinear supporting or multi-layer nested structure.
Figure 10 demonstrates the influence of stiffness approximation from the perspective of dynamic response. The numerical response solutions of the dynamic equations with the original and the approximate stiffness, calculated by Runge–Kutta method (RKM), are plotted as the pink dashed line and the blue dash-dotted line, respectively. Compared with the FCR of the approximate analytical solution obtained by HBM, plotted as the black solid and dotted line, it can be seen that different calculation methods have little effect on calculation accuracy, which has been verified in literature. However, the approximation of stiffness makes the FRCs quite different. In the approximate FRC, not only does the large tilt on the original FRC disappear, but the correct peak amplitude and jump frequencies are not obtained. Moreover, the unbounded response is incorrectly given as bounded.

4.4. Vibration Isolation Performance under Different Excitations

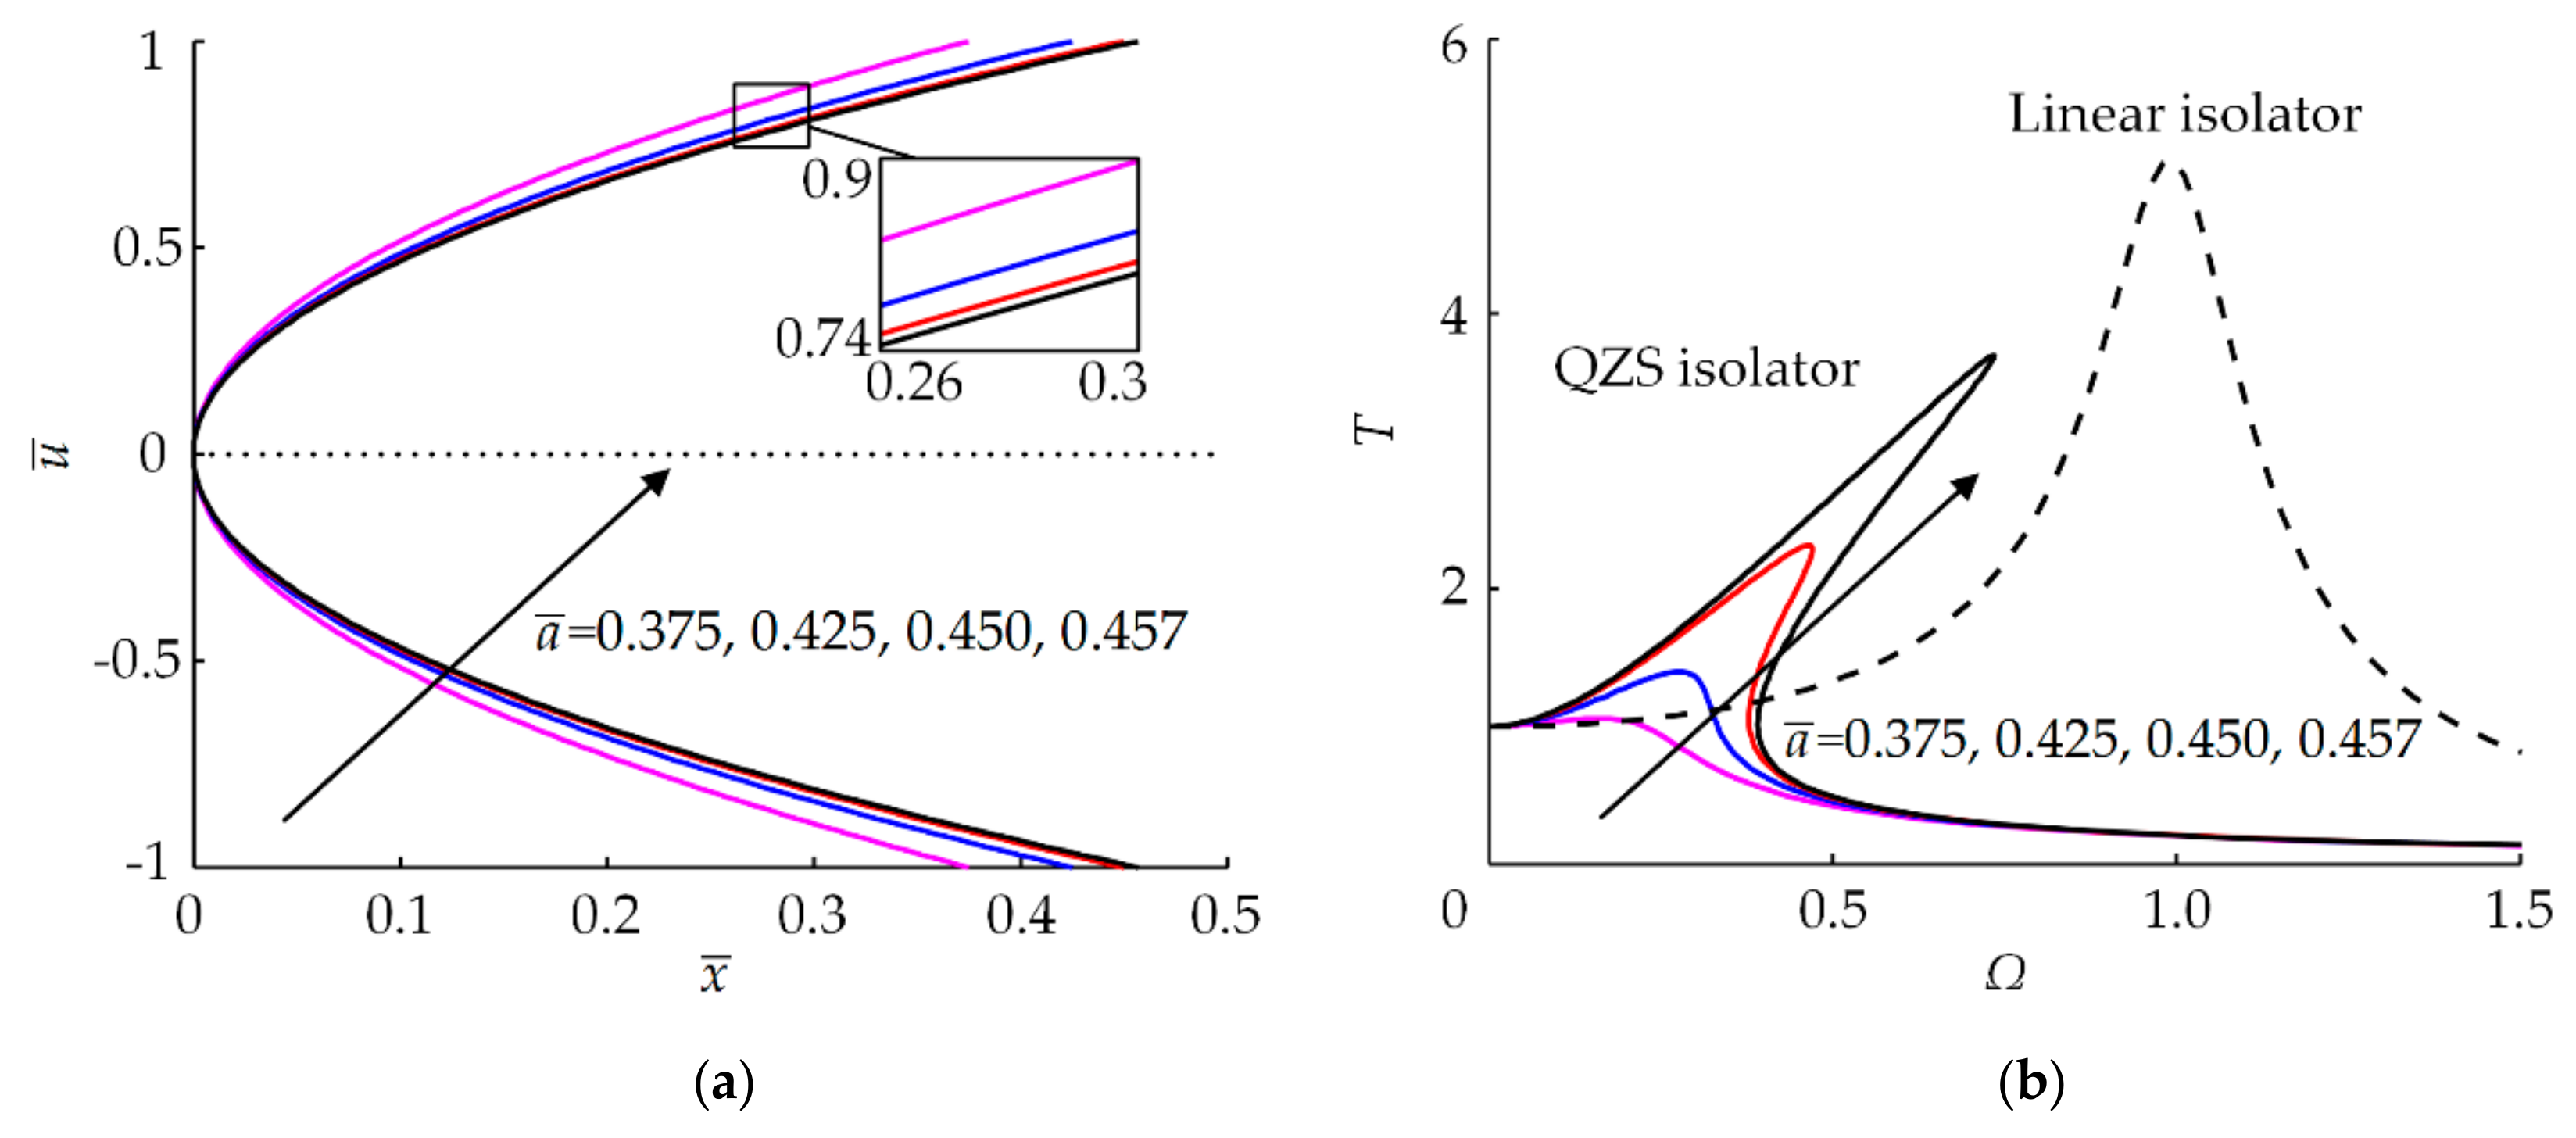
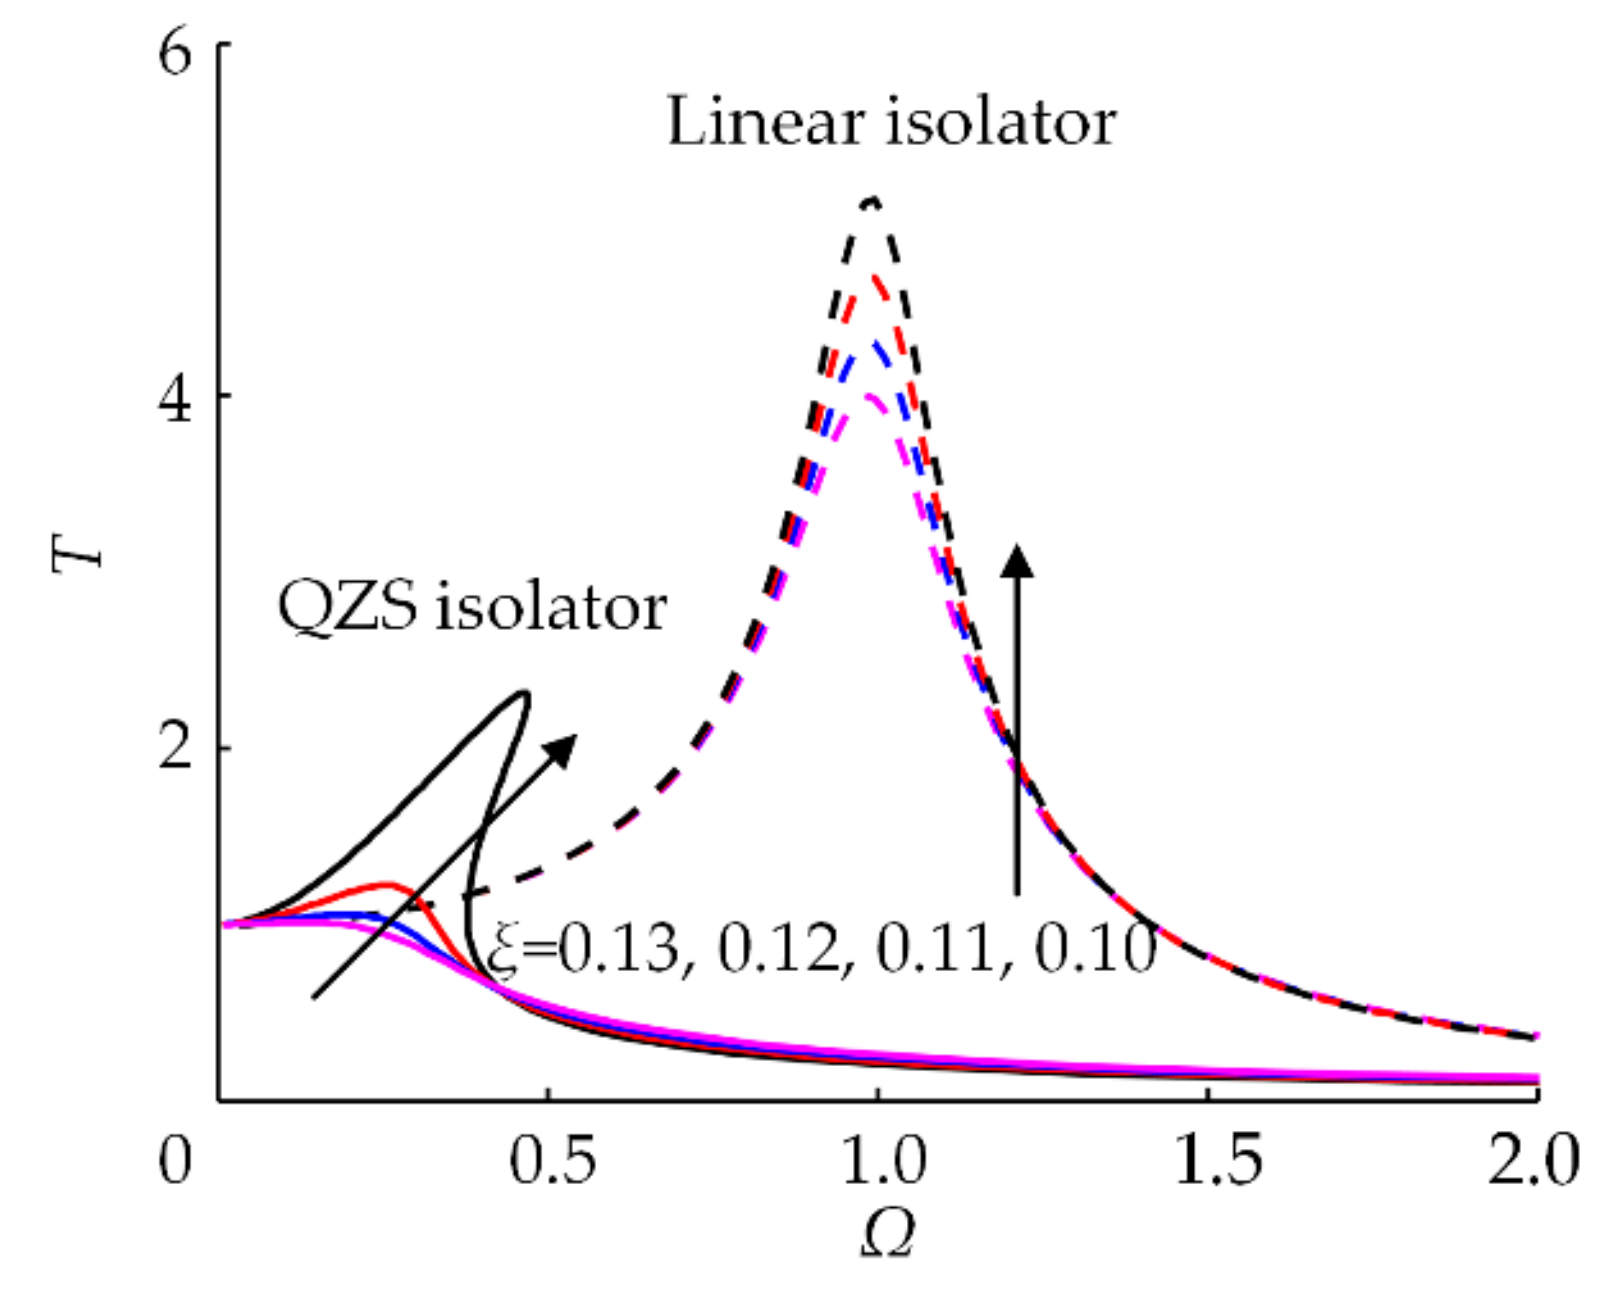
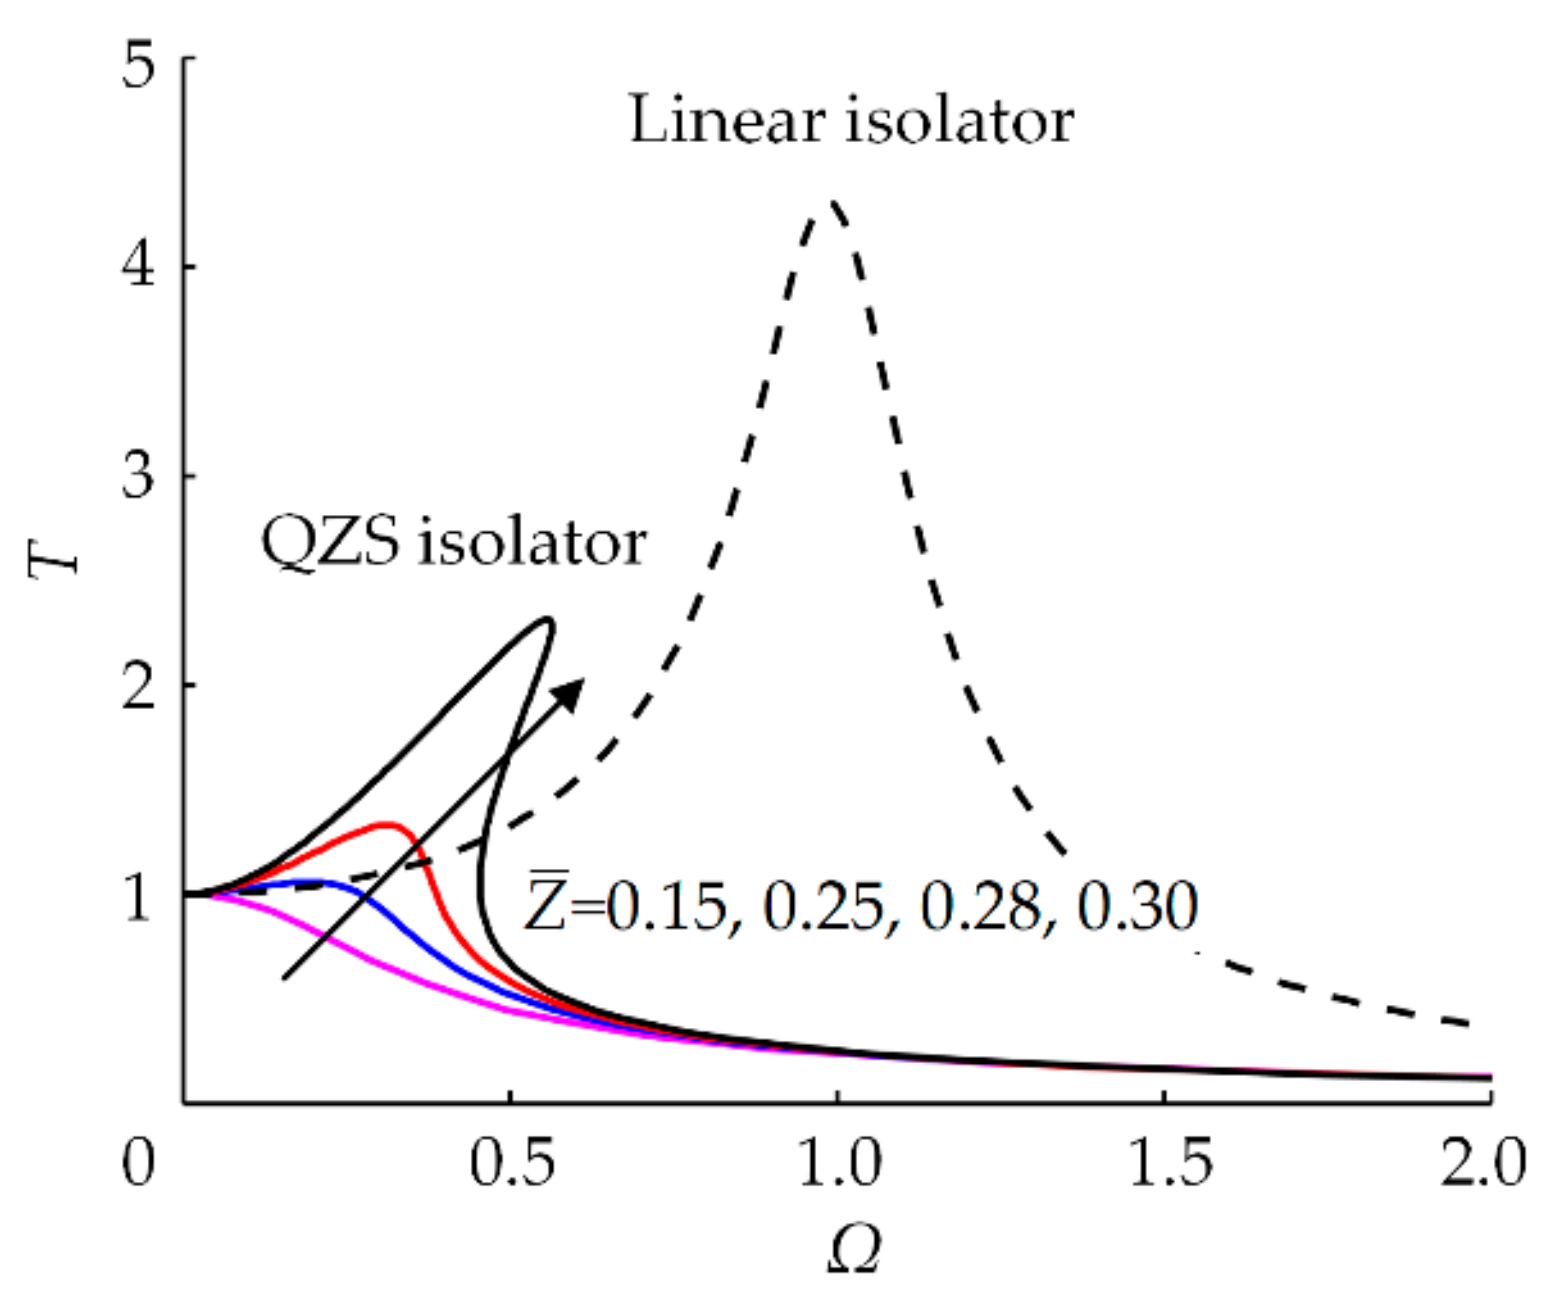
4.4.1. Displacement Transmissibility to Sinusoidal Excitation

When subjected to a base displacement excitation, the vibration isolation capability of an isolator can be evaluated by displacement transmissibility T. For a linear isolation system, its absolute displacement transmissibility can be given by the ratio of the response amplitude of the isolated object to the excitation amplitude of the baseplate, and is described as T l = Ω 2 / ( 1 Ω 2 ) 2 + 4 ξ 2 Ω 2 . The transmissibility of a nonlinear vibration isolation system is more complicated because it is related to the level of excitation. According to the relationship of motion, the non-dimensional absolute displacement of the isolated mass is y ¯ = u ¯ + z ¯ . Then, the absolute displacement transmissibility Tn of the nonlinear vibration isolator is obtained as:
T n = A ¯ 2 + Z ¯ 2 + 2 A ¯ Z ¯ cos θ Z ¯
From the previous analysis, the response of the vibration isolator with QCRM-NSC under QZS condition is related to the nonlinear stiffness coefficient 4 a ¯ 2 r , damping ratio ξ, and excitation amplitude Z ¯ . Since a ¯ 2 and r play the same role in vibration response, here only a ¯ is selected to represent the nonlinear stiffness coefficient. Considering the bounded condition of the response and the practical working condition, the calculations for dynamic characteristics of the vibration isolator have been conducted. The parameter values listed in Table 1 can clearly reflect the system response changes with the parameters, and are used in the following discussion.
The quadratic coefficient a ¯ is a key parameter of the negative stiffness structure. When ξ = 0.10 and Z ¯ = 0.25, the effects of a ¯ on the absolute displacement transmissibility of the QZS isolator are shown by the solid line in Figure 11. With a small a ¯ , the transmissibility curve is gentle and there is no resonance. The effective vibration isolation starts at Ω = 0.23. When a ¯ reaches to 0.425, a resonance peak with a tendency to the right occurs on the curve, but the transmissibility does not present obvious nonlinear characteristics. As a ¯ increases, the peaks of the transmissibility become larger and move to higher frequency, which results in the shrink of the vibration isolation range. At the same time, the curves begin to show strong hardening nonlinearity with the nonlinear phenomena, such as bend and jump. This is consistent with the cases in Figure 5 and Figure 7, in which increasing a ¯ strengthens the nonlinearity of stiffness. In addition, according to Figure 11a, it can be found that when a ¯ is large, the resonance response is sensitive to the change of a ¯ . A small change in a ¯ will cause a large difference in response. Therefore, a ¯ should be adjusted to make the QZS isolator have a suitable nonlinearity to guarantee the vibration isolation performance. Compared with the transmissibility curves of the equivalent linear vibration isolator with the same supporting stiffness drawn by dashed line, the resonance response of the linear system is eliminated. Even though the value of a ¯ is large, the resonance for the QZS isolator still has a lower frequency and smaller amplitude.
Figure 12 shows the effects of damping ratio ξ on absolute displacement transmissibility, when a ¯ = 0.45 and Z ¯ = 0.25. From the transmissibility curves of the QZS vibration isolator plotted by solid line, the growth of ξ can gradually suppress the resonance and nonlinearity in response, which reduces both the frequency and peak of resonance. In the equivalent linear vibration isolation system (dashed line), increasing ξ also weakens the peak of the transmissibility curve at resonance, but it cannot change the resonance frequency. Obviously, only the isolation frequency band of the nonlinear system can be improved. Compared with the linear vibration isolator, the resonance of the QZS isolator is more sensitive to the change of small damping ratio. Additionally, it should be noted that in the QZS isolation system, the vibration isolation capability at the high-frequency range will be sacrificed when increasing ξ to control the resonance.
In Figure 13, the displacement transmissibility curves of the QZS isolator under different excitation amplitude Z ¯ are presented by solid line, when a ¯ = 0.45 and ξ = 0.12. The effects of Z ¯ on transmissibility are similar to that of a ¯ . Decreasing the value of Z ¯ can reduce the resonance frequency, weaken the resonance intensity, disappear the nonlinear characteristics, and attenuate the vibration response. Thus, the QZS vibration isolator has better vibration isolation performance for excitation with small amplitude than for that with large amplitude. Note that this is not suitable for the equivalent linear vibration isolator, because the excitation amplitude has no effect on its displacement transmissibility, plotted by dashed line in Figure 13. Compared with the transmissibility of the equivalent linear isolator under different parameters, it can be concluded that after adding the NSC proposed in this paper, the resonance peak of the vibration response is greatly suppressed and moves to the left, which reduces the minimum vibration isolation frequency and expands the effective frequency range. Even at the high-frequency band where the linear vibration isolator works, the QZS vibration isolator still has superior vibration isolation performance.

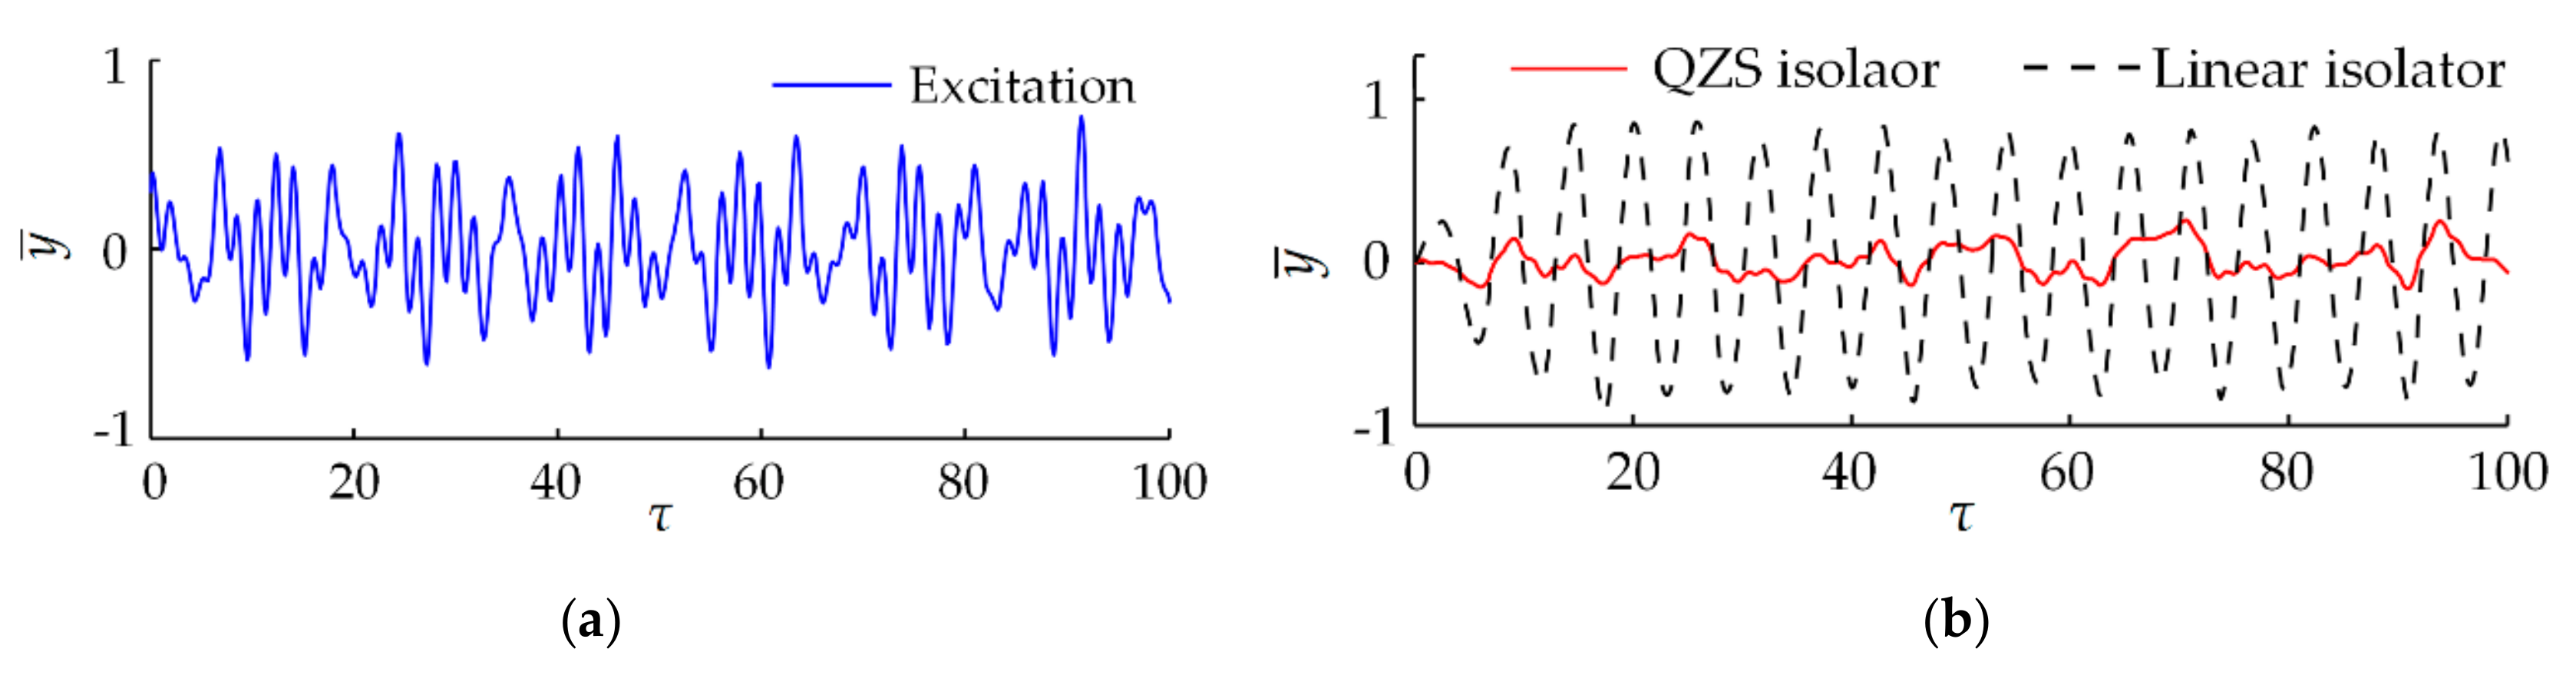
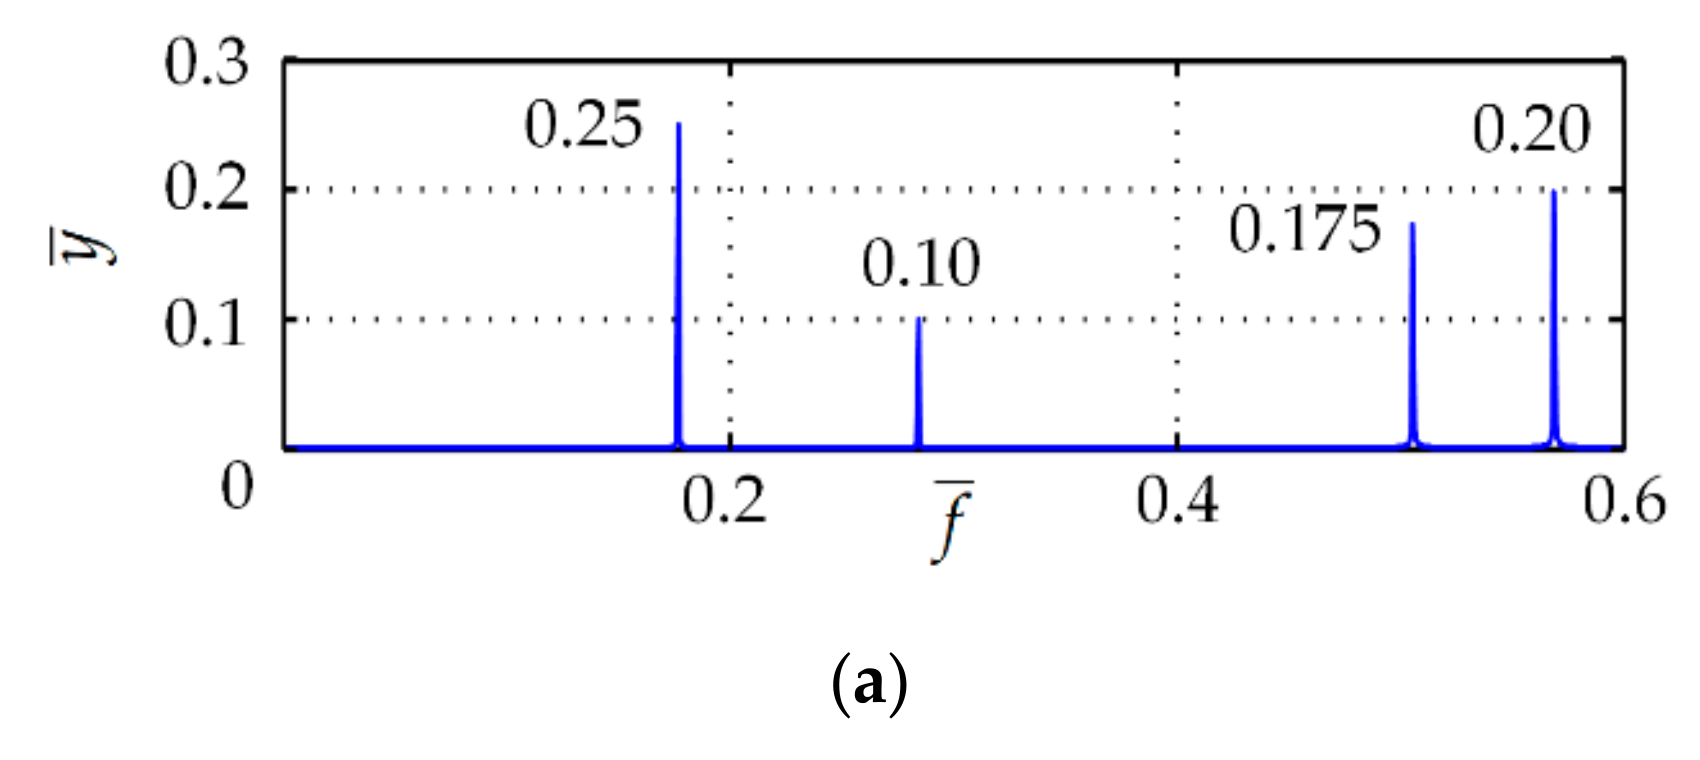
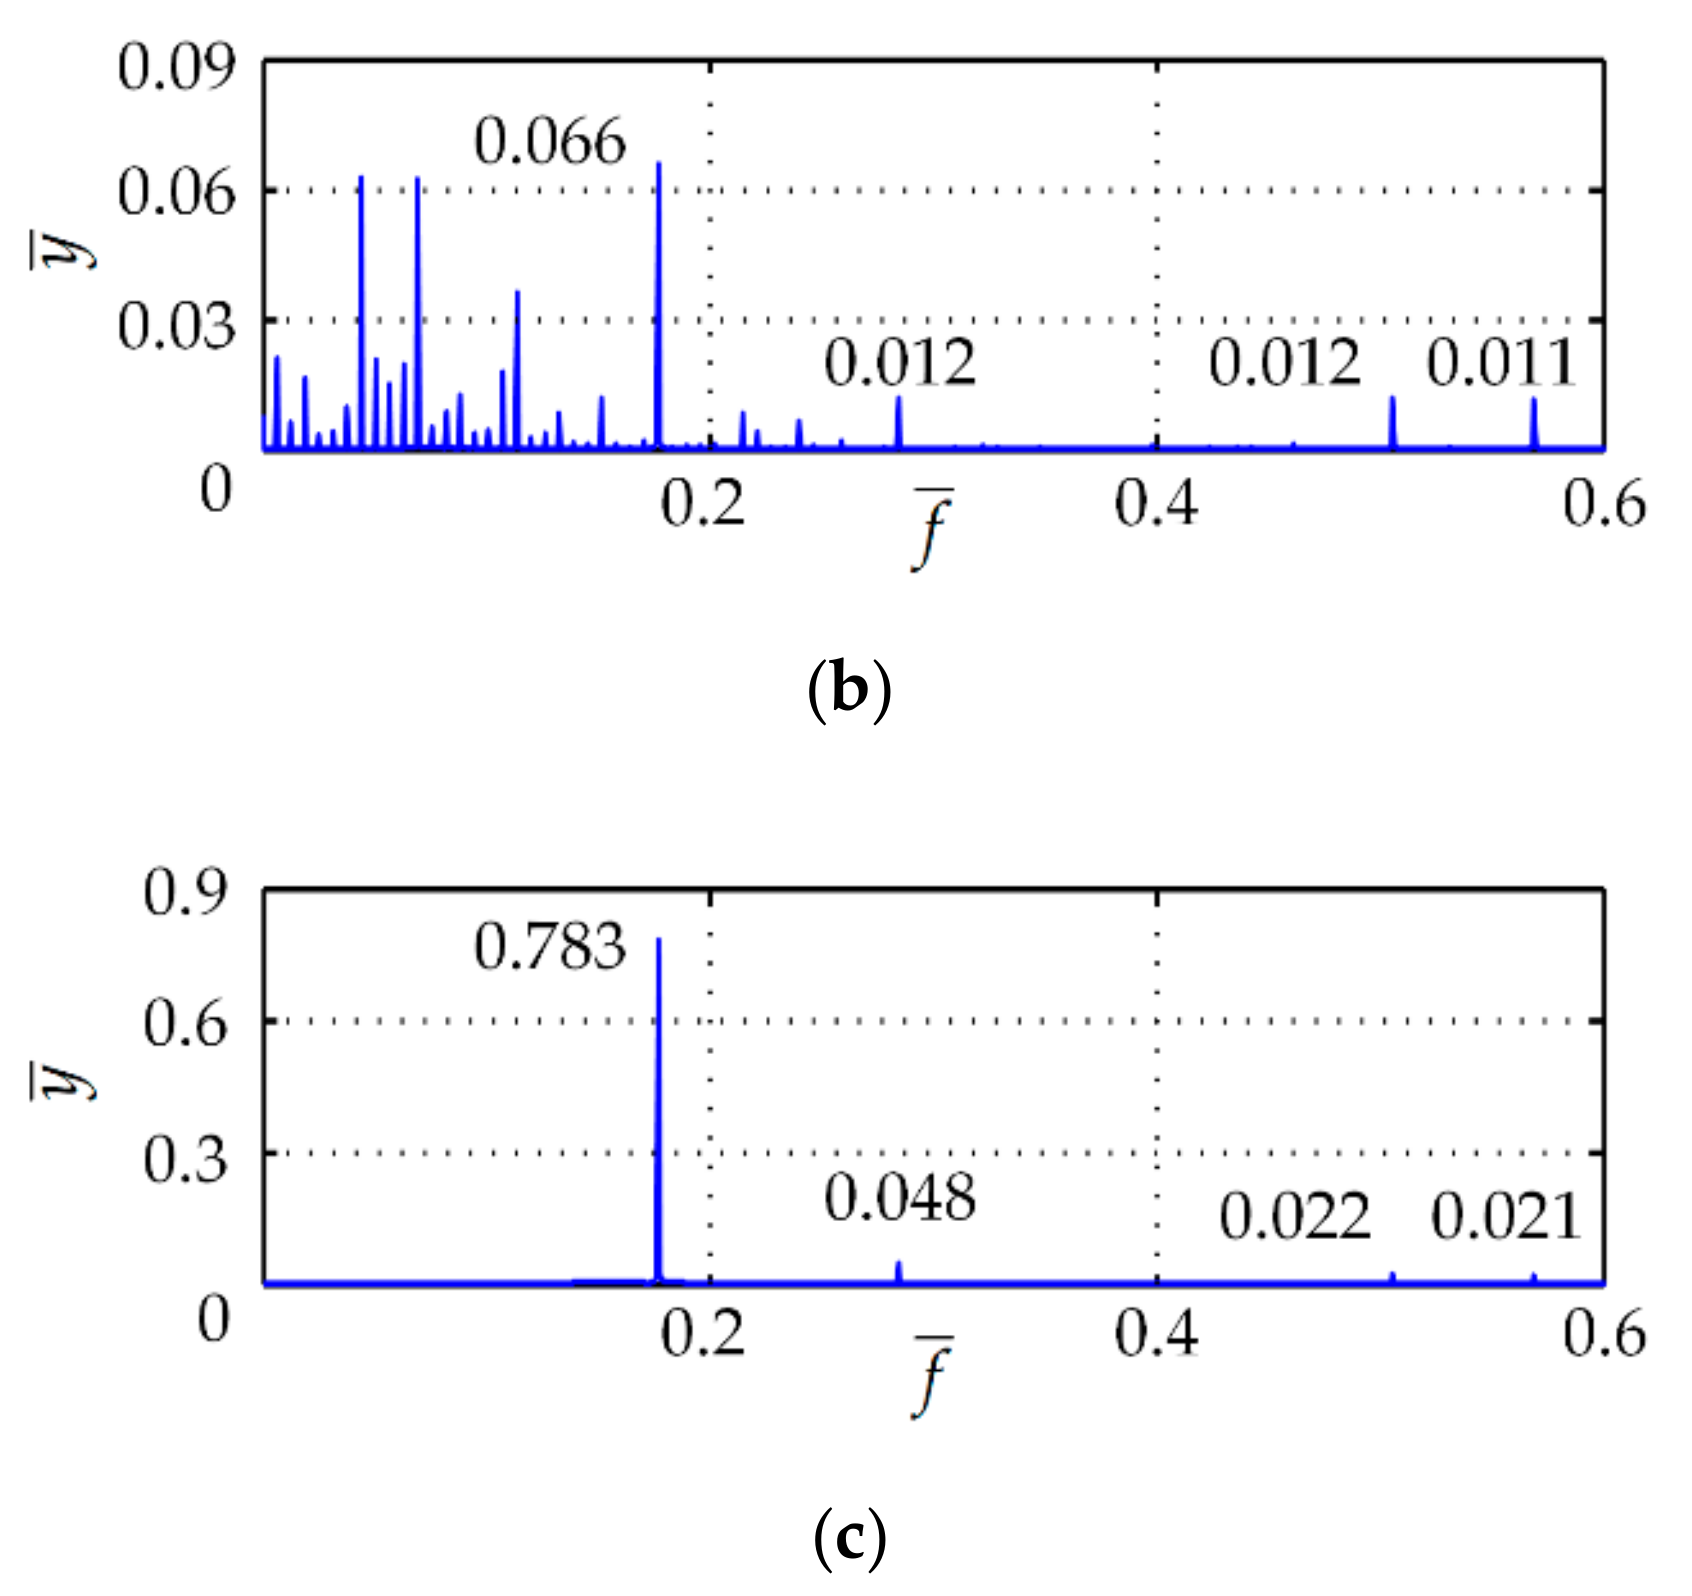
4.4.2. Vibration Isolation Performance under Multi-Frequency Wave Excitation

The non-dimensional multi-frequency wave in Equation (28), referring to [25], is used as the input displacement excitation to analyze the vibration isolation performance of the QZS isolator when a ¯ = 0.45, r = 1 and ξ = 0.10.
Z ¯ m = 0.25 sin ( 0.11 ε × τ ) + 0.175 sin ( 0.32 ε × τ ) + 0.10 cos ( 0.18 ε × τ ) + 0.20 cos ( 0.36 ε × τ )
where ε is the coefficient of excitation frequency.
Figure 14 shows the time history of the steady-state displacement responses of the QZS vibration isolator and its equivalent linear isolator, at ε = 10. When only linear isolation is performed, the displacement response is greater than the excitation, showing the deterioration of vibration. After the NSC is introduced, the vibration is attenuated, and the maximum of the displacement response drops to 36.7% of the maximum excitation amplitude. Then, the spectrum results with respect to the non-dimensional response frequency f ¯ are given in Figure 15. The linear vibration isolator can reduce the vibration displacement at high excitation frequency, but that of the lowest excitation frequency is amplified to 213.1%, which leads to poor final isolation performance in the above time history. On the contrary, the QZS isolator reduces excitation amplitude at each frequency component by more than 73.7%.
Figure 16 shows the effects of ε on the root mean square (RMS) of the displacement response. The variation of ε means that the excitation frequency is changed, which causes multiple peaks on the RMS curves. When ε is small, neither the QZS vibration isolators nor the equivalent linear isolator can isolate the multi-frequency wave excitation. In this region where the excitation vibration is amplified, although the QZS isolator has lower peak of RMS, its vibration around ε = 1 and ε = 7 is worse than that of the equivalent linear isolator. With the increase of ε, it can be seen that adding the NSC makes the peaks move left, and the QZS vibration isolator plays the isolation function firstly. When ε = 10, its value of the displacement RMS is much smaller than the corresponding values of the excitation and equivalent linear isolator.

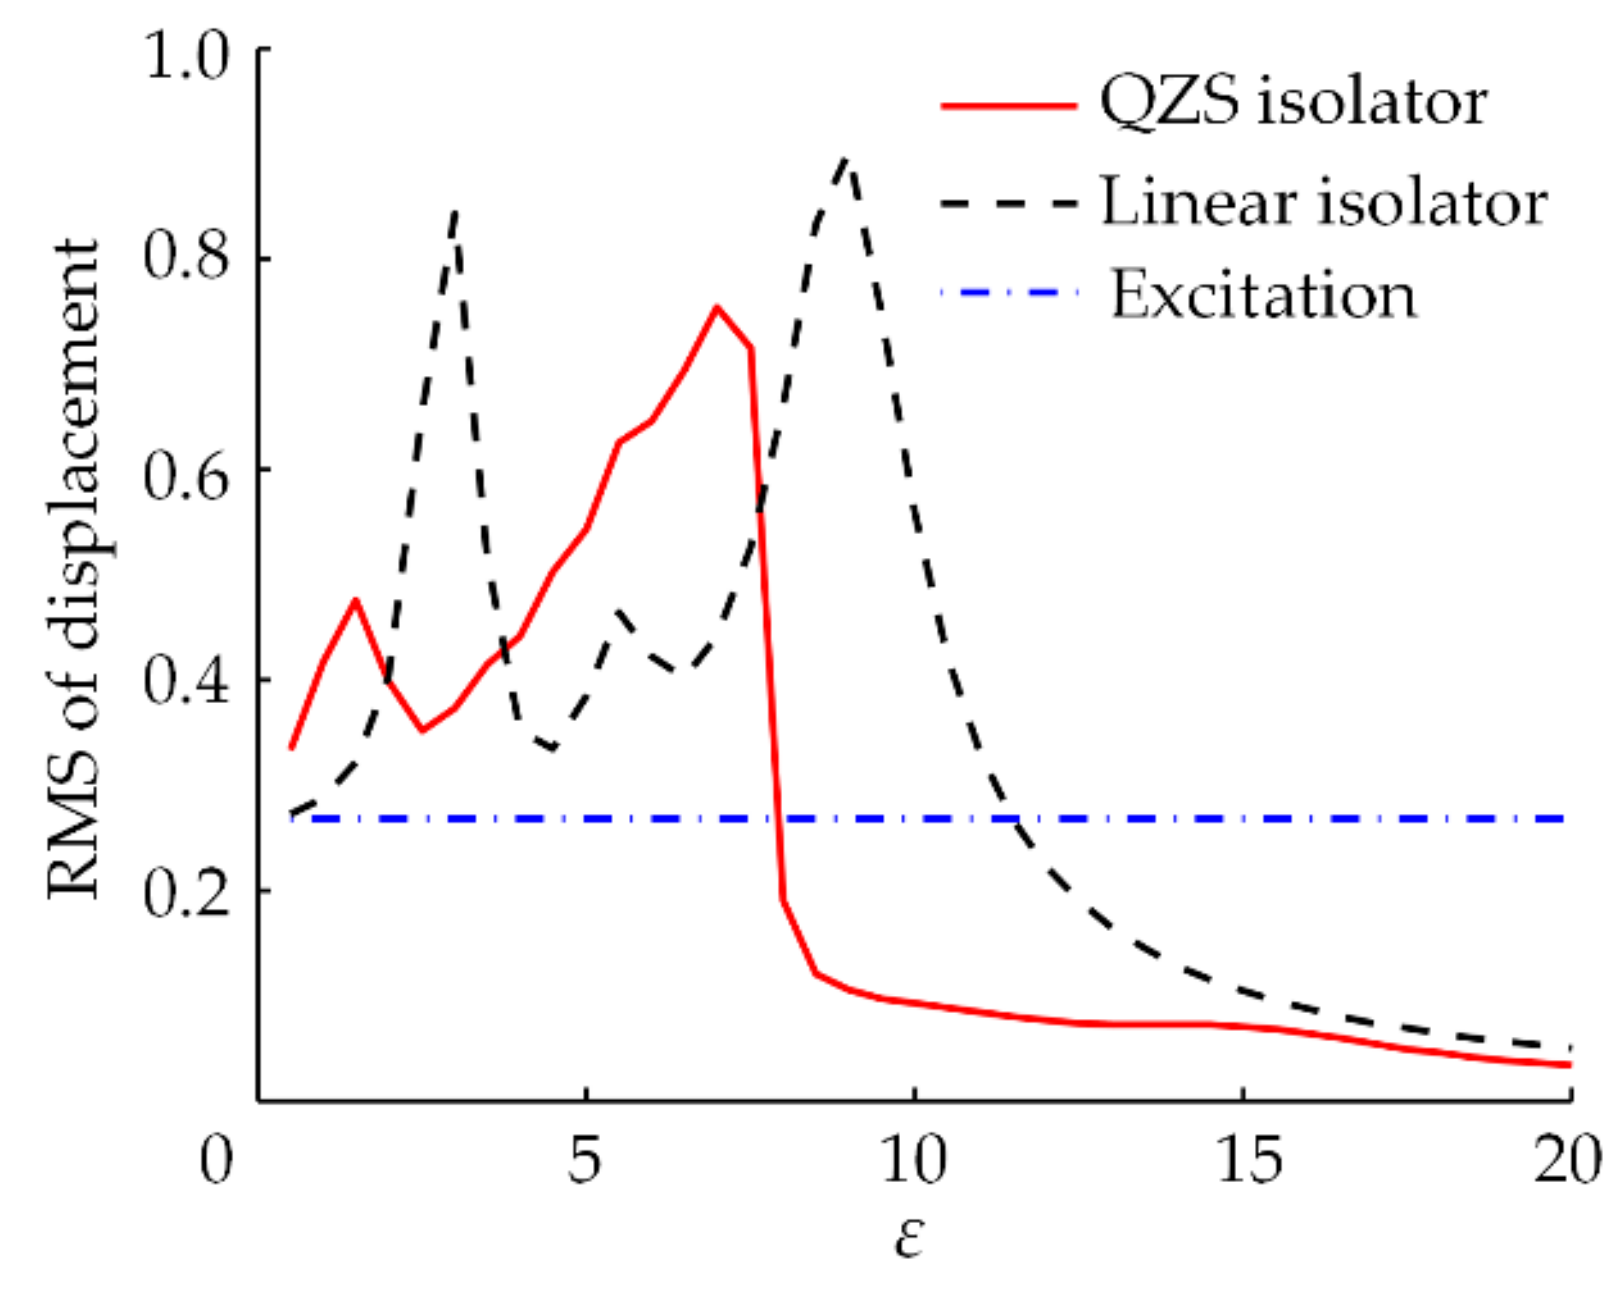
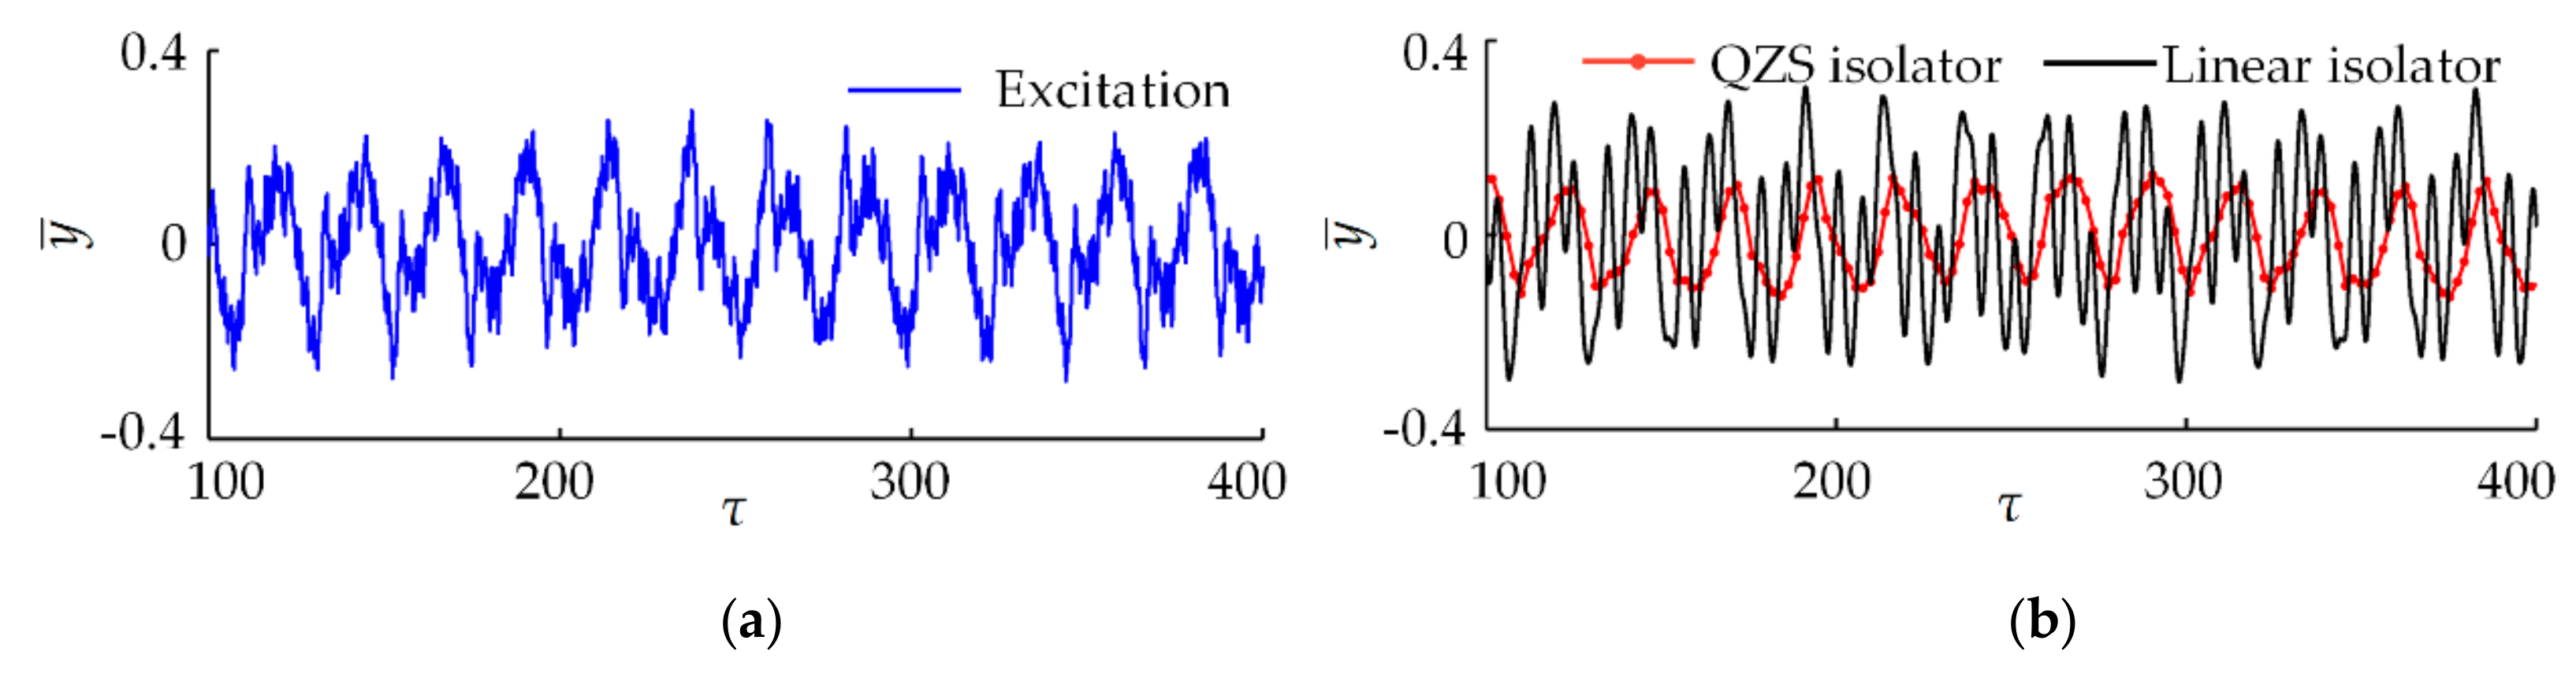
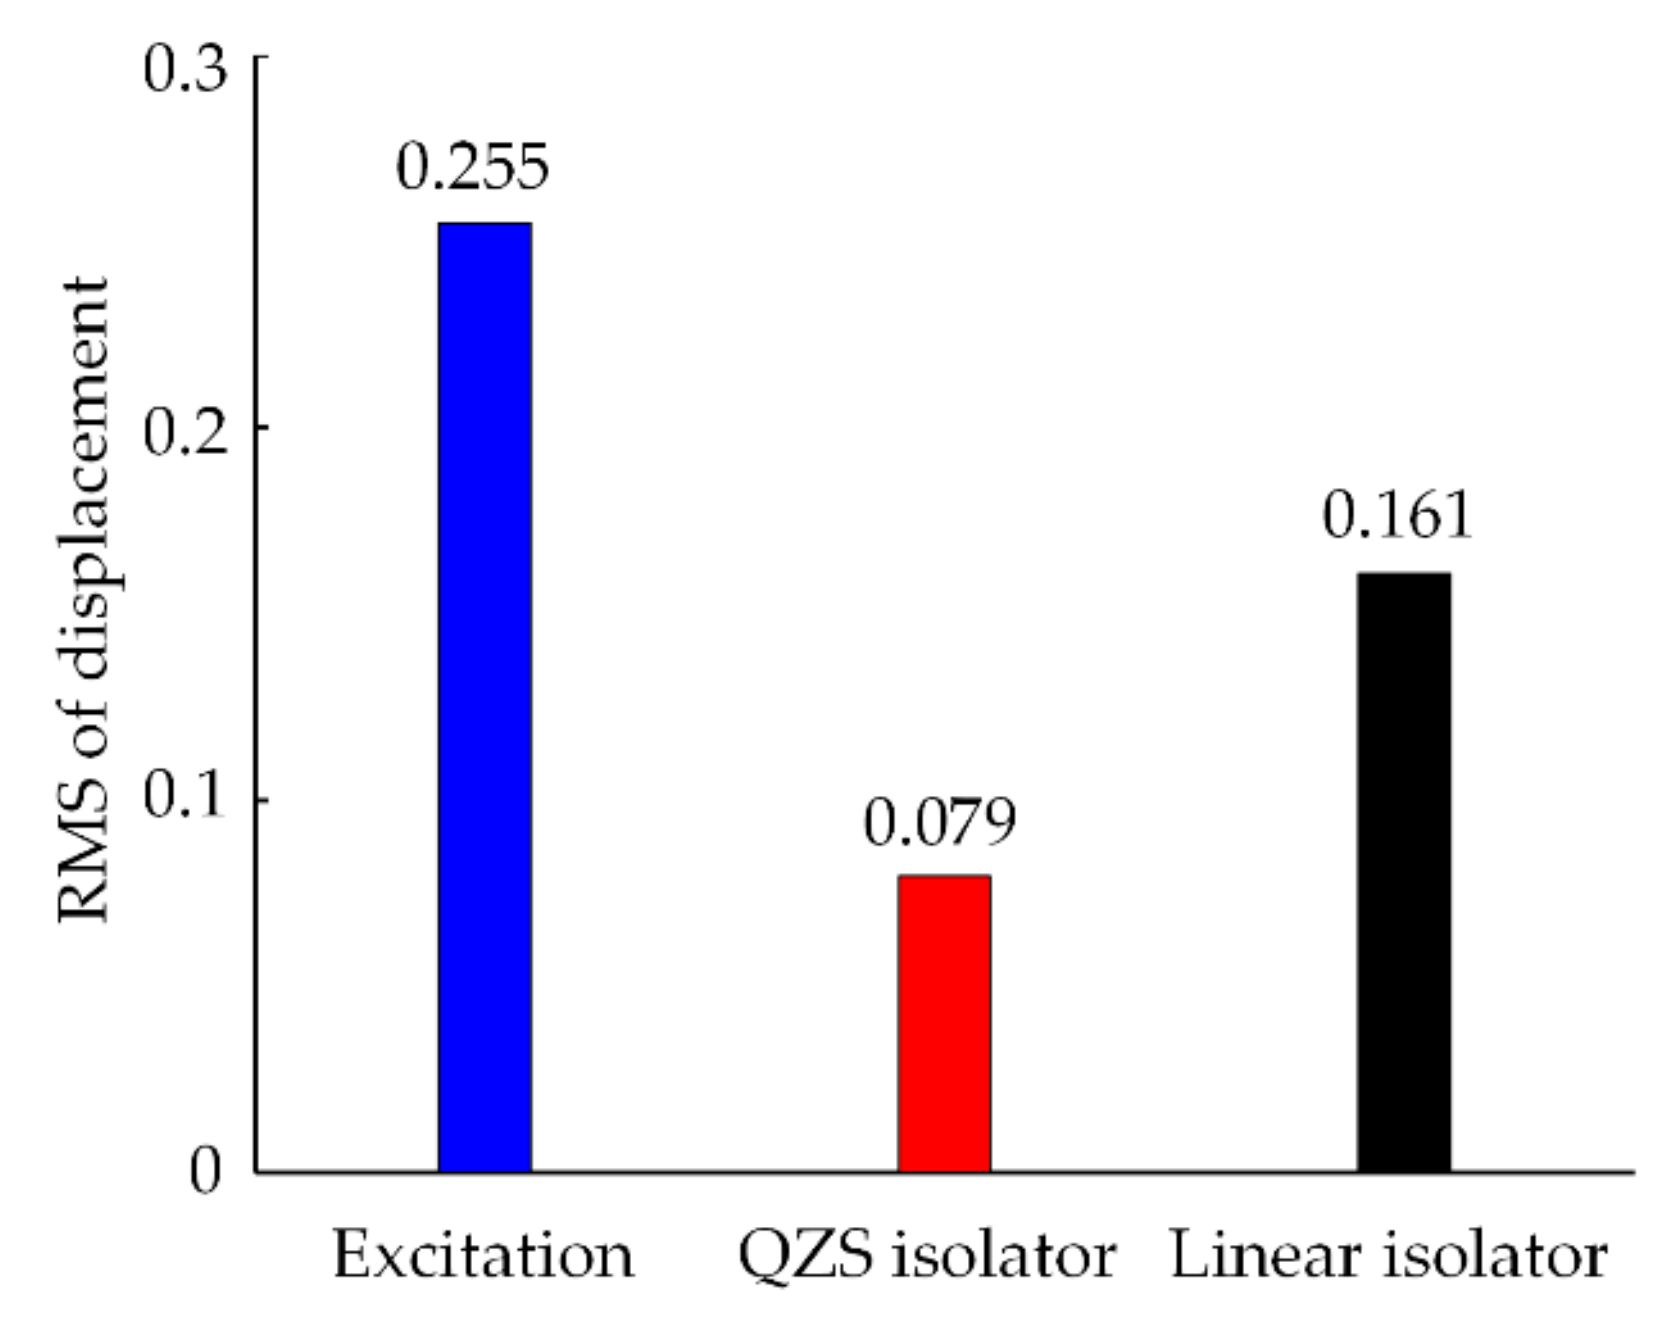
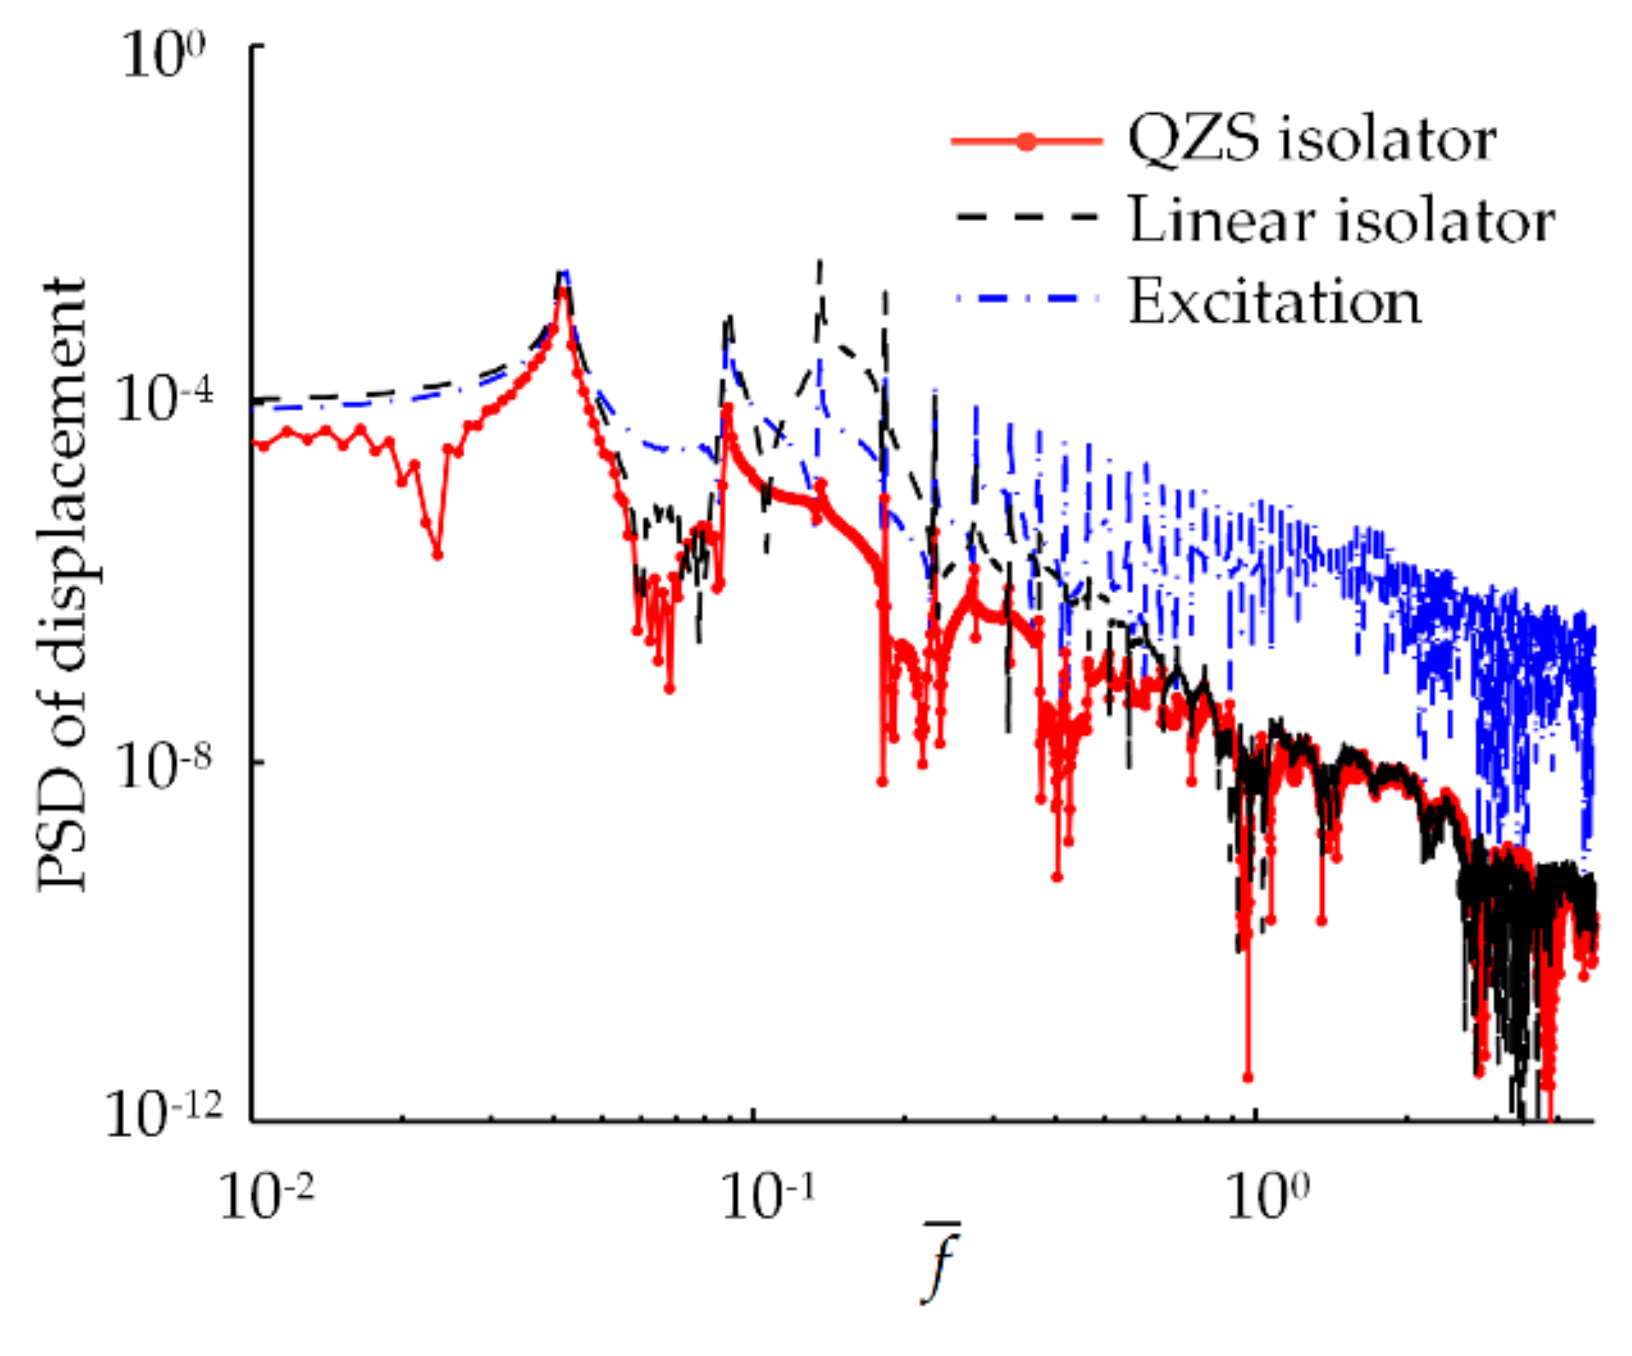
4.4.3. Vibration Isolation Performance under Random Excitation

Using the displacement signal provided by the road surface to moving vehicles as the input excitation, the vibration isolation performance of the QZS vibration isolator under a random base excitation is analyzed. By virtue of the standard stated in [31], the power spectral density (PSD) function of road roughness Gq(n) can be given as:
G q ( n ) = G q ( n 0 ) ( n n 0 ) W
where n is the spatial frequency; n0 is the reference spatial frequency taken as n0 = 0.1 m−1, and W is the frequency index taken as W = 2. Gq(n0) is the road roughness coefficient, and Gq(n0) = 64 × 10−6 m3 when the B-class road profile is used.
Since the road roughness is a stationary Gaussian random process with mean value of zero and traversal of various states, the target random process can be described by discrete spectrum. After non-dimensional processing, the simulated excitation signal Z ¯ r of the road roughness in time domain can be obtained as the curve shown in Figure 17a. Then, the time history curves of the displacement response of the QZS vibration isolator and its equivalent linear isolator are compared in Figure 17b when a ¯ = 0.45, r = 1 and ξ = 0.10. The QZS isolator has good performance in isolating a random excitation, and the overall vibration of the system is significantly reduced. The equivalent linear vibration isolator only isolates the vibrations in high-frequency band, but the vibration peak value after isolation even exceeds the maximum value of the excitation.
Figure 18 shows the PSD of the displacement responses of the vibration isolator before and after the NSC is introduced. It can be observed in the figure that the trend of the PSD curves changing with the response frequency is consistent. Except for the weak vibration isolation at f ¯ =0.04, the QZS vibration isolators can successfully decrease vibrations over the frequency range. However, for the equivalent linear vibration isolator, the vibration deteriorates when 0.11 < f ¯ < 0.23, and its vibration isolation capability will not achieve that of the QZS isolator until f ¯ is higher than 1. Besides, as shown in Figure 19, adding the NSC to the linear vibration isolation system makes the RMS of the displacement response decrease from 0.161 to 0.079. These demonstrate that the proposed QZS vibration isolator can also obtain better performance under random excitations.

5. Conclusions

This paper proposes an NSC formed by the cam-roller mechanism with a quadratic polynomial trajectory. For the QZS vibration isolator equipped with the novel NSC, its static and dynamic models are established to investigate the high-static-low-dynamic stiffness and the dynamic characteristics under QZS condition. Additionally, the vibration isolation performance of the QZS vibration isolator is discussed under various excitations. The main conclusions are as follows:
(1) The proposed QZS vibration isolator directly has a nonlinear stiffness expressed by a quadratic function, due to the adoption of the QCRM-NSC. When solving the dynamic response, the Taylor series expansion of stiffness is not required, and the error at large response displacement caused by approximate stiffness is avoided.
(2) The structure parameters have a great influence on the displacement transmissibility of the QZS vibration isolator. Reducing the quadratic coefficient and excitation amplitude weakens the transmission and nonlinearity of the vibration response. Although a larger damping ratio causes an increase in the transmissibility at high-frequency range, it still performs well around the resonance.
(3) Compared with the equivalent linear vibration isolator, the QCRM-NSC introduced in the QZS isolator greatly reduces the peak of the resonance response. Under sinusoidal excitation, multi-frequency wave excitation, and random excitation, the QZS vibration isolation system has a lower starting vibration isolation frequency and a smaller displacement response.
From the above, we can conclude that the proposed QZS vibration isolator maintains the excellent vibration isolation performance of nonlinear isolation. Meanwhile, the structure advantage of the QCRM-NSC makes it possible to reduce the calculation difficulty, and facilitates the application of NSCs in complex vibration isolation structures.

Author Contributions

M.S. established the theoretical model and wrote this paper; X.S. and W.L. analyzed the data; Z.D. and G.S. contributed to some key ideas and revised the manuscript. All authors have read and agreed to the published version of the manuscript.

Funding

This research was funded by Liaoning Revitalization Talents Programs (No. XLYC1905003), the Liaoning PhD Research Start-up Fund (No. 2019BS181), and the Liaoning Provincial Department of Education Youth Breeding Project (No. LQGD2019007).

Conflicts of Interest

The authors declare no conflict of interest.

References

  1. Diez-Jimenez, E.; Rizzo, R.; Gómez-García, M.J.; Corral-Abad, E. Review of passive electromagnetic devices for vibration damping and isolation. Shock Vib. 2019, 2019, 1–16. [Google Scholar] [CrossRef]
  2. Lyratzakis, A.; Tsompanakis, Y.; Psarropoulos, P.N. Efficient mitigation of high-speed trains induced vibrations of railway embankments using expanded polystyrene blocks. Transp. Geotech. 2020, 22. [Google Scholar] [CrossRef]
  3. Dong, Z.X.; Sun, X.W.; Xu, F.S.; Liu, W.J. A low-rank and sparse decomposition-based method of improving the accuracy of sub-pixel grayscale centroid extraction for spot images. IEEE Sens. J. 2020, 20, 5845–5854. [Google Scholar] [CrossRef]
  4. Gangemi, P.J.; Kanapathipillai, S. Submarine structural and acoustic attenuation. J. Vib. Control. 2016, 22, 3135–3150. [Google Scholar] [CrossRef]
  5. Sun, M.N.; Song, G.Q.; Li, Y.M.; Huang, Z.L. Effect of negative stiffness mechanism in a vibration isolator with asymmetric and high-static-low-dynamic stiffness. Mech. Syst. Signal Pr. 2019, 124, 388–407. [Google Scholar] [CrossRef]
  6. Zeng, X.H.; Zhang, L.; Yu, Y.; Shi, M.; Zhou, J.F. The stiffness and damping characteristics of a dual-chamber air spring device applied to motion suppression of marine structures. Appl. Sci. 2016, 6, 74. [Google Scholar] [CrossRef] [Green Version]
  7. Tu, S.W.; Lu, X.F.; Zhu, X.L. Effect of structure parameters on Polycal wire rope isolator. Shock Vib. 2019, 2019, 1–10. [Google Scholar] [CrossRef]
  8. Feng, X.; Jing, X.J.; Xu, Z.D.; Guo, Y.Q. Bio-inspired anti-vibration with nonlinear inertia coupling. Mech. Syst. Signal Pr. 2019, 124, 562–595. [Google Scholar] [CrossRef]
  9. Sadeghi, S.; Li, S. Fluidic origami cellular structure with asymmetric quasi-zero stiffness for low-frequency vibration isolation. Smart Mater. Struct. 2019, 28, 065006. [Google Scholar] [CrossRef]
  10. Carrella, A.; Brennan, M.J.; Waters, T.P.; Lopes, V.J. Force and displacement transmissibility of a nonlinear isolator with high-static-low-dynamic-stiffness. Int. J. Mech. Sci. 2012, 55, 22–29. [Google Scholar] [CrossRef]
  11. Carrella, A.; Brennan, M.J.; Waters, T.P. Static analysis of a passive vibration isolator with quasi-zero-stiffness characteristic. J. Sound Vib. 2007, 31, 678–689. [Google Scholar] [CrossRef]
  12. Fulcher, B.A.; Shahan, D.W.; Haberman, M.R.; Seepersad, C.C.; Wilson, P.S. Analytical and experimental investigation of buckled beams as negative stiffness elements for passive vibration and shock isolation systems. J. Vib. Acoust. 2014, 136, 031009. [Google Scholar] [CrossRef]
  13. Virgin, L.N.; Davis, R.B. Vibration isolation using buckled struts. J. Sound Vib. 2003, 260, 965–973. [Google Scholar] [CrossRef]
  14. Zheng, Y.S.; Li, Q.P.; Luo, B.; Luo, Y.J.; Zhang, X.N. A Stewart isolator with high-static-low-dynamic stiffness struts based on negative stiffness magnetic springs. J. Sound Vib. 2018, 422, 390–408. [Google Scholar] [CrossRef]
  15. Debeau, D.A.; Seepersad, C.C.; Haberman, M.R. Impact behavior of negative stiffness honeycomb materials. J. Mater. Res. 2018, 33, 290–299. [Google Scholar] [CrossRef]
  16. Papaioannou, G.; Voutsinas, A.; Koulocheris, D.; Antoniadis, I. Dynamic performance analysis of vehicle seats with embedded negative stiffness elements. Veh. Syst. Dyn. 2020, 58, 307–337. [Google Scholar] [CrossRef]
  17. Yang, F.X.; Zhao, L.L.; Yu, Y.W.; Zhou, C.C. Matching, stability, and vibration analysis of nonlinear suspension system for truck cabs. Shock Vib. 2019, 2019, 1–10. [Google Scholar] [CrossRef]
  18. Li, Y.L.; Xu, D.L. Force transmissibility of floating raft system with quasi-zero-stiffness isolators. J. Vib. Control 2018, 24, 3608–3616. [Google Scholar]
  19. Zhou, J.X.; Wang, K.; Xu, D.L.; Ouyang, H.J.; Fu, Y.M. Vibration isolation in neonatal transport by using a quasi-zero-stiffness isolator. J. Vib. Control 2018, 24, 3278–3291. [Google Scholar] [CrossRef]
  20. Zhou, P.; Fang, Q.H. Match of negative stiffness and viscous damping in a passive damper for cable vibration control. Shock Vib. 2019, 2019, 1–13. [Google Scholar] [CrossRef] [Green Version]
  21. Shaw, A.D.; Neild, A.; Wagg, D.J. Dynamic analysis of high static low dynamic stiffness vibration isolation mounts. J. Sound Vib. 2013, 332, 1437–1455. [Google Scholar] [CrossRef] [Green Version]
  22. Shaw, A.D.; Neild, A.; Friswell, M.I. Relieving the effect of static load errors in nonlinear vibration isolation mounts through stiffness asymmetries. J. Sound Vib. 2015, 339, 84–98. [Google Scholar] [CrossRef] [Green Version]
  23. Zhou, J.X.; Wang, X.L.; Xu, D.L.; Bishop, S. Nonlinear dynamic characteristics of a quasi-zero stiffness vibration isolator with cam-roller-spring mechanisms. J. Sound Vib. 2015, 346, 53–69. [Google Scholar] [CrossRef]
  24. Liu, Y.Q.; Xu, L.L.; Song, C.F.; Gu, H.S.; Ji, W. Dynamic characteristics of a quasi-zero stiffness vibration isolator with nonlinear stiffness and damping. Arch. Appl. Mech. 2019, 89, 1743–1759. [Google Scholar] [CrossRef]
  25. Le, T.D.; Ahn, K.K. A vibration isolation system in low frequency excitation region using negative stiffness structure for vehicle seat. J. Sound Vib. 2011, 330, 6311–6335. [Google Scholar] [CrossRef]
  26. Ahn, H.J.; Lim, S.H.; Park, C.K. An integrated design of quasi-zero stiffness mechanism. J. Mech. Sci. Technol. 2016, 30, 1071–1075. [Google Scholar] [CrossRef]
  27. Cheng, C.; Li, S.M.; Wang, Y.; Jiang, X.X. Force and displacement transmissibility of a quasi-zero stiffness vibration isolator with geometric nonlinear damping. Nonlinear Dynam. 2017, 87, 2267–2279. [Google Scholar] [CrossRef]
  28. Calleja, A.; Fernández, A.; Rodríguez, A.; de Lacalle, L.N.L.; Lamikiz, A. Turn-milling of blades in turning centres and multitasking machines controlling tool tilt angle. Proc. Inst. Mech. Eng. Part B J. Eng. Manuf. 2015, 229, 1324–1336. [Google Scholar] [CrossRef]
  29. Durali, L.; Khajepour, A.; Jeon, S. Design and optimization of a cam-actuated electrohydraulic brake system. Proc. IMechE. Inst. Mech. Eng. Part D J. Automob. Eng. 2018, 232, 909–920. [Google Scholar] [CrossRef]
  30. Kaul, S. Attributes of a vibration isolator design with stiffness nonlinearities. Int. J. Acoust. Vib. 2018, 23, 208–216. [Google Scholar] [CrossRef]
  31. General Administration of Quality Supervision, Inspection and Quarantine of the People’s Republic of China, Standardization Administration of the People’s Republic of China. GB/T 7031-2005 Mechanical Vibration-Road Surface Profiles Reporting of Measured Data; China Quality & Standards Press: Beijing, China, 2005. [Google Scholar]
Figure 1. Negative stiffness corrector (NSC) in a nonlinear vibration isolator. (a) Unloaded linear spring; (b) loaded linear spring at static equilibrium position; (c) isolator with NSC at static equilibrium position; (d) isolator with NSC in operation.
Applsci 10 03573 g001
Figure 2. Force-displacement curves of linear supporting spring, NSC, and the vibration isolator they build.
Applsci 10 03573 g002
Figure 3. Static analysis of cam-roller mechanism with a quadratic polynomial trajectory (QCRM). (a) Roller at static equilibrium position; (b) roller deviating from equilibrium position.
Applsci 10 03573 g003
Figure 4. Non-dimensional characteristics of QCRM with a ¯ = 0.5. (a) Force-displacement curves; (b) stiffness curves.
Applsci 10 03573 g004
Figure 5. Non-dimensional characteristics of QCRM with δ ¯ n = 0.7. (a) Force-displacement curves; (b) stiffness curves.
Applsci 10 03573 g005
Figure 6. Physical model of nonlinear vibration isolator with QCRM-NSC.
Applsci 10 03573 g006
Figure 7. Non-dimensional stiffness characteristics of QZS vibration isolator. (a) r = 0.5; (b) a ¯ = 0.4.
Applsci 10 03573 g007
Figure 8. Bounded and unbounded frequency response curve (FRCs) of the quasi-zero stiffness (QZS) vibration isolator with different Z ¯ .
Applsci 10 03573 g008
Figure 9. Comparisons between original and approximate stiffness curves of cam with semicircular trajectory.
Applsci 10 03573 g009
Figure 10. Comparisons between FRCs about original and approximate stiffness computed by Runge–Kutta method (RKM) and the harmonic balance method (HBM).
Applsci 10 03573 g010
Figure 11. Effects of quadratic coefficient a ¯ on displacement transmissibility T. (a) Trajectory of cam, where x ¯ = a ¯ u ¯ 2 ; (b) displacement transmissibility T.
Applsci 10 03573 g011
Figure 12. Effects of damping ratio ξ on displacement transmissibility T.
Applsci 10 03573 g012
Figure 13. Effects of excitation amplitude Z ¯ on displacement transmissibility T.
Applsci 10 03573 g013
Figure 14. Time history under multi-frequency wave excitation. (a) displacement excitation; (b) displacement responses of QZS and equivalent linear isolators.
Applsci 10 03573 g014
Figure 15. Spectrums under multi-frequency wave excitation. (a) displacement excitation; (b) displacement response of QZS isolator; (c) displacement response of equivalent linear isolator.
Applsci 10 03573 g015aApplsci 10 03573 g015b
Figure 16. Effects of coefficient ε on root mean square (RMS) of displacement.
Applsci 10 03573 g016
Figure 17. Time history under random excitation. (a) Displacement excitation; (b) displacement responses of QZS and equivalent linear isolators.
Applsci 10 03573 g017
Figure 18. Power spectral density under random excitation.
Applsci 10 03573 g018
Figure 19. RMS of displacement under random excitation.
Applsci 10 03573 g019
Table 1. Parameters of vibration isolator.
ParameterValue
a ¯ 0.3750.4250.4500.457
ξ0.100.110.120.13
Z ¯ 0.150.250.280.30
r1111

