Article

Effects of In Situ Co or Ni Doping on the Photoelectrochemical Performance of Hematite Nanorod Arrays

School of Energy and Power Engineering, Nanjing University of Science and Technology, Nanjing 210094, China
*
Author to whom correspondence should be addressed.
Appl. Sci. 2020, 10(10), 3567; https://doi.org/10.3390/app10103567
Submission received: 23 April 2020 / Revised: 18 May 2020 / Accepted: 19 May 2020 / Published: 21 May 2020

Abstract

:

Featured Application

The material reported in this article can be used as a photoanode of a photoelectrochemical cell that splits water into hydrogen and oxygen. In this way, solar energy can be converted into hydrogen energy.

Abstract

Co-doped and Ni-doped hematite (α-Fe2O3) nanorod arrays were prepared on fluorine-doped tin oxide (FTO) conductive glass via aqueous chemical growth, in which the doping and the formation of nanorods occurred simultaneously (i.e., in situ doping). These samples were characterized by X-ray diffraction (XRD), scanning electron microscopy (SEM), ultraviolet (UV)–visible spectrophotometry, linear sweep voltammetry and Mott–Schottky (M–S) measurement. Results showed that the introduction of 5% Co or Ni into α-Fe2O3 (the molar ratio of dopant to Fe is 1:20) did not change its crystal phase, morphology, energy gap and flat band potential. Both the undoped and the doped α-Fe2O3 showed a direct band gap of 2.24 eV, an indirect band gap of 1.85 eV, and a flat band potential of −0.22 V vs. saturated calomel electrode (SCE). At an applied potential of 0.2 V vs. SCE, the Co-doped and the Ni-doped α-Fe2O3 exhibited a photocurrent of 1.28 mA/cm2 and 0.79 mA/cm2, respectively, which were 2.1 times and 1.3 times that of the undoped α-Fe2O3. After the Co or Ni doping, the charge carrier concentration increased from 1.65 × 1025 m−3 to 3.74 × 1025 m−3 and 2.50 × 1025 m−3, respectively. Therefore, the increase in the photocurrent of the doped α-Fe2O3 was likely attributed to their enhanced conductivity.

1. Introduction

Photoelectrochemical (PEC) water splitting is a promising technology for the direct conversion from solar energy to hydrogen energy. Since Fujishima and Honda proposed electrochemical photolysis of water at a TiO2 electrode in 1972 [1], extensive studies have been carried out in this field. Photoelectrodes, which are the key component of a PEC system, should meet the following requirements: (1) appropriate energy levels for conduction band and valence band; (2) effective separation of photogenerated electron-hole pairs; (3) resistance to chemical- and photo-corrosion. Various semiconductor materials such as TiO2 [2,3], α-Fe2O3 [4,5,6], ZnO [7,8], WO3 [9,10,11], SrTiO3 [12,13], BiVO4 [14,15], etc. have been examined for their potential as photoelectrodes. Among them, α-Fe2O3 shows great potential due to its favorable band gap (2.1–2.2 eV), abundant natural reserves, non-toxicity and high chemical stability. Theoretically, its maximum photocurrent density is 12 mA/cm2 and the maximum energy efficiency is 15% at 1.23 V vs. RHE (reference hydrogen electrode) under one solar irradiation (AM1.5, 100 mW/cm2) [16]. However, the actual PEC activity of α-Fe2O3 is far below its theoretical value, which was likely caused by a short hole diffusion length (2–3 nm) and a poor electrical conductivity (10−2 cm2/V·s) [4,5,17]. Nanostructure design and doping are two common strategies to improve PEC performances.
It has been reported that oriented one-dimensional (1D) α-Fe2O3 nanostructures such as nanorods and nanotubes exhibit a higher PEC activity than nanoporous and nanogranular α-Fe2O3 [16,18,19]. This is because 1D nanostructures have the following merits. On the one hand, 1D nanostructures provide a short transport pathway for photoinduced holes to reach the semiconductor–electrolyte interface, which reduces the possibility of electron-hole recombination [17,20,21]. On the other hand, the migration of photoinduced electrons towards a substrate would suffer less resistance if α-Fe2O3 preferentially grows along the (110) direction [17,22]. This could be explained by the anisotropic conductivity of α-Fe2O3. The conductivity of α-Fe2O3 within the (001) basal plane (i.e., in the (110) direction) is up to 4 orders of magnitude higher than that vertical to the [001] plane [17]. Since oriented 1D α-Fe2O3 nanostructures have these advantages, various preparation methods have been developed. They include anodization [18], aqueous chemical growth [17,20], hydrothermal synthesis [2], chemical vapor deposition (CVD) [22], electrochemical deposition [23], spin-coating deposition [24], and chemical co-precipitation [25], etc. Among these methods, aqueous chemical growth attracts attention for its mild synthesis condition and easy combination with doping.
Doping is another effective strategy for the improvement of PEC activities [26]. In the past decade, numerous metal and non-metal elements such as Cr [16,27], Ti [28,29], Yb [30], Zn [31], Sn [6], Se [32], Nb [33], Ta [33], S [5,34], P [35], etc. have been doped into α-Fe2O3. The effects of doping include: (1) to increase the concentration of charge carriers and thus enhance the electrical conductivity [5]; (2) to extend the range of light absorption [36]; (3) to facilitate the separation of electron-hole pairs by acting as electron traps [16].
The combination of these two strategies is expected to enhance the PEC performance further [5,6,16]. Moreover, it is desirable that the introduction of foreign elements and the formation of 1D nanostructures occur simultaneously. However, the in situ doping may cause changes in the morphology and crystallinity of α-Fe2O3. That is why mid or ex situ doping was proposed by some researchers [6,16]. For example, Shen et al. [16] doped Cr into the surface of as-prepared α-Fe2O3 nanorods through a spin coating method so that the original nanorod structure was not damaged.
Considering Co and Ni are in the same group and the same period as Fe (i.e., VIII group and the 4th period) in the periodic table of elements, and the three elements have similar chemistry, we hypothesize that the in situ doping of Co or Ni into α-Fe2O3 may have little influence on the structure of α-Fe2O3. The Co or Ni doping into α-Fe2O3 has been reported in the literature [25,36,37,38]. Hou et al. [36] synthesized a three-dimensional branched Co-doped α-Fe2O3 nanorod/MgFe2O4 heterojunction array by hydrothermal deposition. Their results suggested that the Co doping can effectively enhanced the PEC activity of α-Fe2O3 via extending the light-absorbing region and accelerating the charge carrier separation efficiency. Suresh et al. [37] prepared Co-doped α-Fe2O3 nanocrystalline via a hydrothermal method and characterized the sample by various techniques. The Co-doped α-Fe2O3 showed a pure α-Fe2O3 crystal phase without any impurity phases. The increase in the Co concentration could effectively increase the agglomeration of the particles. But the PEC performance of the Co-doped α-Fe2O3 was not investigated by them. Wang et al. [38] improved both the photocurrent and the onset potential of α-Fe2O3 nanorod photoanodes by in situ Co and ex situ Sn co-doping. The Sn doping mainly contributed to the increased carrier density, while Co doping mostly improved the surface kinetics of oxygen evolution reaction on the Fe2O3 nanorods. Lassoued et al. [25] prepared Ni-doped α-Fe2O3 nanoparticles by the chemical co-precipitation method and examined the photocatalytic activity for the degradation of model organic pollutants. Their results suggested that the adding of Ni didn’t change the crystal phase but decreased the size of the α-Fe2O3 nanoparticles. The incorporation of 8 mol% Ni into the α-Fe2O3 decreased the band gap from 2.02 eV to 1.81 eV.
In this study, in situ Co or Ni doped α-Fe2O3 nanorod arrays will be prepared on a conductive substrate through aqueous chemical growth followed by annealing under air. The impacts of the Co or Ni doping on the crystalline phase, the morphology, the light absorption and the PEC activity of α-Fe2O3 nanorod arrays will be investigated.

2. Materials and Methods

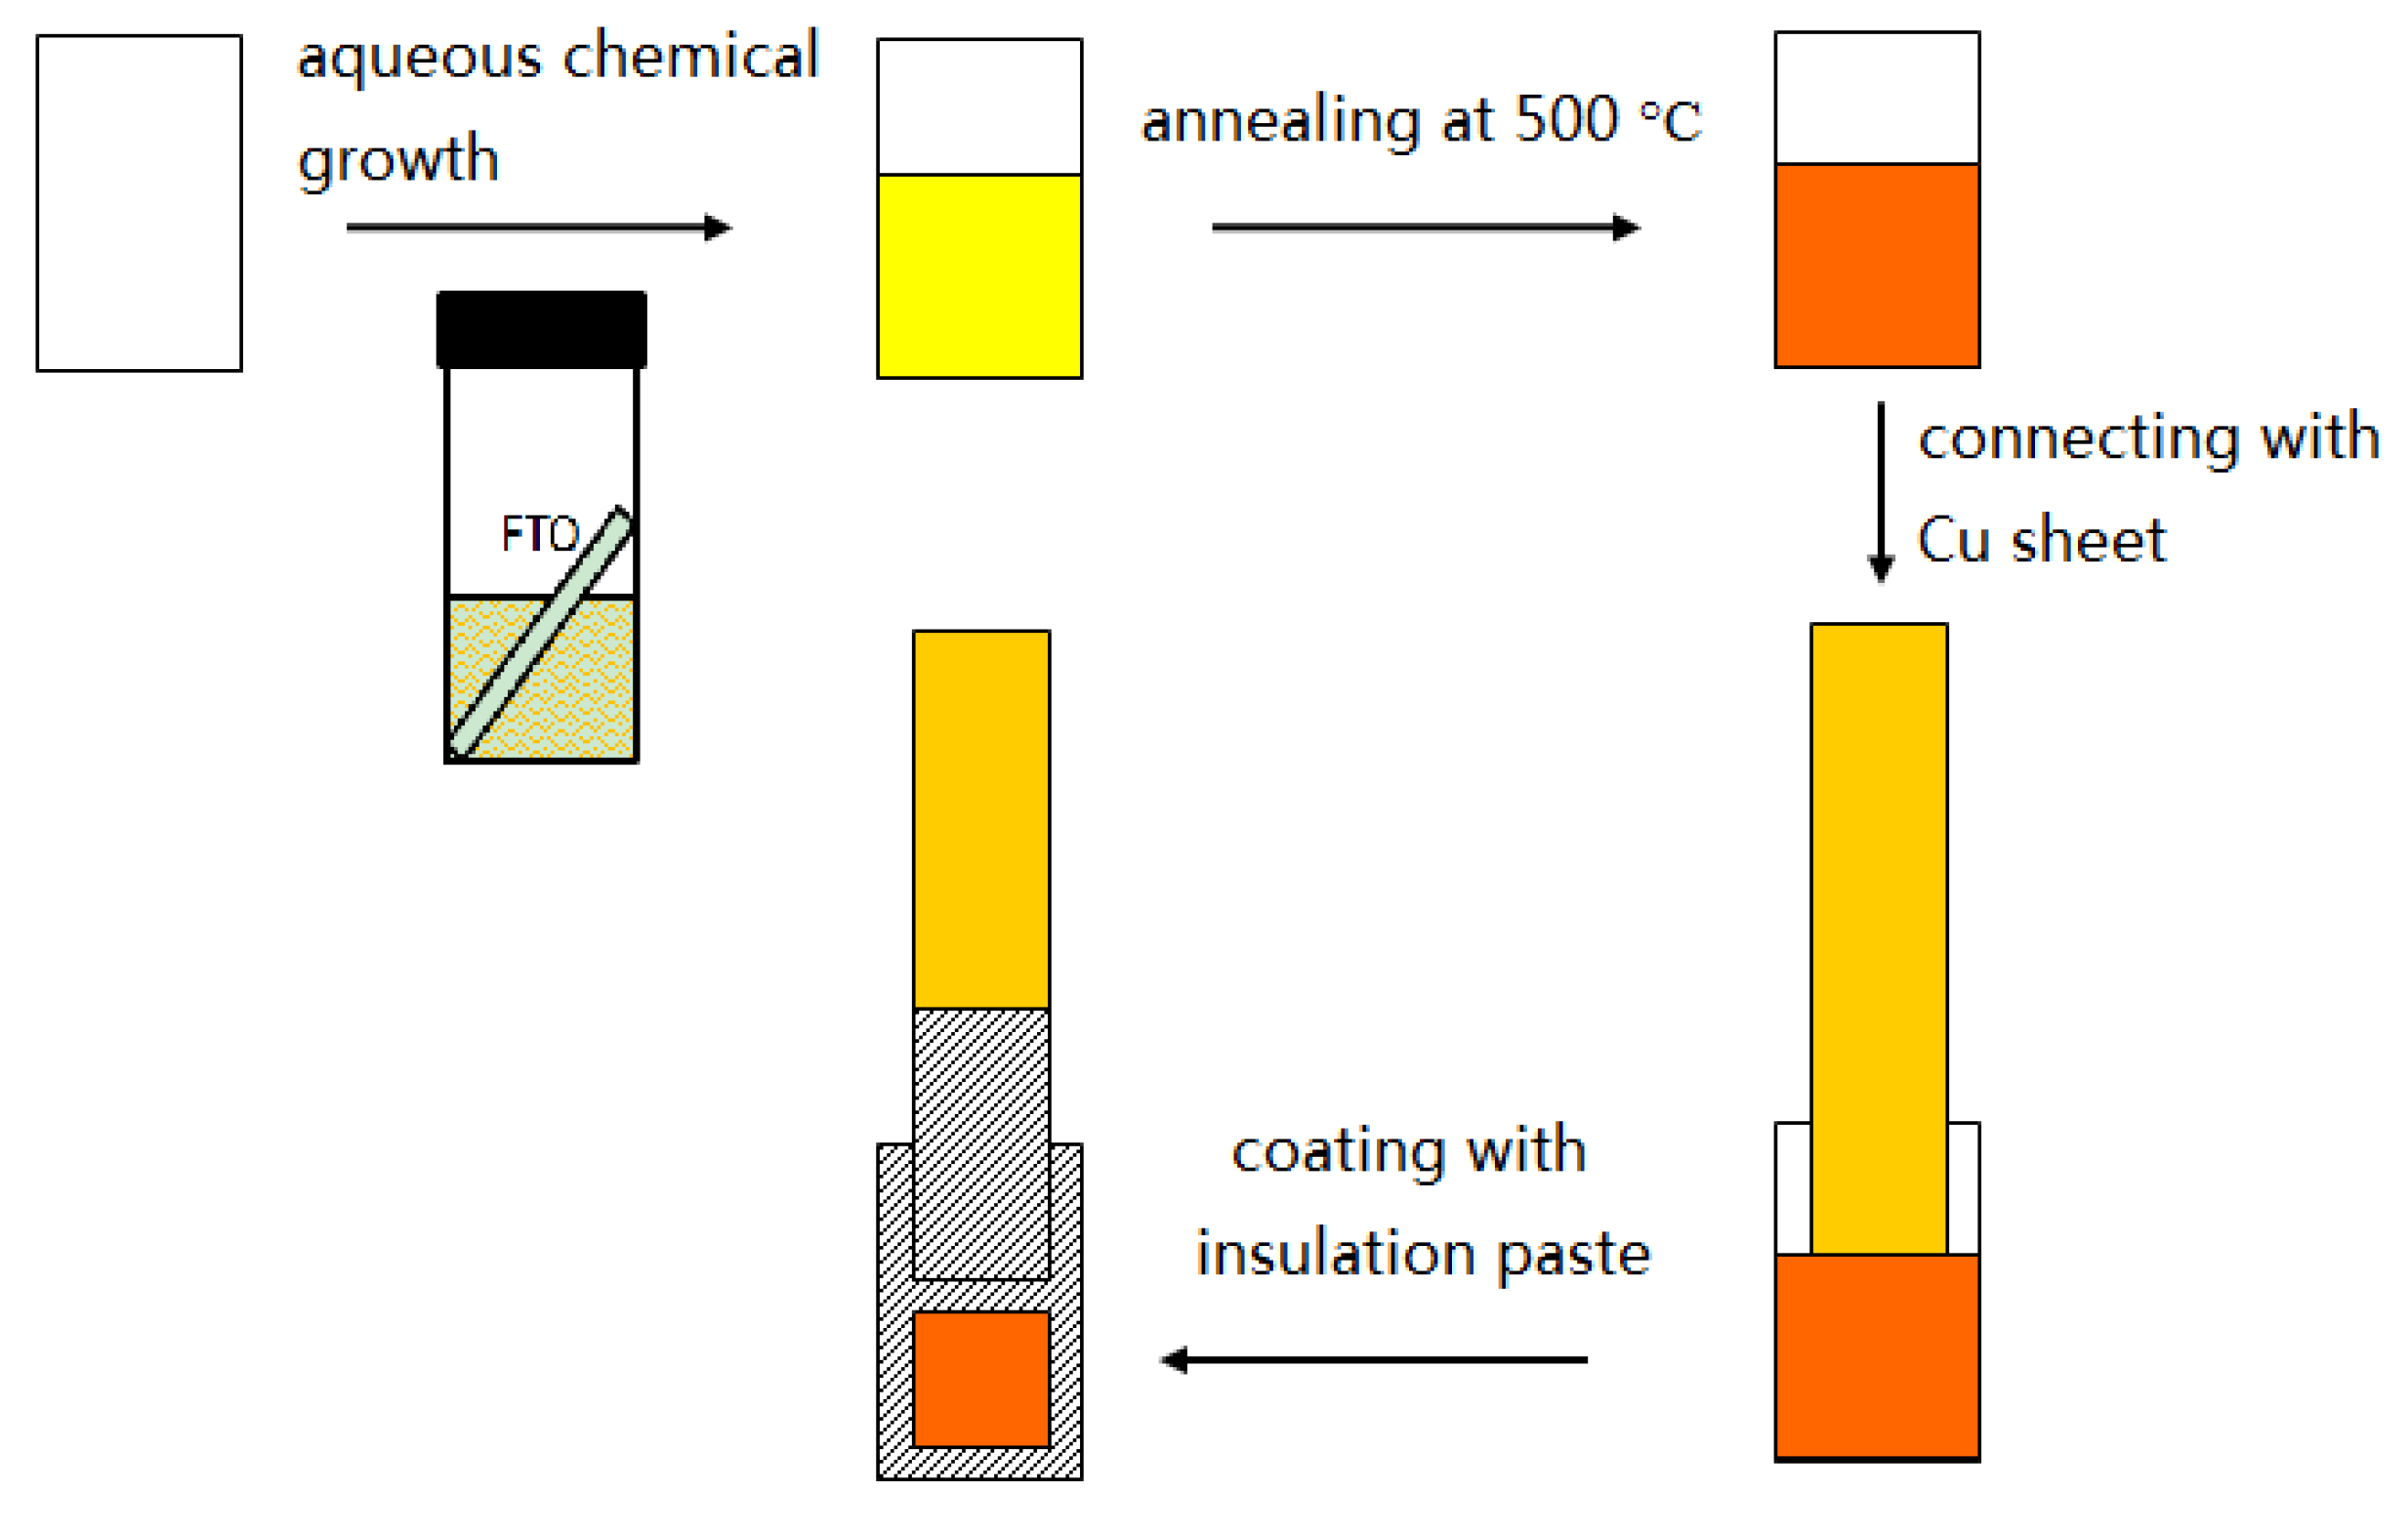
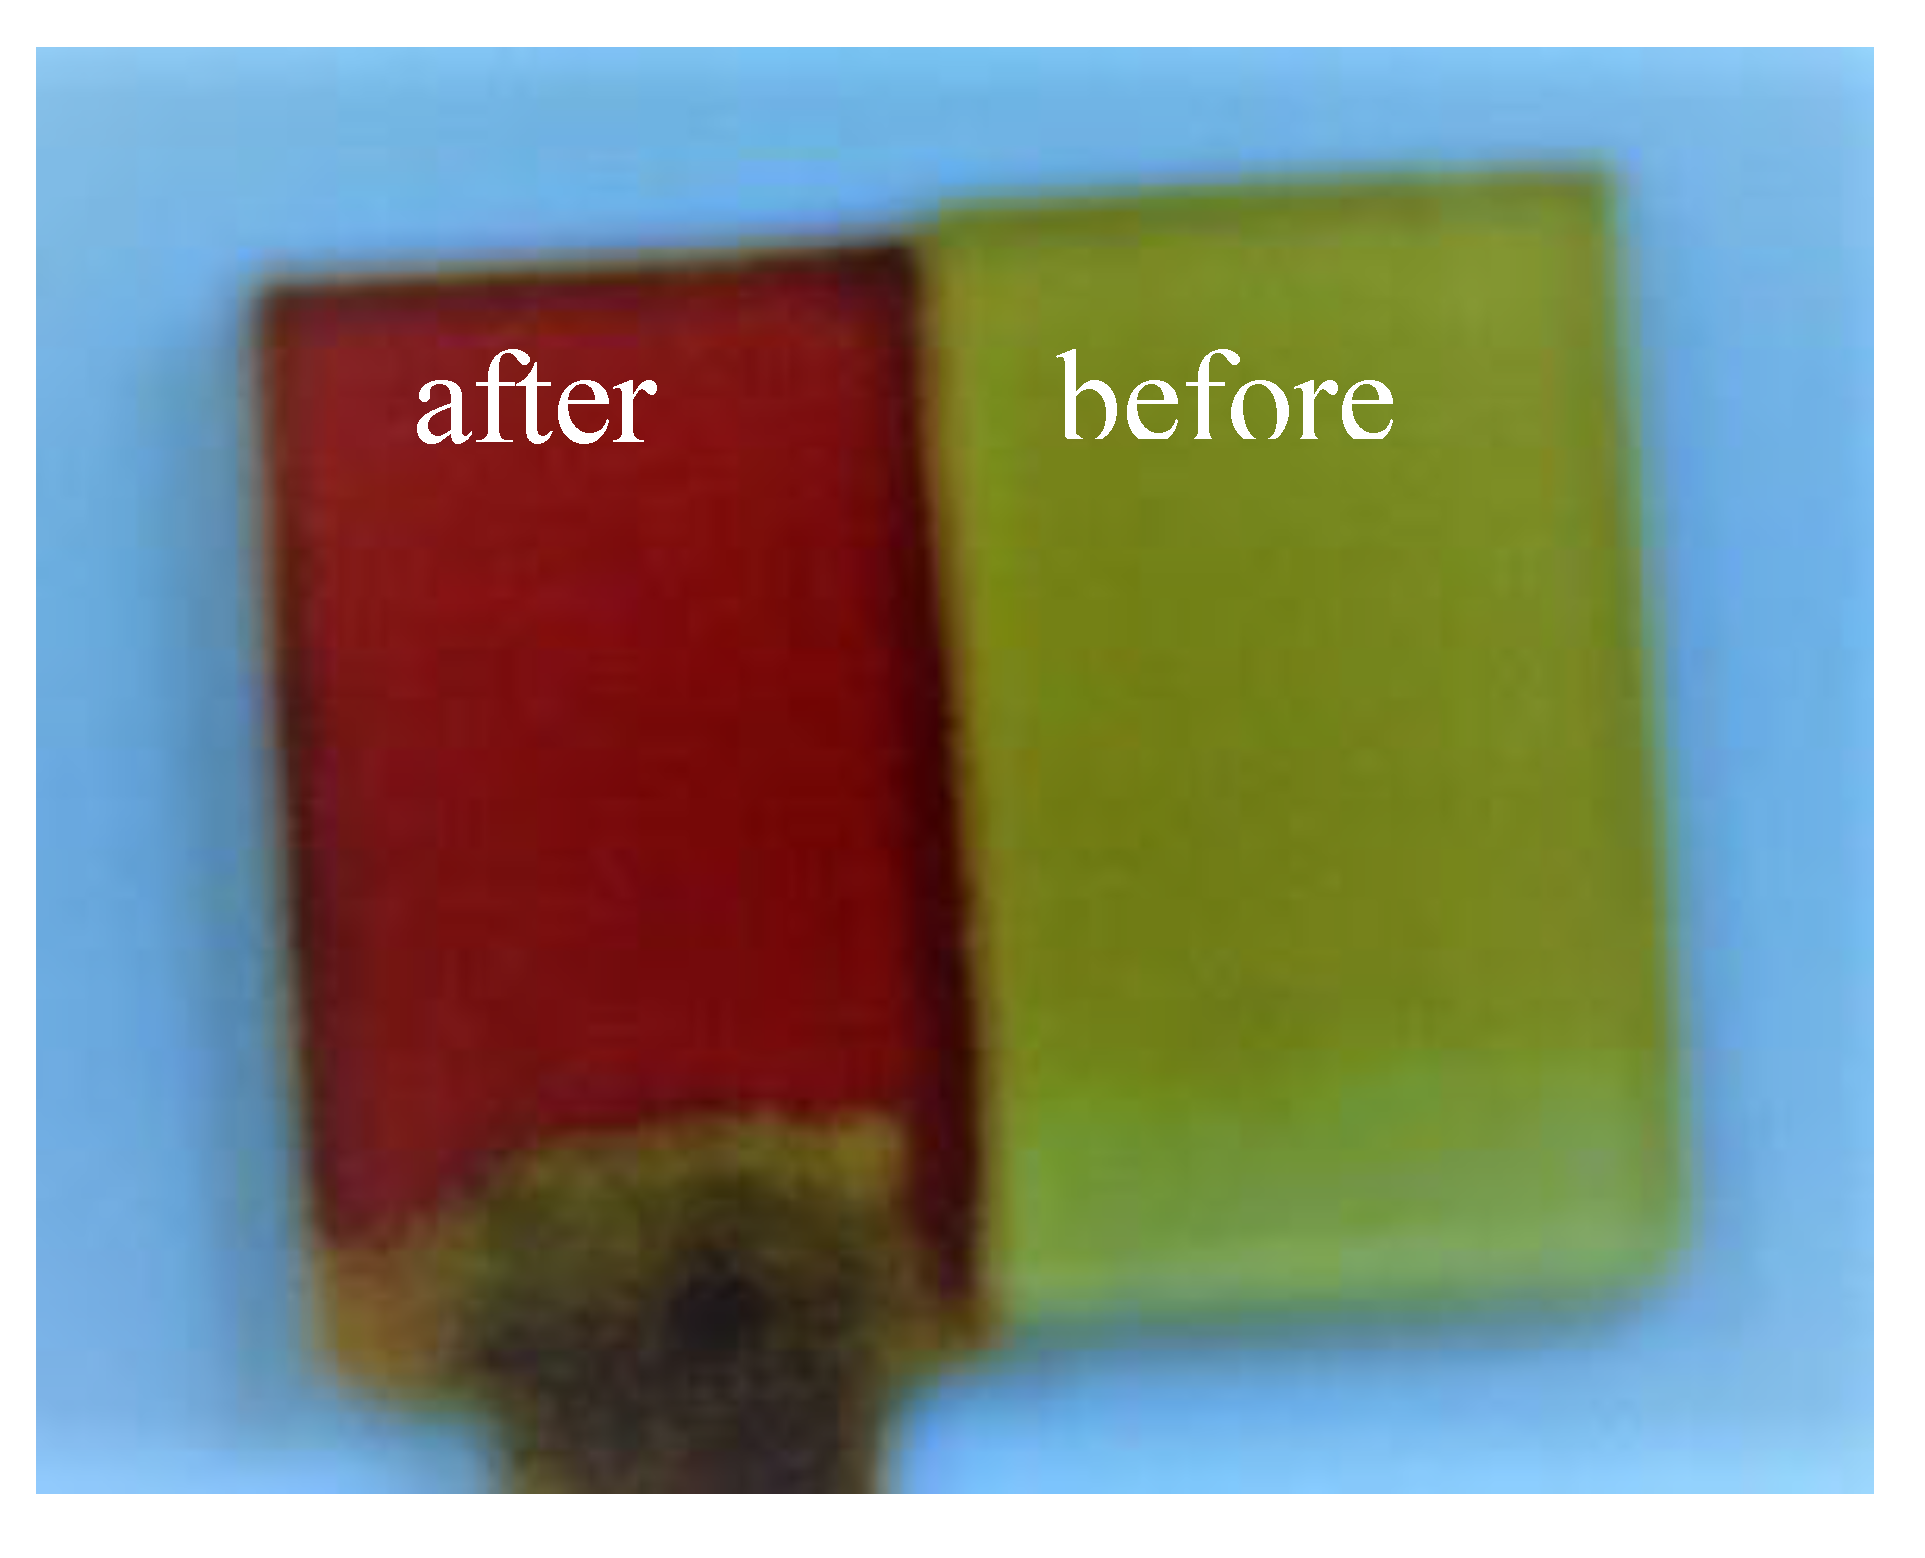
2.1. Materials Preparation

Undoped α-Fe2O3 nanorod arrays were grown on fluorine-doped tin oxide (FTO) conductive glass by an aqueous chemical growth method [20]. In a typical process, a sheet of FTO glass (15 mm × 25 mm) was placed in a glass vial of 25 mL, leaning against the inwall of the vial as displayed in Figure 1. An aqueous solution containing 0.1 M FeCl3 and 1 M NaNO3 was prepared and its pH was adjusted to 1.25 by HCl. Then a proper amount of the reactant solution was injected into the vial, leaving part of the FTO substrate uncovered. The vial was sealed and heated at 95 °C for 10 h. After reaction, the FTO substrate was rinsed by deionized water and precipitates on its non-conductive side was removed. Last, the FTO substrate was annealed in a muffle furnace at 500 °C for 1 h. Co-doped and Ni-doped α-Fe2O3 nanorod arrays were prepared in a similar process except that small amounts of CoCl2 or NiCl2 were added into the aqueous solution. The molar ratio of dopants to photoelectrode materials reported in the literature was normally in the range of 1% to 10% [2,30]. Thus, the molar ratio of the dopants to Fe here was set at 1:20 (i.e., 5%).

2.2. Materials Characterization

Crystalline structures of the as-prepared samples were detected by X-ray diffraction (XRD, Rigaku D-MAX/2550, Tokyo, Japan) with Cu Kα radiation. The microscopic morphology of the samples was characterized by scanning electron microscopy (SEM, JEOL JSM−6360LV, Tokyo, Japan). The optical absorption property of the samples was analyzed by an ultraviolet (UV)–visible spectrophotometer (Shimadzu UV-2401PC, Kyoto, Japan). The instrument was calibrated with blank FTO conductive glass so that the UV-vis absorption spectra of the as-prepared α-Fe2O3 samples alone can be achieved.

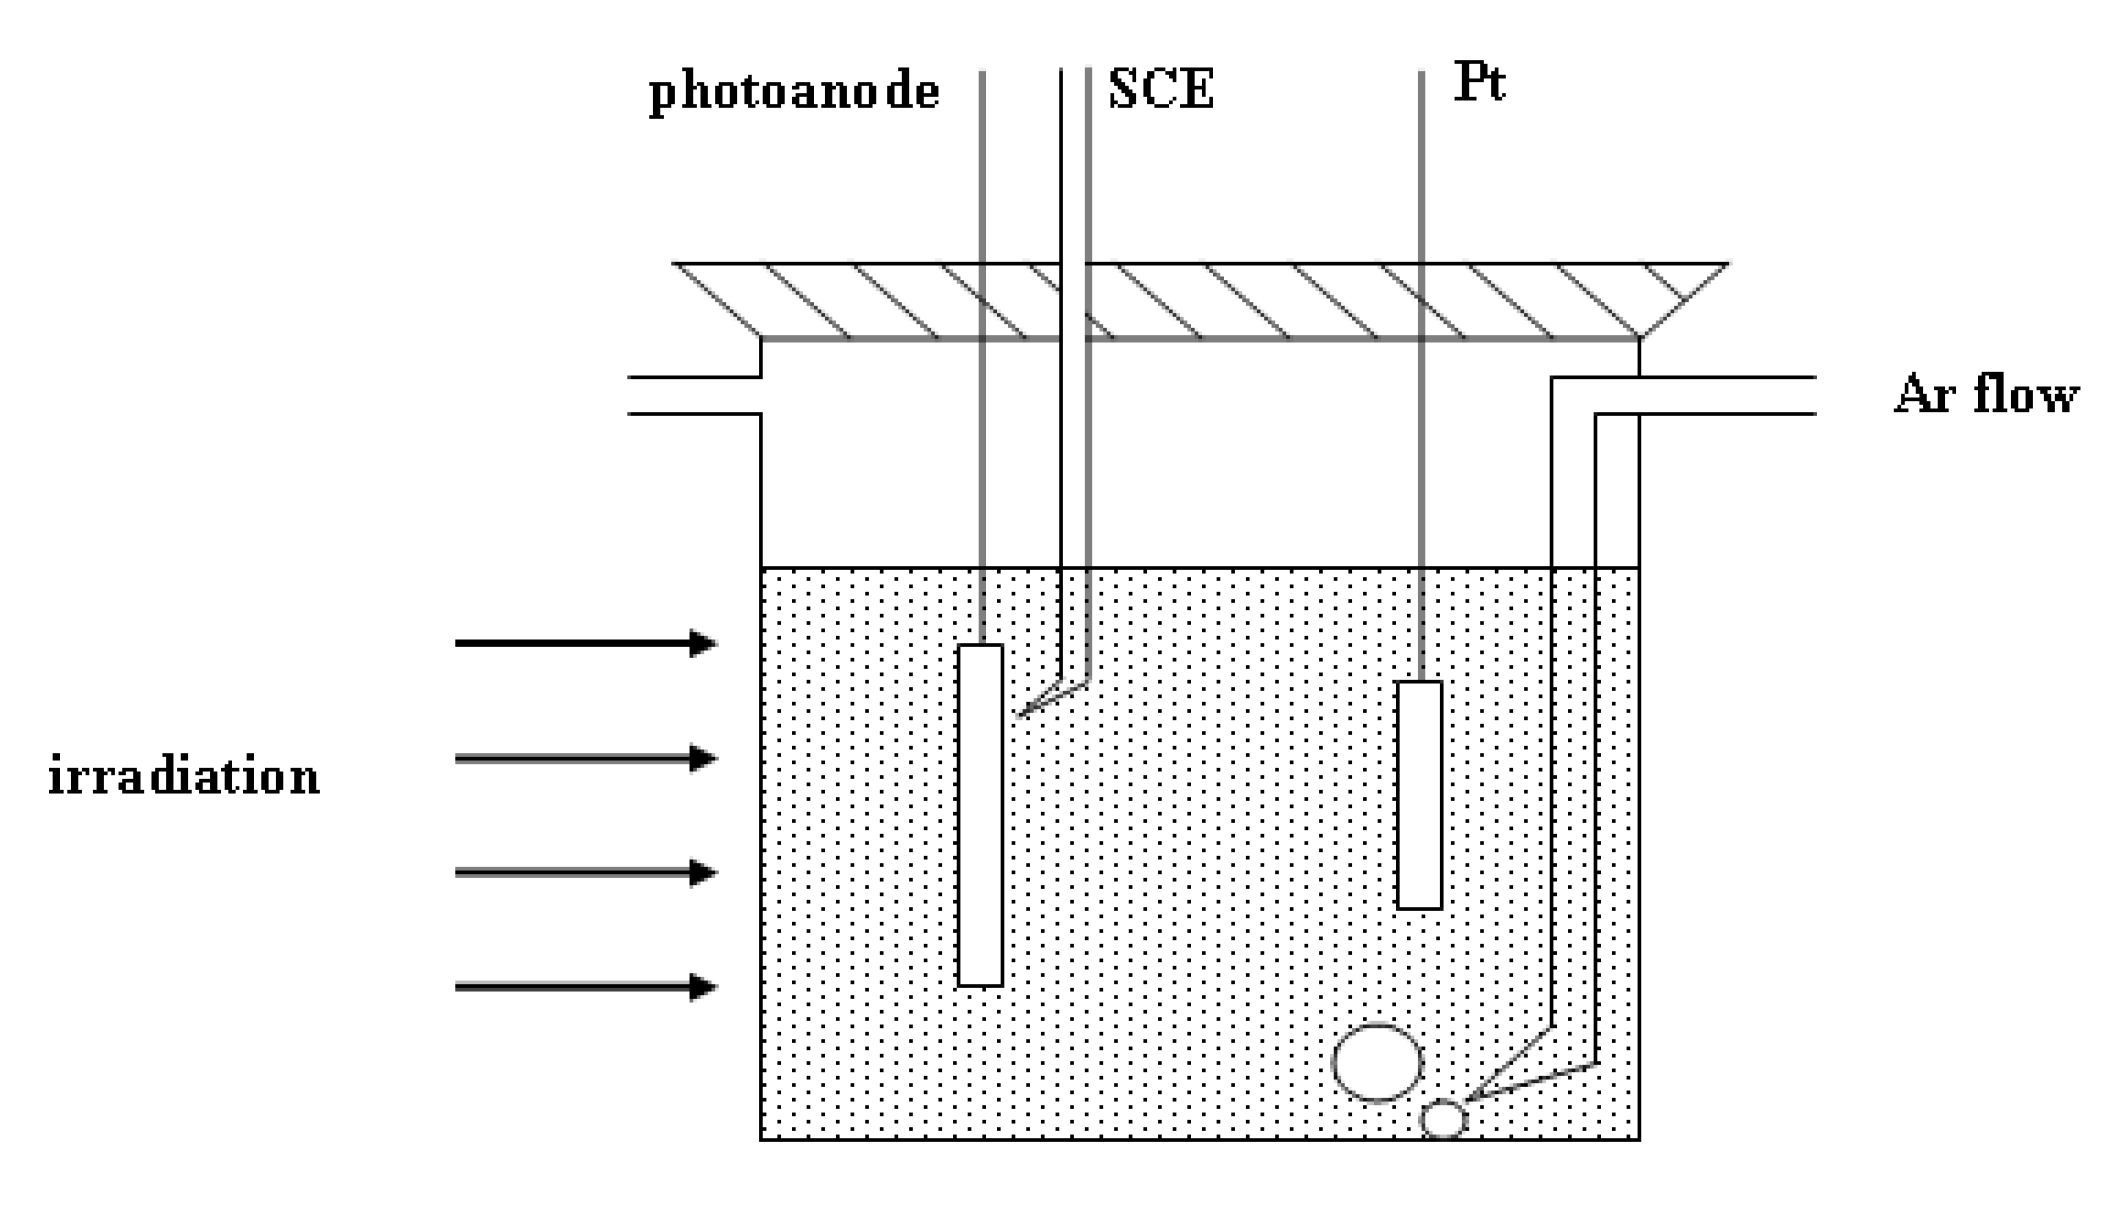
2.3. Photoelectrochemical Measurements

The preparation of α-Fe2O3 photoanodes is illustrated in Figure 1. After the α-Fe2O3 was formed, the blank of the FTO substrate was stuck to a Cu sheet by silver conductive adhesive. Then the margin and the back of the FTO substrate was coated by insulation paste to achieve an active area of around 1 cm × 1 cm.
A three-electrode cell system was assembled for the PEC measurement as Figure 2 shows. The as-prepared α-Fe2O3 photoanode acted as working electrode, a Pt sheet (1 cm × 1 cm) as a counter electrode, and saturated calomel electrode (SCE) as a reference electrode. 1 M KOH solution was used as electrolyte. The PEC cell was continuously purged with Ar gas when it was in operation. Illumination of AM1.5 and 100 mW/cm2 was provided by a solar simulator (America Newport Oriel69911). Linear sweep voltammetry (LSV) test was performed on an electrochemical workstation (Shanghai Chenhua CHI660B, China). The scanning rate was 5 mV/s and the scanning range was from −0.3 to 0.6 V vs. SCE. The Mott–Schottky (M–S) test was also carried out on an electrochemical workstation (Princeton Applied Research Company PARSTAT2273, TN, USA) at a frequency of 1000 Hz.

3. Results and Discussion

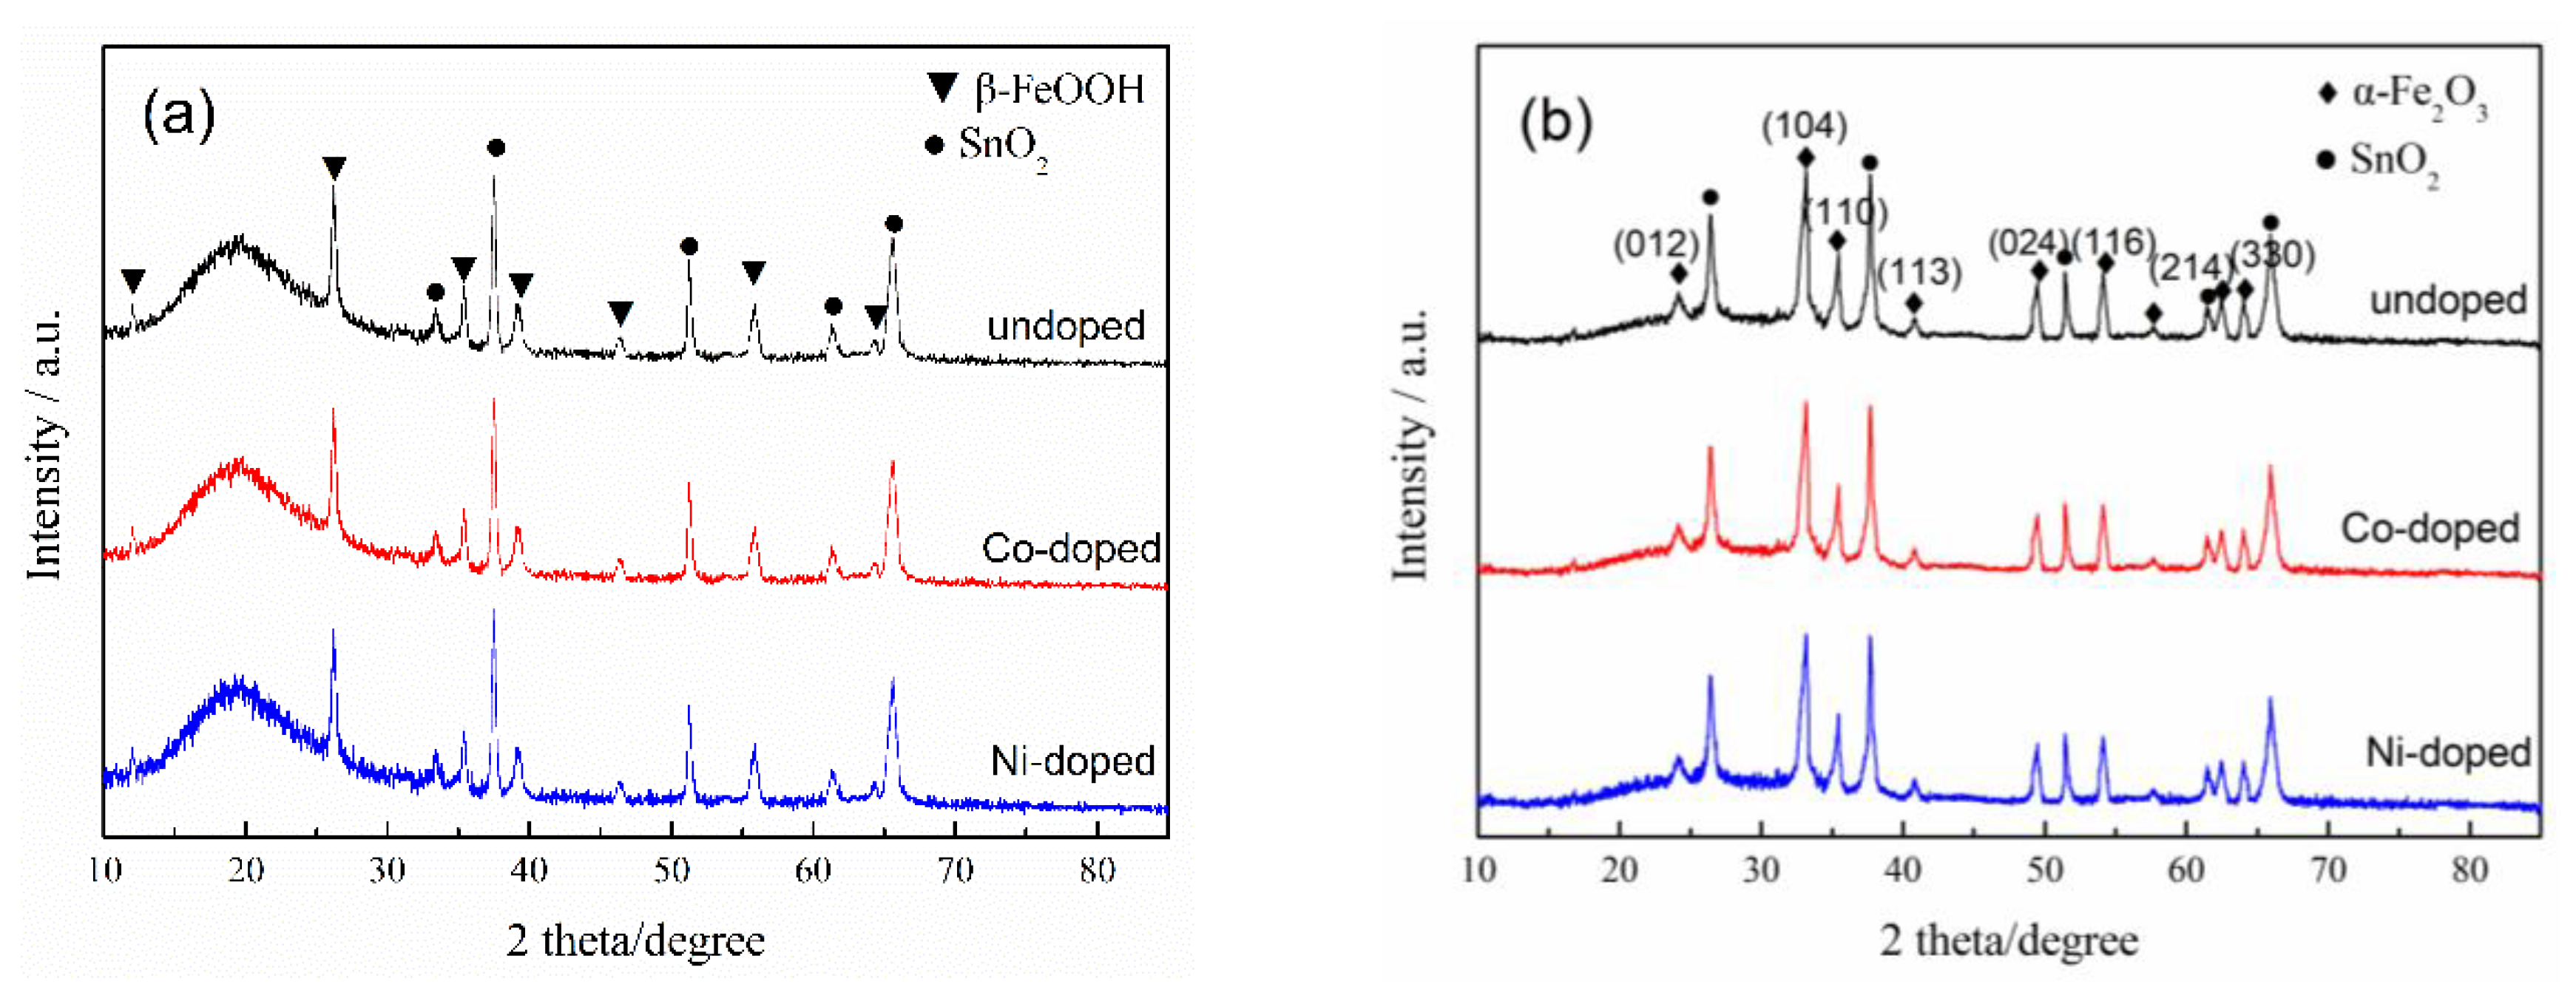
3.1. Effects on Crystalline Phase

Figure 3a shows XRD profiles of the samples obtained from aqueous chemical growth without annealing. The broad diffraction peak around 20° is assigned to amorphous SiO2 (JCPDS 51-1593), which is the matrix of FTO glass. The diffraction peaks marked with bold dots belong to SnO2 (JCPDS 46-1088), a conductive film on the glass matrix. In addition to these background peaks, characteristic diffraction peaks of crystalline β-FeOOH (JCPDS 34-1266) also exist. Figure 3b displays XRD profiles of the samples after annealing at 500 °C for 1 h. By comparing Figure 3a,b, it was found that annealing led to the transformation from β-FeOOH to α-Fe2O3 (JCPDS 33-064). Such a phase transformation was also indicated by the color change of the sample from yellow to red (see Figure 4). In order to find out whether the α-Fe2O3 are oriented, the intensity ratio of each characteristic peak relative to the (1 0 4) peak, which shows the largest intensity, was calculated, and compared with the standard data in JCPDS 33-064. The two sets of data are almost consistent with each other, indicating the α-Fe2O3 are not oriented.
Figure 3 also shows that the XRD profiles of the Co-doped and the Ni-doped samples are almost the same as that of the undoped one. Neither dopant-related phases nor a shift of the α-Fe2O3 diffraction peaks was observed in the XRD profiles of the doped samples. This suggests the doping of Co or Ni has few influences on the crystal structure of α-Fe2O3. This is probably because Co or Ni is successfully doped into the crystal lattice of α-Fe2O3 due to their similar atomic structures and the amount of the dopants was small. Similar results have been reported by others [36,39]. Hou et al. [36] believed that Co could be easily incorporated into the crystal lattice of α-Fe2O3 and hence considered Co to be a suitable dopant for α-Fe2O3. Li et al. [39] synthesized α-Fe2O3 nanowires on a FTO substrate and diffused Sn from FTO to α-Fe2O3 by high-temperature sintering. Their SEM and XRD results revealed that neither the structure nor the crystal phase of the α-Fe2O3 changed after Sn was incorporated.

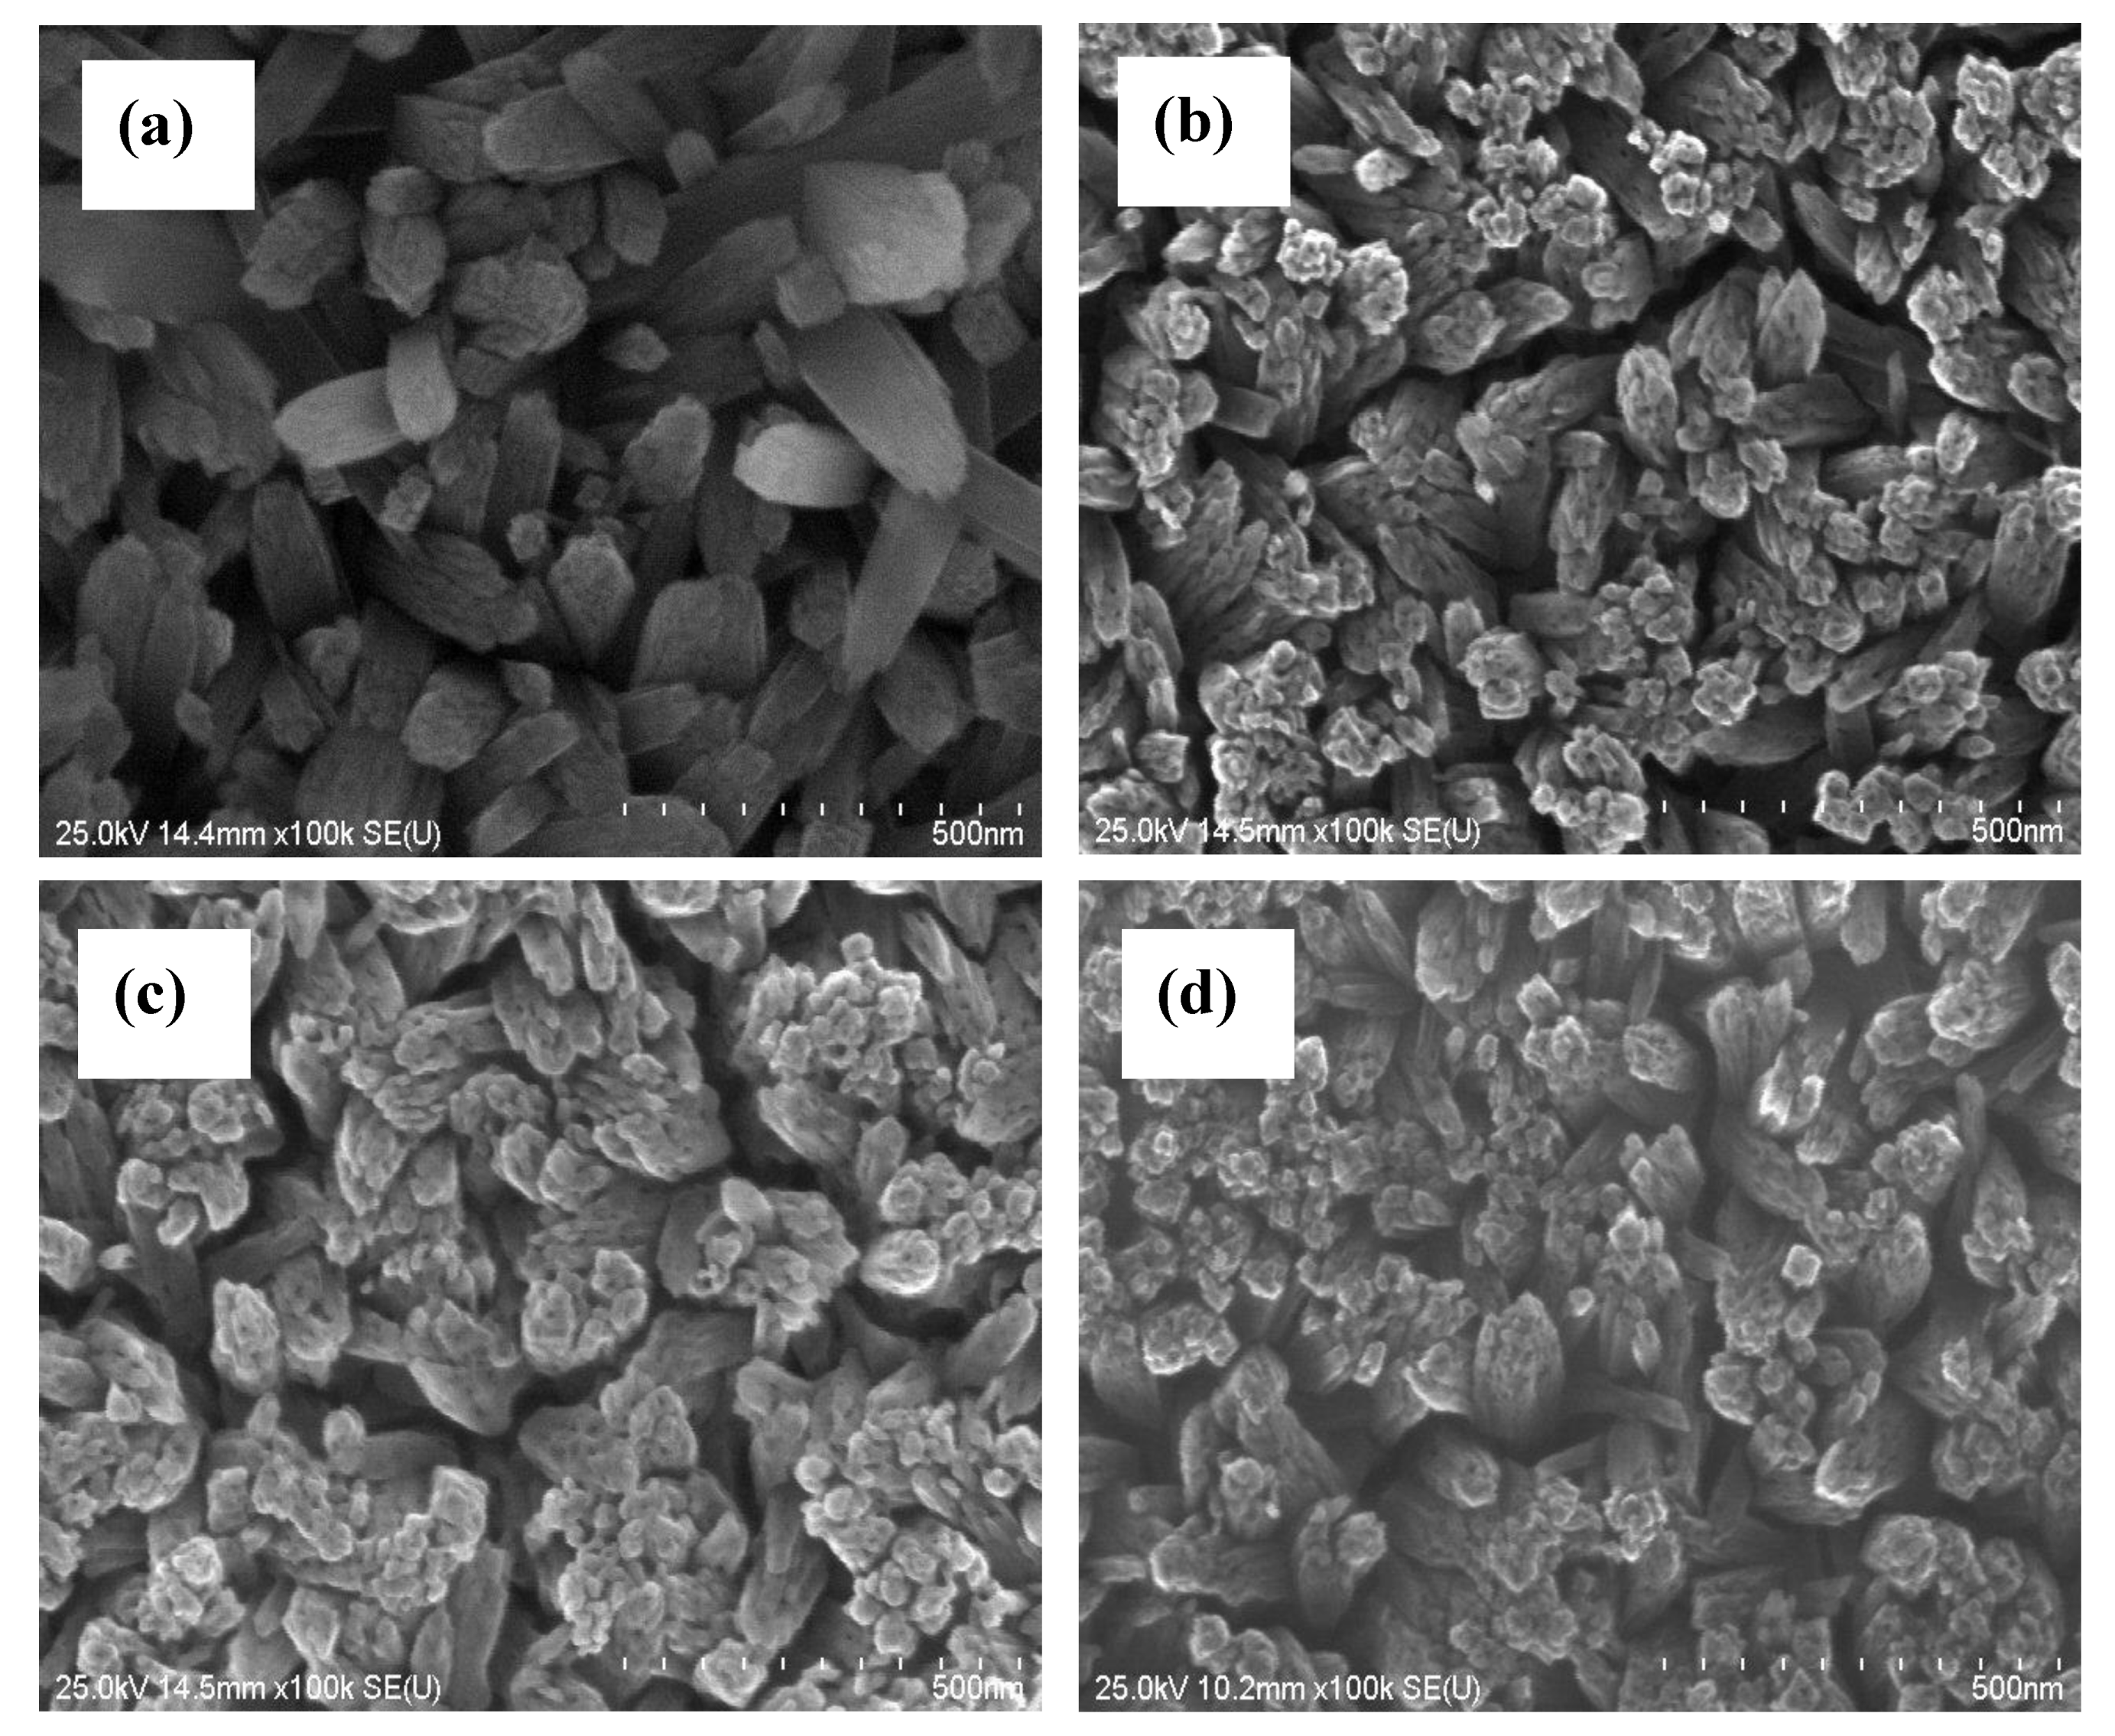
3.2. Effects on Morphology

Figure 5 displays the microscopic morphology of the as-prepared β-FeOOH and α-Fe2O3. The β-FeOOH is presented as a nanorod array that vertically grows on the substrate (Figure 5a). The α-Fe2O3 samples also show a similar morphology except for a slight volume contraction (Figure 5b), suggesting a topological transformation from β-FeOOH to α-Fe2O3. When Co or Ni dopant was introduced, the morphology of the α-Fe2O3 remained almost the same as exhibited in Figure 5c,d. The three α-Fe2O3 samples were all comprised of bunches of nanorods. Each bunch of nanorods had a diameter of about 50 nm and each nanorod had a diameter of about 5–10 nm. The small diameter is beneficial to the transport of photoinduced holes to the semiconductor-electrolyte interface, although the α-Fe2O3 nanorods do not have the merit of a high conductivity since they are not oriented in the (0 0 1) direction on the substrate [6,17,39].

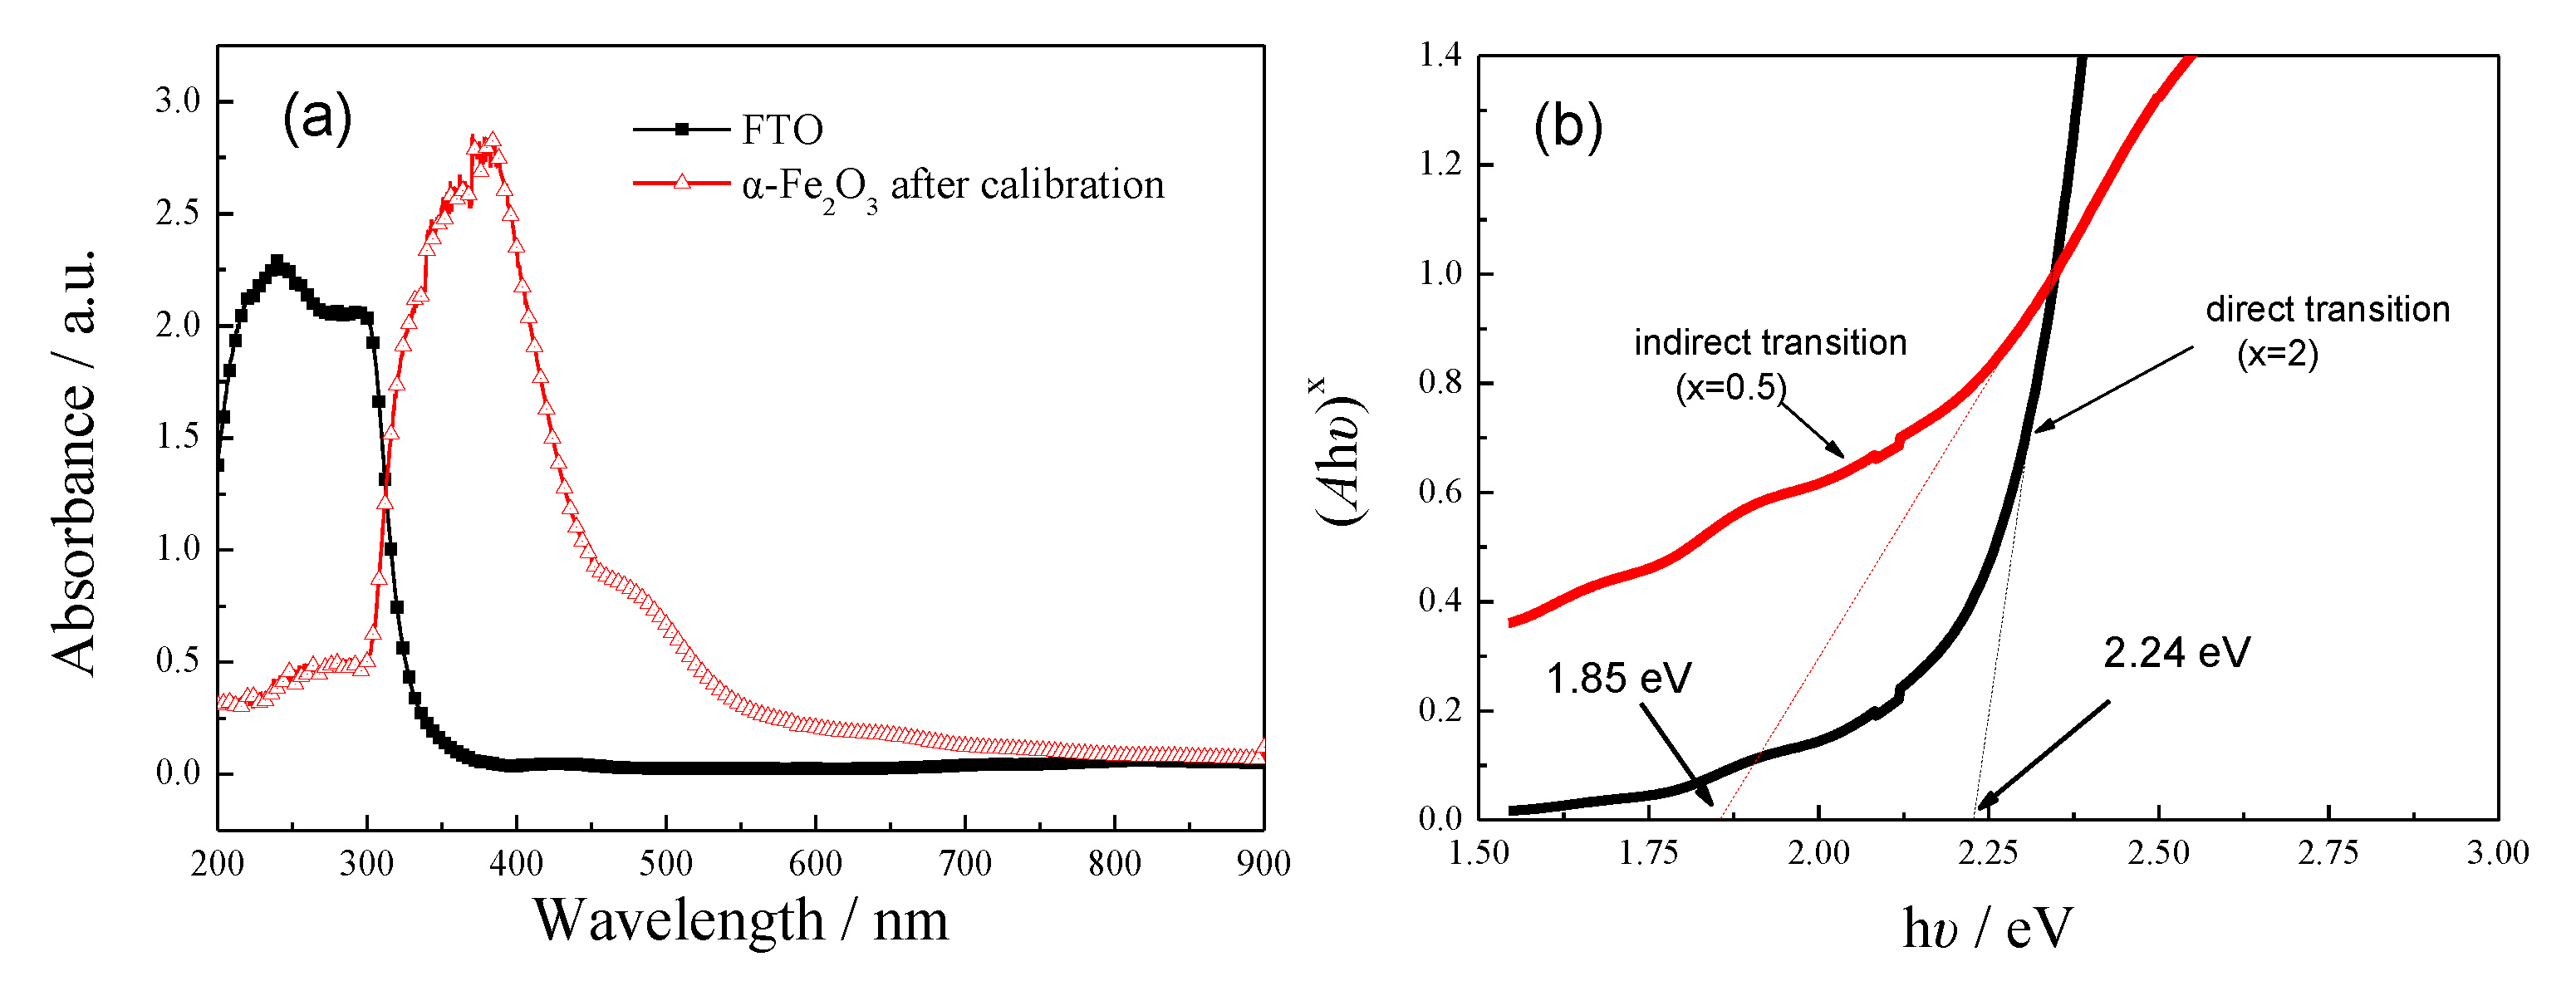
3.3. Effects on Ultraviolet (UV)–Visible Absorption

Figure 6a shows the UV–visible absorption spectrum of the α-Fe2O3 nanorod array. The absorption band is mainly located between 300 nm and 550 nm. Electron transition on the energy levels of α-Fe2O3 can be divided into direct transition and indirect transition, corresponding to O2−→Fe3+ and Fe3+ 3d→3d, respectively [40]. The energy gaps of direct transition and indirect transition could be estimated by Equations (4) and (5), which were derived from Equations (2) and (3). The plots of (Ahv)2 or (Ahv)0.5 against hv (i.e., Tauc plots) of the undoped α-Fe2O3 are displayed in Figure 6b. The intersection of the linear extension of the Tauc plots with x axis represents the energy gap of direct transition or indirect transition [41]. They are 2.24 eV and 1.85 eV, respectively, in the present work. The energy gap of the direct transition estimated by the Tauc plot is close to its theoretical value (2.1–2.2 eV). Vayssieres et al. [42] observed that the energy gap of α-Fe2O3 nanorods increased by 0.3–0.6 eV compared with α-Fe2O3 bulk due to the quantum confinement effect of nanorods. However, the quantum confinement effect was not observed in this study.
Eg = 1240/λ
αhν = B(hν − Eg)n
A = αbc
[(A/Bbc)hν]2 = hν − Eg     for direct transition
[(A/Bbc)hν]0.5 = hν − Eg     for indirect transition
  • Eg: energy gap in eV between a conduction band and a valence band
  • λ: wavelength in nm
  • α: absorption coefficient
  • hν: the energy of a photon
  • B: a constant
  • n: a constant 0.5 for direct transition and 2.0 for indirect transition
  • A: absorbance
  • b: the thickness of light-absorbing substance
  • c: the concentration of light-absorbing substance
The UV–visible absorption spectra of the doped samples are not displayed in Figure 6 as they overlap with the undoped one. As the UV–visible absorption spectra are almost the same this suggests that the Co or Ni doping has little influence on the optical absorption of α-Fe2O3. Inducing a red shift of absorption onset is one of the reasons for an enhanced PEC performance [4,36]. However, in this study, this reason was excluded. Similar to this study, other researchers [5,43] also observed the doping of foreign elements did not change the energy gap of α-Fe2O3.

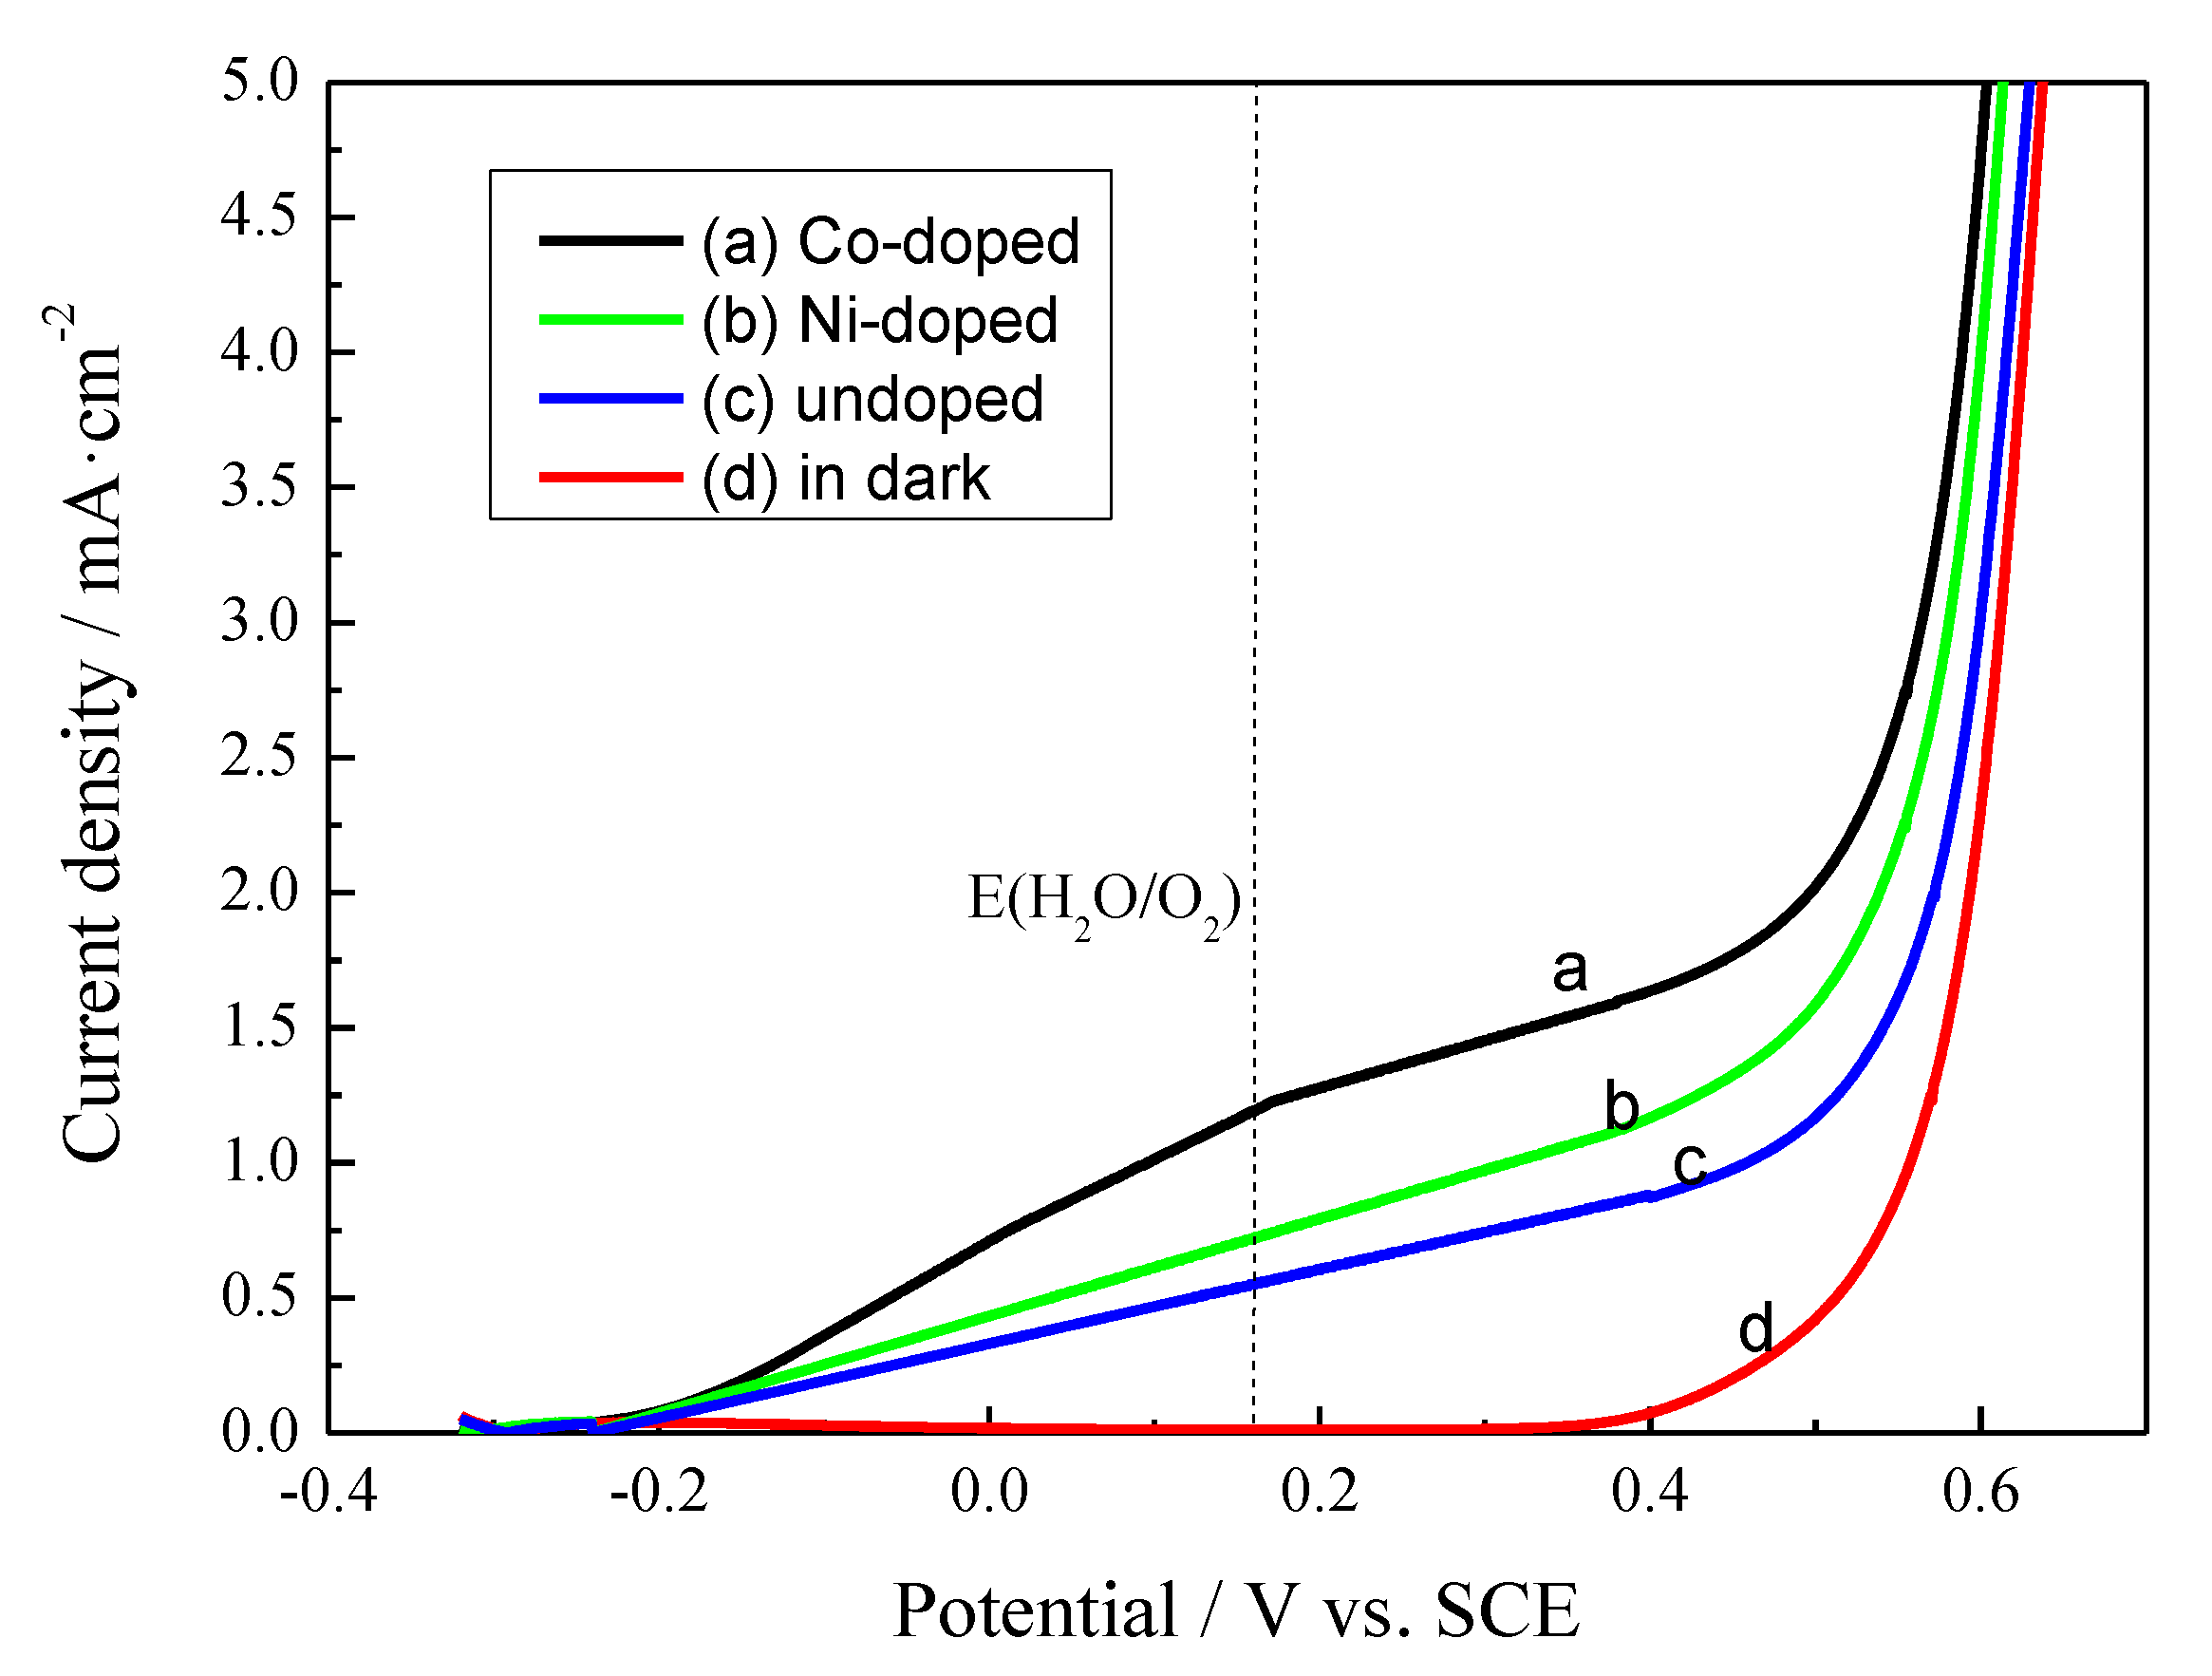
3.4. Effects on Photoelectrochemical Performance

3.4.1. Current-voltage (I-V) Plots

Figure 7 shows the I-V plots of the as-prepared α-Fe2O3 samples. The equilibrium potential of water oxidation (i.e., E(H2O/O2)) is 0.1572 V vs. SCE in 1 M KOH electrolyte. For the undoped α-Fe2O3 in dark, the initial potential for the occurrence of current is 0.36 V, more positive than the equilibrium potential due to the existence of overpotential. When the undoped α-Fe2O3 sample is under solar irradiation, the initial potential moves to −0.22 V, much more negative than the equilibrium potential, indicating an obvious PEC effect. The doped α-Fe2O3 samples exhibit a similar initial potential to the undoped α-Fe2O3 under illumination. The initial potential of photocurrent is generally considered as flat band potential. The three samples have similar flat band potentials, which suggests that the doping of 5% Co or Ni does not change the energy band structure of the α-Fe2O3 nanorod array [42]. This conclusion is consistent with that derived from the Tauc plots (see Section 3.3).
In addition to the initial potential, photocurrent at a certain potential is another index of the PEC activity. At 0.2 V vs. SCE, the photocurrent density of the Co-doped and the Ni-doped α-Fe2O3 are 1.28 mA/cm2 and 0.79 mA/cm2, respectively, which are 2.1 times and 1.3 times that of the undoped α-Fe2O3. This result suggests the incorporation of Co and Ni into α-Fe2O3 nanorod array could enhance its PEC activity. The photocurrent densities of doped and undoped α-Fe2O3 reported in the literature are summarized in Table 1.

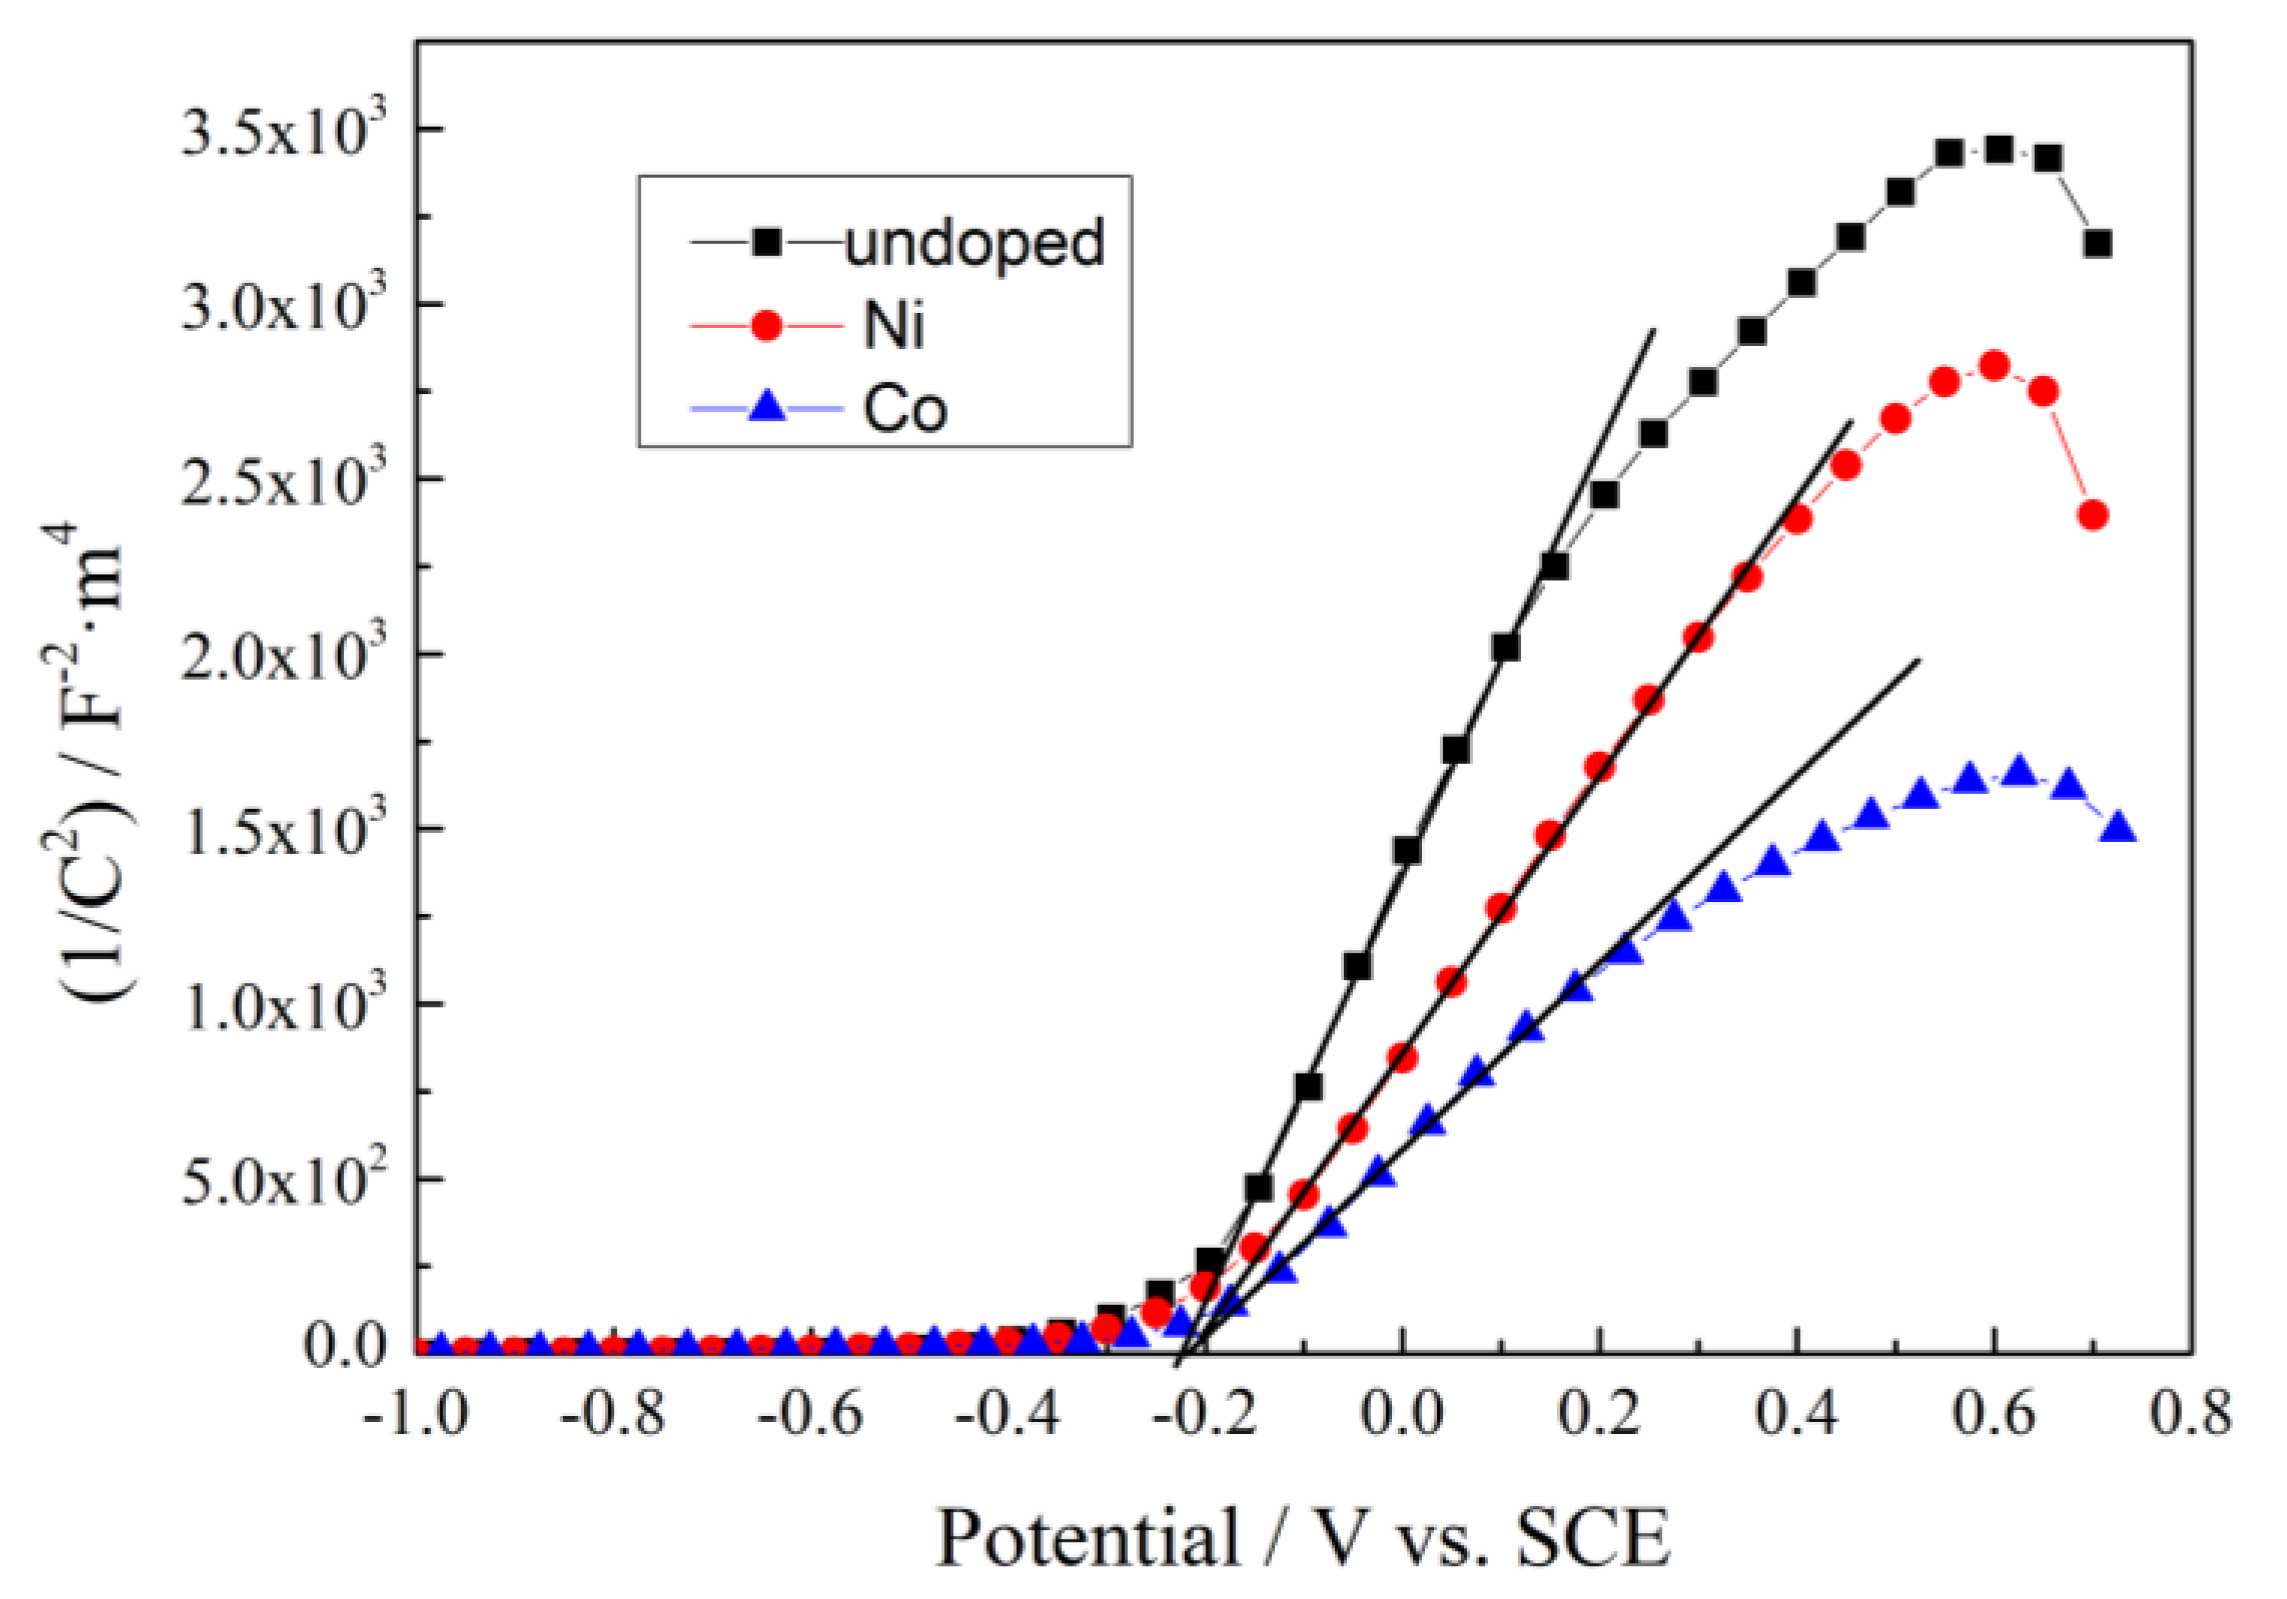
3.4.2. Mott–Schottky Plots

In order to explain why the PEC activity of α-Fe2O3 was enhanced by Co or Ni doping, M–S plots of both doped and undoped α-Fe2O3 samples were measured and shown in Figure 8. All the samples exhibited a positive slope, indicating they are all n-type semiconductors with electrons as majority charge carriers. The slope of the linear part of the M-S plots could be used to estimate the concentration of charge carriers (Nd) according to Equation (6).
1/C2 = (2/e0εε0Nd) [(E − Efb) − kT/e0]
In this equation, C is the space charge capacitance per m2 active area, e0 is the elementary charge (1.6 × 10⁻¹⁹ C), ε is the dielectric constant of α-Fe2O3 (14.2), ε0 is the permittivity of vacuum (8.85 × 10⁻¹² F/m), E is the applied potential, Efb is the potential of flat bands, k is Boltzmann’s constant (1.3806505 × 10⁻²³ J/K), and T is the absolute temperature (298 K).
The concentration of charge carriers derived from the slope and the Efb derived from the intercept of the M–S plot are listed in Table 2. The Efb of both doped and undoped α-Fe2O3 samples is around −0.22 V, indicating the doping has little influence on the Efb. This conclusion is consistent with that obtained from I-V plots (see Figure 7). The charge carrier concentration of the undoped α-Fe2O3 is 1.65 × 1025 m−3, which is in the same order of magnitude as those reported in the literature [5,6,39,44]. After Co or Ni doping, the charge carrier concentration increased to 3.74 × 1025 m−3 and 2.50 × 1025 m−3, respectively, which are 2.3 times and 1.5 times that of the undoped sample. The increase in the charge carrier concentration means the improvement of the electrical conductivity, which may contribute to the enhanced PEC activity of the doped samples. Zhao et al. [45] reported that the heterogeneous interface of nickel and iron oxide exhibited a high electrocatalytic activity for hydrogen evolution reaction in alkaline media. In the present work, whether the Co or Ni doping promotes the electrocatalytic performance of α-Fe2O3 nanorods has not been investigated. It is necessary to figure this question out in future because an improved electrocatalytic activity may be one of the potential reasons for the enhanced photocurrents observed for the doped α-Fe2O3 samples. This question could be solved by comparing the I-V plots of the doped samples and the undoped sample in dark.
Furthermore, the higher photocurrent of the Co-doped α-Fe2O3 compared with the Ni-doped sample may be attributed to a larger carrier density (see Figure 7 and Table 2). However, this observation could not justify that the Co doping outperformed the Ni doping since the dopant concentrations were not known. In fact, the PEC activity of a doped photoelectrode depends not only on the identity of the dopant but also on the dopant concentration, distribution and the morphology and microstructure of the doped photoelectrode [46]. In order to compare the effects of different dopants, Co-doped and Ni-doped α-Fe2O3 nanorod arrays with the same dopant concentration and distribution should be synthesized in future.

4. Conclusions

In situ doping of 5% Co or Ni into α-Fe2O3 nanorod arrays was performed by a facile aqueous chemical growth method followed by annealing at 500 °C. The doping did not change the crystal structure, morphology, energy gap and flat band potential of the α-Fe2O3 nanorod arrays, but enhanced its PEC activity. At 0.2 V vs. SCE, the Co-doped and the Ni-doped α-Fe2O3 exhibited a photocurrent density of 1.28 mA/cm2 and 0.79 mA/cm2, respectively, which were 2.1 times and 1.3 times that of the undoped α-Fe2O3. The charge carrier concentration of the Co-doped and the Ni-doped α-Fe2O3 were 2.3 times and 1.5 times that of the undoped α-Fe2O3. Therefore, the increase in the photocurrent density of the doped α-Fe2O3 was likely attributed to the enhanced conductivity. In the future, the following work will be conducted. (1) Materials characterization such as energy dispersive X-ray spectroscopy (EDS), X-ray photoelectron spectroscopy (XPS) or inductively coupled plasma-mass spectrometry (ICP-MS) will be performed in order to provide direct evidence of the incorporation of Co or Ni. (2) The influence of dopant concentrations on the PEC performance will be investigated and the optimal concentration will be obtained. (3) The effects of Co doping and Ni doping will be compared by synthesizing samples with the same dopant concentration and distribution.

Author Contributions

Conceptualization, X.L. and F.C.; methodology, F.C.; validation, X.L. and F.C.; formal analysis, F.C.; investigation, F.C.; resources, X.L.; data curation, F.C.; writing—original draft preparation, F.C.; writing—review and editing, X.L.; supervision, X.L.; project administration, X.L.; funding acquisition, X.L. All authors have read and agreed to the published version of the manuscript.

Funding

This research was funded by National Natural Science Foundation of China, grant number 51676098 and by Natural Science Foundation of Jiangsu Province, grant numbers BK20170095 and BK20160822. The APC was funded by Natural Science Foundation of Jiangsu Province.

Acknowledgments

The authors also would like to give thanks to the Makerspace of Energy Saving and Emission Reduction which provides the place for experiments.

Conflicts of Interest

The authors declare no conflict of interest. The funders had no role in the design of the study; in the collection, analyses, or interpretation of data; in the writing of the manuscript; or in the decision to publish the results.

References

  1. Fujishima, A.; Honda, K. Electrochemical photolysis of water at a semiconductor electrode. Nature 1972, 238, 37–38. [Google Scholar] [CrossRef] [PubMed]
  2. Liu, C.; Wang, F.; Zhu, S.; Xu, Y.; Liang, Q.; Chen, Z. Controlled charge-dynamics in cobalt-doped TiO2 nanowire photoanodes for enhanced photoelectrochemical water splitting. J. Colloid Interface Sci. 2018, 530, 403–411. [Google Scholar] [CrossRef] [PubMed]
  3. Dong, Z.; Ding, D.; Li, T.; Ning, C. Black Si-doped TiO2 nanotube photoanode for high-efficiency photoelectrochemical water splitting. RSC Adv. 2018, 8, 5652–5660. [Google Scholar] [CrossRef]
  4. Yu, L.; Zhang, Y.; He, J.; Zhu, H.; Zhou, X.; Li, M.; Yang, Q.; Xu, F. Enhanced photoelectrochemical properties of alpha-Fe2O3 nanoarrays for water splitting. J. Alloy. Compd. 2018, 753, 601–606. [Google Scholar] [CrossRef]
  5. Zhang, R.; Fang, Y.; Chen, T.; Qu, F.; Liu, Z.; Du, G.; Asiri, A.M.; Gao, T.; Sun, X. Enhanced Photoelectrochemical Water Oxidation Performance of Fe2O3 Nanorods Array by S Doping. Acs Sustain. Chem. Eng. 2017, 5, 7502–7506. [Google Scholar] [CrossRef]
  6. Zhang, Q.; Wang, H.; Dong, Y.; Wu, Q.; Xue, S. Highly efficient hematite films via mid-/ex-situ Sn-doping for photoelectrochemical water oxidation. Int. J. Hydrog. Energy 2017, 42, 16012–16022. [Google Scholar] [CrossRef]
  7. Wang, B.-S.; Li, R.-Y.; Zhang, Z.-Y.; Xing, W.; Wu, X.-L.; Cheng, G.-A.; Zheng, R.-T. An overlapping ZnO nanowire photoanode for photoelectrochemical water splitting. Catal. Today 2019, 321, 100–106. [Google Scholar] [CrossRef]
  8. Altaf, C.T.; Yolacan, D.; Sankir, N.D. Decoration of 3D ZnO nanoelectrodes with CuInS2 for solar water splitting. Mater. Lett. 2019, 236, 710–714. [Google Scholar] [CrossRef]
  9. Song, K.; Ma, Z.; Yang, W.; Hou, H.; Gao, F. Electrospinning WO3 nanofibers with tunable Fe-doping levels towards efficient photoelectrochemical water splitting. J. Mater. Sci. Mater. Electron. 2018, 29, 8338–8346. [Google Scholar] [CrossRef]
  10. Kalanur, S.S.; Yoo, I.-H.; Eom, K.; Seo, H. Enhancement of photoelectrochemical water splitting response of WO3 by Means of Bi doping. J. Catal. 2018, 357, 127–137. [Google Scholar] [CrossRef]
  11. Kalanur, S.S.; Seo, H. Influence of molybdenum doping on the structural, optical and electronic properties of WO3 for improved solar water splitting. J. Colloid Interface Sci. 2018, 509, 440–447. [Google Scholar] [CrossRef] [PubMed]
  12. Sangle, A.L.; Singh, S.; Jian, J.; Bajpe, S.R.; Wang, H.; Khare, N.; MacManus-Driscoll, J.L. Very High Surface Area Mesoporous Thin Films of SrTiO3 Grown by Pulsed Laser Deposition and Application to Efficient Photoelectrochemical Water Splitting. Nano Lett. 2016, 16, 7338–7345. [Google Scholar] [CrossRef] [PubMed] [Green Version]
  13. Asai, R.; Nemoto, H.; Jia, Q.; Saito, K.; Iwase, A.; Kudo, A. A visible light responsive rhodium and antimony-codoped SrTiO3 powdered photocatalyst loaded with an IrO2 cocatalyst for solar water splitting. Chem. Commun. 2014, 50, 2543–2546. [Google Scholar] [CrossRef] [PubMed]
  14. Sun, S.; Wang, W.; Li, D.; Zhang, L.; Jiang, D. Solar Light Driven Pure Water Splitting on Quantum Sized BiVO4 without any Cocatalyst. Acs Catal. 2014, 4, 3498–3503. [Google Scholar] [CrossRef]
  15. Suarez, C.M.; Hernandez, S.; Russo, N. BiVO4 as photocatalyst for solar fuels production through water splitting: A short review. Appl. Catal. a-Gen. 2015, 504, 158–170. [Google Scholar] [CrossRef]
  16. Shen, S.; Jiang, J.; Guo, P.; Kronawitter, C.X.; Mao, S.S.; Guo, L. Effect of Cr doping on the photoelectrochemical performance of hematite nanorod photoanodes. Nano Energy 2012, 1, 732–741. [Google Scholar] [CrossRef]
  17. Mulmudi, H.K.; Mathews, N.; Dou, X.C.; Xi, L.F.; Pramana, S.S.; Lam, Y.M.; Mhaisalkar, S.G. Controlled growth of hematite (alpha-Fe2O3) nanorod array on fluorine doped tin oxide: Synthesis and photoelectrochemical properties. Electrochem. Commun. 2011, 13, 951–954. [Google Scholar] [CrossRef]
  18. Mohapatra, S.K.; John, S.E.; Banerjee, S.; Misra, M. Water Photooxidation by Smooth and Ultrathin α-Fe2O3 Nanotube Arrays. Chem. Mater. 2009, 21, 3048–3055. [Google Scholar] [CrossRef]
  19. Lindgren, T.; Wang, H.; Beermann, N.; Vayssieres, L.; Hagfeldt, A.; Lindquist, S.-E. Aqueous photoelectrochemistry of hematite nanorod array. Sol. Energy Mater. Sol. Cells 2002, 71, 231–243. [Google Scholar] [CrossRef]
  20. Vayssieres, L.; Beermann, N.; Lindquist, S.E.; Hagfeldt, A. Controlled aqueous chemical growth of oriented three-dimensional crystalline nanorod arrays: Application to iron(III) oxides. Chem. Mater. 2001, 13, 233–235. [Google Scholar] [CrossRef]
  21. Mao, A.; Shin, K.; Kim, J.K.; Wang, D.H.; Han, G.Y.; Park, J.H. Controlled Synthesis of Vertically Aligned Hematite on Conducting Substrate for Photoelectrochemical Cells: Nanorods versus Nanotubes. Acs Appl. Mater. Interfaces 2011, 3, 1852–1858. [Google Scholar] [CrossRef] [PubMed]
  22. Kay, A.; Cesar, I.; Grätzel, M. New Benchmark for Water Photooxidation by Nanostructured α-Fe2O3 Films. J. Am. Chem. Soc. 2006, 128, 15714–15721. [Google Scholar] [CrossRef] [PubMed]
  23. Mao, A.; Han, G.Y.; Park, J.H. Synthesis and photoelectrochemical cell properties of vertically grown α-Fe2O3 nanorod arrays on a gold nanorod substrate. J. Mater. Chem. 2010, 20, 2247–2250. [Google Scholar] [CrossRef]
  24. Souza, F.L.; Lopes, K.P.; Nascente, P.A.P.; Leite, E.R. Nanostructured hematite thin films produced by spin-coating deposition solution: Application in water splitting. Sol. Energy Mater. Sol. Cells 2009, 93, 362–368. [Google Scholar] [CrossRef]
  25. Lassoued, A.; Lassoued, M.S.; Garcia-Granda, S.; Dkhil, B.; Ammar, S.; Gadri, A. Synthesis and characterization of Ni-doped alpha-Fe2O3 nanoparticles through co-precipitation method with enhanced photocatalytic activities. J. Mater. Sci. Mater. Electron. 2018, 29, 5726–5737. [Google Scholar] [CrossRef]
  26. Kment, Š.; Sivula, K.; Naldoni, A.; Sarmah, S.P.; Kmentová, H.; Kulkarni, M.; Rambabu, Y.; Schmuki, P.; Zbořil, R. FeO-based nanostructures and nanohybrids for photoelectrochemical water splitting. Prog. Mater. Sci. 2020, 110, 100632. [Google Scholar] [CrossRef]
  27. Bouhjar, F.; Mollar, M.; Chourou, M.L.; Mari, B.; Bessais, B. Hydrothermal synthesis of nanostructured Cr-doped hematite with enhanced photoelectrochemical activity. Electrochim. Acta 2018, 260, 838–846. [Google Scholar] [CrossRef]
  28. Wang, Q.; Chen, Y.; Xu, J.; Situ, Y.; Huang, H. Morphology-controlled synthesis of Ti-doped alpha-Fe2O3 nanorod arrays as an efficient photoanode for photoelectrochemical applications. Res. Chem. Intermed. 2018, 44, 2365–2378. [Google Scholar] [CrossRef]
  29. Zheng, D.; He, X.; Xu, W.; Lu, X. Self-surface-passivation of titanium doped hematite photoanode for efficient solar water and formaldehyde oxidation. Mater. Res. Bull. 2017, 96, 354–359. [Google Scholar] [CrossRef]
  30. Kaambre, T.; Vanags, M.; Parna, R.; Kisand, V.; Ignatans, R.; Kleperis, J.; Sutka, A. Yttrium-doped hematite photoanodes for solar water splitting: Photoelectrochemical and electronic properties. Ceram. Int. 2018, 44, 13218–13225. [Google Scholar] [CrossRef]
  31. Singh, A.P.; Saini, N.; Mehta, B.R.; Carraro, G.; Barreca, D. Hematite Thin Film Photoanodes for Visible Light Water Photooxidation: Effects of Zn Doping and Hydrogen Treatment. J. Nanosci. Nanotechnol. 2017, 17, 8959–8966. [Google Scholar] [CrossRef]
  32. Zhang, R.; Yang, L.; Huang, X.; Chen, T.; Qu, F.; Liu, Z.; Du, G.; Asiri, A.M.; Sun, X. Se doping: An effective strategy toward Fe2O3 nanorod arrays for greatly enhanced solar water oxidation. J. Mater. Chem. A 2017, 5, 12086–12090. [Google Scholar] [CrossRef]
  33. Chang, H.W.; Fu, Y.M.; Lee, W.Y.; Lu, Y.R.; Huang, Y.C.; Chen, J.L.; Chen, C.L.; Chou, W.C.; Chen, J.M.; Lee, J.F.; et al. Visible light-induced electronic structure modulation of Nb- and Ta-doped alpha-Fe2O3 nanorods for effective photoelectrochemical water splitting. Nanotechnology 2018, 29. [Google Scholar] [CrossRef] [PubMed]
  34. Bemana, H.; Rashid-Nadimi, S. Effect of sulfur doping on photoelectrochemical performance of hematite. Electrochim. Acta 2017, 229, 396–403. [Google Scholar] [CrossRef]
  35. Luo, Z.; Li, C.; Liu, S.; Wang, T.; Gong, J. Gradient doping of phosphorus in Fe2O3 nanoarray photoanodes for enhanced charge separation. Chem. Sci. 2017, 8, 91–100. [Google Scholar] [CrossRef] [Green Version]
  36. Hou, Y.; Zuo, F.; Dagg, A.; Feng, P. A Three-Dimensional Branched Cobalt-Doped α-Fe2O3 Nanorod/MgFe2O4 Heterojunction Array as a Flexible Photoanode for Efficient Photoelectrochemical Water Oxidation. Angew. Chem. 2013, 125, 1286–1290. [Google Scholar] [CrossRef]
  37. Suresh, R.; Vijayalakshmi, L.; Stephen, A.; Narayanan, V. Hydrothermal Synthesis and Characterization of Cobalt Doped α-Fe2O3. AIP Conf. Proc. 2010, 1276, 362–367. [Google Scholar] [CrossRef]
  38. Wang, J.; Du, C.; Peng, Q.; Yang, J.; Wen, Y.; Shan, B.; Chen, R. Enhanced photoelectrochemical water splitting performance of hematite nanorods by Co and Sn co-doping. Int. J. Hydrog. Energy 2017, 42, 29140–29149. [Google Scholar] [CrossRef]
  39. Ling, Y.; Wang, G.; Wheeler, D.A.; Zhang, J.Z.; Li, Y. Sn-Doped Hematite Nanostructures for Photoelectrochemical Water Splitting. Nano Lett. 2011, 11, 2119–2125. [Google Scholar] [CrossRef]
  40. Cherepy, N.J.; Liston, D.B.; Lovejoy, J.A.; Hongmei, D.; Zhang, J.Z. Ultrafast studies of photoexcited electron dynamics in gamma- and alpha-Fe2O3 semiconductor nanoparticles. J. Phys. Chem. B 1998, 102, 770–776. [Google Scholar] [CrossRef]
  41. Kennedy, J.H. Photooxidation of Water at α-Fe2O3 Electrodes. J. Electrochem. Soc. 1978, 125, 709–714. [Google Scholar] [CrossRef]
  42. Vayssieres, L.; Sathe, C.; Butorin, S.M.; Shuh, D.K.; Nordgren, J.; Guo, J.H. One-dimensional quantum-confinement effect in alpha-Fe2O3 ultrafine nanorod arrays. Adv. Mater. 2005, 17, 2320–2323. [Google Scholar] [CrossRef]
  43. Glasscock, J.A.; Barnes, P.R.F.; Plumb, I.C.; Savvides, N. Enhancement of photoelectrochemical hydrogen production from hematite thin films by the introduction of Ti and Si. J. Phys. Chem. C 2007, 111, 16477–16488. [Google Scholar] [CrossRef]
  44. Zhang, Y.; Jiang, S.; Song, W.; Zhou, P.; Ji, H.; Ma, W.; Hao, W.; Chen, C.; Zhao, J. Nonmetal P-doped hematite photoanode with enhanced electron mobility and high water oxidation activity. Energy Environ. Sci. 2015, 8, 1231–1236. [Google Scholar] [CrossRef]
  45. Suryanto, B.H.R.; Wang, Y.; Hocking, R.K.; Adamson, W.; Zhao, C. Overall electrochemical splitting of water at the heterogeneous interface of nickel and iron oxide. Nat. Commun. 2019, 10, 5599. [Google Scholar] [CrossRef]
  46. Malviya, K.D.; Dotan, H.; Shlenkevich, D.; Tsyganok, A.; Mor, H.; Rothschild, A. Systematic comparison of different dopants in thin film hematite (α-Fe2O3) photoanodes for solar water splitting. J. Mater. Chem. A 2016, 4, 3091–3099. [Google Scholar] [CrossRef]
Figure 1. Schematic diagram of α-Fe2O3 photoanode preparation.
Applsci 10 03567 g001
Figure 2. Structural drawing of a three-electrode photoelectrochemical cell.
Applsci 10 03567 g002
Figure 3. X-ray diffraction (XRD) profiles of the samples prepared by aqueous chemical growth: (a) before annealing; (b) after annealing, the (h k l) values of α-Fe2O3 are marked.
Applsci 10 03567 g003
Figure 4. Photograph of the samples obtained from aqueous chemical growth before and after annealing.
Applsci 10 03567 g004
Figure 5. Scanning electron microscope (SEM) images of the samples: (a) precursor β-FeOOH; (b) undoped α-Fe2O3; (c) Co -doped α-Fe2O3; (d) Ni-doped α-Fe2O3.
Applsci 10 03567 g005
Figure 6. Optical absorption features of the α-Fe2O3 nanorod arrays: (a) ultraviolet (UV)–visible absorption spectra; (b) Tauc plots.
Applsci 10 03567 g006
Figure 7. Current-voltage (I-V) plots of the α-Fe2O3 nanorod arrays: (a) Co-doped α-Fe2O3 under solar irradiation; (b) Ni-doped α-Fe2O3 under solar irradiation; (c) undoped α-Fe2O3 under solar irradiation; (d) undoped α-Fe2O3 in dark.
Applsci 10 03567 g007
Figure 8. Mott–Schottky plots of the α-Fe2O3 nanorod arrays.
Applsci 10 03567 g008
Table 1. Photocurrent densities of doped and undoped α-Fe2O3 at a certain potential versus reversible hydrogen electrode (RHE) reported in the literature.
SamplesPhotocurrent (mA/cm2)Potential (V vs. RHE)Reference No.
undoped0.004980.8516
Cr-doped0.009030.8516
undoped0.721.234
S-doped1.421.235
undoped0.581.235
Sn-doped1.541.236
Y-doped0.00220.44230
P-doped31.2344
Sn-doped1.861.2339
undoped0.523017
Undoped0.611.27Present work
Ni-doped0.791.27Present work
Co-doped1.281.27Present work
Table 2. Charge carrier density and flat potential of the α-Fe2O3 samples determined by Mott–Schottky plots.
SamplesSlopeCharge Carrier Density (m−3)Flat-Band Potential Efb (V)
undoped6.04 × 1031.65 × 1025−0.226
Co-doped2.66 × 1033.74 × 1025−0.220
Ni-doped3.98 × 1032.50 × 1025−0.218

