1. Introduction
Combating climate change is one of the five main themes of the Europe 2020 comprehensive strategy [
1], adopted by the European Council in 2010, for smart, sustainable, and inclusive growth. The specific targets of the strategy consider that by 2020, greenhouse gas emissions to be reduced by 20%, 20% of electricity to be covered from renewable sources, and energy efficiency to be improved by 20%. However, the European Commission modified the targets set at the European Union (EU) level according to the document “Towards a Sustainable Europe by 2030” [
2]. These targets refer to ensure at least 32% of the total energy consumption from renewable sources and energy efficiency of at least 32.5% in 2030, which will lead to exceeding the commitments made in within the framework of the Paris Agreement on climate change concerning to the reducing greenhouse gas emissions by at least 40% by 2030 compared to 1990 levels. If for the 2020 targets on greenhouse gas emissions and renewable energy, the EU is on track to achieve the target on the energy efficiency that may not be reached [
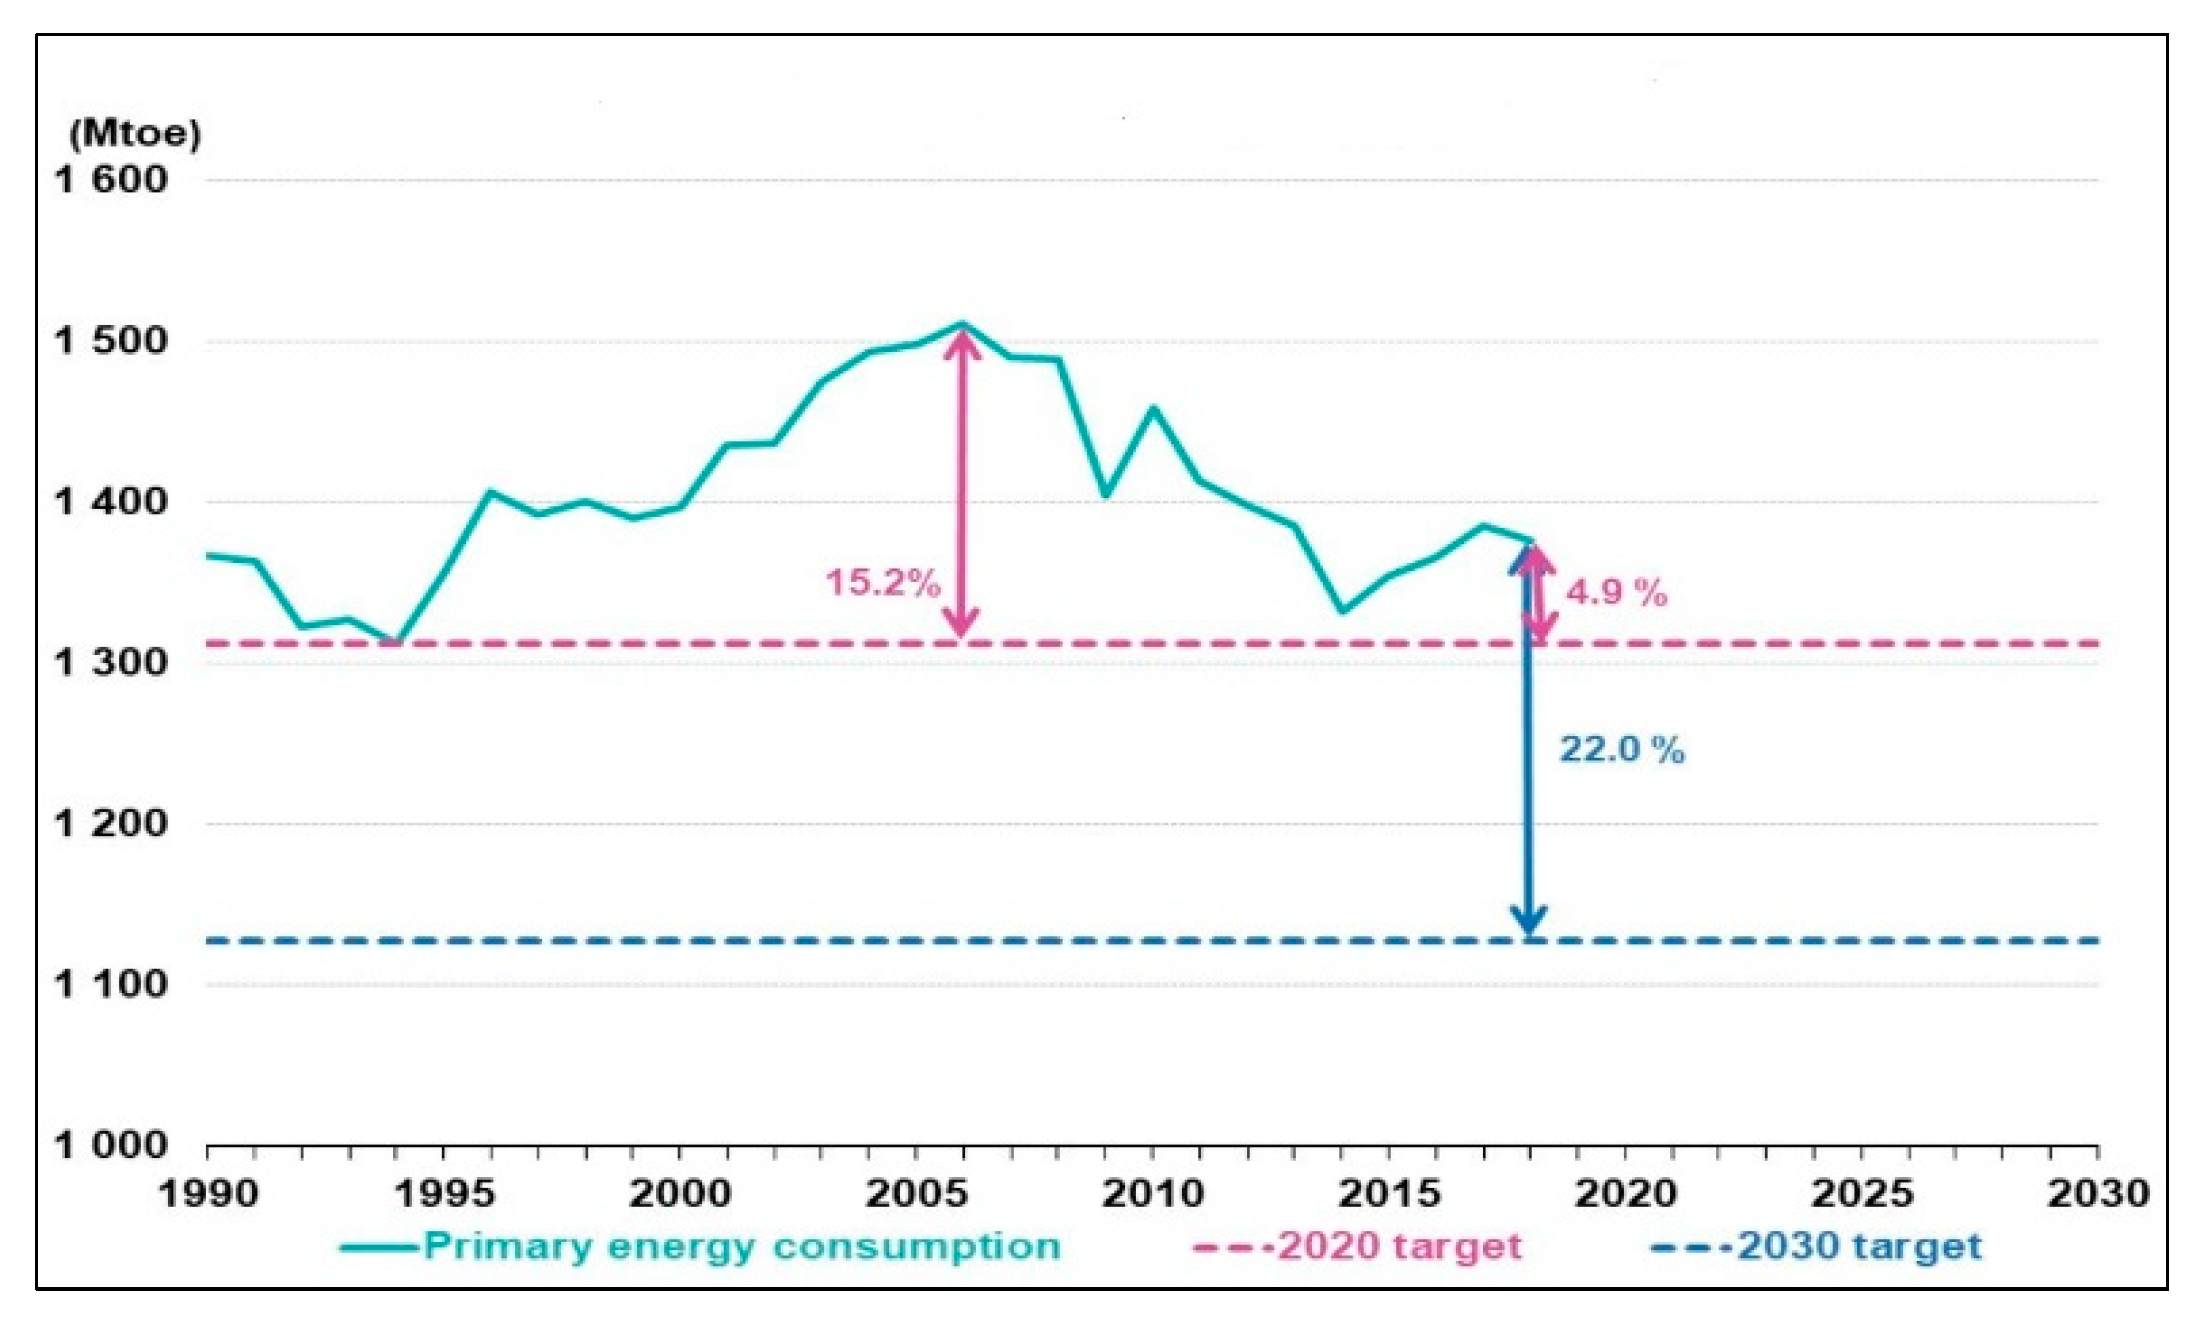
3]. On 4 February 2020, Eurostat published a document [
4] which stipulates that in 2018, the primary energy consumption in the EU was 4.9% above the efficiency target for 2020 and 22.0% away from the 2030 target, see
Figure 1 adapted from [
4]. It can highlight that since 1990, the primary energy consumption had a high variation between a maximum value recorded in 2006, with a gap by 15.2% from the 2020 target, and a minimum value recorded in 2014, representing a difference of 1.5% from the 2020 target.
In December 2018, in the Official Journal of the European Union (L328), three normative acts related to the “Clean Energy for All Europeans” legislative package, with effect on 24 December 2018, were published. EU Directive 2018/2002 on energy efficiency establishes a common framework for measures to promote energy efficiency throughout the Union, to ensure that its main objectives are reached at least 32.5% by 2030 and to pave the way for future efficiency gains energy after this data [
5]. The European Energy Regulatory Authorities supports the small and medium enterprises (SMEs) to use energy efficiently, including through special schemes, in compliance with state aid regulations. The support schemes for SMEs were established, including, if they have entered into voluntary agreements, to cover the costs of an energy audit and the implementation of cost-effective recommendations made in the following energy audits [
6]. The EU Directive 27/2012 on energy efficiency [
7] represents the base through which the small and medium enterprises (SMEs) are encouraged to participate in the energy audit programs. However, the SMEs have no obligation to follow energy auditing programs, although Article 8 of this Directive stipulates that “the Member States must develop programs that encourage SMEs to undergo energy audits and to subsequently implement the recommendations from these audits”. Moreover, “the member States may establish aid schemes for SMEs, including where voluntary agreements have been concluded, to cover the costs of an energy audit and the recommendations of energy audits, the costs involved being high, if it is decided to implement the proposed measures” [
7].
In this context, many industrial consumers become actively interested in the implementation of measures to reduce energy consumption because the energy efficiency is not only a tool to save money and resources but also a need for flexible adaptation to own needs.
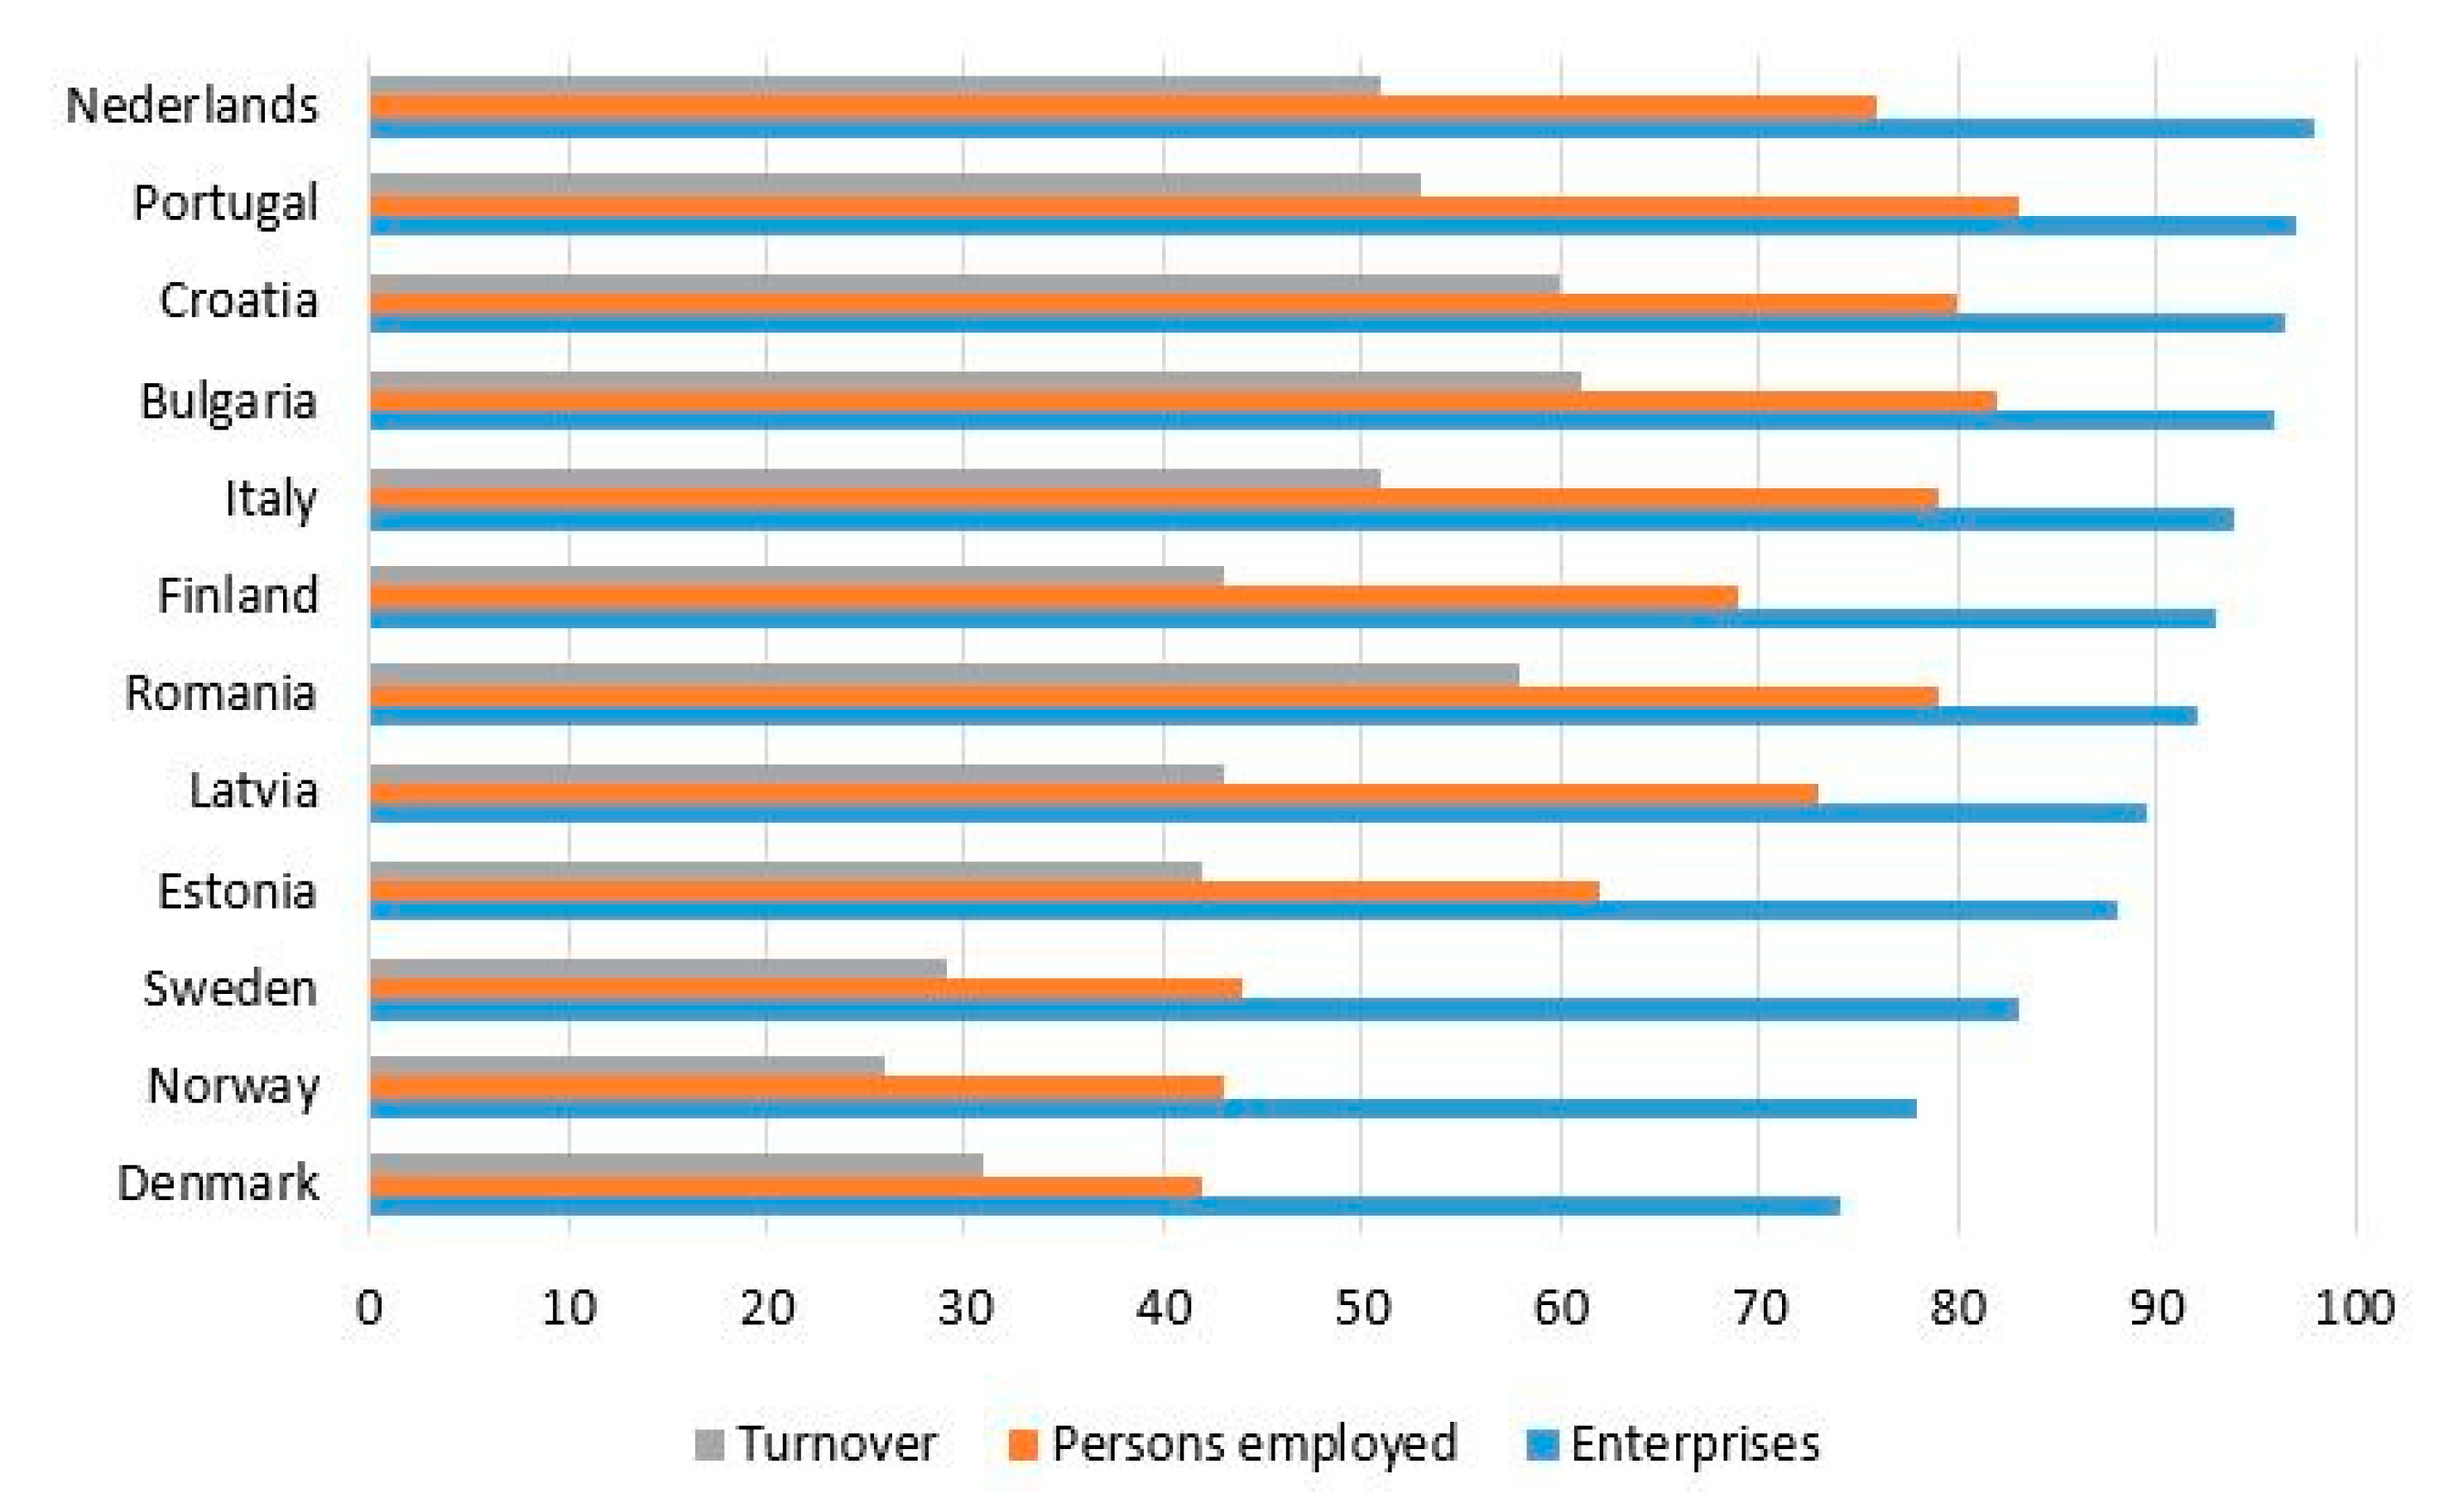
Supporting SMEs and the promotion of energy efficiency measures are essential for economic progress because about 23 million European SMEs represent 98% of the total number of businesses. The majority of SMEs are microenterprises with less than 10 people, having an annual turnover of up to 2 million euros [
8]. The share of SMEs with less than 250 persons is very high, approximately 99.79, see
Table 1 and
Figure 2 [
9].
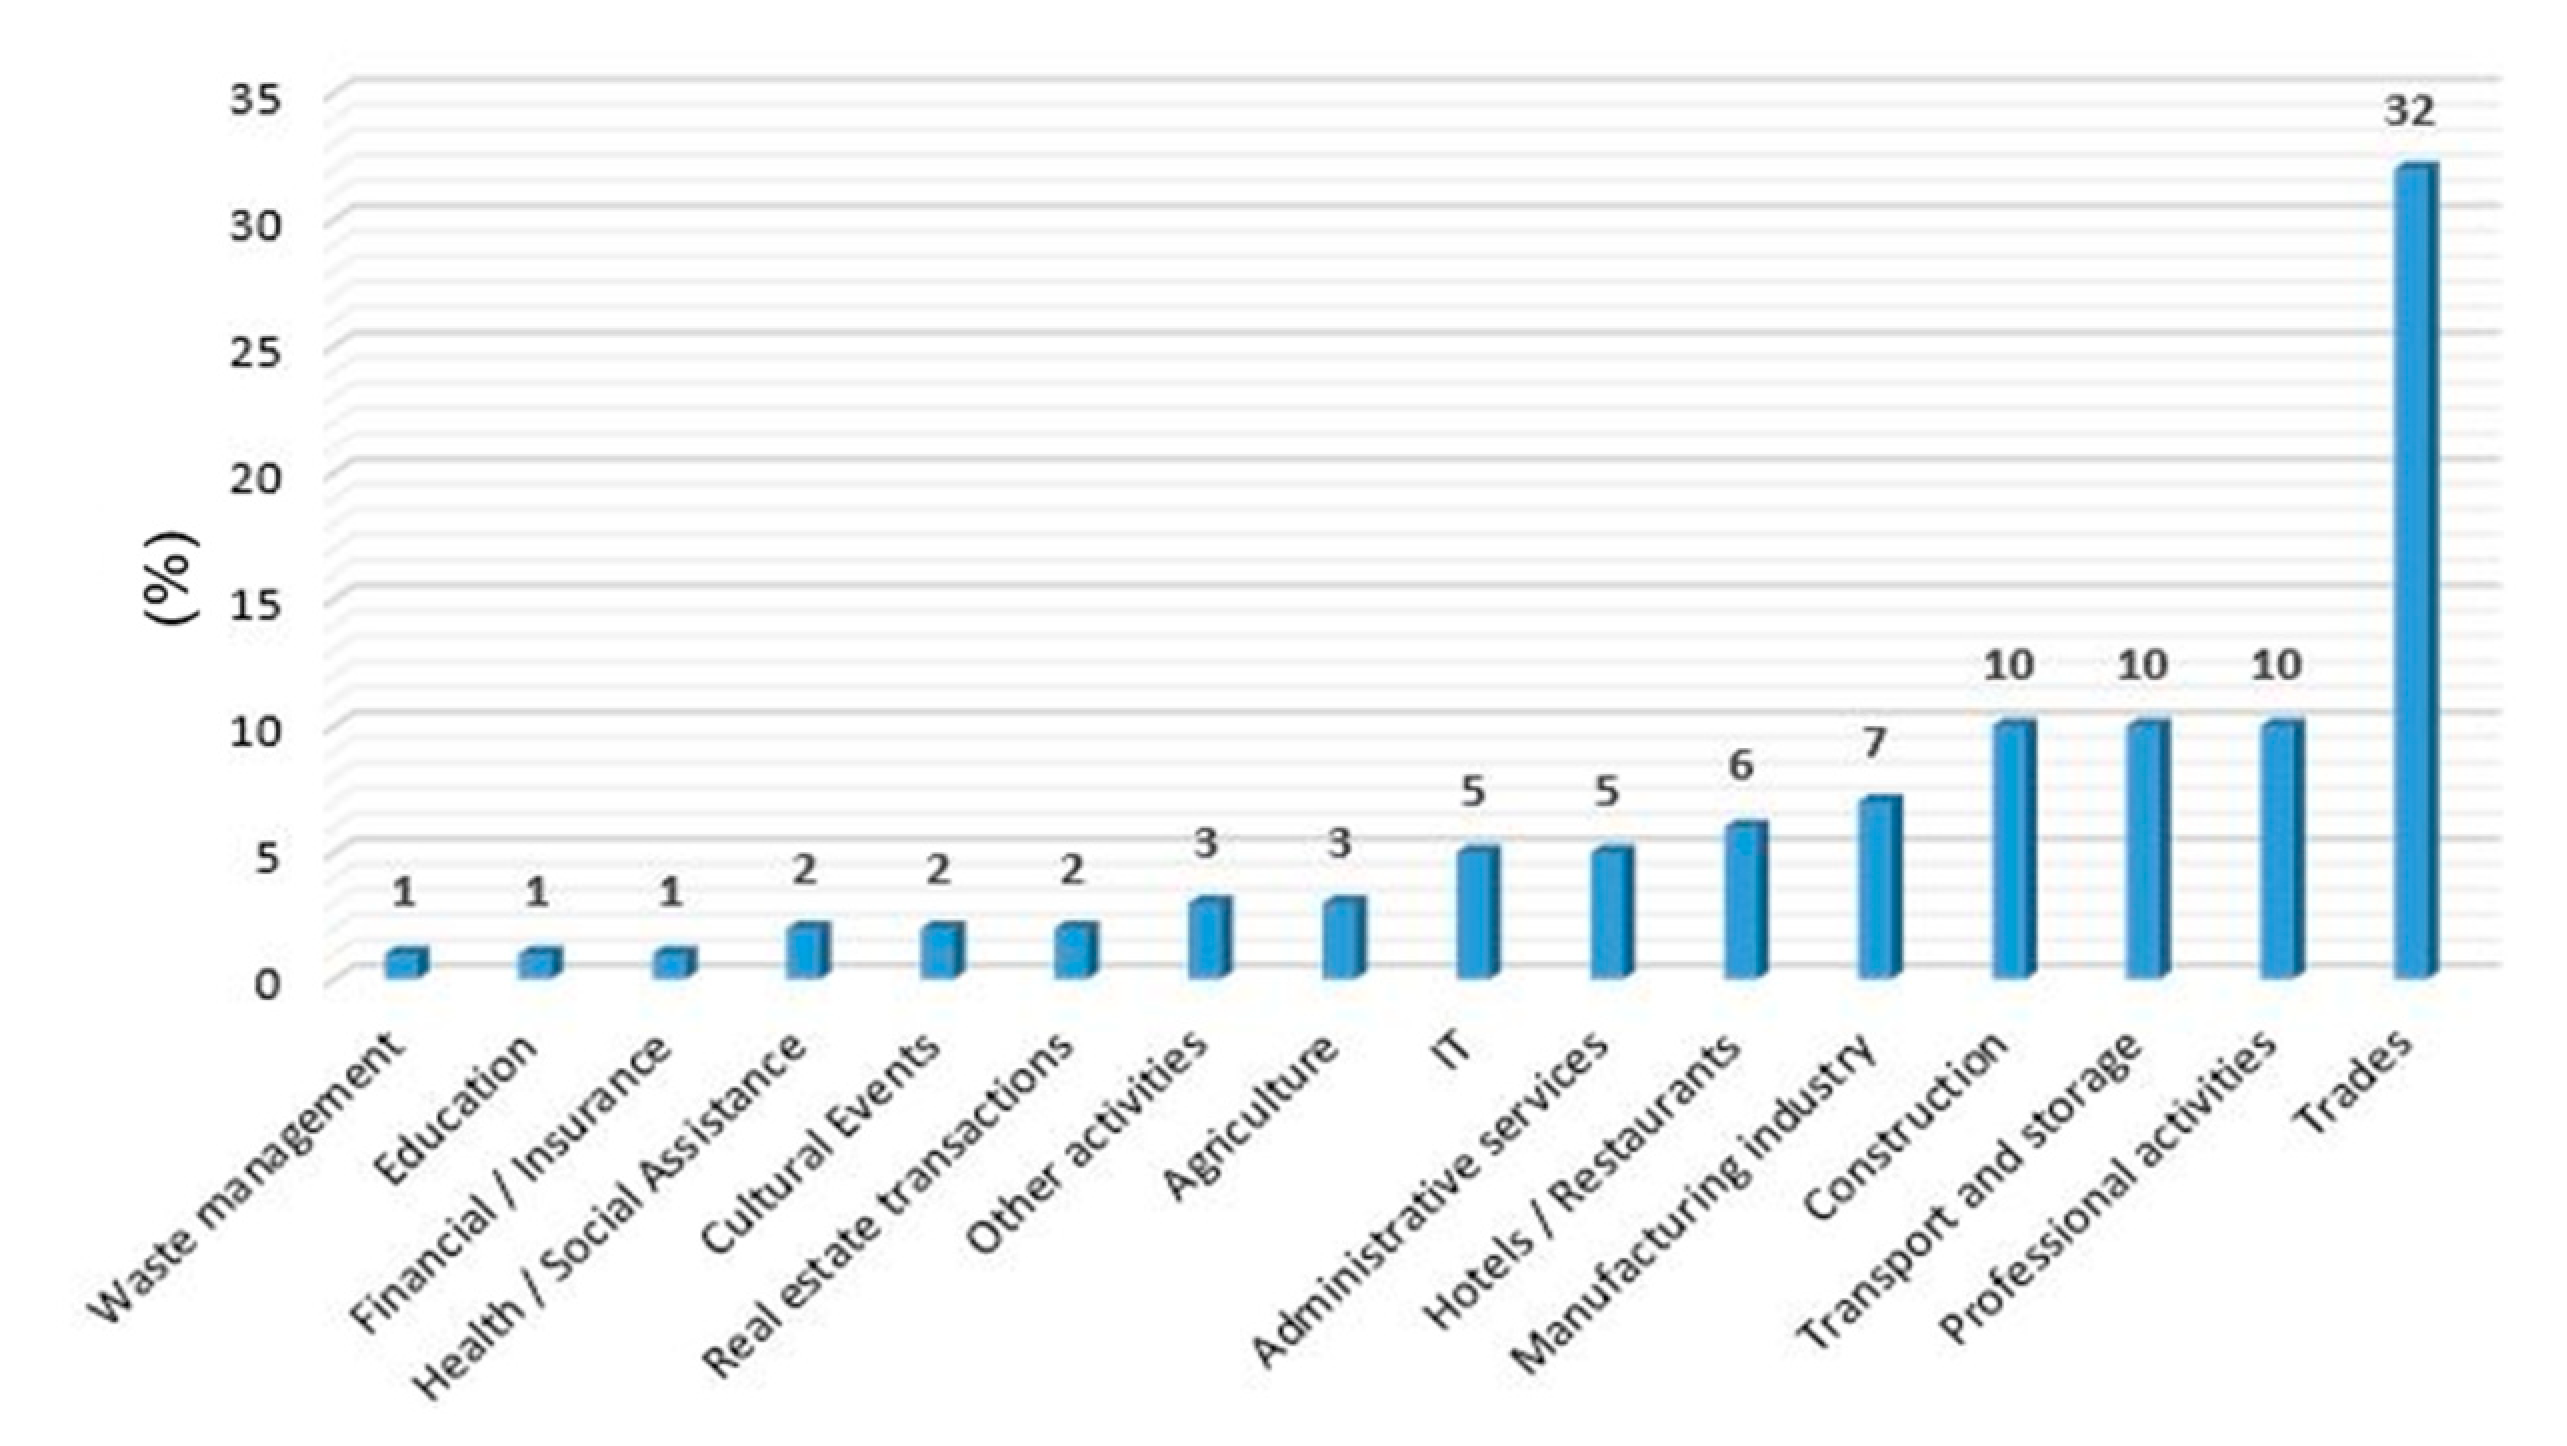
Most activities of the SMEs are in the following fields: trade/repair of vehicles and motorcycles (32%), professional/scientific/technical (10%), transport and storage (10%), construction and manufacturing (10%), and others (38%), see
Figure 3.
In these conditions, SMEs represent one of the biggest potentials of energy saving, not fully exploited at present. The modern technologies available today, regarding the monitoring and control tools of energy consumption, have the potential to save at least 40% of energy consumption. The analyses have highlighted the significant energy savings, available at each point of the consumption chain if energy efficiency measures are implemented. Only one SME can save an amount of electricity equivalent to that of 1000 private houses [
8]. In the case of investments, there are hidden costs whose share can be quite high for SMEs. Thus, for the large industrial consumers, energy efficiency measures require investments and resources. Their application could reduce the energy consumption with a certain percent, which is recovered with a very high probability because the energy bill is of thousands of euros. However, the allocation of financial resources is very difficult in the case of the SMEs due to the investments, which should lead to saving energy with a similar percent. Thus, the recovery must do from the benefits of energy saving, this being several hundred euros in most cases. In these conditions, more SMEs cannot allocate financial resources to purchase equipment or services [
9,
10].
Another aspect encountered in the case of many SMEs refers to the fact that there is not a relationship between the energy department, which takes care of the operation and maintenance of equipment and installations and the financial department, which pays the energy bills. In this case, there are no bonuses from the management staff to encourage the employees to save energy, this being a fixed component, without paying much attention, in the final cost of the final products, without the energy department to be responsible for it [
11].
In addition, it is important to know whether SMEs are showing interest or make certain efforts to apply current management standards or moreover, how many of the SMEs seek to meet the requirements of an integrated management system. Most of the SMEs have implemented the following management systems: Quality Management System (ISO 9001), Environmental Management System (ISO 14001), and Health and Safety Management System (ISO OHSAS 18001) [
12]. Regarding the Energy Management System ISO 50001 [
13], published in 2018, it does not define the specific performance criteria associated with the SMEs’ energy consumption and energy efficiency. Instead, a management model is proposed to influence the development and implementation of energy policy to achieve the targets and action plans, considering both legislation and information from the analysis and management of energy consumption. The standard describes the final target, but not how it can be achieved, and does not allow SMEs to understand clearly its position on the process to achieve this final target. Implementation of the ISO 50001 system alone is not enough for the SMEs, because it is necessary to follow the consumption indicators with the purpose of rational energy utilization, to fulfil the targets of the management system efficiency. Thus, the production planning based on an efficient energy use strategy, following ISO 50001, should consider monitoring the energy consumption and measures for increasing the energy efficiency.
In these conditions, SMEs have needed software products to monitor and control the consumption and to identify solutions that allow the adoption of measures to increase energy efficiency.
Thus, a decision support platform is proposed, having the modules with characteristics that differentiate it and offer more advantages compared to the other approaches which treated the energy management at the SMEs, whatever the industrial activity branch:
- (i)
The data management module is based on the data mining technique that extracts the technical details on energy consumptions used to develop production scheduling strategies. It allows the analysis of large size databases regarding the daily, monthly, and yearly energy consumption or technical and operating characteristics for equipment and installations. In addition, it ensures the interface between the application modules, having a query that follows the correlation between energy consumption, economic indicators (the turnover, production value, personnel costs, and total purchases with goods and services), and costs.
- (ii)
The profiling module integrates an original approach based on clustering techniques to determine the typical energy consumption profiles (TECPs) assigned to different activities necessary for establishing the type of tariffs that will lead to the reduction of energy bills and optimal planning of the activities.
- (iii)
The forecasting module contains a new approach that uses an expert system based on the rules If-Then to forecast the energy consumption of each installation and equipment. The total energy consumption at the SME level is obtained through the aggregated process of all individual energy consumptions associated with each equipment and installation.
- (iv)
The production scheduling module includes a novel approach based on the combinatorial optimization for daily consumption programming, which uses a fast searching algorithm to find the optimal solutions in the admissible set. The algorithm uses the status (on or off), type (programmable or non-programmable), working period, the number of operating cycles, and dependence (within the activities) of the equipment and installations as input data, determining the optimal solutions regarding the flattening of daily energy consumption profile with the benefits on the cost of energy bills.
The remainder of the paper is structured as follows.
Section 2 presents a review on the treated topic highlighting the advantages of the proposed decision support platform.
Section 3 details the characteristics of the developed decision support platform, highlighting the advantages of the proposed approaches inside of each module. The obtained results in testing of the platform at a small enterprise, from a representative field (the trade and repair of vehicles), are presented in
Section 4.
Section 5 highlights the conclusions and future works.
2. Literature Review
The various approaches were developed by companies in software applications for the management and analysis of energy consumption.
The software application developed in [
14] allows the management, analysis, and control of energy consumption. Some disadvantages can be highlighted: an optimal consumption programming module according to the equipment and installations for an analysis contour is not developed, the forecasting module is missing, and the application domain is only for the large industrial consumers. The software tool developed in [
15] allows, also, the management of energy consumption at large industrial consumers, without the forecasting and optimal production scheduling modules. The software product [
16] has implemented energy consumption control and forecasting modules. The disadvantage refers to the fact that it only does short-term forecasting of the consumption, without considering the medium- or long-term forecasting. The software solution presented in [
17] allows the acquisition, monitoring, management, and analysis of all types of consumption. The data analysis is presented for different consumption points, in tabular form, graphical representations, or brief reports, respectively maps. The disadvantages refer to the lack of energy consumption forecasting and the optimal scheduling modules. The solution identified in [
18] envisages a software tool that allows management based on the energy balances for industrial consumers. The measures with major investments are proposed, without a deeper analysis of energy consumption, forecasting, and production scheduling. A management solution, which considers the analysis and control of the energy consumptions, is developed in [
19], but with a lack of the consumption forecasting and production scheduling modules to obtain a streamline of the technological process and reducing the costs at the energy bills.
In addition, there are the patented approaches and systems for energy management. An energy management system applied to the large industrial consumers, which offers a complete knowledge of the energy consumption corresponding to their installations, is presented in the reference [
20]. The system consists of two modules to analyse energy consumption and communicate with data acquisition points. However, it does not include energy efficiency modules based on energy consumption forecasting and production scheduling. Another system is developed in [
21] to schedule the equipment to work at certain time intervals when the energy tariff is low. The energy storage system uses batteries and alternative energy sources that work to sell electricity to the distribution network operator during certain periods in favourable cost conditions. However, this system refers strictly to residential consumers and office buildings that have available renewable sources and storage units.
In addition, regarding software tools based on the statistical processing of input data and classical forecasting and optimization methods, there are researches carried out within European projects to propose new innovative approaches and methodologies. The main targets are to develop decision-making strategies to fulfil European goals regarding energy efficiency. The project “A holistic framework for supporting SMEs in increasing energy efficiency—SMEmPower Efficiency” [
22] focuses on increasing the energy savings in SMEs, being involved in eight countries from the main geographical regions of Europe: West (Spain), Central (Germany), South (Italy), North (Great Britain), and Eastern and Southern Europe (Romania, Slovenia, Greece, and Cyprus). The project supposes the development of the tools referring to a web platform for energy analysis, a tool for monitoring, and an instrument for measurement and verification. The SME Program for Energy Efficiency through Delivery and Implementation of the Energy Audits (SPEEDIER) program, a European project in the H2020 framework program, was officially launched on June 18 and 19, 2019. The project aims to address the obstacles encountered by SMEs in terms of expertise and resources when conducting energy audits and implementing recommended energy-saving measures [
23].
In addition to research in projects, patents, and decision-making software products, there are also approaches published in journals and conferences that offer solutions for increasing energy efficiency at the SMEs. A comprehensive presentation on energy management for SMEs based on automatic meter reading (AMR) systems and an energy manager, which applies the energy efficiency recommendations, is done in [
24]. The paper considers that the AMR system is not available to SMEs and the classical meters are read only annually or quarterly. The authors consider in [
25] that a rational decision-making process (DMP) based on a databases management (DBM) is imperative for a real application of energy efficiency measures, which should also consider a schedule and optimization steps (SOS). Two typical load profiles for SME energy demand are found in [
26] using a Smart Meter database, one for operation process, which includes the peak load, and other for the inactivity time. The two forecasted load profiles are improved using a Gaussian mixture technique. The E-learning platform presented in [
27] contains practical tools for energy efficiency improvement on the SMEs’ level.
On the other hand, some studies propose various approaches to minimize energy consumption. Some studies consider that a successful key for energy efficiency programs is the outreach of all SMEs personal: staff, employees, customers, guests [
28], or energy audits [
29,
30]. However, the optimization of the operating parameters represents a no-cost strategy which can be implemented by SMEs to achieve real energy efficiency [
31,
32]. The various barriers encountered in increasing the SMEs’ energy efficiency were investigated in [
33,
34,
35,
36]. Thus, six most important barriers were identified in [
33] for the SMEs belonging to the ferrous material industry, namely, the government energy policy, the financial-economic problem, the managerial-organizational process, the technological factors, the quality of the workforce, the raw material, and the used fuel. The barriers are linked because they are interdependent. According to [
36], the main drawback consists of restricted access to capital corroborated with a lack of information and low priority.
One way to develop a plan to improve energy efficiency (PIEE) is the use of new approaches and modern technologies to minimize energy consumption [
37]. This PIEE should also be a priority for the SMEs [
38]. Reorganization of production, modernization of technologies, and introduction of efficient equipment lead to the growth of industrial production. With the inclusion of these measures in the SMEs’ sector, the reduction of consumed resources and energy, simultaneous with decreasing the cost, will appear. Optimal management of SMEs implies the aspects of the energy efficiency and environmental investments, with results on the increase of energy savings and reduction of greenhouse gas (GHG) emissions [
39,
40,
41]. The energy management methodology adapted to each SMEs proposed in [
42] is focused on the individual level of a triggering practice to increase energy efficiency. In this context, internal capabilities were used as a minimal resource required for energy management implementation.
Evidence of the high economic potential was highlighted in the case of active energy management in SMEs [
43,
44] and the implementation of a barrier’s taxonomy regarding the adoption of energy-efficiency measures [
45]. In addition, recent studies concluded that increasing energy efficiency could use the lean management concept at the SMEs level [
46,
47,
48]. The lean refers to create more value for consumers with fewer resources [
46]. Besides this concept, the intelligent energy management concept was also applied to buildings in the last period [
49,
50,
51]. A detailed review of the studies that developed data-driven building energy consumption prediction models based on the intelligent algorithms (machine learning) is presented in [
51].
A brief description of the literature is presented in
Table 2 to highlight the advantage of our new vision on energy consumption management, proposed as an advanced decision support platform, with technical and economic benefits on increasing energy efficiency.
It should be emphasized that there are, also, other references which solved the problem of optimal management, but their proposed approaches are similar to those presented in the table.
3. The Structure of the Decision Support Platform
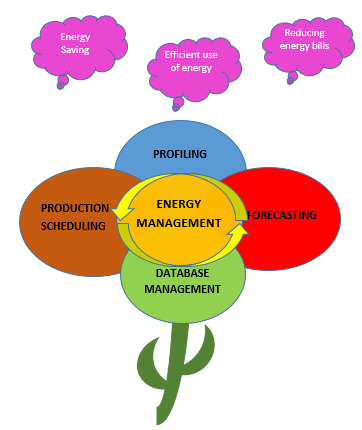
Four interdependent modules associated with the steps used in an efficient management process are integrated into the platform, see
Figure 4.
The platform has applicability in the process of monitoring, control, and optimization of energy consumption, respectively cost reduction; it has the following features associated with efficient energy management: description and characterization of the SME through the characteristics of energy consumption by categories of industrial consumers, regardless of the field of activity of SMEs; the establishment of the correlations between energy consumptions, respectively consumption patterns; profiling and forecasting of energy consumption; and optimal production scheduling for flattening the energy consumption profile.
The platform allows the SME to manage the development of technological processes. Thus, the platform ensures the continuity of the technological processes, helping the SMEs to save money for useless updates. On the other hand, because the industrial processes are never static, the platform was built also to be adaptable. If the SMEs will adopt modern technologies and develop new processes to maintain their activity, the integration will be done easily in the database of the platform for new equipment and installations. Not least, the platform offers exclusive solutions, namely, what works for one SME may not work for the other.
Artificial intelligence-based techniques were proposed inside each module of the platform to understand the evolution and trend of energy consumption and identify solutions which minimize the impact of the energy bills: The data management module is based on the data mining technique that extracts the technical details on energy consumptions used to develop production scheduling strategies; The profiling module integrates an original approach based on clustering techniques to determine the typical energy consumption profiles assigned to different activities; The forecasting module contains a new approach that uses an expert system to forecast the total energy consumption at the SME level; and The production scheduling module includes a novel approach based on the combinatorial optimization for daily consumption programming and determining the optimal solutions regarding the flattening of daily energy consumption profile with the benefits on the cost of energy bills.
All modules use procedures that allow the interaction between them, ensuring the communication of information and the synchronization of executions, to assist the Decision-Maker in the identification of the optimal solutions associated with an efficient management process. Details on each module are presented in the following subsections.
3.1. The Database
The database contains files with energy consumptions, costs from energy bills, equipment and installations associated with the technological flows from the SME, and economic indicators.
The working modules (consumption and cost analysis module, profiling module, forecasting module, and production scheduling module) of the platform will upload the data sequences stored in the files with a matrix structure.
If the SME has a smart meter with the data communication unit, then the energy consumption file includes fields associated with the calendar data (year, month, day from the month, and day from the week), representing the first four columns, and the energy consumptions (the following columns). The indices from 1 (January) to 12 (December) identify the months and from 1 (Monday) to 7 (Sunday) for the day from the week. Depending on the sampling step,
m, (a quarter-hour, half-hour, and hour), the number of columns associated with the energy consumption can be 96, 48, and 24. All these data are accessed by all working modules from the matrix
DW, having the size (
NW ×
(4+m)), where
NW represents the number of records identified through days and
m = {24, 48, 96}. A sequence from the energy consumption file, where
m = 24, is presented in
Figure 5.
The file has a different structure when the SME has a classic meter installed, containing only the calendar data and the daily energy consumption (which it reads at the end of working schedule the operating staff), such that the matrix DW has the size (NW × 5).
The file energy costs include records associated with the calendar data (year and month) and the energy costs introduced in the database from the monthly bills. These costs are assigned to the monthly energy consumptions resulted from the aggregation of daily energy consumptions associated with the billed month. The same indices from 1 (January) to 12 (December) identify the months. All these data are accessed by the working modules from the matrix DC, having the size (NC × 3), where NC represents the number of records identified through months.
The file with the technical characteristics comprises the fields regarding the name of equipment or installations, rated power, and the number of working times. The number of fields for the working times will result after analysis of all operating regimes corresponding to each equipment and installation based on some detailed measurements, using the sampling steps with as small as possible size (1 or 5 s) to identify the working times with high accuracy. After this step, this file can be completed, and the data are accessed from the matrix DE, having the size (NE × R), where NE represents the number of records identified through equipment and installations associated with the activities of technological flows and R is the number of columns which can be different from one SME to another. The first two columns refer to equipment or installations and their rated power. The number of the next columns will result after the classification in categories of the working times associated with the operating regimes of equipment or installations.
The file with the economic indicators comprises the fields regarding the turnover, production value, personnel costs, and total purchases with goods and services. All these data are accessed from the matrix DI, having the size (NI × 4), where NI represents the number of records identified through mouths. This file can be optional inside the platform.
3.2. The Consumption and Cost Analysis Module
Decision-making implies the need to know the activities within the technological flow of an SME. The role of this module is to translate the user’s queries into an optimized framework so that the Decision-Maker obtains the information about the energy consumptions over the requested period (year, month, week, and day), the energy costs, and evolution of the economic factors.
The analysis can be done on years, months, or days, choosing an analysed period. A period between 2 months (e.g., January and February) or a single month, for one or more years, can be used in the monthly analysis. The days (all, working, or weekend) from the same month, but different years or different months from the same year, can be selected to be used in the daily analysis. The data are uploaded from the energy consumption file.
The module presents the results through the graphical representations of the variables (energy consumption, energy cost, or economic indicators) or the statistical parameters calculated over the analysed period.
The statistical parameters refer to:
The Decision-Maker will analyse the characteristics of the first quintile with the lowest energy consumption and the fourth quintile with the highest energy consumption.
3.3. The Profiling Module
3.3.1. Working Assumptions
The module contains an original clustering-based method to estimate the typical energy consumption profiles. Different sampling steps (a quarter-hour, half-hour, or hour), which lead to 96, 48, or 24 values of energy consumption, depending on the setting of the smart meter installed to each SME, can characterize the daily energy consumption profiles. The assumption related to the approximation of hourly consumption was adopted in the profiling process for energy consumption [
52]. According to this assumption, the energy consumption characteristics are unknown, but the TECPs can be used. This situation is encountered at the small consumers from the category of micro, small, and medium-sized enterprises, which absorbs a maximum power up to 100 kW. The shape of these profiles is also influenced by season, the category of equipment or installations, and the activity type [
52]. However, a high number of energy consumption profiles can create complex issues in the identification of the consumption patterns.
The proposed method can arrange the energy consumption profiles in representative groups (consumption patterns), based on certain similarities. A typical energy consumption profile (TECP) will correspond to each consumption pattern, such that each SME can have one or more TECPs, depending on the activity type (e.g., small, medium, and high).
3.3.2. Clustering-Based Method in Profiling Process
Clustering represents a special process to group the data recorded in the matrix
DW on the columns associated with the energy consumptions given by the sampling step (24, 48, or 96), represented by
p daily profiles introduced as vectors
Wixm,
i = 1, …,
p,
m = {24, 48, 96}. If all energy consumption profiles from matrix
DW are considered, then
p =
NW.
The vectors associated with the energy consumption profiles Wi, i = 1, …, p, m = {24, 48, 96}, are merged into different clusters, according to the distance calculated between each of them. Finally, one or more clusters (also called groups, patterns, models, classes, or categories) will be obtained in function by the spatial location of the characteristics of vectors Wi, i = 1,…, p. The characteristics of vectors will be closer to the common centre of the cluster they belong, compared to centres of other clusters.
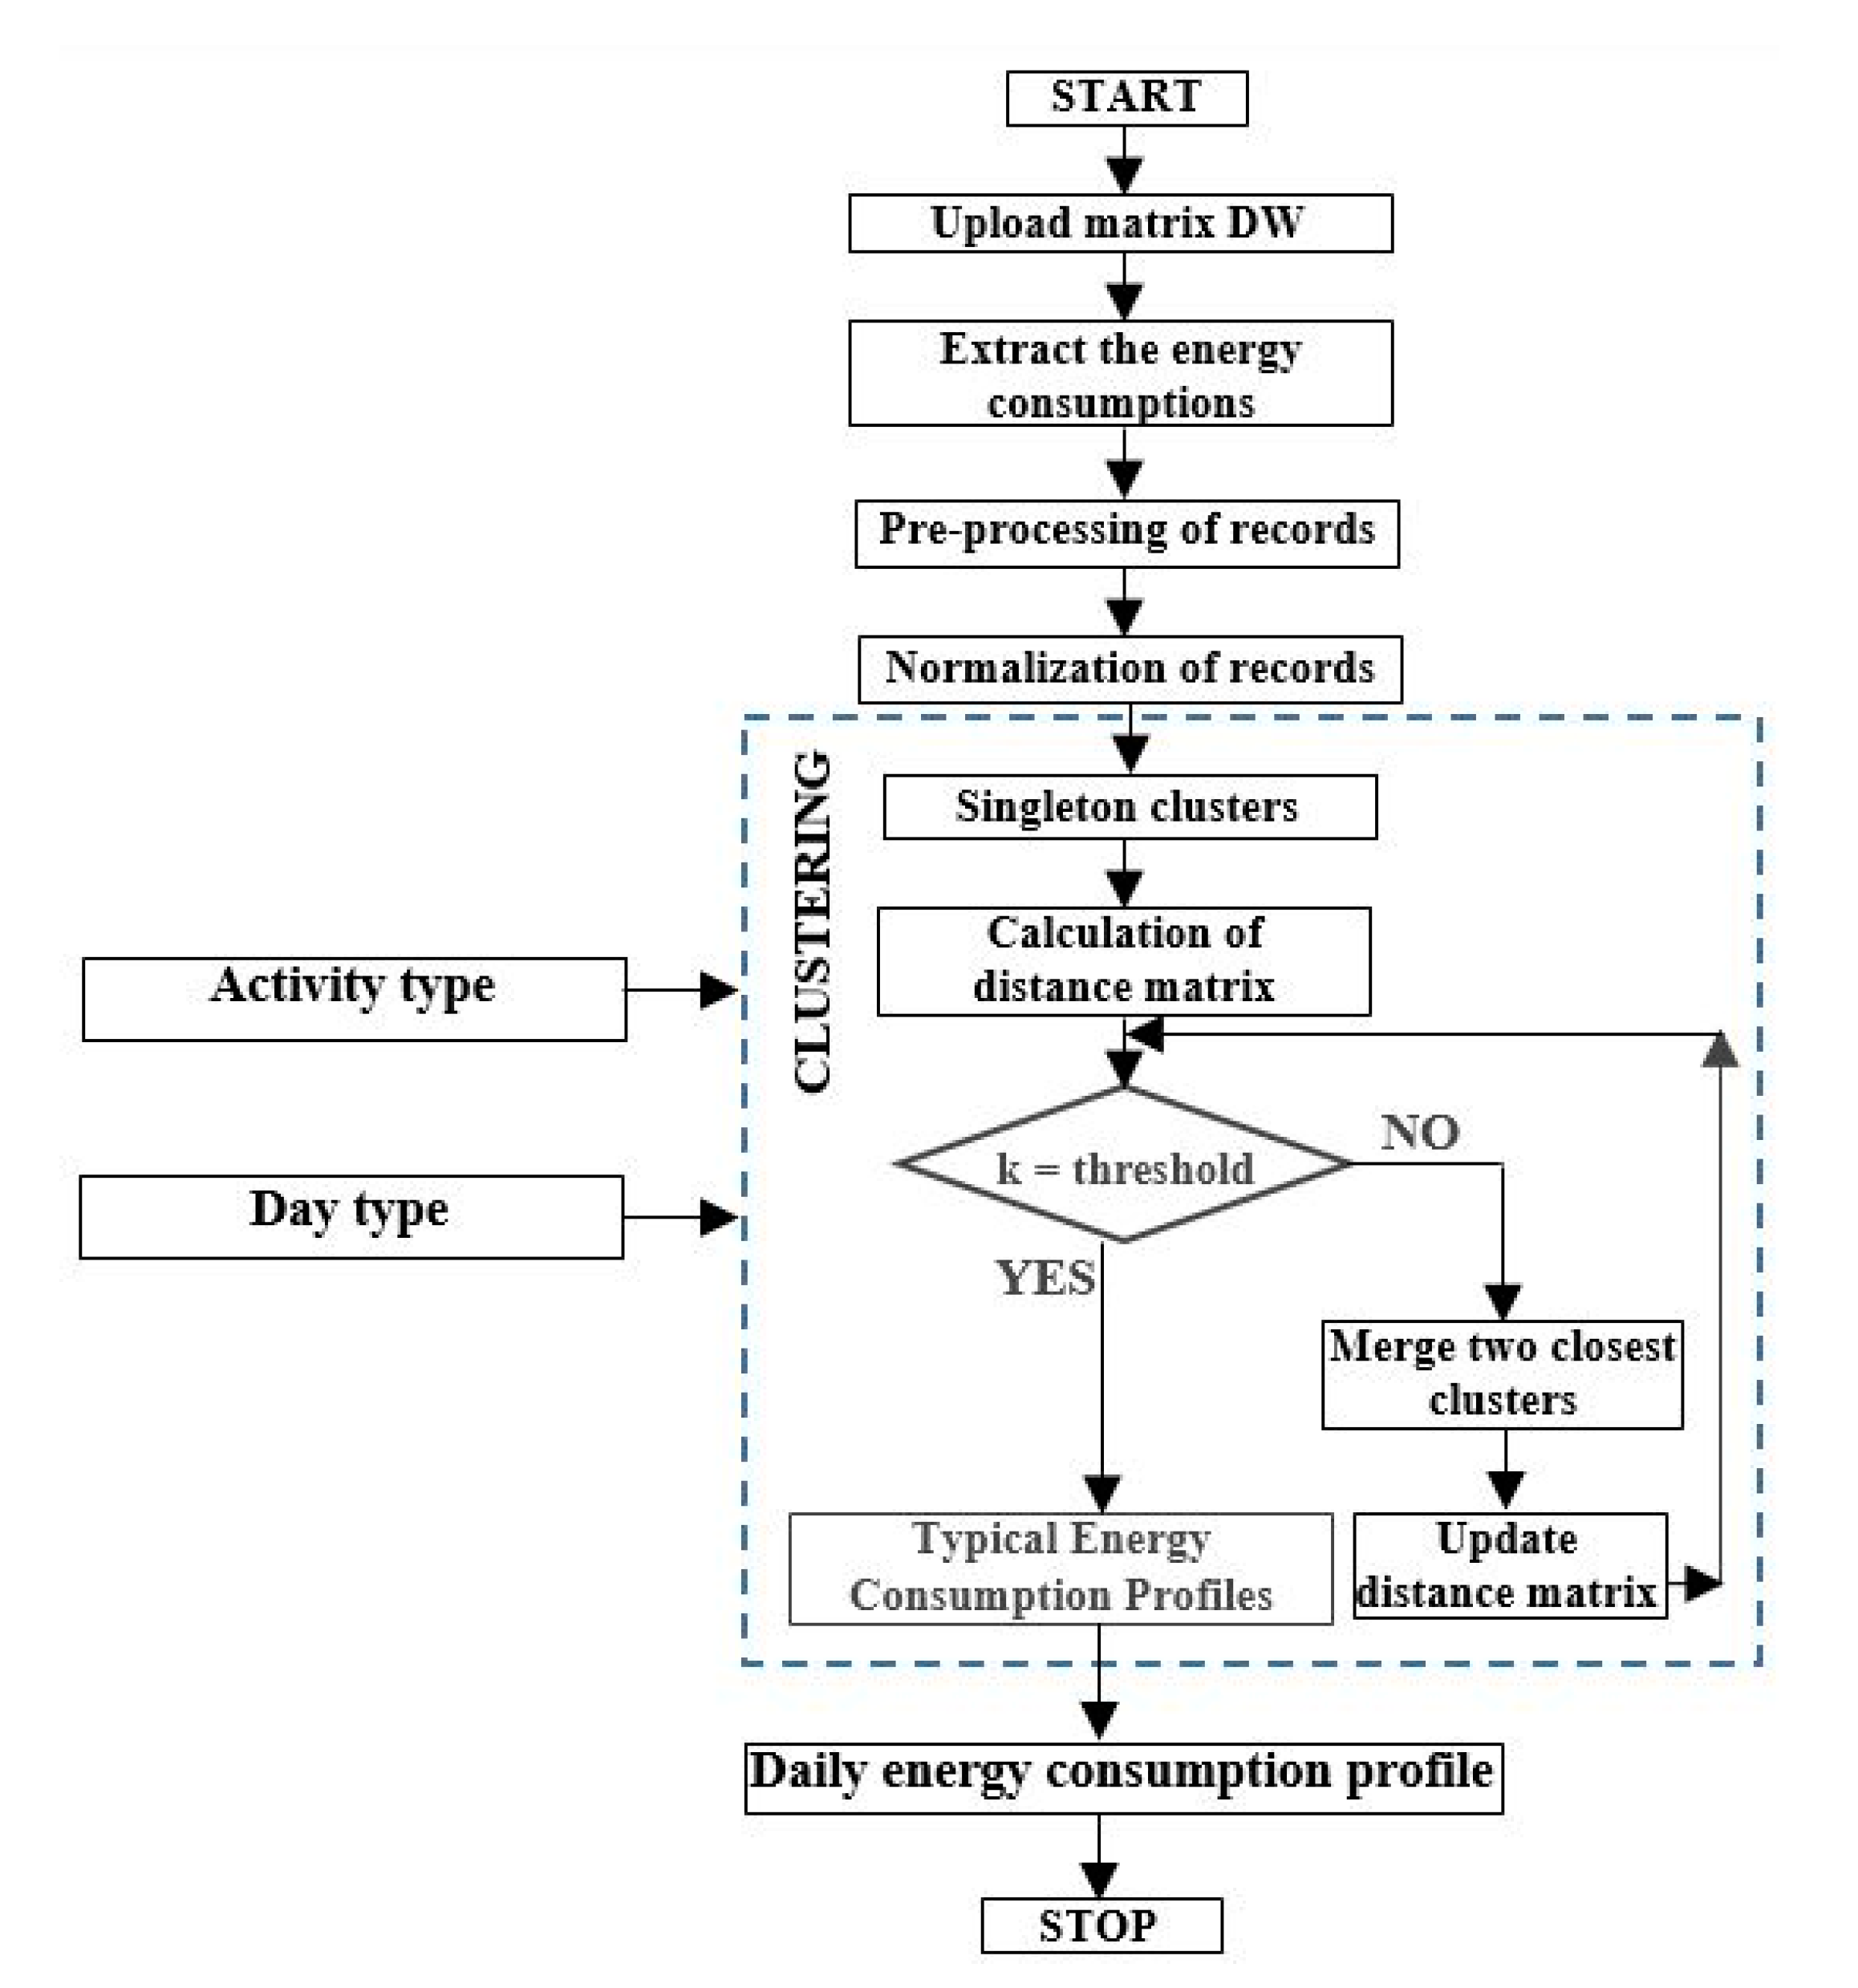
The stages of the clustering process are shown in
Figure 6.
Extract the energy consumptions from matrix DW: It refers to values the energy consumption from the columns of matrix DW subject to the clustering process and recorded in the vectors Wi, i = 1, …, p.
Data preprocessing: Due to various random factors, the energy consumption profiles can contain abnormal, deviation, unrepresentative, noisy, strange, anomalous, or missing data. It is very important to detect and repair or eliminate the anomalous or abnormal values before the use of the energy consumption profile in the profiling process. A statistic-based data mining technique is applied to solve these problems [
53].
Data normalization: The normalization process uses the hourly values of energy consumption from each vector
Wi, i = 1, …, p, a suitable normalizing factor represented by the average consumption, the maximum value of consumption, or the total energy consumption over the analysed period. This process is mandatory because all data must be brought in the range [0, 1] in the clustering process.
where
—normalized value of the energy consumption
j from the record
i,
wij—the energy consumption
j from the record
i, and
—the energy consumption over the analysed period, identical with working schedule.
The clustering process: The clustering process can be carried out in several ways, depending on the methods chosen by the Decision-Maker. Inside of each method, a distance is chosen to determine the similarity between vectors
Wi,
i = 1, …,
p, associated with the energy consumption profiles. Many measurement systems use different distances in the clustering process, but from them, the Euclidean distance is the most used. Thus, the distance, in the case of two vectors W
r and
Ws, is calculated with the relation:
All clustering methods should lead, in principle, to representative clusters, indifferently by the input data. There are cases when these clusters could not be obtained. Using another method represent an alternative to obtain better results than previous cases to identify a solution. The quality of the results can be the best when the separation of the elements leads to the well-defined clusters or less good when a membership degree to one of the clusters is associated.
Extraction of TECPs: A TECP will be assigned to each cluster, calculated as the mean of normalized energy consumptions associated with each profile.
where
Ck is the number of clusters resulted from the clustering process;
represents the mean normalized value
j of the energy consumption associated with the TECP corresponding to the cluster
k,
k = 1, …,
Ck;
l is the index of the energy consumption profiles, from the matrix
W, associated with the cluster
k in the clustering process; and
Nk is the number of the energy consumption profiles associated with the cluster
k in the clustering process.
The representativeness of the mean can be evaluated based on the variation coefficient:
where
υj,k is the variation coefficient which indicated the confidence degree in the mean and
σj,k represents the standard deviation for the normalized energy consumption
j associated with the TECP corresponding to the cluster
k.
A value very close to 0 of υj,k leads to a high confidence degree in the mean, which means that the clusters are very representative and homogenous.
3.4. Forecasting Consumption Module
At the level of industrial consumers, mainly SMEs, energy consumption forecasting provides the primary information in decision-making regarding the optimal planning of activities associated with the technological flows. Thus, energy consumption forecasting must use historical data recorded in the long periods and processed appropriately. If the number of records is small, then the estimation errors can be high and can lead to additional operating or investment costs. On the other hand, energy consumption forecasting plays an important role in the development of economic strategies for SMEs. The decision-making on the different periods (short, medium, or long), related to the planning and development of the industrial processes, requires a good knowledge of the energy consumptions from each activity and technological flow. The technical parameters of each equipment or installations should be known, and continuous monitoring represents the way to understand all energy consumption characteristics [
54,
55].
The proposed method in this module uses an expert system that considers aggregation rules for the energy consumption of equipment and installations for each activity associated with the technological flow.
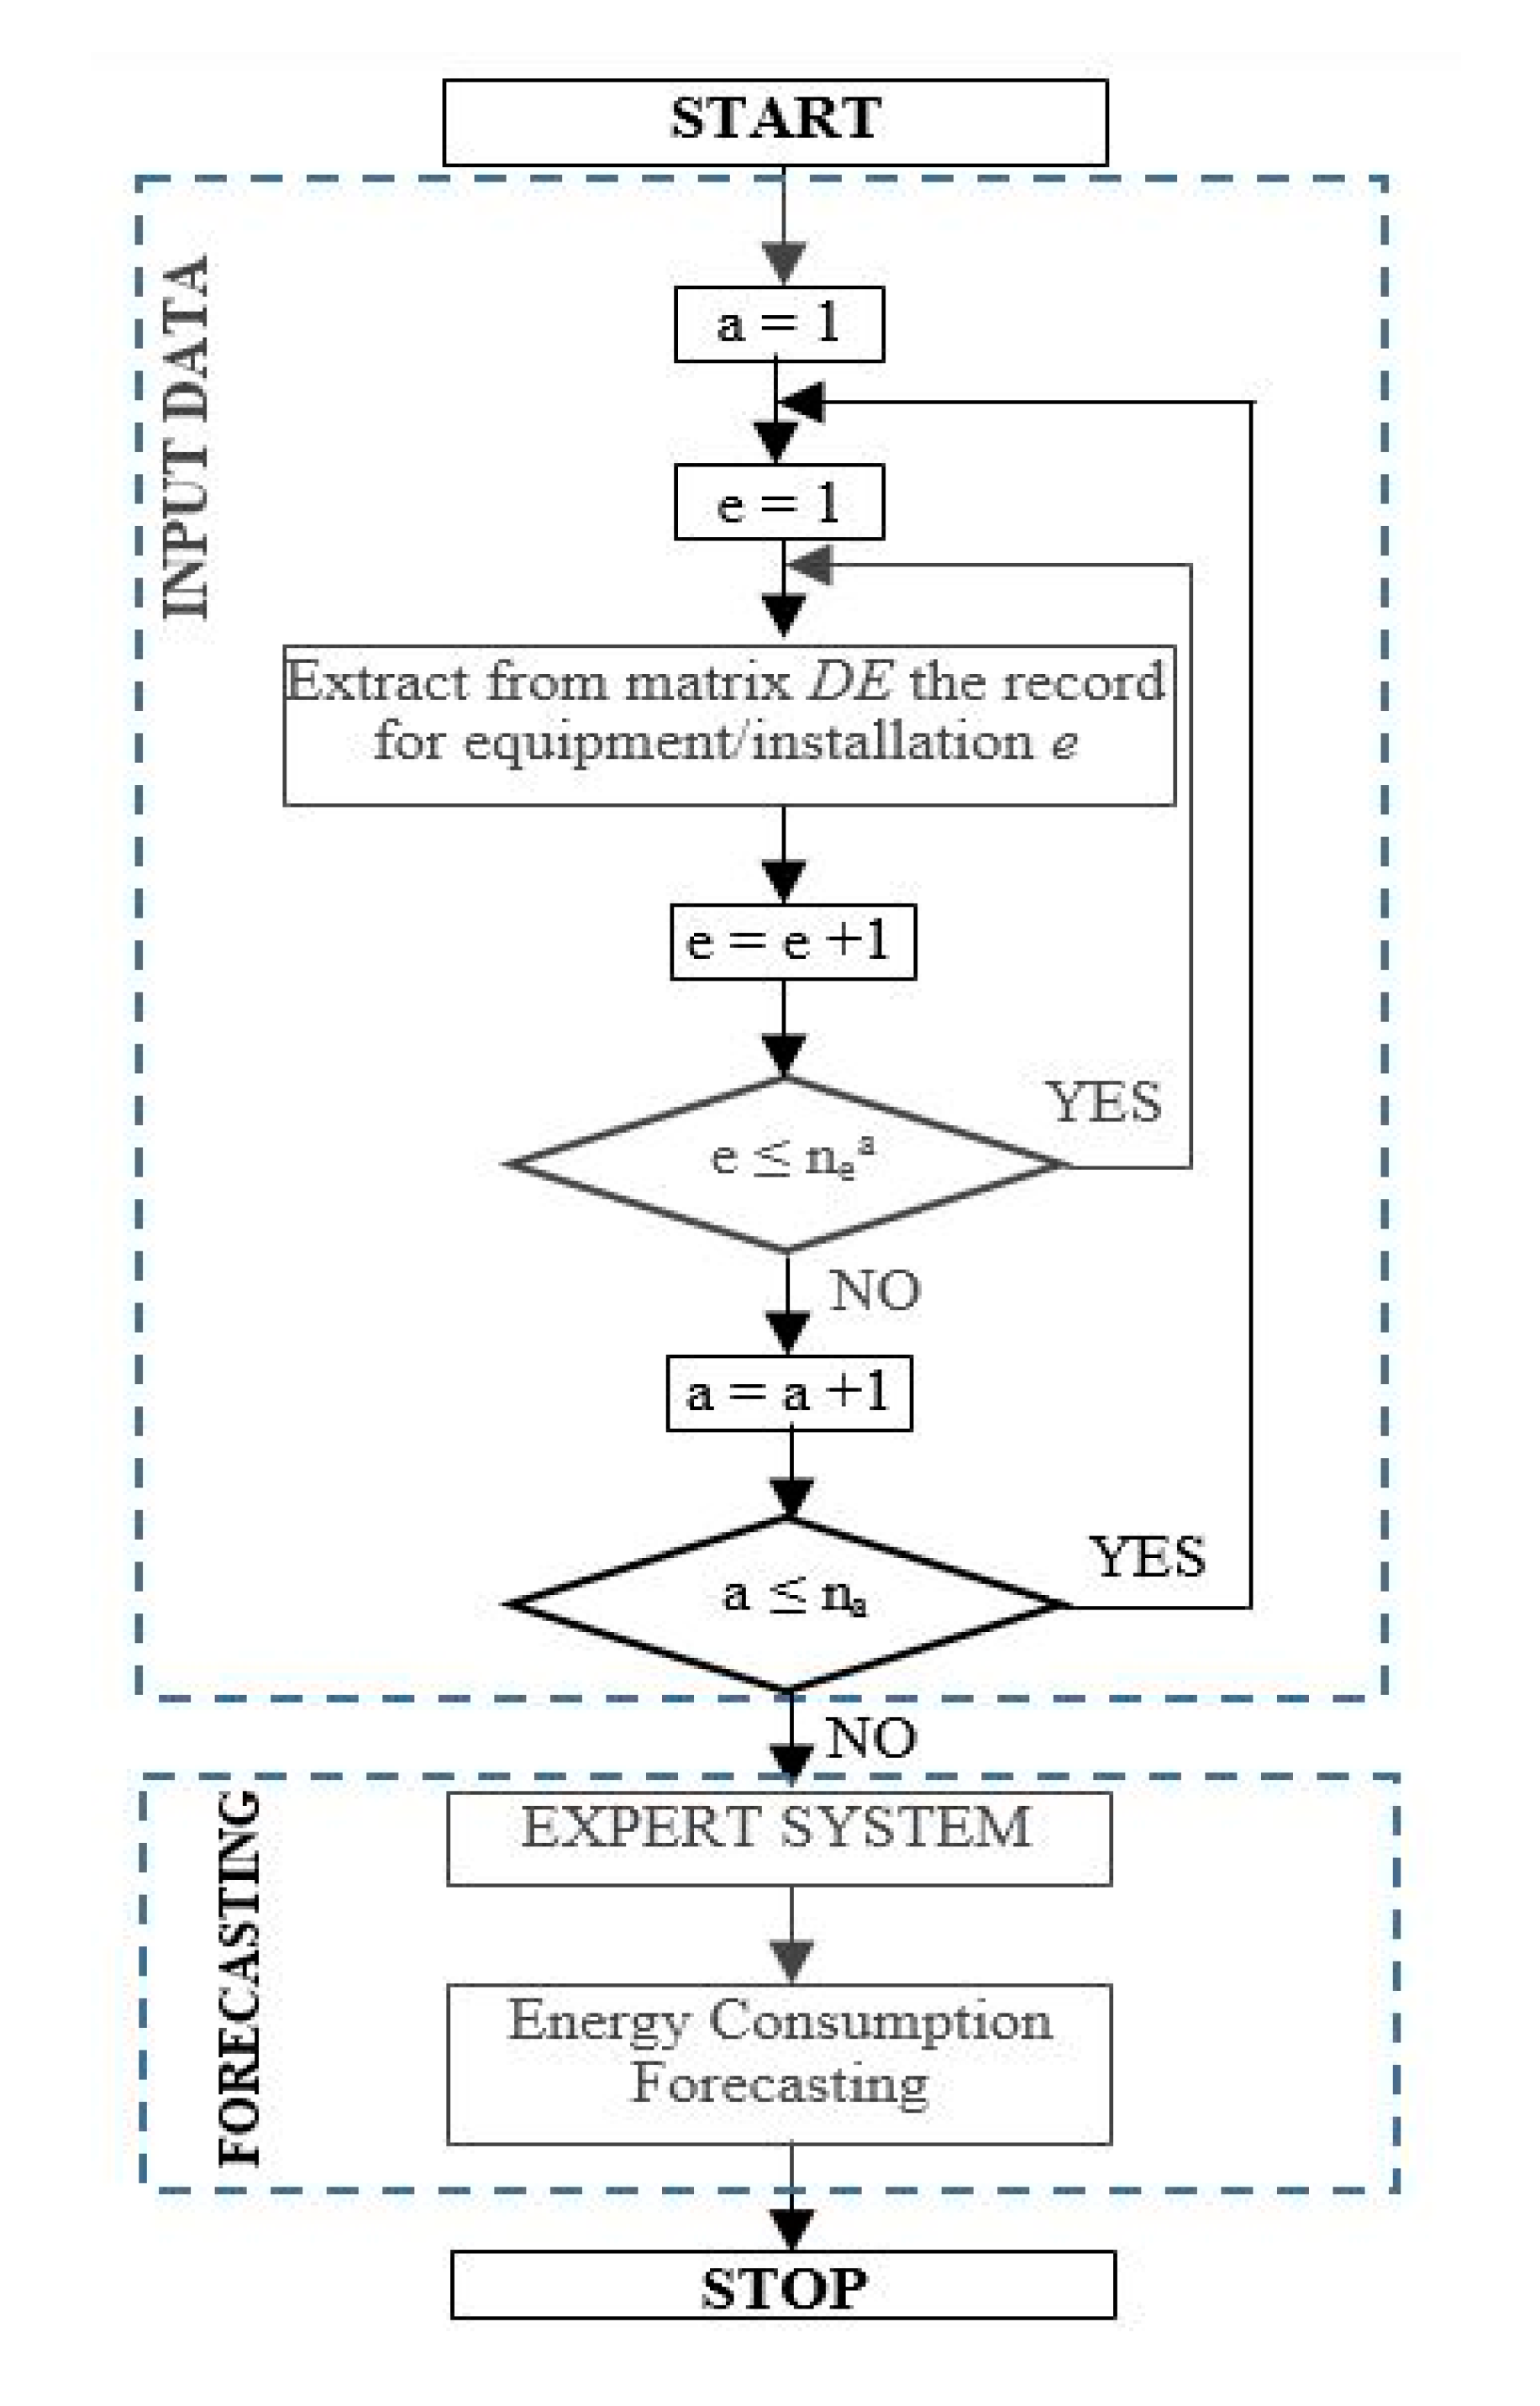
If for the SMEs, following the detailed analysis of the technological processes, the technical characteristics, the operating periods, the number of operating cycles associated with each equipment or installation were identified, then an aggregation-based forecasting method based on an expert system (ES) can be developed to estimate the daily energy consumption.
Figure 7 presents the flow chart of the proposed method. In figure, the following notations were used: the index
e, for equipment and installation (
e = 1, …,
),
, for the total number of equipment and installations associated with the activity
a, and
na, for the total number of activities.
An ES is a powerful tool used in the proposed method, having the following main components: database, knowledge base, and inference rules. It can identify the solutions to the difficult problem regarding the energy consumptions of the equipment and installations in various operating regimes that require the extensive experience of a Decision-Maker.
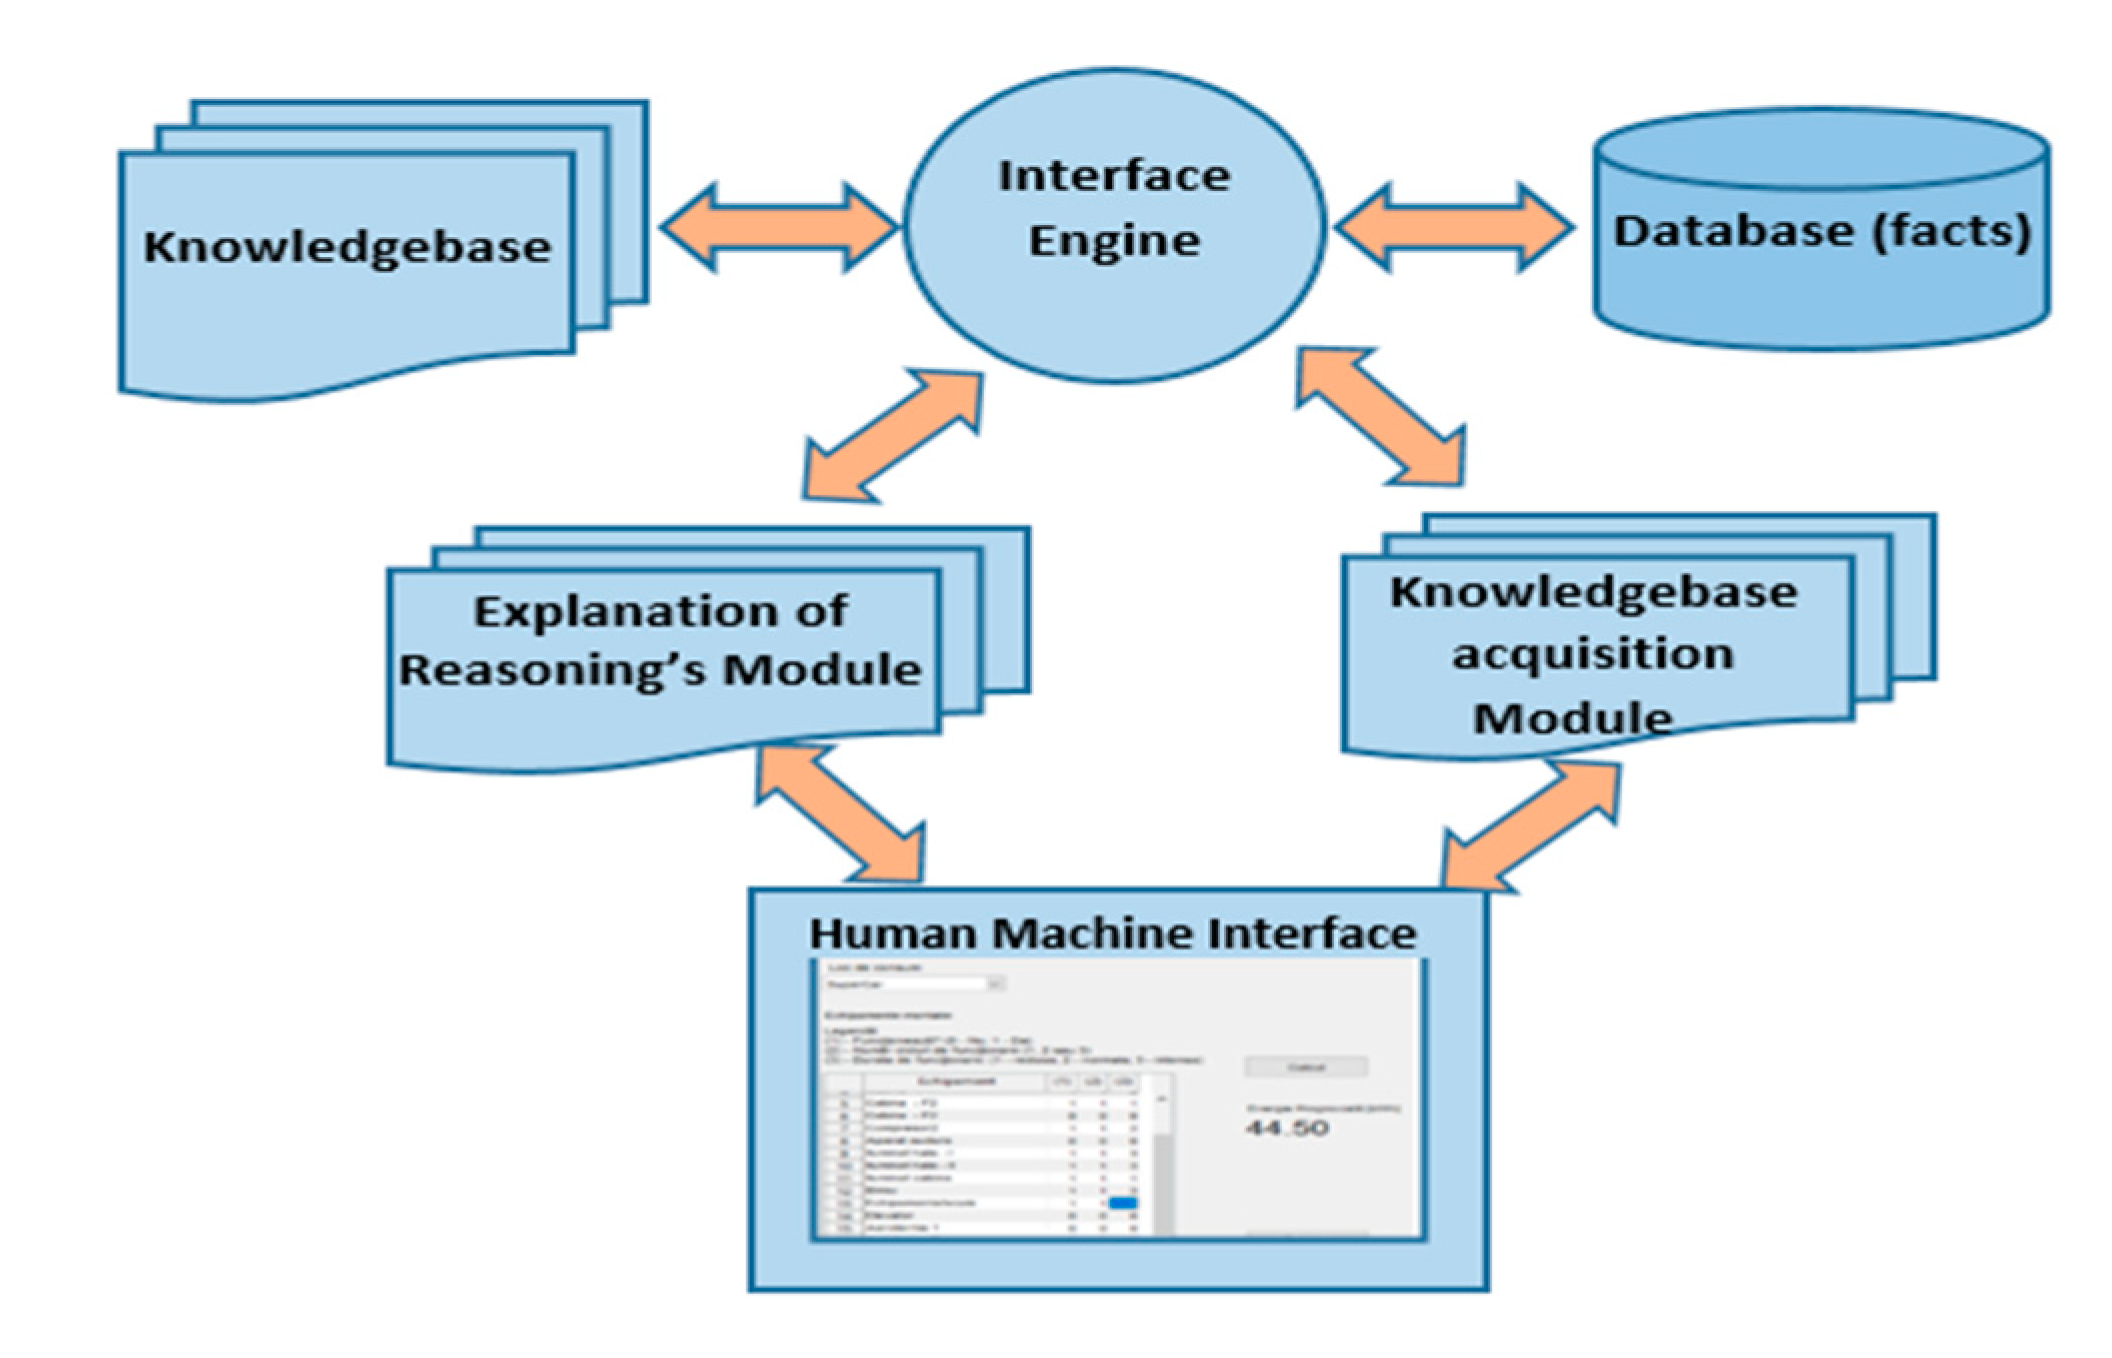
The last two components (knowledge base and inference rules) try to model the Decision Makers’ experience to establish the set of admissible solutions. The framework of an expert system is shown in
Figure 8 [
55].
Human–machine interface (HMI) performs communication. The explanation of reasoning’s module performs, as the main function, the necessity to justify and explain the stages regarding the reasoning of the expert system. The demonstration of the necessity inside the ES can be done in the initial phase (development), confirming the correctness of acquiring and using knowledge, and in the final phase, quantifying the importance and the result of the taken actions. The database is used to build inference rules. The inference engine determines which inference rules are fulfilled and taken over in the order of priorities. A code, written in the form of rules, will convert the knowledge base to solve the problem.
Two matrices are the basis of the expert system. The first matrix, Equipment and Installations’ Matrix (EIM), contains the equipment and installations’ characteristics, initialized with the input data corresponding to the scheduled activities from the next days. The rated power, working times, according to the type of daily activity (e.g., small, medium, and high) and the absorbed power in the steady-state regime, for each equipment or installation, represent the elements in this matrix. The second matrix, Decision-Making Matrix (DMM), has a high importance in decision-making. The information about the operating modes (on/off), using 1 or 0, the operating cycles, and the working times (reduced, normal, and long), identified through the numbers 1, 2, and 3, for each equipment or installation introduced in matrix EIM, are recorded in this matrix.
Based on the information contained in the two matrices, the rules of the expert systems with the logical structure
are applied to each equipment and installation associated with each activity.
In the final stage, the total energy consumption for the next day will be obtained using the aggregation of the forecasted consumptions of each equipment and installation e, e = 1, …, , associated with each activity a, a = 1, …, na.
3.5. Production Scheduling Module
The minimization of costs with energy bills and flattening of the consumption profile and the optimal scheduling of activities associated with the technological flows, through the reallocating of the equipment or installations in other hours, can be done if appropriate strategies are developed. Because these objectives represent the main challenges facing the SMEs today, optimum scheduling of the activities associated with the technological flows represents a direction vector oriented towards increasing energy efficiency. The production schedule can lead to positive effects on energy conservation, improving the technical and economic performance of the SMEs, and enhancing competitiveness, respectively [
56].
3.5.1. Mathematical Model
Considering the above aspects, a mathematical model, and the combinatorial optimization method to obtain the optimal scheduling frameworks of activities associated with the technological flows through modification of working time sequence corresponding to the programmable equipment or installations, is developed. The combinatorial optimization method is based on a fast heuristic search in the large admissible sets to obtain the optimal solution, represented by the time intervals in which the programmable equipment will work. The proposed method represents a useful decision-making tool in the choice of energy suppliers with the best offer of the energy cost and the identification of energy efficiency solutions.
The objective is the flattening of the energy consumption profile through the identification of the optimal solutions for the production scheduling of the SMEs, whatever may be the industrial activity branch.
The method considers the energy amount consumed by the equipment and installations which perform a certain activity inside a technological flow, from the moment they start working until their stopping after the associated task has been accomplished. Another aspect refers to the identification of the equipment and programmable installations. Those programmable installations and equipment, with high energy consumption, can be moved to work in the hourly periods with a small energy tariff or the reduced energy consumption without affecting the technological flow and having a minimum influence on the performance.
The flattening of the energy consumption profile is done for the work period when the activity is very intensive, moving the programmable equipment and installations in the hourly period with reduced activity. The mathematical expression of the objective function is [
56]:
where
cW,h—the energy cost at hour
h,
h = 1, …,
TH;
T—analysis duration, usually is represented by the work schedule;
wf,a,e,h—the energy consumption of equipment or installation
e necessary to execute the activity
a and obtaining the final product
f;
np—the total number of final products;
na—the necessary activities to obtain the final product
f; and
—the number of equipment and installations used for the activity
a to be carried out.
Due to the complexity of the industrial processes, the following technical constraints must be considered:
the allocation of the equipment or installations to a technological flow to perform a task:
where
Xf,a,e,h represents a decision variable for the allocation of the equipment or installations. Only if
Xf,a,e,h = 1, then the equipment or installation
e performs the activity
a, to obtain the final product
f, at the hour
h.
the working time of equipment or installation
where
and
—the start and stop hours, respectively, between which the equipment or installation
e works to carry out the activity
a, to obtain the final product
f and
Tf,a,e—the working time of the equipment or installation
e.
Phase sequence is considered because the activities associated with a technological flow for an equipment or installation
e, to obtain the product
f, should be finished before to start the next activities to process the product (
f + 1) from another technological flow. This constraint takes into account that for any equipment and installation:
Energy consumption balance between the total energy consumptions
wf,a,e,h of all equipment and installations
e associated with the activities
a, to obtain the products
f, at the hour
h, and the total energy consumption recorded by the general meter:
3.5.2. The Steps of the Proposed Algorithm
The algorithm considers the following steps to obtain the proposed objective represented by the flattening of the energy consumption profile.
Step 1. Determine the working characteristics of equipment, installations, and systems
The records from the measurement database represents the base to determine the operating characteristics associated with the working time multiplied by the hourly energy consumption for each equipment, installation, and system. If two equipment are dependent and work together, the aggregate characteristic cumulates the working times.
Step 2. Initialization of the input data matrix
In the input data matrix (IDM) having the size (ne × 8), where the total number of rows indicates all equipment and installations e, e = 1, …, , associated with all activities a, a = 1, …, na, and the columns refers to the name of the equipment or installation, the characteristics relating to the operation mode (on or off), the working cycles, the working time, type (programmable or nonprogrammable), the dependency to work together with other equipment to obtain the final product f, and the start and stop working hours of the equipment, information are introduced.
Step 3. Optimization Process
Combinatorial optimization was implemented to obtain the optimal solution regarding the production scheduling, which leads to flattening of the energy consumption profile.
4. Case Study
The testing of the platform, developed in MATLAB, was done by its implementation at an industrial consumer from the category of microenterprises (5–10 employees) in the most active field of SMEs (trade/repair of vehicles) from Romania [
57].
4.1. Database
The database includes the monthly energy consumptions and costs identified from energy bills, all equipment and installations associated with the technological flows from the SME, and those that provide the comfort (lighting system, heating system, or cooling system). The information for the analysed SME was available starting with 2018. A smart meter was installed at the beginning of 2019 in parallel with the settlement classic meter, to record and to communicate (wireless) the energy consumption profiles towards the software platform to test the profiling module. Thus, the availability of the profiles allowed calculation of the daily and monthly energy consumptions using an aggregation function implemented in the database module.
Table A1 from
Appendix A presents the energy consumption and cost from monthly energy bills in the period 2018–2019 are presented in [
57]. In addition, the daily energy consumptions, recorded in 2019 by the smart meter, are given in the attached
Supplementary File. The technological processes contain activities relating to the tinsmith, mechanical repairs, and car dyeing. The equipment, installations, and systems associated with these activities, together with their rated powers (P
r), are presented in
Table 3.
4.2. The Consumption and Cost Analysis
The analysis can be done on years, months, or days, choosing an analysed duration. At the level of 2018, the total energy consumption was by 26.09 MWh/year, and the total cost, 23,479 RON, with an average value of 2.17 MWh/month and 1957 RON/month, respectively. A deeper analysis was done at the level of months. The information on the dispersion of the data regarding the energy consumptions was obtained based on a boxplot.
A boxplot represents a graph that indicates how the values are spread out. In
Figure 9, the boxplot of the monthly energy consumption from 2018 was shown. The analysis of the boxplots shows that the median energy consumption for all months from 2018 is 1743.5 kWh. The minimum value is 1247 kWh recorded in August, and the maximum value is 5124 kW (February), plotted with “+” in the figure. The months with higher values, over the quintile
Q3 (represented with a blue horizontal line), identified in the graph with the magenta colour and the outliers, like the month February with the red colour, were analysed.
Concerning to January, February, and March, the analysis of the weather conditions and the performance of the electric heating system (in operation in 2018) has been indicated that the heating system was inefficient. The data from 2019 showed that the energy consumption decreased in the three months due to mainly the replacement of the electric heating system with a gas boiler, see
Figure 10.
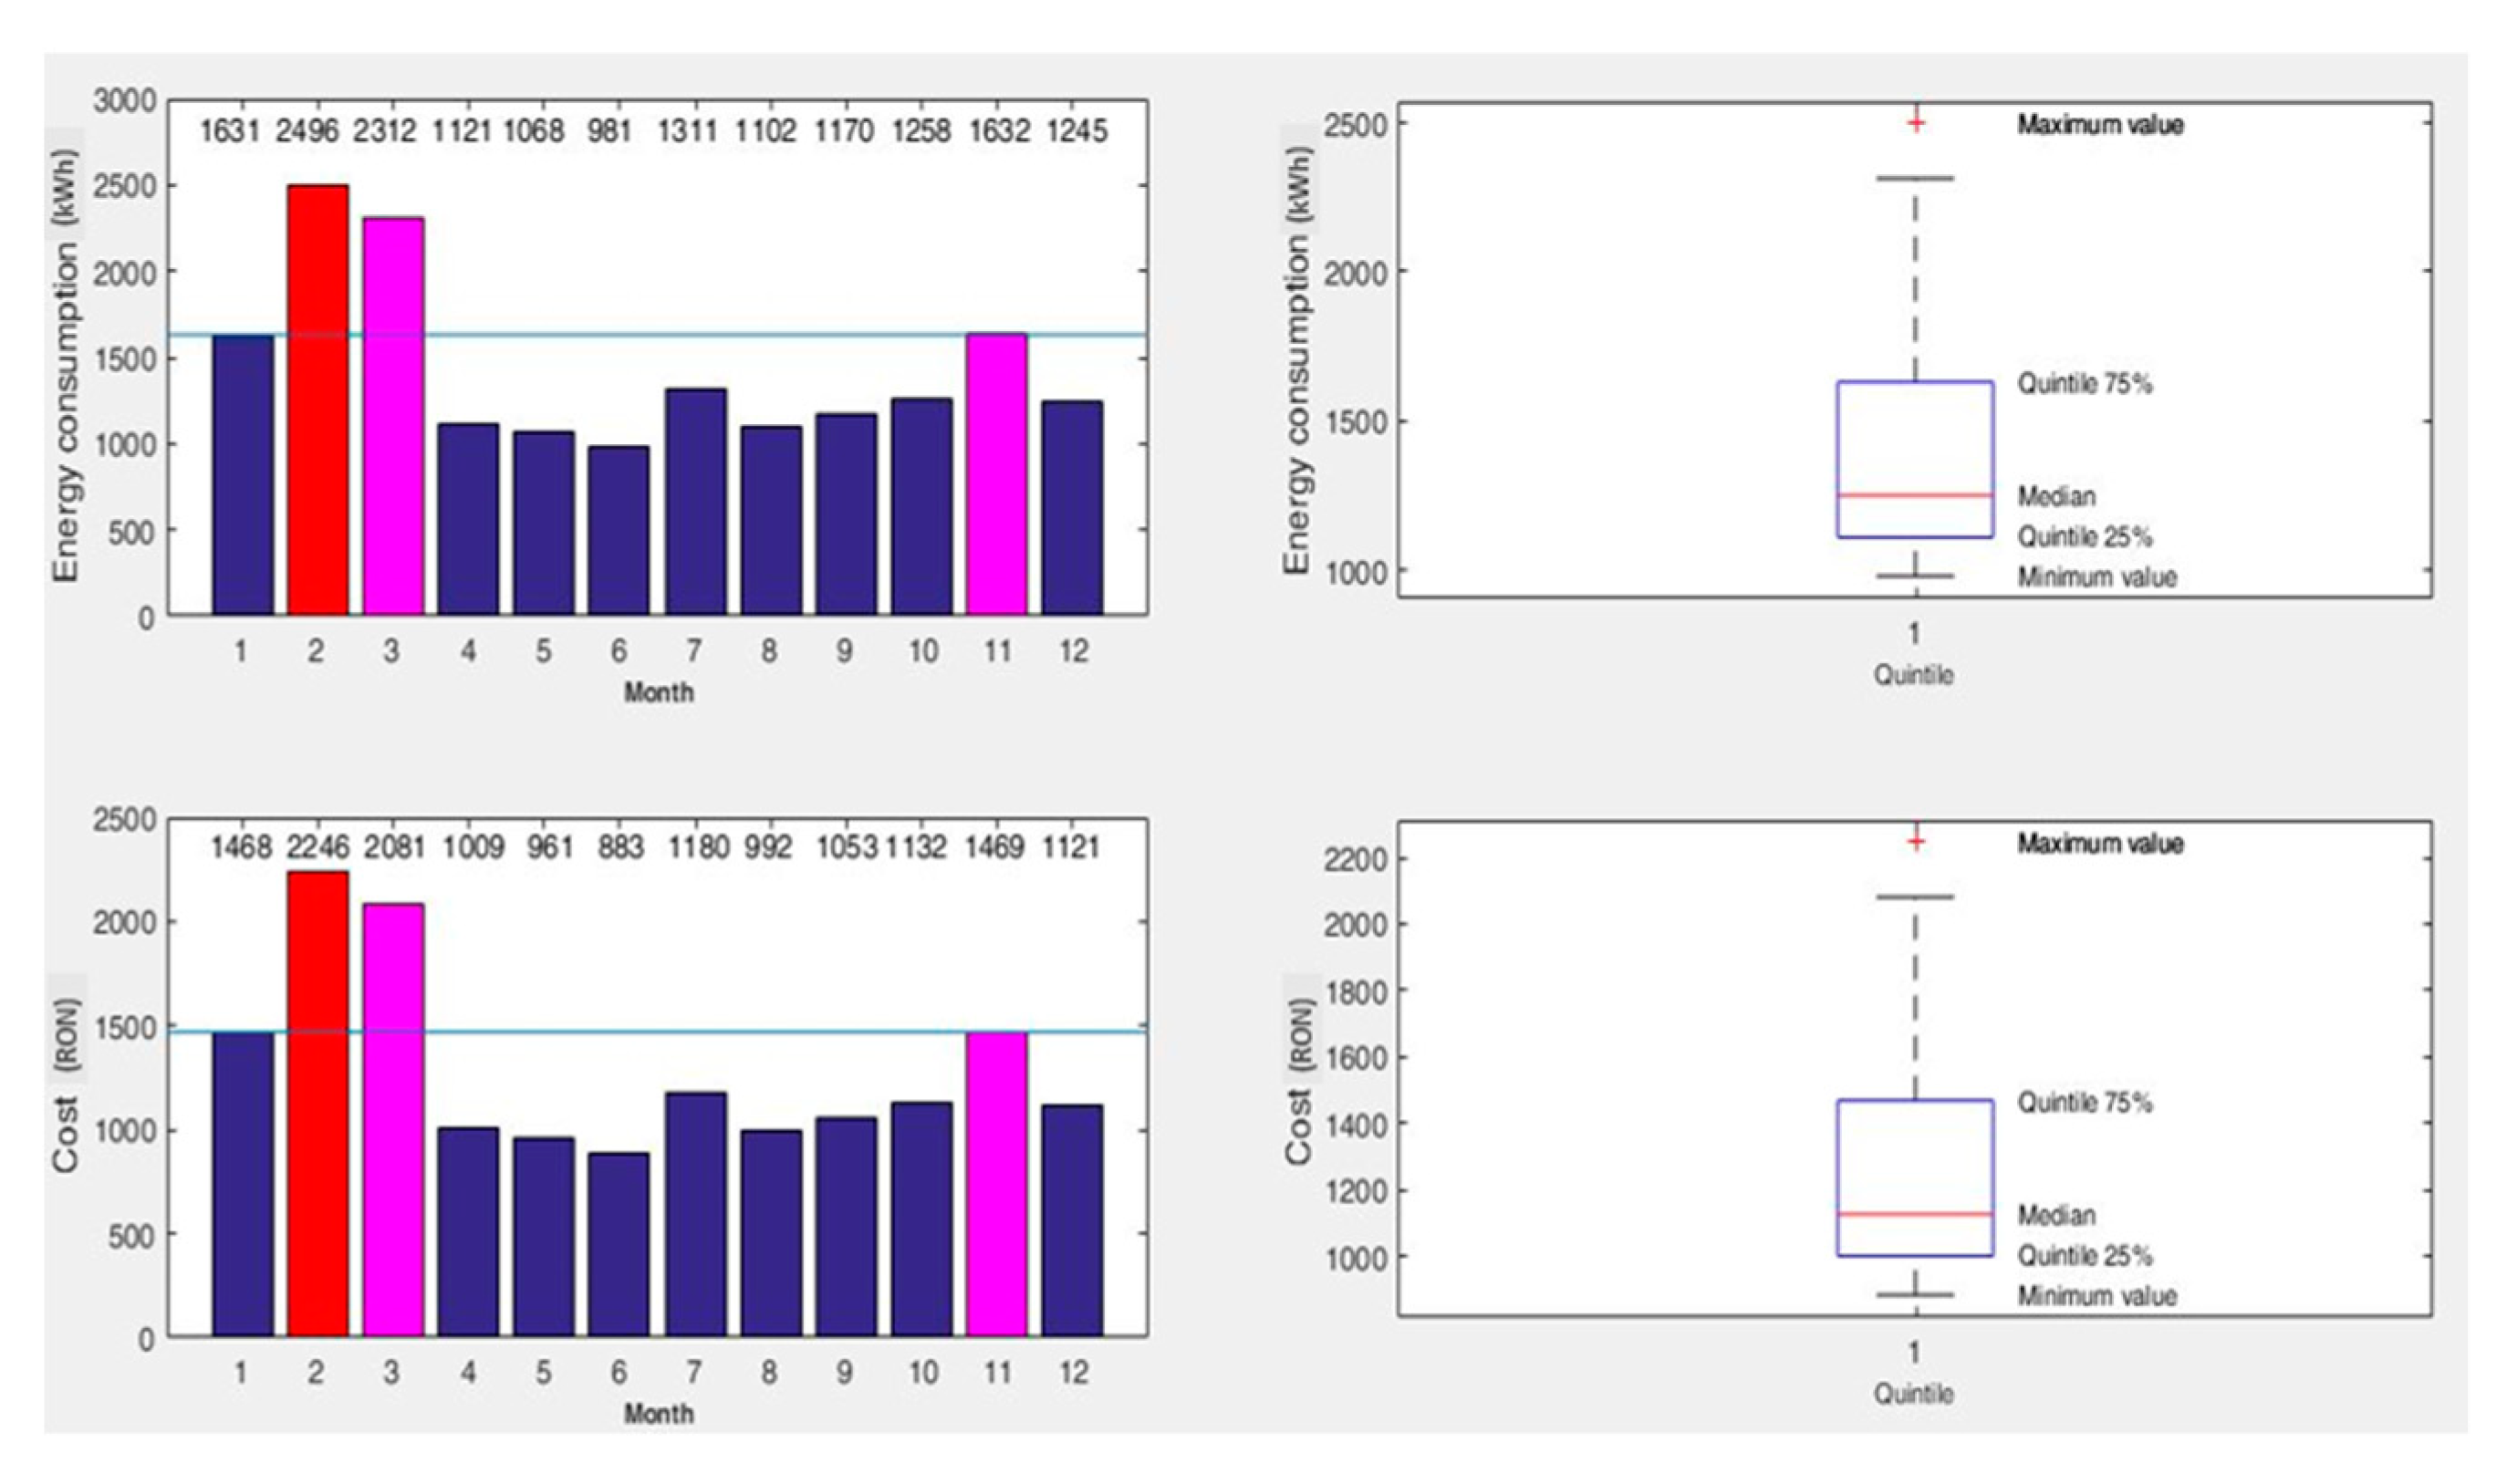
The synthesis of the data at the level of 2019 highlighted a total energy consumption by 17.33 MWh/year, with 8.76 MWh/year less than in 2018, and the total cost, 15,594 RON, with an average value of 1.44 MWh/month and 1300 RON/month, respectively. The analysis of the boxplot showed that the median energy consumption for all months from 2018 is 1251.5 kWh, with 492 kWh less than in 2018, see
Figure 10. The minimum value is 981 kWh recorded in June, and the maximum value is 2496 kW (February), plotted with “+” in the figure. Three months (February, March, and October) had the energy consumption over the quintile
Q3, but these values were recorded mainly due to an intensive activity. Even if February registered the maximum value, the energy consumption decreased with 2628 kWh less than in 2018, which means that the new heating system is efficient.
Table 4 presents the comparative situation from both years.
Besides the annual analysis, the daily energy consumptions from each month of the year 2019, obtained from the aggregation of the hourly values from profiles recorded by the smart meter, were investigated.
Table 5 shows the statistical results.
The analysis of the results highlighted that the mean and median (represented by the quintile Q2) have the values approximately equal in the case of most months, with a higher difference for April. In addition, the confidence degree is high (between 10% and 20%) and moderate (between 20% and 30%) in most months, which means that the daily energy consumptions have the values close. However, there are two exceptions represented by January and April, where the confidence degree is weak.
All these analyses helped the Decision-Maker to understand the trend of the energy consumption from each month, season, or year, comparing the records from different selected periods, such that to develop the strategies, which to take into account by these characteristics, regarding the planning of production.
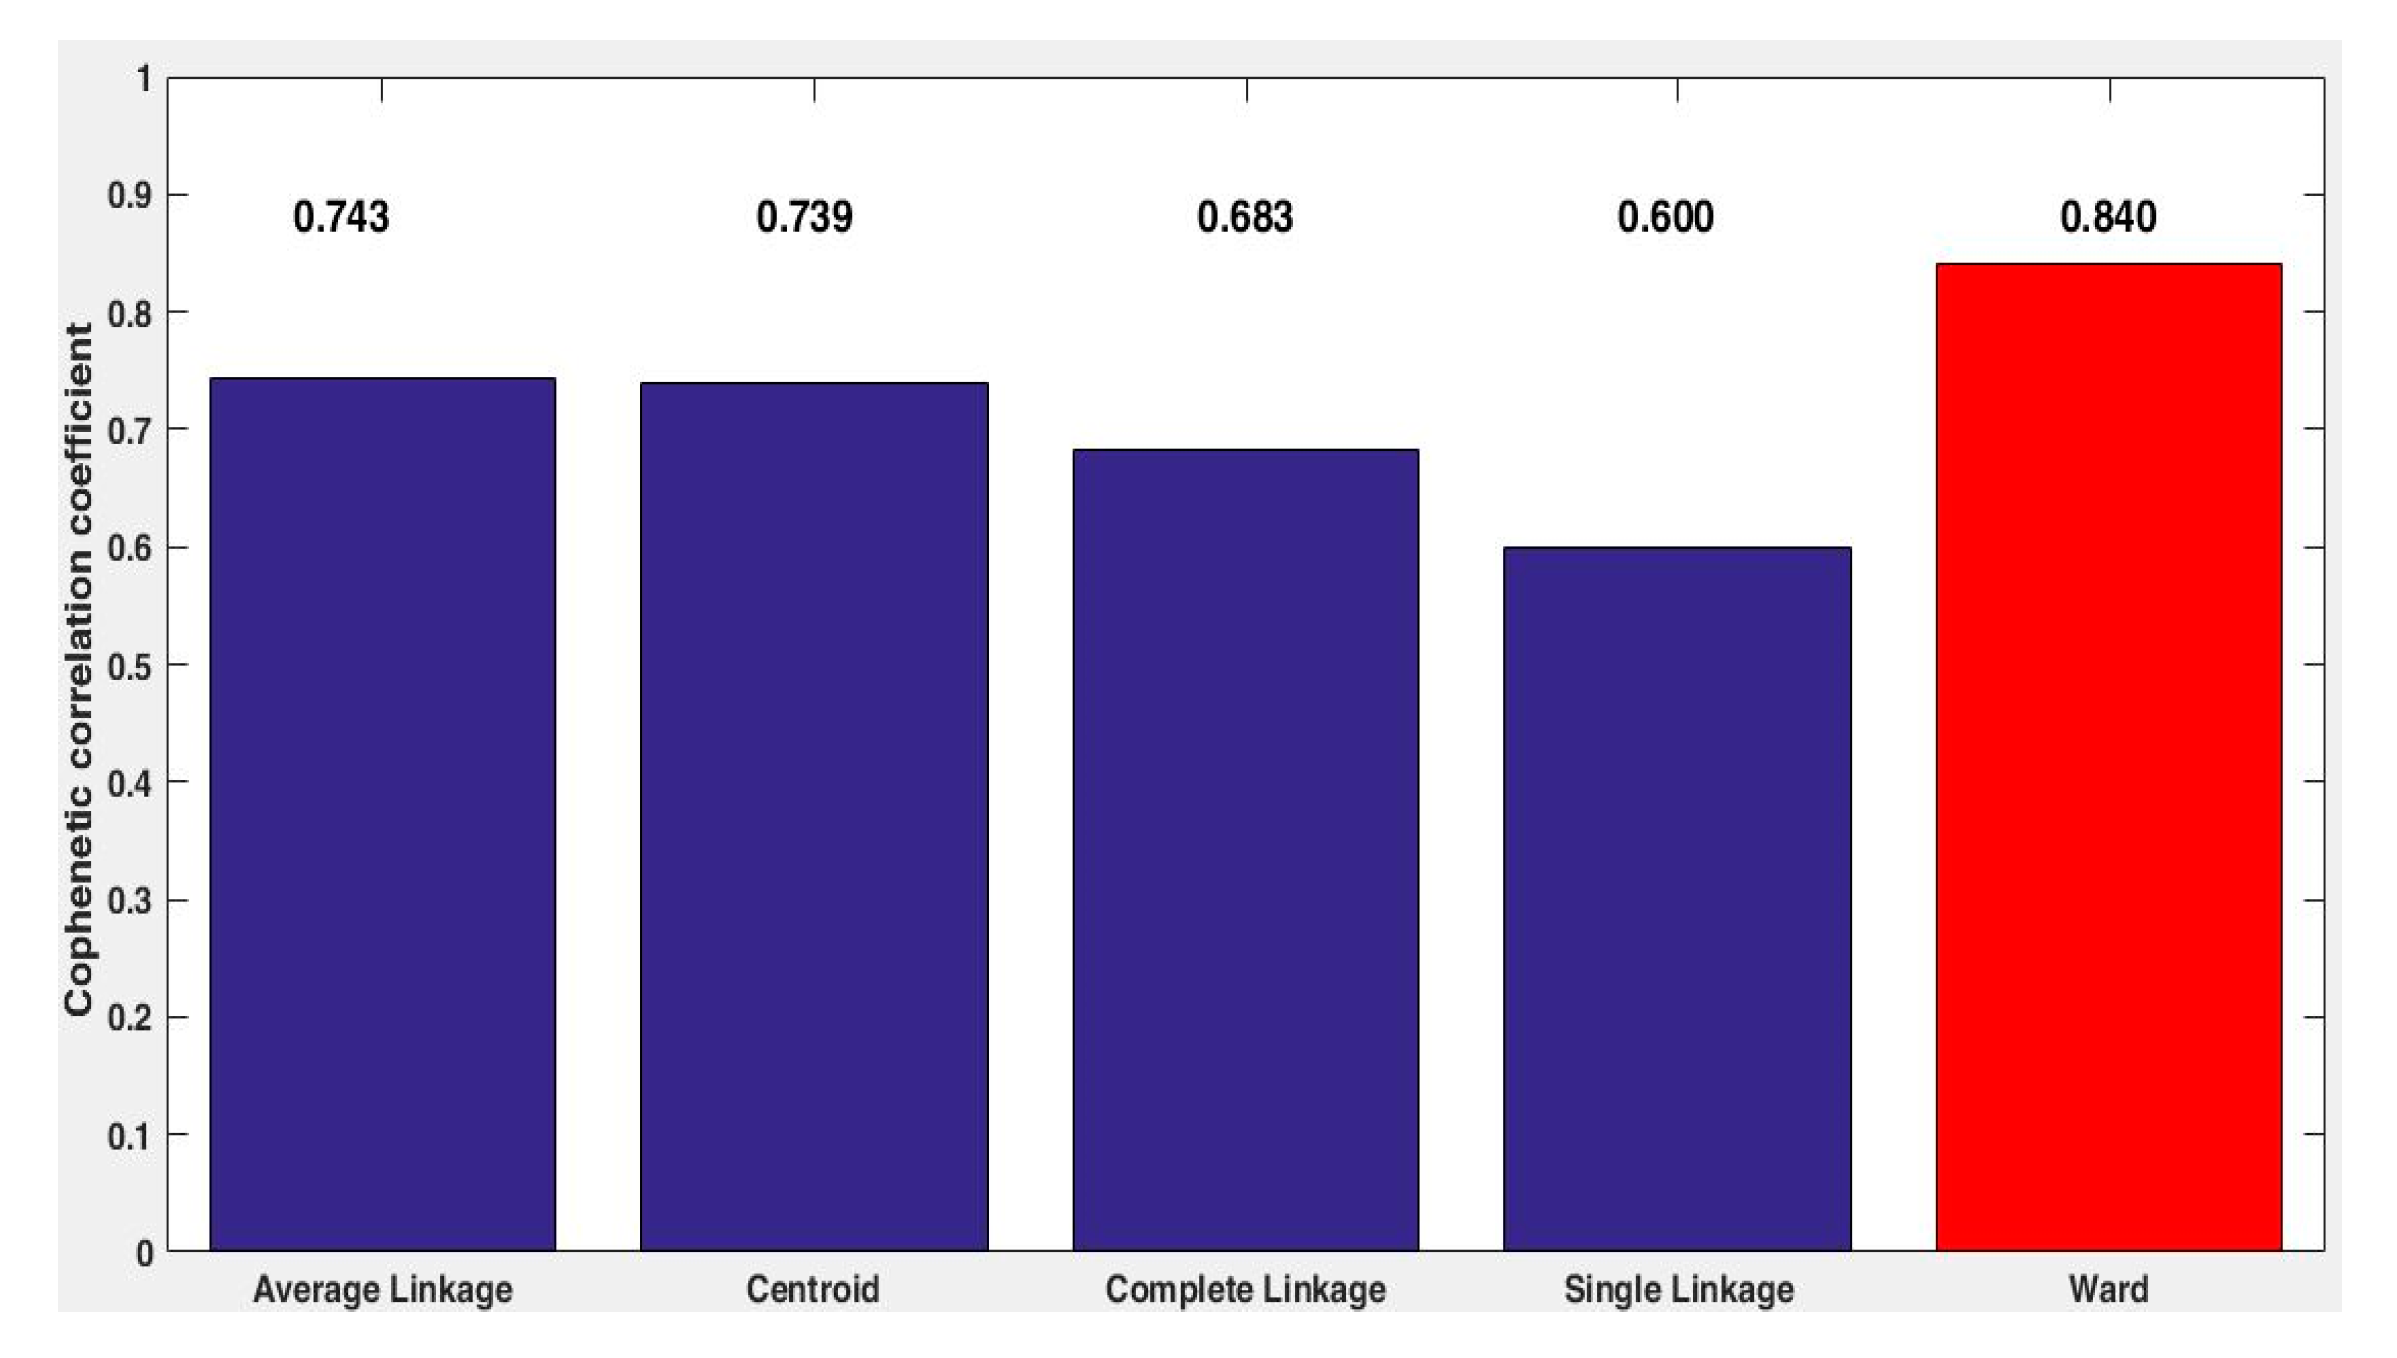
4.3. The Profiling Process
The profiling process used the daily energy consumption profiles, recorded with the help of smart meter during the year 2019. The sampling step has been set to a quarter-hour due to the dynamic of activities associated with the technological flow. The database has records for 250 days without the holidays and weekend days. These were normalized using daily energy consumption. To identify what is the best method to be used in the clustering process, the module has used the testing function based on the cophenetic correlation coefficient (CC). The Ward method, highlighted in red, led to the best performances in the case of this database, for which CC is equal with 0.840, see
Figure 11. The results can be displayed if the Decision-Maker requests this information. The characteristics represented through the statistical variables (mean, standard deviation, and confidence degree in mean) of the daily energy consumption for the clusters obtained with the Ward method are presented in
Table 6.
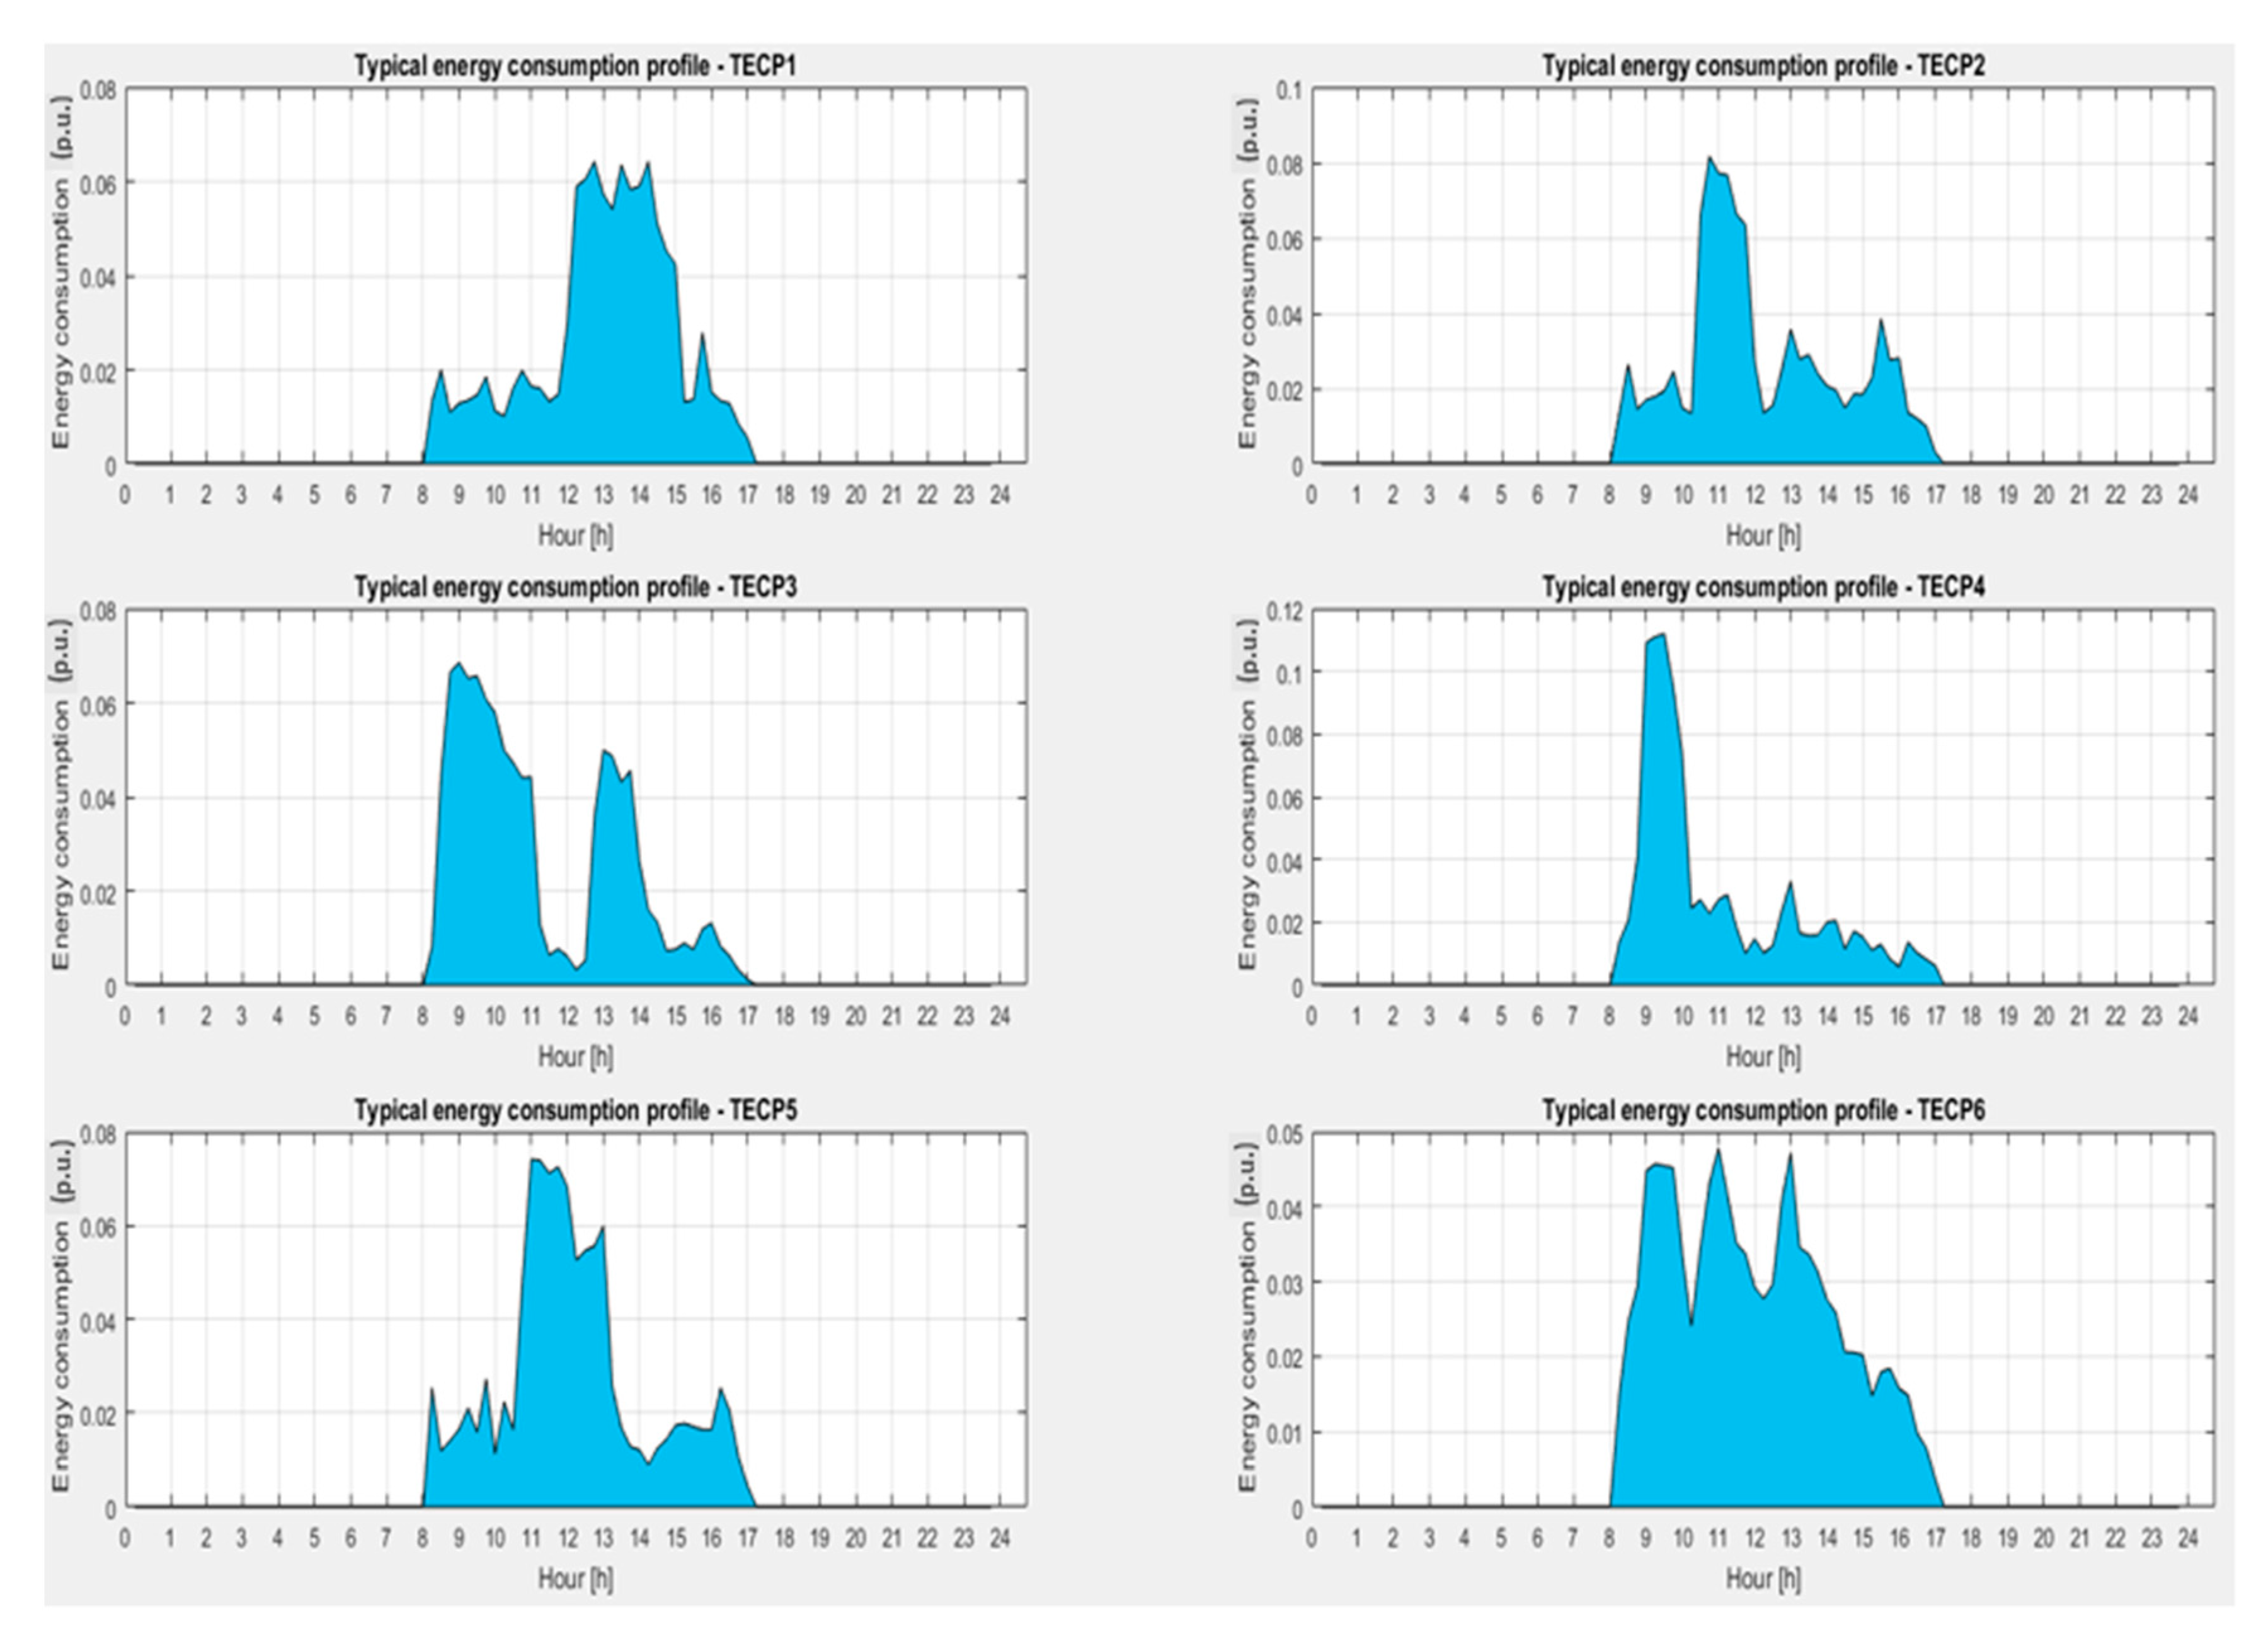
The profiles have been obtained based on the averaging process of the profiles assigned with each cluster.
Figure 12 presents the TECPs, and the hourly values are indicated in
Table A2 from
Appendix A. Because the working schedule is 9 h (between 8:00 a.m. and 5:00 p.m.), the other values from TECPs are 0.
The dyeing installation cannot continuously operate during the 9 h of the working schedule. It can work with the two phases (dyeing and drying) at most two working cycles in a day if the vehicle is completely dyed, requiring a longer time, or at most three complete working cycles, if only various components of the vehicle are dyed. However, there are days when the other combinations between the working cycles can be met or when the second phase is missing (drying is done naturally, at ambient temperature, when it is over 20 °C, and the installation is no longer used for another dyeing phase). These operating regimes influence the intensity of the activities, three categories being identified: Small (the energy consumption is up to 75 kWh, clusters C3 and C4), medium (the energy consumption is between 75 and 100 kWh, clusters C1 and C5), and high (the energy consumption is up to 100 kWh, clusters C2 and C6).
Table 7 presents the measurement of the intensity for each month. This information appears as a report for the decision-making, which can identify details on the activity from each month.
It can be observed that a small intensity (over 70% of the days, in each month) has recorded in, May, June, July, August, September, and October. In addition, the activity in January, November, and December had moderate intensity (over 50% of the days, in each month), and in February and March have recorded a high intensity (over 50% of the days, in each month). March is the month where medium and high intensities are very close (43% and 57%, respectively).
4.4. The Energy Consumption Forecasting
To test the expert system-based method from the forecasting module, the working time and operating characteristics of the equipment and installations were identified based on the analysis of current and voltage measurements done for 1 month, in 2019, with the power analyser Chauvin Arnoux, using a sampling step by 5 s.
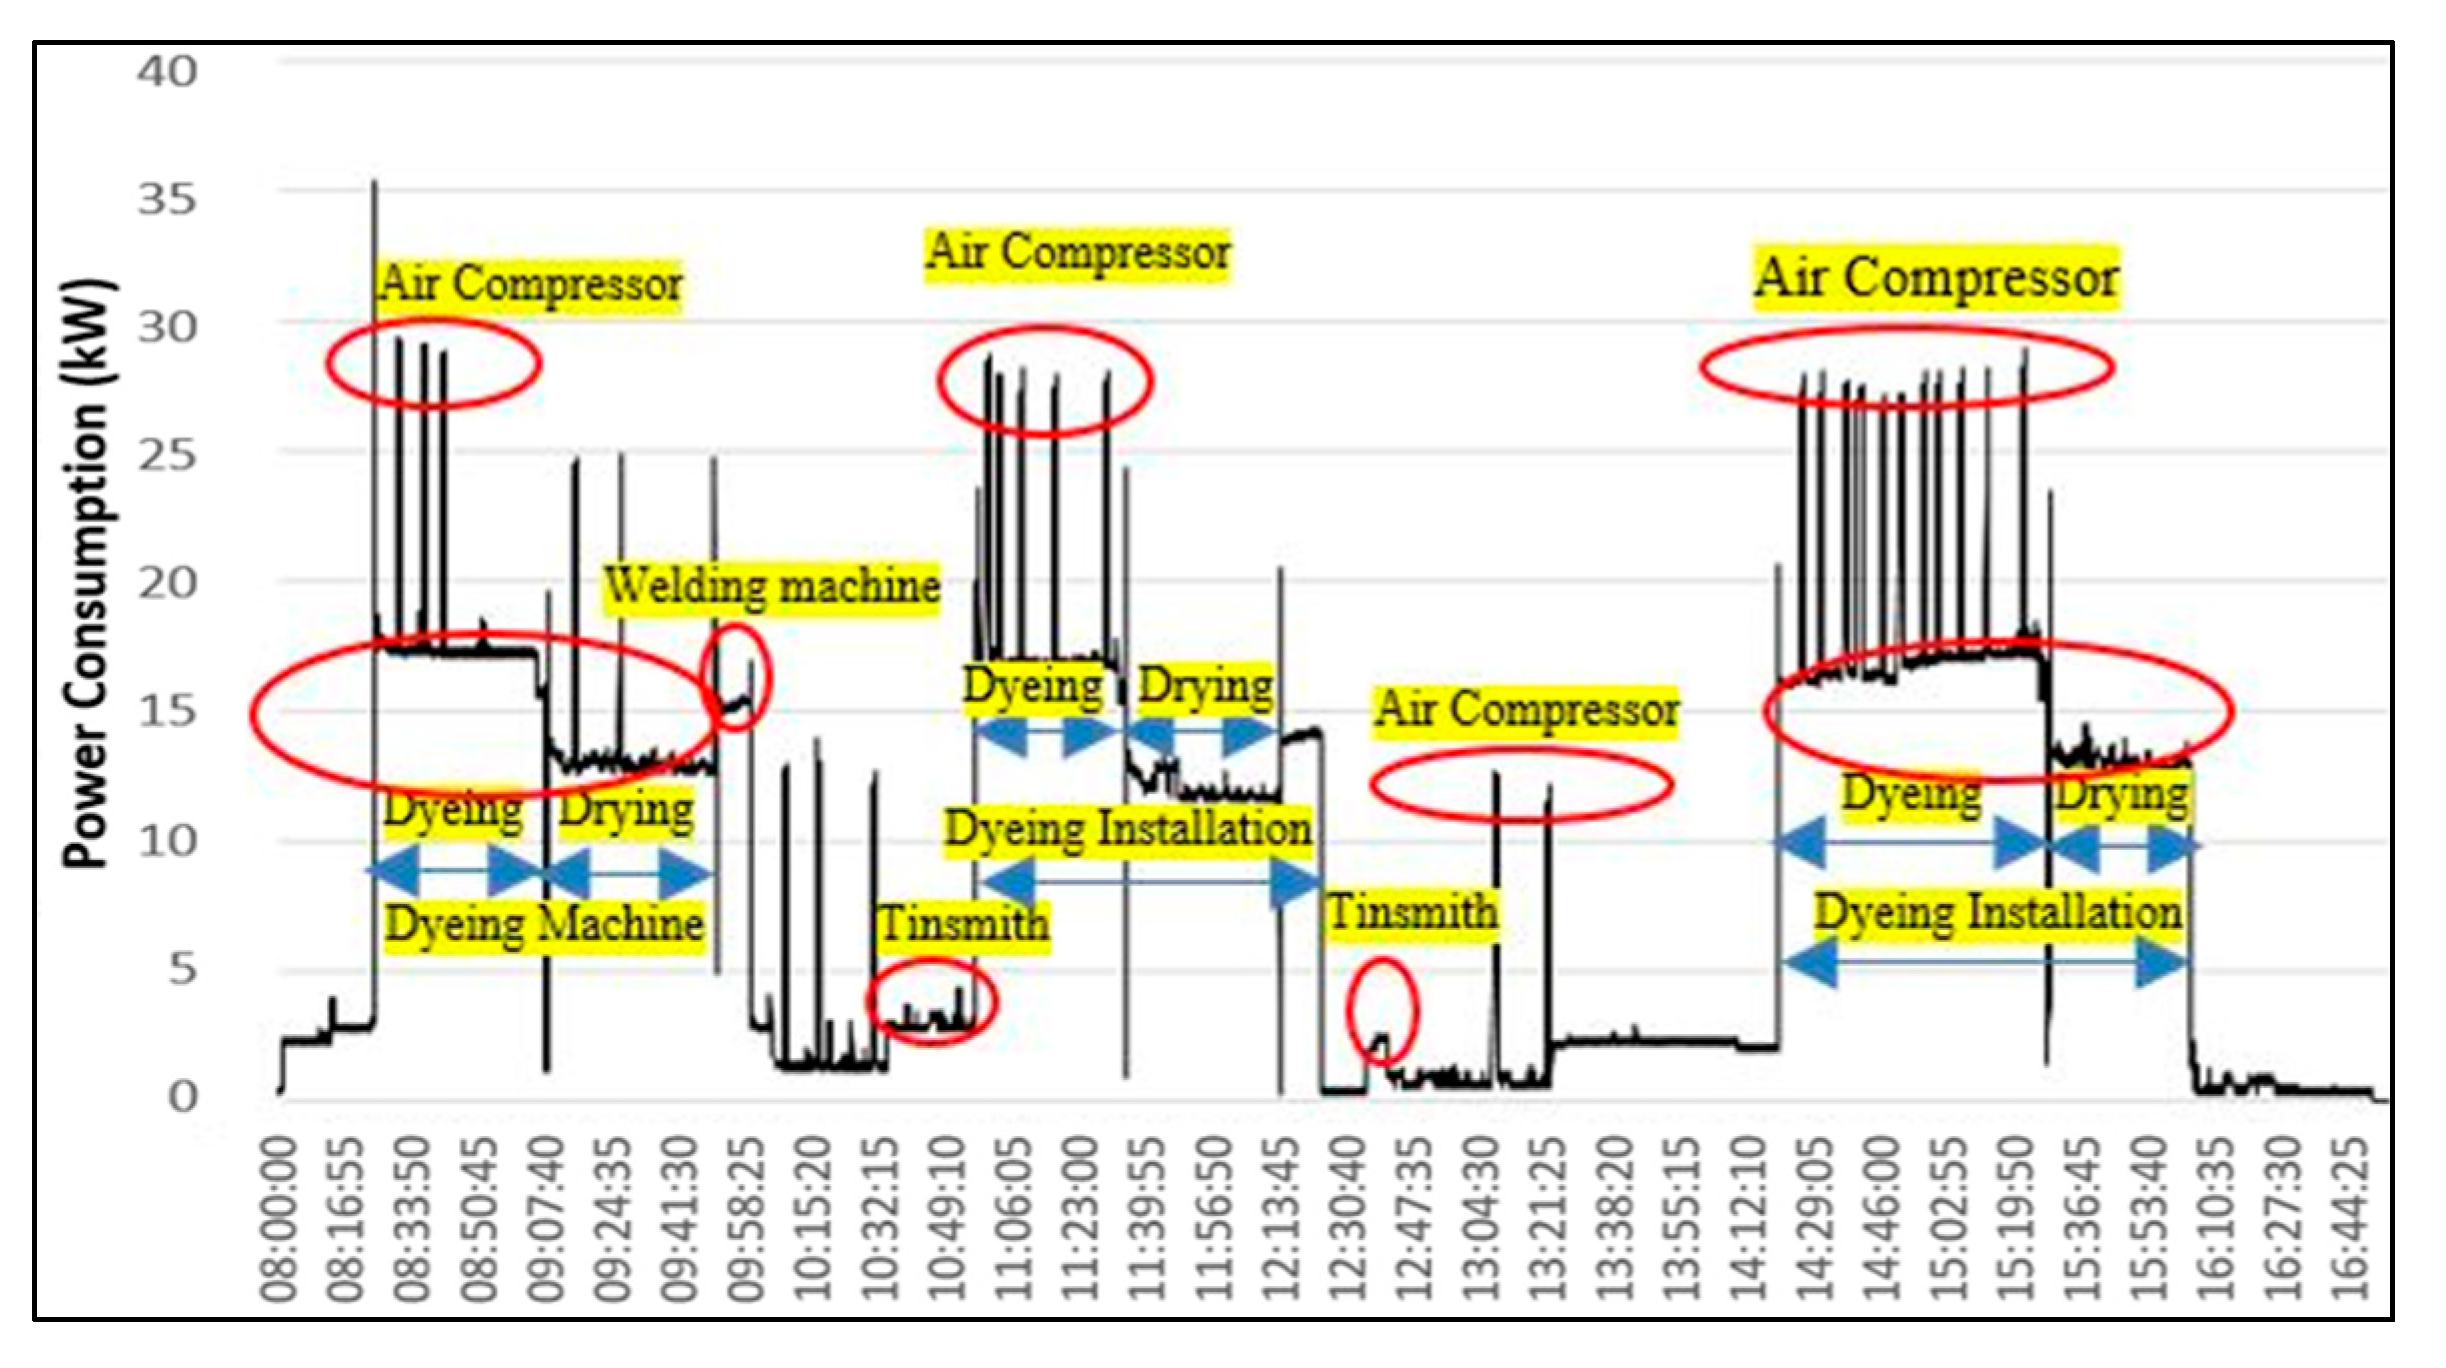
The measurement equipment was installed in the general electric panel on the main feeder and secondary cables, which feeds each local electric panel. As an example, the consumption profile assigned to a day from the analysed period, recorded on the main feeder, with the identification of different equipment and installations on which it operated, is presented in
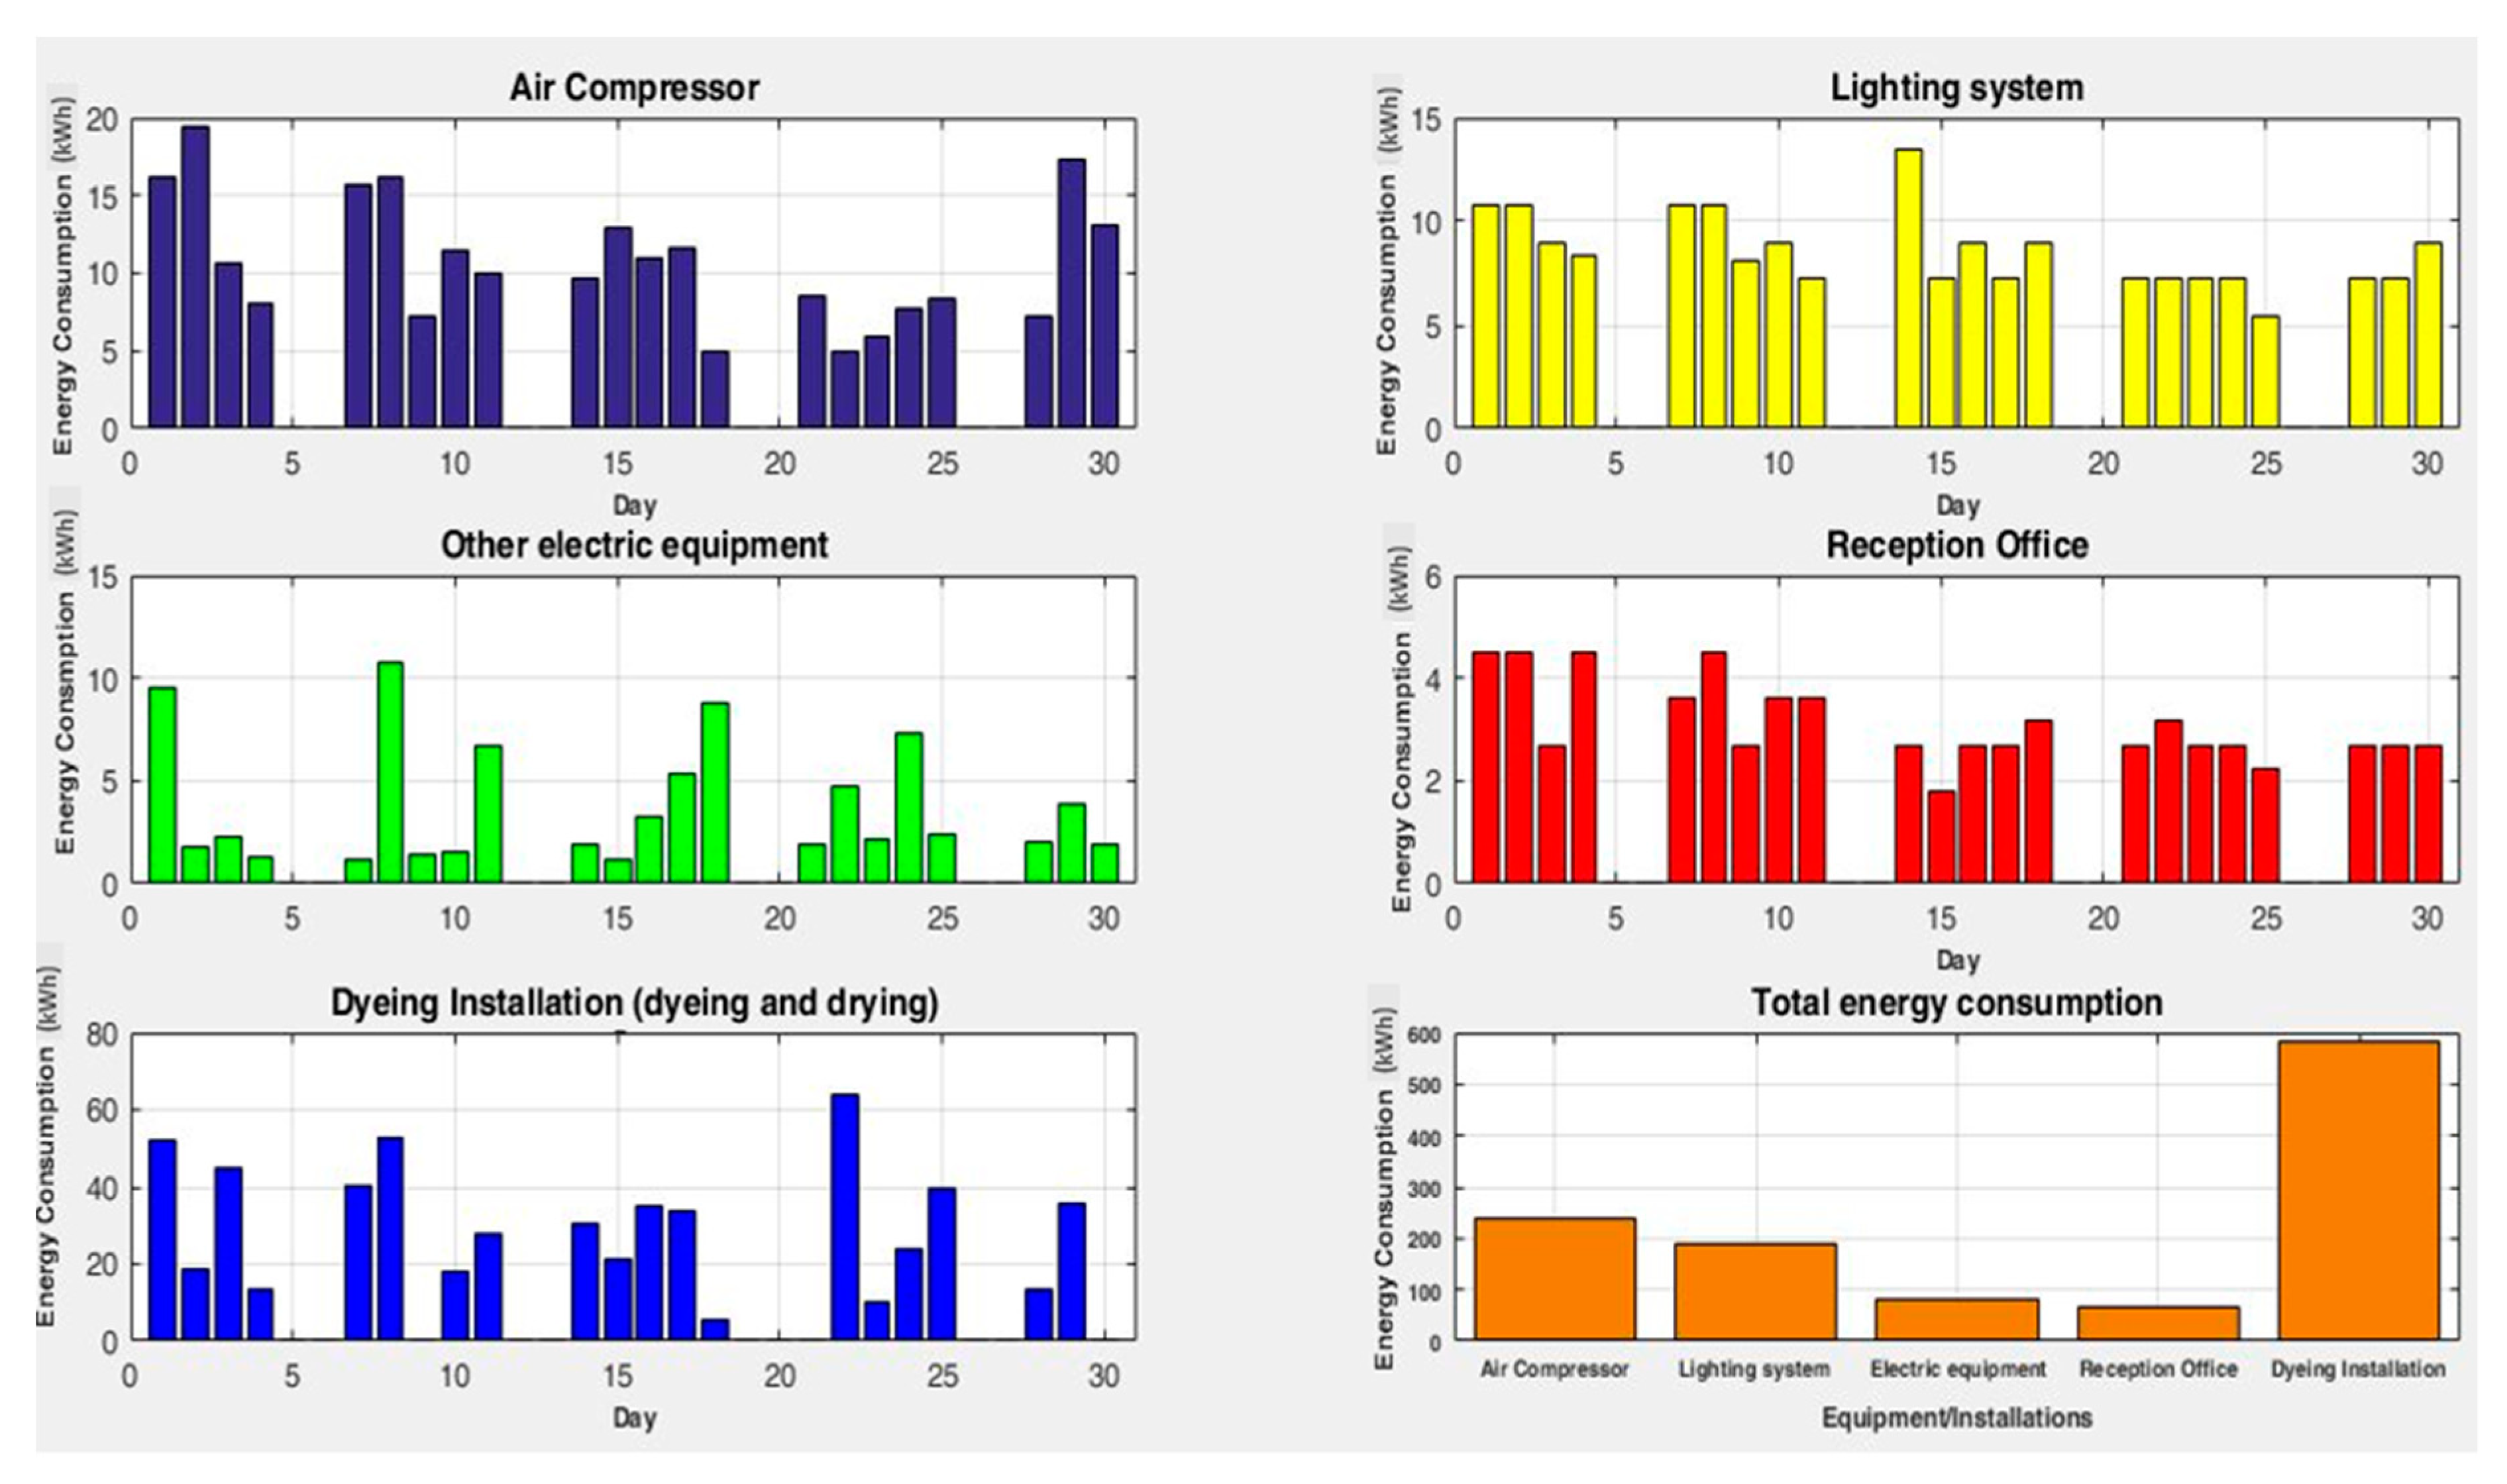
Figure 13. The main operations (tinsmith, mechanical repairs, and car dyeing), highlighted with red circles, associated with the activities of the technological process can be identified inside the profile through the equipment and installations (air compressor, welding machine, and dyeing installation with the dyeing and drying phases), relieved with yellow colour. The working time depends on the following factors: the body types (hatchback, sedan, MUV/SUV, coupe, convertible, wagon, van, or jeep), the thickness of sheet metal, and the number of components which must be dyed.
The analysis of working time corresponding to each equipment and installation led at the following shares from the total energy consumption: 50.1% dyeing installation, 20.5% air compressor, 16.2% lighting system, 7.2% other electric equipment (vehicle lift, welding machine, hammer drills, blowers, etc.), and 5.9% reception office, see
Figure 14.
In the weekend periods, or when the equipment or installations did not operate, there is no energy consumption.
In addition, all profiles led to the division of the energy consumptions in three categories (small, medium, and high) considering the working time (reduced, normal, and long) for each equipment and installation, depending on the factors listed above, see
Table 8. The first eight positions of the table correspond to the phases of dyeing installation, which have operating regimes with different values of working times and energy consumptions according to the components (doors, tailgates, fenders, bumpers, etc.) or the whole body of the car.
This information helps the Decision-Maker to complete the equipment and installations matrix (EIM) associated with the system expert-based aggregation method.
The Decision-Maker can complete the matrix taken into account the type of operations for each programmed car in the next day. Thus, the information introduced in the matrix depends on the intensity of activity (small, medium, and high) considering the working time (reduced, normal, and long) and energy consumption associated with each equipment and installation and the number of working cycles, if some operations can be repeated to various time intervals.
Figure 15 and
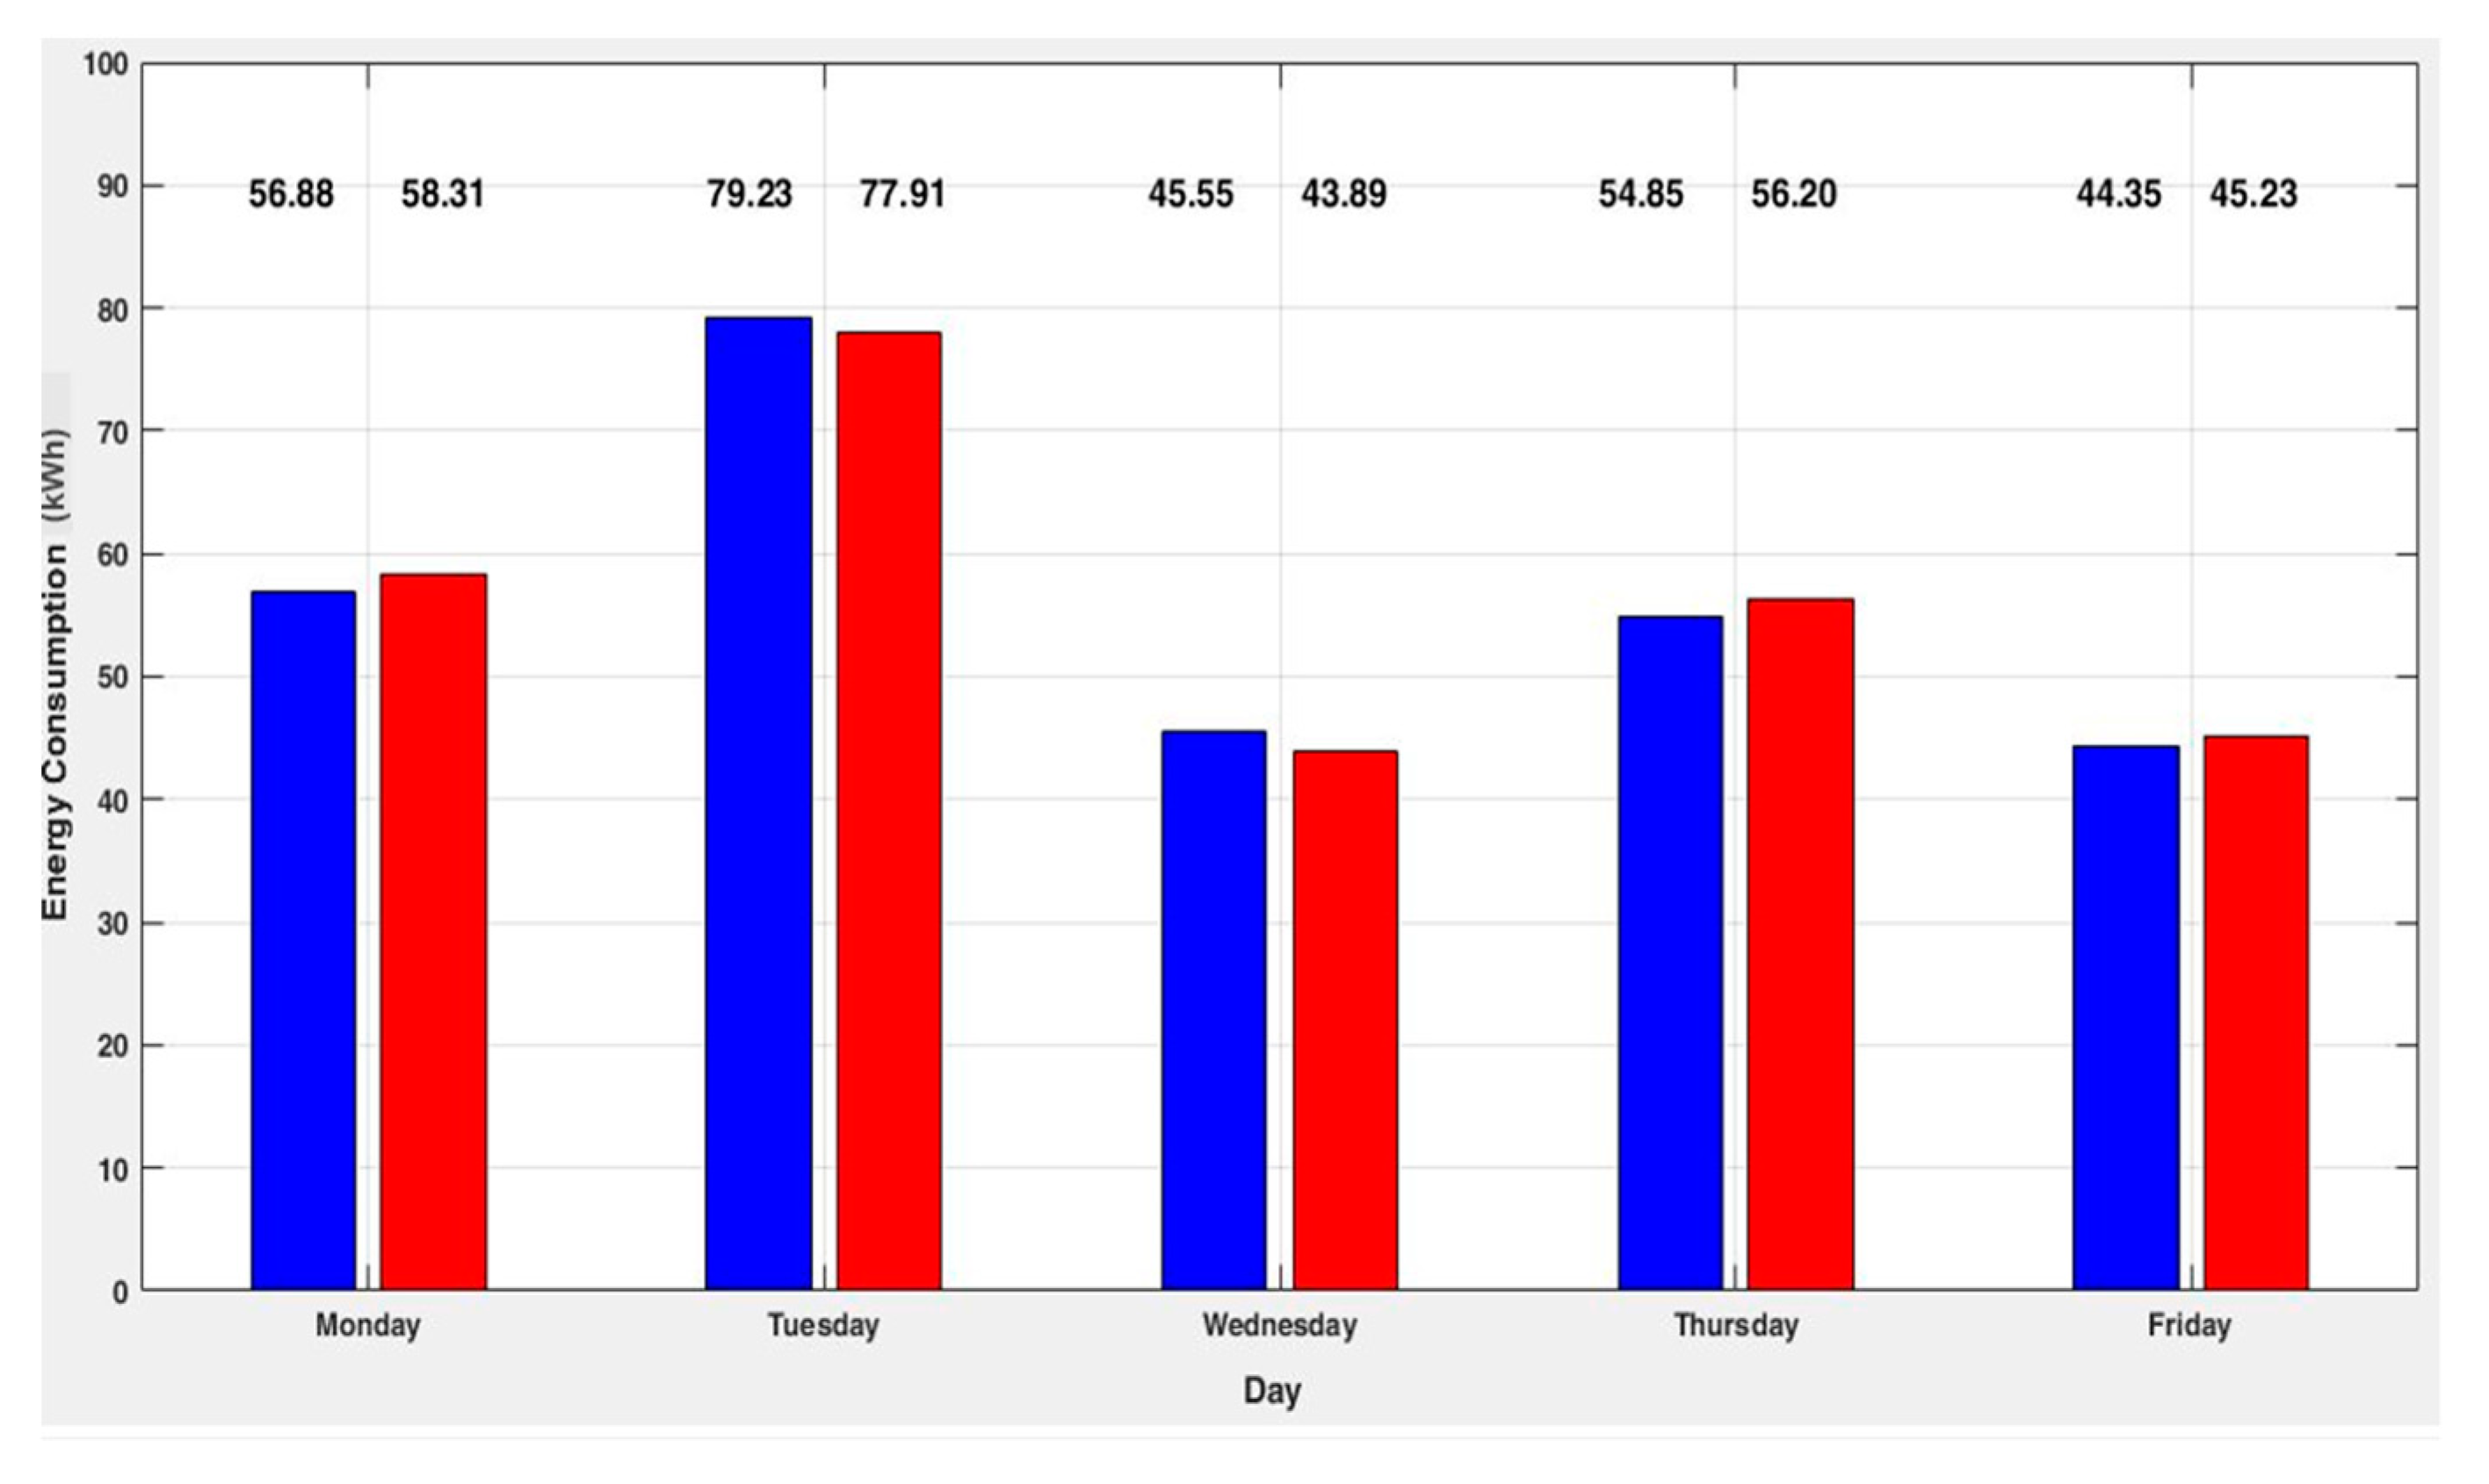
Table 9 present the results obtained after testing of the method for a week (16–20 September, where the activity type and the percentage errors are specified. The errors were calculated with the relation:
where
WR is the real energy consumption and
Wf is the forecasted energy consumption.
It can be observed that the percentage errors are in the range [1.95, 3.80], and the mean absolute percentage error calculated on the analysed period (a week) is 0.24%. These values can be considered very satisfactory for the Decision-Maker in the situation in which the evolution of the activities associated with the technological process is dynamic and uncertainties regarding the execution of specific operations, such as tinsmith and mechanical repairs for each programmed car, can occur. Details about the energy consumption forecasting for the day with the medium intensity of the activity, highlighted with bold in
Table 9, are presented in
Table 10, where the grey cells belong to the Decision-Making Matrix (DMM), and the signification of the rules associated with the expert system being:
The specific (for each equipment and installation) and total energy consumptions forecasted for Tuesday are highlighted with bold. The results obtained for the other days are presented in
Table A3,
Table A4,
Table A5 and
Table A6,
Appendix A.
4.5. Production Scheduling
The production scheduling for the next day is established by the Decision-Maker to flatten the energy consumption profile. The combinatorial optimization is used to achieve this objective considering the constraints presented in
Section 3.5: the appropriate allocation of the equipment or installations to each activity associated with a technological flow, the working time of each equipment or installation, the phase sequences, and energy consumption balance.
The input data used in the optimization process are the following: the decision on the operating mode (on or off, quantified by 1 or 0), working time (reduced, normal, or long), see
Table 8, working cycles (1, 2, or 3), the dependency between equipment, the start and stop working hours, and technical characteristics, see
Table 3, which characterize every equipment and installation associated to each activity.
Table 11 presents the input data for the equipment and installations from Tuesday (presented in
Section 4.4). The activities programmed in this day required mechanical revisions for three cars, dyeing and drying operations for various components of two cars, mechanical repairs for two cars requiring welding and sheet metal straightening operations, and dyeing preparation for three cars. The optimal solution, presented in
Table 12 and
Figure 16, has been accepted by the Decision-Maker to ensure continuity of the technological flow.
Table 10 presents the dependence between dyeing operation, drying operation, and the use of the lighting system associated with the dyeing installation. The order inside of the dyeing installation must be the following: use of lighting system to prepare the car inside, dyeing operation, and drying operation. Usually, for the first use of the dyeing installation, preparing the car is done at the end of the working schedule from the previous day. The dependency expresses the association with one equipment or installation identified through the number of the row in the matrix IDM.
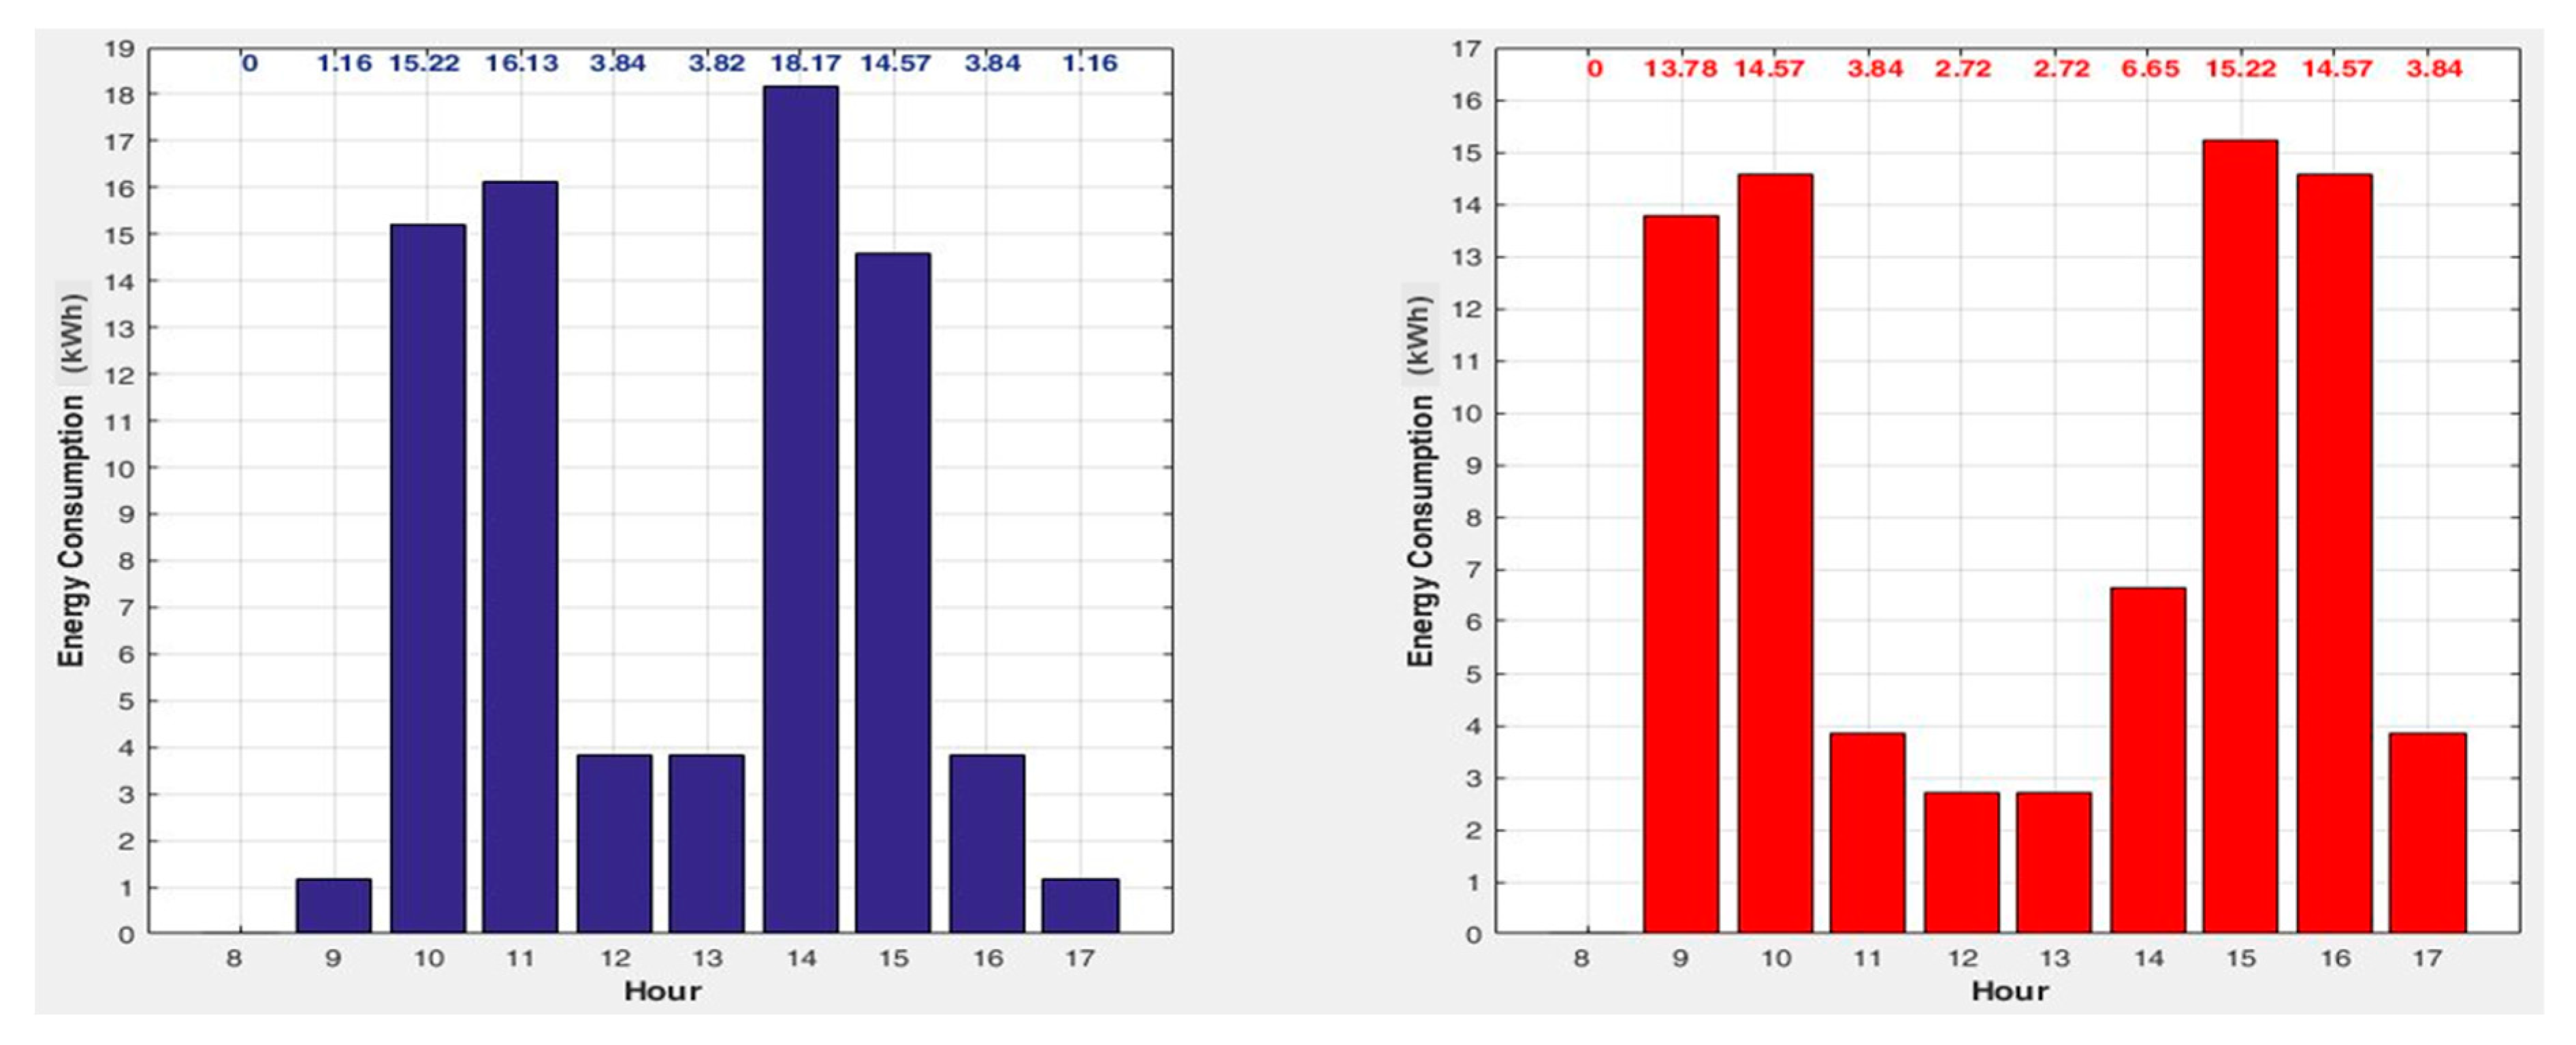
Due to the high energy consumption of dyeing installation and the smaller energy consumptions of other equipment and installations, the flattening of the profile is not very obvious at first glance. However, the analysis of the results presented in
Figure 16 and
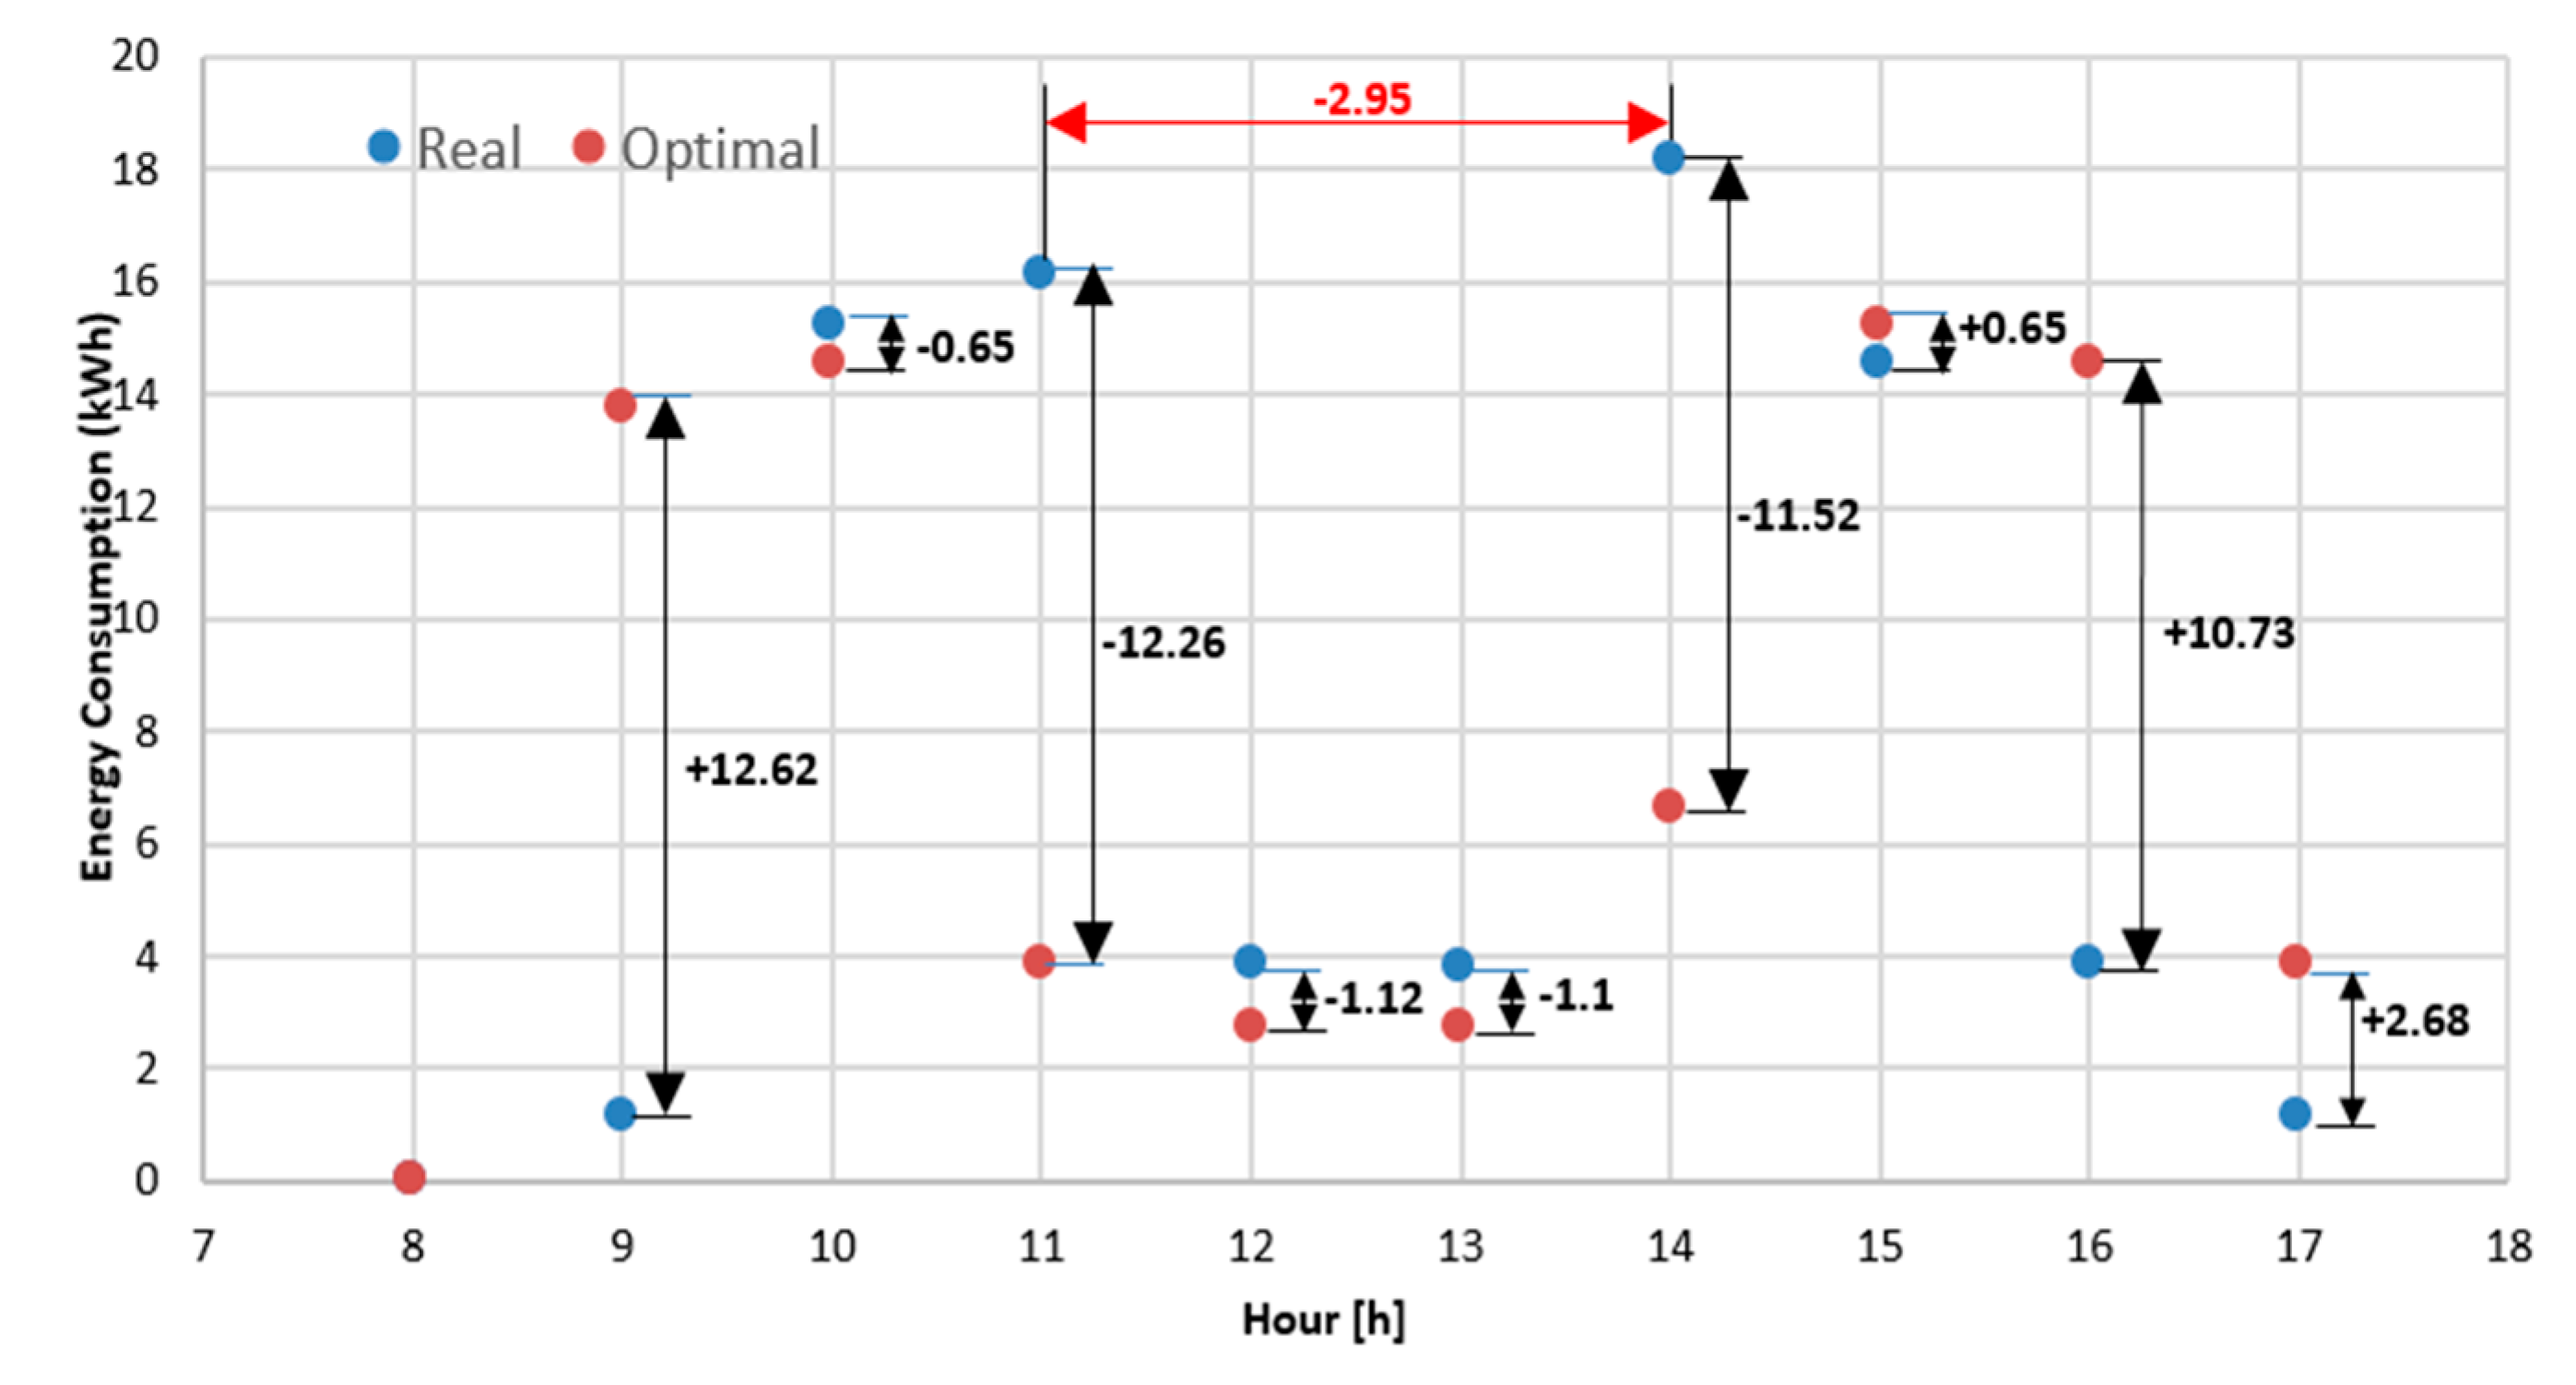
Figure 17 indicates a satisfactory decrease, with 2.95 kWh (16.23%) of the peak value (highlighted with red colour in
Figure 17) from 18.17 kWh (recorded at the hour 14) to 15.22 kWh (recorded at the hour 15), after application of the optimization process.
In addition, the standard deviation of the energy consumption and the load factor can quantify the flattening of the energy consumption profile. Regarding the standard deviation, a decrease was recorded from 7.13 to 5.70 kWh. The load factor expresses a measure of the utilization rate, or efficiency of energy usage, being an indicator that quantifies how steady the energy consumption is over time. It represents the mean value of the energy consumption divided by the maximum energy consumption in a specified period (in our case, 1 day). The value of this indicator increased with 21.4%, from 0.42 to 0.51.
5. Conclusions and Future Work
Supporting SMEs and the promotion of energy efficiency measures are essential for economic progress because, at the level of the European Union, the SMEs represent 98% of the total number of businesses. Many SMEs have expressed in the last period their interest in the implementation of measures to reduce energy consumption because the energy efficiency is not only a tool to save money and resources but also a need for flexible adaptation to the own needs. The SMEs have needed to implement this plan by software tools to monitor and control the consumption and to identify solutions that allow the adoption of measures to increase energy efficiency.
This paper presents a new vision on the energy consumption management at the SMEs, integrated into a decision support platform, with technical and economic benefits on increasing energy efficiency. The proposed platform has four modules which include Artificial Intelligence techniques (clustering-based unsupervised learning and expert systems) with characteristics that differentiate it and offer more advantages compared to the other similar products or approaches which treated the energy management at the SMEs: (i) The data management module is based on the data mining techniques that extract the technical details on the energy consumptions and cost used to develop production scheduling strategies. (ii) The profiling module uses an efficient profiling-based method based on clustering techniques to determine the typical energy consumption profiles (TECPs) assigned to different activity types necessary for establishing the type of tariffs that will lead to the reduction of energy bills and optimally planning of the activities. (iii) The forecasting module has implemented an original approach that uses an expert system based on the rules If-Then to forecast the energy consumption of each installation and equipment. The total energy consumption at the SME level is forecasted by aggregating all individual energy consumptions of the equipment and installations. (iv) The production scheduling module allows the flattening of the energy consumption profiles, using a fast searching algorithm to find the optimal solutions.
The platform can be successfully implemented, but with possible disadvantages (limitations) in the use of the platform at the maximum potential by some SMEs. The first refers to the profiling module, which can be used only if the SME has a smart meter with remote communication. The second is associated with the expert system, where the rules must be developed by qualified staff in energy management. The staff must know the technological processes, the operating regimes, and the characteristics of each equipment and installation very well. The third is linked by the forecasting module, where the same qualified staff must analyse the data from the current and measurements to determine the working times and associated energy consumptions. However, as stated, these three disadvantages are minimized by a qualified human resource, which can ensure efficient energy management to the SMEs using all functions of the platform.
The proposed decision support platform was tested at a small enterprise from Romania with the activity field of the repair of the vehicles. The obtained results demonstrate the ability of the platform to offer the support to the Decision-Maker in solving or understanding the following issues: the planning strategies of the SME based on the evolution of the energy consumption, the intensity of activities through the TECPs, the energy consumption forecasting for different periods (day, week, or month) depending on the scheduled activities, and the production scheduling such that the energy consumption profile to be as flat as possible.
The authors work to develop the decision support platform’s functions, considering the particularities of the activities carried out at other SMEs, especially at the forecasting module, testing new methods which to consider the influence of the weather and economic factors, and at the production scheduling module through improving the mathematical model and testing new optimization algorithms.
Another direction considered by the authors refers to develop a new mathematical model which have the objective of the minimization of the energy cost considering the tariff differentiated by hourly zones and durations of energy use. This new model will be integrated into the production scheduling module, being useful for SMEs which have a schedule in three work shifts.
Additionally, the platform can support the implementation of the ISO 50001 standard through developing a new module, which to establish a link between improving energy efficiency, quantified through the results obtained using the other modules, and environmental impact reduction. Through identification of differences between the full application of the requirements from the ISO 50001 standard and the real level of implementation, the platform could provide a compact perspective on how energy management can be implemented in SMEs. In this context, the monitoring and control of energy efficiency indicators at the SME level lead to saving energy amounts and, consequently, to the reduction of greenhouse gas emissions, as the authors pointed in [
58].


