1. Introduction
Armed conflicts all over the world cover sea areas. Sea transport has always been, and will be the target of terrorists or pirates, whose activity is only increasing. These facts have significantly influenced the design of new ships and maritime facilities, as well as the modernization of existing ones by the need to protect these facilities against the effects of impact from non-contact underwater explosions, e.g., a sea mine, torpedo or IED (Improvised Explosive Device). Marine mines and torpedoes—depending on the purpose and manner of detonation of the explosive charge—affect the structure of ships in different ways. The explosion generated can generally be divided into contact and non-contact; the latter can be further divided into near- and far-proximity explosions. The effects of these impacts may be different and depend on many factors, such as the mass of the explosive charge, the distance of the hull from the explosion epicenter, the size of the unit and its structure, location of the explosion (prow, midship, stern, starboard, port side), detonation depth, reflection of the detonation wave from the bottom and many other factors. Each explosion gives high value accelerations to the naval ship’s construction, due to which mass forces deform and break the planking, along with the mechanisms.
Contact explosions occur when the immersed part of the ship’s hull is in the gas bubble impact zone. Hence, regardless of the amount of explosive charge, detonation occurs at a distance of 0 to 12 m. Most often, it is an explosion directly on the hull’s planking, caused by a contact fuse or inertia fuse as a result of torpedo hits or mines on a ship. For a small, single-compartment vessel, this explosion usually ends in the ship’s sinking. On the other hand, a multi-compartment vessel can maintain buoyancy and stability after such explosion. A contact explosion from a 100–200 kg trinitrotoluene (TNT) mine pierces a hole in a steel surface ship with a radius of one to three meters. In larger radii of up to 10 m, there is a destruction of mechanisms, installations and pipelines, cracks in the device housings, breakage of foundation bolts. A strong impact can be sensed on the entire ship’s structure. Gases and high-temperature explosion products flow into the ship’s hole, causing greater damage. Mid-sized units may even break in the place of explosion. In the event of explosion in the bow section, the ship will rotate around the axis, passing through the stern and vice versa. In the event of an explosion in the stern section, the ship will rotate around the axis passing through its bow. The effects of contact explosions, even for large units, are very serious, and if the unit is good enough to undergo renovation, it will be out-of-order for many months [
1,
2]. If a floating mine contacts the hull (collision with a drifting mine), then the destruction of the ship is lesser, as most of the explosion energy is dispersed into the air, and the explosion hole has a smaller diameter. In this case, the ship should not break and sink. It can maintain mobility, and after shipyard repairs, can be further used.
If the explosion takes place at some distance from the ship’s hull making, and the gas bubble does not touch the ship’s planking, then we refer to this as a non-contact explosion. In this case, only the pressure wave acts on the ship’s hull. A close-field (close-proximity) explosion at a distance of 2–20 m with a pressure acting on the hull above eight megapascals cause the hull’s piercing. In such cases, the piercings usually have a linear character, and follow along the plating braced structures such as frames and girders. As the gas bubble is not in contact with the ship, the products of explosion do not penetrate into it, and there is no direct interaction of high temperature. Mechanisms and devices are usually displaced and ripped off foundations, and their housings are damaged. With a close-proximity non-contact explosion, the damage zone is much larger than in the case of a contact explosion [
1]. The pressure wave acting on the hull creates a bulge, the direction of which follows the pulsation of the gas bubble. The greatest damage is caused by explosions located under the keel amidship. Explosions in the near proximity of the bow and stern usually do not cause sinking of the vessel.
Detonations of mines more than 30 m from the ship’s hull are classified as far-field (far-proximity) non-contact explosions. The location of the explosion (bow, midship, stern) does not have such a big impact on its effects as in the case of a near-field explosion. In case of distant explosions, the hull plating does not break, but it may deform into a dent. The pressure wave falling on the hull gives high acceleration values to structural nodes that lead to damage to devices and mechanisms. The area of damage is very extensive, which practically covers the entire unit, but the difference is that the biggest damage is done in the vicinity of the hull’s immersed part on the explosion side.
The most sensitive devices susceptible to the impact of high accelerations are electrical devices, switchgears, switches, electronics, etc. These damages can eliminate the unit from motion, but the crew should manage to bring the ship to port. Ship refurbishment and repairs are inevitable, but with proper ship design, the effects of near-proximity non-contact explosions can be minimized. This is important when designing warships, especially such as minesweepers and mine counter measure vessels, which due to their purpose must be able to survive multiple impacts of far-proximity underwater explosions [
3].
The development of computational techniques and computer hardware has covered the analysis of short-term (fast-changing) processes. Currently, there are many possibilities of performing calculations related to underwater explosions using CAE (Computer Aided Engineering) programs such as Abaqus, Ansys, Nastran, etc. These are complex issues and each task should be treated individually. The task is much more complicated when taking into account the interaction of the environment with the tested structure. The ship is in two environments: water and air. In analyzes, it requires the solution of a double coupled task using, e.g., finite element methods and boundary element methods (BEM). The boundary element method allows the solution of differential equations at the edge of the test area, e.g., water surface. The finite element method is a volumetric method that allows you to study the behavior of a structure. The combination of BEM and FEM (Finite Element Method) with contact procedure between them makes it possible to solve coupled tasks related to underwater explosion. Solutions at the edge of a given medium, e.g., liquids, are input data being the load on a structure that undergoes deformation, which affects the surrounding medium. Such mutual couplings are repeated
n times and at each step of the data exchange it is necessary to obtain the appropriate convergence of results. The problem is complicated due to numerous nonlinearities associated, e.g., with plastic deformation of the material, its destruction, etc. By analyzing the strength of the designed object, using appropriate simplifications, it is possible to apply classic structure analysis without solving the coupled task. Such a task may be the impact of a pressure wave on the ship’s hull if the wave parameters can be determined directly on the structure being tested. For steel structures, such as a ship, it is assumed that if its hull withstands direct pressure on the wave front, it will also withstand further loads resulting from the impact of the environment or other accompanying phenomena such as pulsation or reflected wave [
3,
4,
5,
6].
If the task is formulated to assess whether the tested structure is able to withstand the given load, without considering the damage, then the step-by-step integration method can be used. This task can be solved by using the matrix equation of motion in the form [
3,
7]:
where:
K—stiffness matrix;
M—inertia matrix;
C—dumping matrix;
—vector of displacement, velocity and acceleration;
F—load vector.
The mathematical model of underwater explosion is very complex. Two types of underwater explosions are distinguished as far as computing capabilities are concerned. In the first case, the charge is placed very close to the hull, so it is within the range of the gas bubble. The effects of such explosion can be estimated on the basis of statistics, but it is difficult to examine them using calculation methods. In the second case, the hull is beyond the reach of the gas bubble, and is under the influence of a pressure wave moving within the fluid. The weight of the charge in small mines and torpedo heads is in the range of 100–300 kg, in medium ones up to 500 kg (the largest 800–1350 kg), so for those small and medium mines in near surface explosion at a distance of more than 12 m, the ship’s hull is beyond the reach of the gas bubble. In such case, when only the pressure wave acts on the ship’s hull, the pressure load can be determined on the basis of empirical formulas given by numerous authors. These formulas were elaborated on the basis of measurements and results of field tests. Selected formulas are presented in this manuscript.
2. Underwater Explosion
An explosion can be defined as a rapid increase in volume, and a release of kinetic energy or potential energy. The explosion generates a blast pressure wave or shock wave, high temperature and release of gases, in conjunction with loud and sharp sounds caused by the incidents that are associated with the occurrence of each explosion phenomena [
7,
8,
9]. It is also a process of rapid burning with increasing pressure occurring in fractions of a millisecond [
10,
11,
12,
13]. The nature of this process is determined by the dynamic conditions in which the flammable mixture is found, in particular the turbulence of the medium. Pressure waves called the shock wave arising during an explosion in liquids (underwater explosion) or in solids reach up to 8000 m/s in the case of detonation. It is also worth differentiating between other processes that may occur during the initiation of an explosive charge.
Due to the speed of the reaction, a distinction is made between combustion, deflagration and detonation. Normal combustion is a process with a propagation velocity of the order of mm/s, for deflagration they are m/s, and for detonation—km/s [
3,
14]. After reaching the propagation speed > 1000 m/s, deflagration goes into the so-called low order detonation, and at speeds > 5000 m/s is referred to as high order detonation [
15]. The transition of deflagration to detonation is accompanied by a change in mechanism: from a process driven by heat to driven by a shock wave [
16]. Deflagration occurs on the surface and in a uniform manner, its driving force is generated heat, and the speed of the process depends on the thermal conductivity of the material [
17,
18]. The direction of propagation of reaction products is opposite to the direction of reaction propagation (these directions are consistent during detonation). Deflagration of the explosive occurs much more rapidly than the combustion of ordinary combustible material, accompanied by a flame or sparks and clear sound effects. It is the basic explosive transformation of propellants (gunpowder). It can run without air [
14,
15,
16].
The product of the underwater explosion is also overpressure, which, depending on the mass of the load reaches a value of 1 to 10,000 MPa. Before the arrival of the shock wave front, the pressure is equal to the hydrostatic pressure of the liquid. With the arrival of the wave front, the pressure increases rapidly up to a maximum value, called peak positive overpressure. The pressure then drops to its original pressure (
Figure 1). The period of further pressure drop and its return to hydrostatic pressure is called the negative phase period. Important parameters of the whole process are the maximum value of overpressure and the area under the function describing the pressure dependence on time during the positive phase. The nature and mechanism of the explosion decide many parameters, which include [
19]:
Material properties (physical, chemical, stability, heat of combustion, etc.);
Space where combustion occurs (size, open, closed, obstacles, etc.);
Properties of the explosive mixture (concentration, pressure and temperature);
Ignition method (energy, temperature).
2.1. Gas Bubble
Another significant phenomenon always created during an underwater explosion is a gas bubble. It contains a mixture of explosive gases that fill the volume of the explosive prior to detonation. In the initial phase, these highly compressed gases expand until the hydrostatic pressure of the water resists its inertia, causing it to shrink. This is called pulsation. The duration of pulsation depends on the mass of the explosive
m and the depth of detonation
H and is described by the relationship [
1,
10]:
where:
m—explosive mass, kg
H—depth, m
The pulsation continues until the bubble comes to the surface. The second pulsation time is about 70% and the third about 50% of the first pulsation [
1].
An important parameter that classifies the type of explosion is the gas bubble radius. If the gas bubble is in contact with the hull surface we are talking about a close contact explosion. The effects of such explosion are difficult to predict and calculate using numerical methods. For this reason, most publications refer to non-contact explosions. However, there are some empirical formulas that allow to calculate the diameter of a gas bubble formed after the explosion. The maximum radius of the first pulsation gas bubble describes the relationship [
1]:
Based on Formula (3), the gas bubble radius was calculated depending on the depth of detonation. The results are shown in
Figure 2.
The graph (
Figure 2) shows that at a shallower depth than 10 m, the bubble radius exceeds the depth of detonation, which leads to the release of explosive gases into the atmosphere. In addition, even for an explosive charge of 500 kg at the same depth, the gas bubble does not exceed 10 m. This leads to the conclusion that detonating a charge at a distance of more than 10 m, there is a non-contact explosion, regardless of explosives mass. In this case, only the shock wave impact and waveform are considered. It is worth noting that some torpedoes are characterized by the minimum detonation depth parameter, resulting from this underwater explosion property [
20]. If torpedo detonates at a shallower depth, the gas bubble will reach the surface of the water practically immediately after the detonation, which will direct the explosion energy towards the surface and reduce its energy due to the shorter contact time with the aquatic environment and jet phenomenon [
9,
21]. A bubble oscillation close to the free surface creates a free surface spike. This phenomenon have been widely examined by [
21,
22,
23,
24,
25]. According to experiments, the maximum height of the spray dome is significantly related to the charge and initial depth of the explosive. The empirical formulas for the maximum height of the spray dome formed by a relatively shallow underwater explosion caused by TNT explosive were proposed by [
24,
25]:
where
m is the charge mass (kg),
Ymax represents the maximum height of the spray dome (m) and
H is the detonation depth (m).
2.2. Pressure Wave
The expanding gas bubble acts on the surrounding water layer, creating a spherical shock wave. In the initial phase, shockwave travels at a speed of
v ≈ 5000–8000 m/s. Then the water molecules act on the adjacent layers of water, losing their speed and move further at the sound of speed in water, which value reaches about
co = 1500 m/s. The pressure wave profile and its value have been described by many researchers. The main of them is R.H. Cole, whose publications form the basis of most research on the subject. The problem is also described by other authors [
1,
10,
26,
27,
28,
29]
Underwater explosion phenomena is wide field of study with deeper aspects to be considered, some of its basic yet most important parameters are hereby summarized and briefly explained, intending to allow the comprehension of fundamental notions of the subject based on a literature survey. The article attempts to collect most of the descriptions of various researchers and implement them for CAE (Computer Aided Engineering) purposes. A similar approach has been proposed in [
30].
Table 1 presents formulas necessary to calculate shock waves caused by underwater TNT explosion pressure values and their waveforms. Knowledge of the waveforms shown in
Figure 3 allows the total shock wave energy to be calculated. The energy value is important due to the fact that short-term blast damage depends not only on overpressure, but also on positive phase duration. It is also important that the descriptions refer only to the positive pressure pulse wave, excluding the negative pressure phase and pulsation. However, in the methodology of calculations related to the strength analysis of warships [
4,
5], it is assumed that if a ship withstands the first shock wave, she will be able to survive the subsequent ones caused by pulsations. For this reason, this manuscript refers only to the description of the first pressure wave caused by an underwater explosion. The course of the pressure wave over the years has been studied by various researchers. On the basis of empirical research, they developed formulas (
Table 1) for pressure values on the shock wave front
pmax and its time course
p (t), which depend mainly on:
m—charge mass, kg (some formulas refer to the diameter of the explosive charge—ac)
r—distance from epicenter, m
θ—exponent time constant, ms
t—time, ms
The differences in the formulas in the
Table 1 most often result from the study of explosions caused by different-sized explosives. For example, Cole studied explosives in the 70–136 kg range at a depth of 3–10 m while Geers & Hunters based their mathematical descriptions mainly on Swift and Decius [
33] studies, which tested explosive charges in the range 0.2 kg to 5.4 kg at a depth 76–152 m. The detonation of various explosives took place at different depths, which may cause discrepancies. Unfortunately, not all researchers provide the exact parameters of their research, so when using the mathematical description of the pressure wave, the awareness of these differences should be preserved.
Pressure calculations use numerous simplifications that most often involve replacing the real exponential waveform with a triangular or trapezoidal waveform (
Figure 4). Using simplifications, the pressure pulse value should be kept according to the formula:
where:
p(
t)—pressure wave function, Pa (
Table 1)
t+—time of the first positive pressure wave pulse, s
γh—hydrostatic pressure, Pa
Using the equation for a pressure pulse (5), the energy carried by a shock wave can be compared and evaluated. By calculating the area under the curve, it is possible to determine the equivalent pressure of the shock wave described by various authors. Referring to the waveforms presented in
Figure 3, the
I+ value was calculated for the considered pressure waves in the 0–2 ms time range (
Figure 5). Based on these calculations, differences between individual descriptions of pressure waves can be assessed. In this case, most calculations (except Ming) results with similar shock wave maximum pressure
pmax (7–8 MPa), but the total energy carried by the explosion differed in some cases more than twice. This means that depending on the adopted shock wave model, different strength results of marine structures can be obtained despite similar pressure on the shock wave front. The above considerations should be taken into account in cases related to strength calculations of marine structures.
Another important aspect is the decrease in the shock wave pressure due to the increase of distance. According to the equations given in
Table 1, it can be calculated how the shock wave pressure values changes while increasing the distance from the detonation epicenter. Based on the graph (
Figure 6), it can be concluded that for the strength analysis of the marine structures, the distance from the epicenter of the explosion is more important than the mass of the explosive. The graph also shows how rapidly the pressure drops as the distance increases.
For the strength analysis of the marine structures, simplified detonation wave models are adopted, in which the negative pressure phase and subsequent pulsations are most often not taken into account. This approach is especially valid for high-strength structures, such as ships made of materials with increased strength. It is assumed that if the ship’s structure and hers mechanisms survive the first phase of load, she will survive subsequent phases with significantly lower shock wave parameters [
4,
5].
3. Impact of Pressure Wave on a Ship Structure
The formulas described in
Table 1 make it possible to determine the pressure value on the shock wave front in water as a function of distance from the detonation epicenter, charge mass and time. Taking into account the angle of incidence of the shock wave on the structure, it is possible to calculate the load on the structure at discrete time moments. This approach can be directly implemented in the CAE program. Empirical formulas shows that the explosion is a rapid process, therefore, in numerical calculations of a discrete nature, it is necessary to select an appropriately “small” time step, which will allow to reflect the entire history of the structure load. The time appearing in the formulas is counted from the moment of the wave pressure occurrence at a given point in space, it does not take into account the time of wave transition from the epicenter. After taking into account the speed of propagation of the pressure wave in water, for a unit of significant length, a different load history is obtained.
Determining the load for a given structure element, the time appearing in the formulas given in
Table 1 should be shifted by the value of
tr which is:
where:
tr—time when the pressure wave reaches the given element of the structure, s
r—distance to given place of the structure, m
co—sound speed in surrounding medium, m/s
For example, if 250 kg TNT is detonated, at a depth of 15 m from a distance of 20 m in front of the mine destroyer’s bow (206FM project), she will be loaded with a pressure wave of 11 MPa, which decreases along the ship to a value of 3 MPa (
Figure 7). The total load duration on the ship’s structure is 0.0376 s [
34].
For the same load, detonated at a depth of 15 m from a distance of 20 m on a traverse, the maximum shock wave pressure reaches 11 MPa amidships and decreases along the ship to 5.9 MPa at the bow and stern. The total load duration on the ship’s structure is more than half shorter and equals 0.0124 s.
Using finite element method requires the examined structure division into mesh elements. Each element is loaded with a different pressure value at different angles. To be able to take into account the angle of incidence of a shock wave on a given FEM element (
Figure 8), it is necessary to determine two vectors: a normal vector for element n and a pressure wave vector R, which begins at the epicenter of the explosion
K and ends in the middle of the structure element
S.
The pressure value changes depending on the angle of incidence on the object (
Figure 8), therefore:
hence:
The time difference between the first contact of the pulse with the surface and the subsequent contact with the structure depending on the incidence angle is equal:
The pressure drop depending on the angle of incidence from Cole’s formula equals:
If the examined object is relatively small in relation to the distance from the epicenter, it can be assumed that the radius of curvature is large enough to model the wave as flat.
4. Liquid (Acoustic) Medium Model in CAE Programs
In numerous CAE programs, a standard fluid (acoustic) medium model enabling modeling of pressure wave propagation from an explosion of a given material was adopted. The basic equation of equilibrium of a compressible, inviscid fluid medium that undergoes small deformations and has the ability of internal damping for external forces is presented in the form [
17,
18,
35]:
where:
p(x, y, z, t)—acoustic pressure, Pa
—fluid particle velocity component, m/s
—fluid particle acceleration component, m/s2
ρf—fluid density, kg/m3
γ—is the “volumetric drag” (force per unit volume per velocity), kg/m3 s
The constitutive behavior of the fluid is assumed to be inviscid, linear and compressible is given by equation:
bulk modulus of the fluid, Pa
V—volume, m3
The fluid medium (acoustic) is divided into areas in which the pressure wave is described by various equations, more widely presented in the documentation [
17,
18]. For the purpose of its description, the vector n is defined, as normal to the edge of the medium directed to its interior. The acoustic pressure should also be defined as the time-varying deviation from the average value of the hydrostatic pressure in the medium that occurs when the shock wave propagates in it. Then the medium can be divided into the following subregions (
Figure 9):
Sfp—surface (region) on which the acoustic pressure is defined. For calculations related to underwater explosion, the pressure value and the shape of the shock wave should be defined in accordance with the relations given by R. H. Cole, Geers and Hunter, etc. It can be also determined on the basis of own experiment;
Sfs—the contact surface of the fluid and the structure immersed in it, on it there is an equal value of normal accelerations between the structure and the fluid, which is defined in the form:
where
is an acceleration vector of structure;
Sfr—on this surface, the energy of the acoustic wave is dissipated. It is possible to model the boundary conditions allowing to suppress the wave or allowing it to be completely reflected (for example, from the free surface of the water). By defining this boundary condition, there is no need to model an additional damping layer. Only relevant properties are assigned to the medium. This condition is determined by the linear relationship between the speed of the acoustic particle, the acoustic pressure and the magnitude of its changes:
where:
k—coefficient of elasticity of the damping layer, N/m3
c—damping factor of the damping layer, N∙s/m3;
Sfi—surface that completely absorbs wave energy. For an underwater explosion, it models the further surroundings of the structure (e.g., ocean) and does not allow the wave to bounce off the boundaries of the modeled acoustic medium.
5. Choosing the Proper Mesh Element
Modeling tasks using acoustic elements requires a properly defined shape of elements and mesh density. This has a significant impact on the task size, time and accuracy of calculations. The FEM mesh should be chosen in the right way to reflect the waveform. Otherwise, the wave may be omitted in the calculation. A large variety of finite elements allows you to define the acoustic medium in the right way to get the results most similar to reality [
1].
Analyzing the available literature and documentation [
17,
18,
36,
37], it can be stated that for elements with linear shape functions, it is recommended to take their size at least six times smaller than the wavelength, while for square functions the element size should be taken about three times smaller than the wavelength. Calculations related to underwater explosions should be made using square shape functions. The length of the shock wave necessary to determine the size of the element can be determined by the relationship:
where:
co—sound speed in medium, m/s
ti—time of the pressure pulse, s
However, during an underwater explosion, acoustic elements interact with structural elements. Then numerous wave reflections are created that can interfere with each other. In this case, it is difficult to determine the length of the newly formed wave. The density of finite elements should then be selected by subsequent iterations [
3].
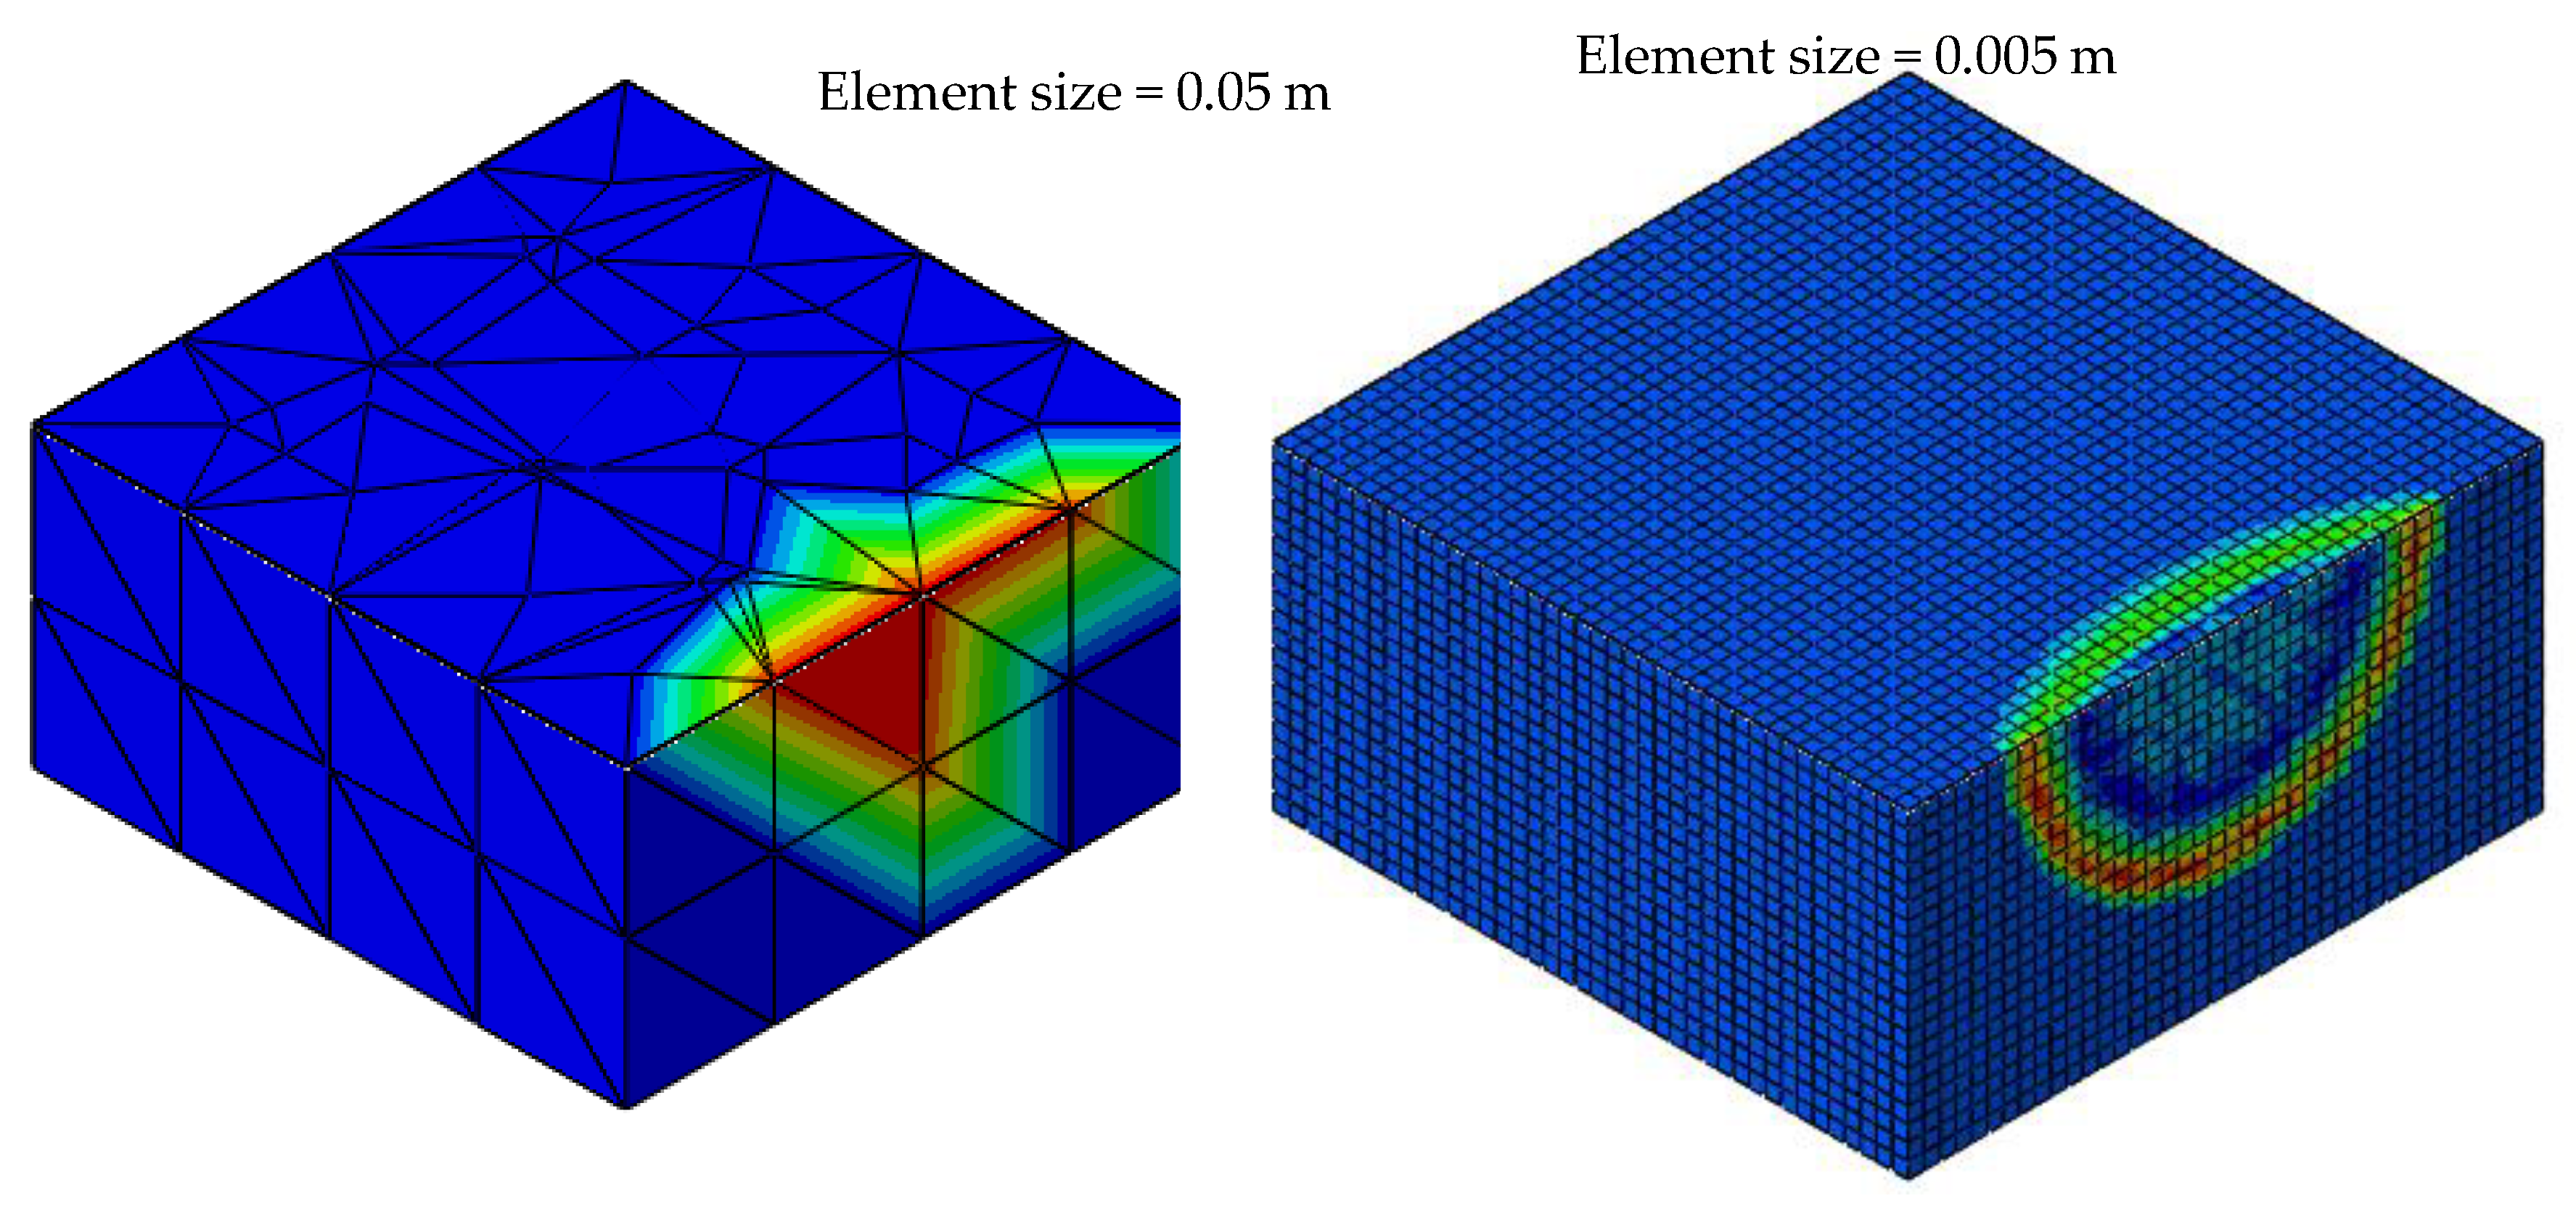
The study analyzes how the size and type of the FEM element affects pressure values and the pressure pulse waveform. For this purpose, the cubic geometry of the acoustic medium with a length of 0.4 m was modeled (
Figure 10). Then, using the formula for the pressure waveform developed by Geers & Hunter, the acoustic medium was loaded with the shock wave. During the research, the mesh density and shape functions of FEM elements were changed to check the impact of these changes on the incident wave. Acoustic medium were modeled using the AC3D8R (3D acoustic hexagonal 8-nodes) elements and the AC3D4 (3D acoustic tetragonal 4-nodes) elements of various sizes. It was checked how the mesh density change in the range from 5 m to 0.005 m affects the mapping of the incident wave load on acoustic medium. Some of the analysis results are presented in charts (
Figure 11 and
Figure 12).
Figure 11 shows pressure waves simulated as a 100 kg TNT underwater explosion incident on various FEM elements 10 m away from the epicenter. A comparison of the incident wave on the hexagonal and tetragonal mesh with a density of 0.1 m is presented. The graph shows that in both cases the pressure waveform is significantly disturbed. Maximum pressure value according to the mathematical model has not been reached. In addition, the wave was distributed in time, which ceased to be a pressure impulse. The difference can also be seen depending on the type of FEM element used. For hexagonal elements, the wave is significantly flattened, and the maximum pressure is underestimated more than for tetragonal elements. In both cases, the pressure wave was not reflected satisfactorily. This means that in strength calculations using a mesh with a density greater than 0.1 m, the structure may be loaded with incorrect pressure. It is worth noting that despite loading only by the positive phase pressure pulse, a negative phase also appeared in the FEM mapping, which is a desirable effect for this type of phenomenon.
Figure 12 presents a comparison of the incident wave and its mapping by 0.005 m hexagonal and tetragonal elements. In analyzing the chart, it can be noticed that both the maximum value of the incident pressure and its time course is preserved. In the case of tetragonal elements, the pressure in the acoustic medium is even higher than the incident wave. The most accurate wave mapping was obtained by using a FEM hexagonal mesh with a density of 0.005 m. Further reduction of the mesh size causes a significant increase in the calculation time; however, it does not affect the results obtained. In this case, a negative phase was also noted in the response of the acoustic medium.
It was also analyzed how the shape and size of elements affect the nature of the incident wave. Too large finite elements cause inaccurate reflection of the spherical wave and blur of its value due to too few number of nodes (
Figure 13). It was also checked how the maximum pressure value changes as a function of distance from the epicenter. It was noticed that the pressure drop as a function of distance is also greater than in the analytical solution.
Based on the analysis, it was found that the shockwave is most accurately mapped by a 0.005 m AC3D8R (3D acoustic hexagonal 8-nodes) elements. Further reducing the element size significantly increases the calculation time. The problem in the application of hexagonal elements for calculations related to underwater explosions, may be the difficulty in modeling their contact with the fairly complicated ship’s hull geometry. Therefore, from the engineer’s point of view, it is simpler to use 0.005 m AC3D4 (3D acoustic tetragonal) elements, which represent pressure pulse value is worse, but significantly simplify modeling and ensure optimal calculation time.
6. Summary
The article presents the description of pressure waves caused by the explosion of TNT interacting with the object immersed in water. The first research on the phenomenon dates back to 1948. Since then, mathematical models of the explosion have been developed by various researchers, thanks to the use of newer research techniques. Based on this research, many mathematical descriptions of the gas bubble, jet phenomenon and pressure wave caused by underwater explosions have been developed. The latter is extremely important from the point of view of calculations of the strength of marine structures exposed to such explosions.
Currently, CAE programs contain ready UNDEX procedures (underwater explosion), which allow seemingly simple modeling of such complex phenomena [
38,
39]. Most of them have introduced a ready-to-use calculation procedure in which the mass and type of explosive are given. Then the program calculates the pressure itself using one of the formulas shown in the
Table 1. However, engineers performing calculations in this area should be aware of the course and complexity of the entire underwater explosion phenomenon in order to analytically verify FEM calculations. Ignorance of the whole phenomenon may lead to oversizing of the structure, which may be economically unjustified.
In addition, some differences were found between the descriptions of underwater explosions. To compare the descriptions with each other, I+ values were compared. On their basis, it was noticed that despite similar pressure on the shock wave front, the total energy of the shock wave differs significantly, which affects the load on the tested structure. Due to the complexity of the explosion phenomenon, as well as its unpredictability, it is very important to make those calculation as much as possible close to reality.
It was also checked how the MES mesh density affects the shock wave mapping in the acoustic medium. When performing calculations related to the topic, particular attention should be paid to the control of the load as a function of time, to avoid falsifying the results.


