Article

Capturing the Swirling Vortex and the Impact of Ventilation Conditions on Small-Scale Fire Whirls

by
Xiang Fang
1,
Anthony Chun Yin Yuen
2,
Guan Heng Yeoh
2,3,
Eric Wai Ming Lee
4 and
Sherman Chi P. Cheung
1,*
1
School of Engineering, RMIT University, Melbourne, VIC 3083, Australia
2
School of Mechanical and Manufacturing Engineering, University of New South Wales, Sydney, NSW 2033, Australia
3
Australian Nuclear Science and Technology Organisation (ANSTO), PMB 1, Menai, NSW 2234, Australia
4
Department of Architecture and Civil Engineering, City University of Hong Kong, Kowloon, Hong Kong, China
*
Author to whom correspondence should be addressed.
Appl. Sci. 2020, 10(10), 3428; https://doi.org/10.3390/app10103428
Submission received: 12 February 2020 / Revised: 28 April 2020 / Accepted: 12 May 2020 / Published: 15 May 2020
(This article belongs to the Section Civil Engineering)

Abstract

:
The fundamental flow structure and temperature distribution of small-scale fire whirls, including tangential and axial velocities, temperature variation, and air entrainment in the lower boundary layer, were successfully captured using a generic fire field model with large eddy simulation (LES) turbulence closure. Numerical predictions were validated thoroughly against two small-scale experimental measurements, where detailed temperature and velocity distributions were recorded. Good agreement between numerical and experimental results was achieved. Normalization was also performed to compare the numerical predictions with the empirical correlations by Lei et al. (2015) developed from medium-scale fire whirl measurements. The transient development stages of small-scale fire whirls and the impact of air entrainment on the stability of the fire whirls were also investigated based on the validated numerical results. The numerical validations showed the potential of the current LES fire field model in capturing the dynamic behaviour of the fire whirl plume and performing a quantitative analysis on its onset criteria and combustion dynamics in future.

1. Introduction

Fire whirls (also referred to ‘fire devils’) are a distinctive and potentially catastrophic form of fire, which can occur in forest fires, bushfires, or intense fires in large building voids or atrium structures. Unlike normal pool fires, the flame structure of fire whirls is sustained by a swirling vortex core along the axis of the plume [1]. The vortex core could be initiated by certain air entrainment conditions [2] and the upward movement of the heated gases [3]. Due to the circular motion within the core, the turbulent intensity, air entrainment, and the mixing between air and fuel are significantly enhanced, forming an intensified and prolonged flame structure with a burning rate that is several times higher than that of normal pool fires [4]. More importantly, fire whirls emit significant radiant heat that could further ignite surrounding combustibles, causing rapid fire spread and posing great threats to the residences and structures nearby. Due to the complex nature of fire whirls, only a few experimental measurements have been carried out over the past decades [5,6,7,8].
Early experimental studies were carried out to investigate the vorticity strength within fire whirls using a rotating cylindrical screen [9] or by channelling air entrainment [10]. More recently, several small-scale experimental studies have been carried out, attempting to correlate the burning rate and flame length with the size of the fuel bed and type of fuels of fire whirls. Chuah and Kushida [11] demonstrated that the flame height of a fire whirl is proportional to the fuel burning rate by coupling the Burke–Schumann flame with the Burgers vortex theory. Similarly, based on their measurements, Lei et al. [2] derived an empirical equation correlating the flame height with the heat release rate, Richardson number, and axial velocity. Furthermore, by imposing circulation using a rotating screen, Lei et al. [12] demonstrated that fire whirls present a difference in flame shape under a variety of imposed circulation.
These studies focused on the correlation of flame height with flow characteristic parameters for fully developed fire whirls. Through a series of small- and medium-scale internal fire whirl experiments, Chow et al. [13,14,15] identified the four generalized stages in fire whirl development: (i) initial stage, where it resembles a free-standing fire with a relatively short flame height; (ii) flame rising stage, where the circulation motion of entrained air starts to prolong the flame height and intensifies the burning rate; (iii) fully developed stage, where the flame structure, height, and burning reach and stabilize at the maximum level; and (iv) decay stage, where the swirling motion and burning rate of the fire whirl gradually decay due to the limited remaining fuel. Furthermore, Chow and Han [14] also investigated the influence of ventilation width and height on the onset behaviour of fire whirls. The vertical gap width was identified to be the critical factor in flame elongation and the rising of heat release rate. Unfortunately, no measurement of velocity field was conducted in the experimental studies. Only qualitative analyses on the swirling motion of the entrained air were presented. Later, Hartl and Smits [7] presented a comprehensive particle image velocimetry (PIV) measurement on a fire whirl, where air entrainment is formed by a staggered transparent cylinder. Their study provided quantitative velocity field information on the vortex core of the fire whirl and the surrounding circulation structure. Nonetheless, only a few temperature measurement points were conducted in conjunction with the PIV measurement. The interaction between vortex circulation and combustion within the vortex core was not thoroughly studied.
On the other hand, computational fluid dynamics (CFD) has the potential to reveal more detailed flow characteristics, particularly near the flame surface and the thin boundary layer above the fuel surface. Satoh and Yang [9] conducted an early study of fire whirls and attempted to predict the flame swirling motion within a vertical square enclosure using their in-house field model. Numerical simulations were carried out to investigate the effect of vertical gap size, fuel area size, and enclosure height on swirling flame height. Without considering radiation in their calculation, the intense rising heat and radiation feedback of fire whirls were neglected. Moreover, in simulating fire whirls, it is crucial to capture the transient effect of the buoyancy and the swirling motion within the fire core. Due to the limitation of time-averaging techniques, traditional RANS (Reynolds-averaged Navier–Stokes) models tend to underpredict periodic motion, while large eddy simulation (LES) models, in general, yield more accurate results [16]. Battaglia et al. [17] presented the first numerical study on fire whirl simulation using the LES framework. The LES turbulent model and a subgrid thermal element model were formulated to represent the swirling flame and these models were validated against the experiment of Emmons and Ying [9]. The predicted mean temperatures for non-swirling and whirling fires were in satisfactory agreement with the experimental data.
Matsuyama et al. [3] employed the widely adopted fire dynamics simulator (FDS) for fire whirl simulation. However, the predicted flame height, temperature, and velocity profile had considerably large discrepancies. As flame elongation is the most apparent characteristic of the fire whirl, the corrections of imposed circulation, velocity, and heat release rate with flame height have recently been of great concern [2,8,18,19]. Over the past decades, more sub-modelling components were incorporated into the FDS, such as the detailed chemistry mechanism and the radiative feedback model. Yuen et al. [20] adopted the new version of FDS to simulate a small-scale fire whirl measured by Chow and He [15]. They implemented a liquid fuel model considering radiation and convection heat feedback from the flame and qualitatively captured the four development stages of the fire whirl. Their study has marked a crucial step in capturing the combustion behaviour and onset of fire whirls. Unfortunately, the predicted velocity field has not been thoroughly validated due to the lack of experimental data, providing only qualitative analyses of the swirling motion. More recently, Parente et al. [21] presented a validation study of fire whirl using Reynolds-averaged Navier–Stokes (RANS) turbulence closure. Nevertheless, it is well known that the RANS model filters the instantaneous velocity and temperature fluctuation, which in essence is the nature of the fire dynamics. A thorough validation study of fire whirls using LES turbulence closure, where instantaneous fluctuations are resolved, is currently missing in the literature.
Therefore, the purpose of this paper is to thoroughly validate our numerical prediction on the transient temperature and velocity field against three small-scale fire whirl experiments measured by Chow and Han [14,15] and Hartl and Smits [7]. With the validated result, capturing the swirling vortex core and a detailed analysis of the onset mechanism and stability of fire whirls under different circumstances are also presented.

2. Mathematical Formulation

2.1. Governing Equations

The complex whirling fluid motion and heat transfer of a turbulent reacting fire whirl are predicted by the governing equations of mass, momentum, and energy. The conservation of scalar properties, such as gas chemical species, is governed by a transport equation. For the practical simulation of a weak fire whirl, several assumptions are made, including (i) low-Mach-number flow equations are considered, (ii) thermal–physical properties are constant, (iii) the ratio between mass and thermal diffusivity (Lewis number) is unity, (iv) the variable density effect is only included in the buoyancy term in the momentum equation, where Boussinesq approximation is applied, (v) no external body force and heat source are applied towards the flow, and (vi) non-adiabatic non-premixed combustion of the energy equation is adopted. Accordingly, the following form of the governing equations were utilised in this simulation study:
ρ t + x i ( ρ u ¯ i ) = 0
t ( ρ u ¯ i ) + x j ( ρ u ¯ i u ¯ j ) = x j ( σ i j ) p ¯ x i τ i j x j
t ( ρ H ¯ ) + x i ( ρ u i H ¯ ) = x i ( k t c p H ¯ x i ) + S h
t ( ρ φ ) + x i ( ρ u ¯ i φ ) = Γ φ x i q j x i + S φ
where ρ is the mixture density, u ¯ i is the velocity vector, and p is the pressure. As the non-premixed combustion model was adopted, the heat of formation will be included in the definition of enthalpy H; and k t is the turbulent thermal conductivity which can be calculated as k t = μ t / P r t . μ t is the eddy viscosity and Warrantz et al. suggested that the Prandtl number P r t is 0.7 [22]. S h accounts for source term due to radiation and heat transfer to wall boundaries. They will be further discussed at a later stage. φ represents the scalar quantities involved in the flow system (e.g., mixture fraction, soot particulate density, and soot volume fraction). Γ is the diffusion coefficient of φ .
The mixture fraction combustion model was utilized in this study. Hence, all thermochemical scalars are uniquely related to the mixture fractions. Besides, the mean scalar values are extracted from the instantaneous mixture fractions by the probability density function method. The mean fluid density, ρ , therefore, can be computed as:
1 ρ = 0 1 p ( f ) ρ ( f ) d f
where p ( f ) is the probability density function and f is the mixture fraction. They will be further discussed at a later stage.
Using Newton’s, Fick’s, and Fourier’s laws [23] and the assumption that the Lewis number (Le) equals to 1, the molecular stress tensor, the subgrid-scale stress, subgrid enthalpy flux term, and total enthalpy in terms of resolved quantities are given by:
σ i j = [ μ ( u ¯ i x j + u ¯ j x i ) ] 2 3 μ u ¯ l x l δ i j
τ i j ρ u i u j ¯ ρ u ¯ i u ¯ j
H ¯ = i Y ¯ i h i
h i = T r e f , j T c p , i d T + h i 0 ( T r e f , i )
where σ i j is the stress tensor due to molecular viscosity, μ is the molecular viscosity, δ i j is the Kronecker delta, and τ i j is the subgrid-scale stress. H ¯ can be defined by the ideal gas law, and Y i and h i 0 ( T r e f , i ) are the mass fraction and the formation enthalpy at the reference temperature T r e f , i of species i, respectively.
The unknown subgrid-scale (SGS) terms appearing in Equations (2), (4), and (6) require closure using the SGS models. The SGS turbulent flux of the scalars is modelled by the following equation:
q j = μ t S c φ φ x j
where the molecular Schmidt number S c φ for mixture fraction is the specified value of 0.7 [24], while the molecular Schmidt number for soot quantities is set to 700 [25].
Zhou et al. [26] have successfully demonstrated the feasibility of applying the Smagorinsky–Lilly model [27] to investigate unsteady low-speed buoyant jet diffusion flames. Kang and Wen [28] have also adopted the Smagorinsky–Lilly model for their studies of a small-scale buoyant fire. The subgrid-scale stress tensor can be modelled according to the Smagorinsky–Lilly formulation as follows:
τ i j 1 3 τ k k δ i j = 2 μ t ( S ¯ i j 1 3 S ¯ k k δ i j )
where S ¯ i j = 1 2 ( u ¯ i x j + u ¯ j x i ) . In this study, according to Erlebacher et al. [29], the terms involving τ k k are neglected as the flow has a low Mach number in both experiments. The Smagorinsky constant C s is taken to be 0.1. In the Smagorinsky–Lilly model, the eddy viscosity is modelled by μ t = ρ L s 2 | S ¯ | . Combining Smagorinsky eddy viscosity and Equation (9), the subgrid-scale stress tensor can be re-written as:
τ i j = 2 ρ L s 2 | S ¯ | ( S ¯ i j 1 3 S ¯ k k δ i j )
where L s   = m i n ( κ d ,   C s Δ ) is the mixing length for subgrid scales, κ is the von Karman constant, and d is the distance to the closest wall. Δ is the local grid-scale and can be computed according to the volume of the computation cell V:
Δ = V 1 / 3

2.2. Subgrid-Scale Combustion Modelling

For the combustion system, as the non-premixed mixture fraction combustion model was applied in this study, the basic assumption of the mixture fraction model is that all the species mass fraction are only functions of the mixture fraction [30]. Therefore, the thermochemical state of the combustion reactions can be governed by the mixture fraction f ¯ and the mixture fraction variance f 2 ¯ .
t ( ρ f ¯   ) + ( ρ u ¯ i f ¯   ) = ( ( k C p + μ t P r t ) f ¯   )
where k is the laminar thermal conductivity of the mixture and C p is the mixture-specific heat.
For large eddy simulation, the transport equation is not solved for the mixture fraction variance. Instead, it is modelled as:
f 2 ¯ = C v a r L S 2 | f ¯ |
where C v a r is the dynamic stress constant that equals to 0.5 and L S is the subgrid length scale.
In LES (large eddy simulation), the flame is typically not resolved by the computational grid [24]. Therefore, the chemical reaction is assumed to occur at the flame sheet, where a state relationship exists for all reactants. Under the mixture fraction assumption, the state relationship could be represented by the chemistry equilibrium assumption and experimental state relationships established by Y. R. Sivathanu and G. M. Faeth [31]. The instantaneous temperature, species mass fraction, and density can be parameterized by the instantaneous enthalpy and mixture fraction ϕ i = ϕ i ( f , H ) [32]. While, in the non-adiabatic simulation, changes in enthalpy due to heat loss must be considered. In this study, heat loss was assumed to not impact the turbulent enthalpy fluctuations. Therefore, the density-weighted scalars can be calculated as:
ϕ ¯ i = 0 1 ϕ i ( f , H ¯ ) p ( f ) d f
where H ¯ is the mean enthalpy and p ( f ) is the shape of the assumed probability density function (PDF). Furthermore, in the simulation, the shape of the assumed PDF could be described by the β function, and this PDF shape is given by the following function of mean mixture fraction f ¯ and mixture fraction variance f 2 ¯ .
p ( f ) = f α 1 ( 1 f ) β 1 f α 1 ( 1 f ) β 1 d f
where α = f ¯ [ f ¯ ( 1 f ¯ ) f 2 ¯ 1 ] and β = ( 1 f ¯ ) [ f ¯ ( 1 f ¯ ) f 2 ¯ 1 ] .
The mathematical result of Equation (17) for the non-adiabatic system was generated and stored in a 3D look-up table for the non-adiabatic system. The mean value of each mass fraction, density, and temperature are the function of f ¯ , f 2 ¯ , and H ¯ , respectively. In the flow domain, these values can be obtained by table interpolation.

2.3. Soot Formation and Radiation Models

The soot particles contributed significantly in augmenting the overall radiative heat transfer from a fire [33]. Tracking the evolution of soot volume fraction was thereby essential in the current study. The two-equation semi-empirical soot model by Moss et al. [34], that incorporates the essential physical processes of soot nucleation, coagulation and surface growth, was adopted. This model is attractive as it can use PDF in terms of mixture fraction to predict soot formation [35].
The major parameters utilized to determine soot formation were normalized radical nuclei concentration b n u c * and soot mass fraction Y s o o t . The Moss–Brookes model solves two more transport equations for these two parameters.
t ( ρ Y s o o t ) + x i ( ρ u i Y s o o t ) = x i ( μ t P r s o o t Y s o o t x i ) + d M d t
t ( ρ b n u c * ) + x i ( ρ u i b n u c * ) = x i ( μ t P r s o o t b n u c * x i ) + 1 N n o r m d N d t
where Y s o o t is soot mass fraction and P r s o o t is the turbulence Prandtl number for soot transport that equals to 0.4 [36]. M is soot mass concentration, b n u c * is normalized radical nuclei concentration, N is soot particle number density, and N n o r m equals 10 15   particles . The last term in these two equations describes the instantaneous soot mass concentration and instantaneous production rate of soot particles, respectively.
d M d t = M p C a ( X p r e c P R T ) l e x p { T a T } + C r ( X s g s P R T ) m e x p { T γ T } [ ( π N ) 1 / 3 ( 6 M ρ s o o t ) 2 / 3 ] n C o x i d C ω η c o l l ( X O H P R T ) T ( π N ) 1 / 3 ( 6 M ρ s o o t ) 2 / 3
d N d t = C a N a ( X p r e c P R T ) l e x p { T a T } C β ( 24 R T ρ s o o t N a ) 1 / 2 d p 1 / 2 N 2
where X p r e c is the mole fraction of the soot precursor, which is assumed to be acetylene [37]. The mass density of soot ρ s o o t is assumed to be 1800 k g · m 3 , and the activation temperature T a for nucleation reaction is that proposed by Lindstedt [38]. Furthermore, in the soot mass concentration equation, X s g s is the mole fraction of the participating surface growth species. Fenimore and Jones [39] assumed the collision efficiency ( η c o l l ) to be 0.04. C a , C β , C r , M p , C o x i d , C ω , and T γ are model constants.
Appropriate values for model constants are obtained from Brookes and Moss [37],
C a   = 54   s 1 C β   = 1.0 C r   = 11,700   kg · m · kmol 1 · s 1 C o x i d   = 0.015 C ω   = 105.8125   kg · m · kmol 1 · K 1 / 2 · s 1 T γ   =   12,100   K   ( activation   temperature   of   surface   growth   rate ) T a   =   21,100   K   ( activation   temperature   of   soot   inception ) M p   = 144   kg · kmol 1
As in the combustion system, the flow is highly turbulent. Hence, the temperature and composition fluctuations were taken into account by the probability density function. To calculate soot concentration for the Moss–Brookes model, a two-variable PDF in terms of mixture fraction and the radiative heat loss fraction can be utilized [37]. The general expression for the mean reaction rate can be:
S ¯ s o o t = ρ ω s o o t p ( f ) p ( f 2 ) d f d f 2
where ω s o o t is the instantaneous molar rate of soot production, and p ( f ) and p ( f 2 ) are the PDFs of the mixture fraction and mixture fraction variance, respectively.
The luminous thermal radiation from combustion products and soot is treated by solving the filtered radiative transfer equations (FRTE) for a non-scattering grey gas using the discrete ordinates method (DOM) with the S4 quadrature scheme [40]. The grey gas assumption and the S4 approximation allow for more efficient computations. The discrete radiative transfer equation is spatially filtered, resulting in the FRTE shown below for a Cartesian coordinate system in three dimensions:
ξ j I ¯ j X + η j I ¯ j X + ζ j I ¯ j X K ¯ a ( E b I ¯ j )
In this present investigation, Equation (23) neglects the interaction of the SGS turbulence-radiation. The blackbody radiation is defined as E b = σ T ¯ 4 and σ is the Stefan–Boltzmann constant. The direction cosines ξ j , η j , and ζ j represent a set of directions for each of the radiation intensities I ¯ j that span over the total solid angle range of 4π around a point in space. The integrals over solid angles are approximated using the S4 numerical quadrature, where the maximum number of discrete ordinates is 24. The discrete version of the radiation source terms that appears in the filtered energy equation is:
S r a d 4 K ¯ a E b + j = 1 24 w j K ¯ a ( s ^ j )
The filtered gas absorption coefficient ( K ¯ a , g ) for the combustion products ( C O 2 and H 2 O ) as well as the unburnt methane fuel can be approximated according to the weighted sum of gray gases model (WSGGM). For soot, the expression from Kent and Honnery [41], K ¯ a , s = 1864 f ˜ v T , ˜   is   employed . The absorption coefficient in Equation (27) is evaluated based on the sum of the filtered gas and soot absorption coefficients, i.e., K ¯ a = K ¯ a , g + K ¯ a , s .

3. Experimental Configuration and Numerical Setup

3.1. Experimental Arrangement of Chow and Han

Numerical simulations were carried out based on two small-scale fire whirl experiments conducted by Chow and Han [14] and Hartl and Smits [7]. A schematic view of the experiment by Chow and Han [10] is shown in Figure 1a. As depicted, a liquid propane fuel bed was placed at the centre of a 0.35 m × 0.34 m vertical shaft with a total height of 1.45 m. The top of the vertical shaft was fully opened, while the shaft was enclosed by wooden walls and a transparent plastic sheet for video footage and observations. A single ventilation gap of 3.6 cm width was opened at one side for asymmetric air entrainment to initiate the onset of fire whirl. To study the influence of air entrainment on the formation and stability of the fire whirl, the vertical gap can be fully or partially opened. For measuring the time-averaged temperature profile, a thermocouple tree was placed at the centre of the small-scale fire whirl model. The thermocouple tree measurements were taken from 0.15 m to 1.35 m above the floor level with a constant spacing of 0.15 m between each thermocouple. In this study, two numerical simulations were carried out with a liquid fuel pool area of 39 cm2 (i.e., corresponding to an approximated fire size of 3.58 kW), while the ventilation gap was fully or partially opened as shown in Figure 1a.

3.2. Experimental Arrangement of Hartl and Smits

Figure 1b presents the schematic view of the experiment by Hartl and Smits [7]. As depicted, a pressure gas burner (Fisher Scientific 1201 Meker-type burner, dimethyl ether) was centred inside two, staggered, plexiglass, half-cylinders which had an inner diameter of 305 mm and a height of 890 mm. Two ventilation gaps, formed by the staggered half-cylinders, induced asymmetric air entrainment for the onset of fire whirls. As shown in Figure 1b, the exit diameter was 38.1 mm, corresponding to an approximated fire size of 5.13 kW, and the burner was sealed with epoxy to create a diffusion flame. The exhaust was situated 1.5 m above the base, which was only operated after the completion of the experiment. The flow rate of gas fuel was controlled with a needle valve, and pressure in the fuel line to the burner was maintained at 207 kPa. Furthermore, a stereo particle image velocimetry (SPIV) system, which uses two Imager sCMOS cameras, was utilized to measure the instantaneous whirl circulation, velocity distribution, and inflow velocity nearing the base. In each individual PIV image, flame positions were significantly unsteady. This wandering motion made the average velocity values different from their instantaneous values. According to previous work, the time-averaged fire whirl could be considered as the quasi-steady state and the velocity profiles could correlate to the Rankine profile [42]. Therefore, only images with u radial < ( u tangential / 7 ) were collected and a subset of 127 images were averaged.

3.3. Computational Domain and Boundary Conditions

Three fire whirls were predicted in this study and the case conditions are summarized in Table 1.
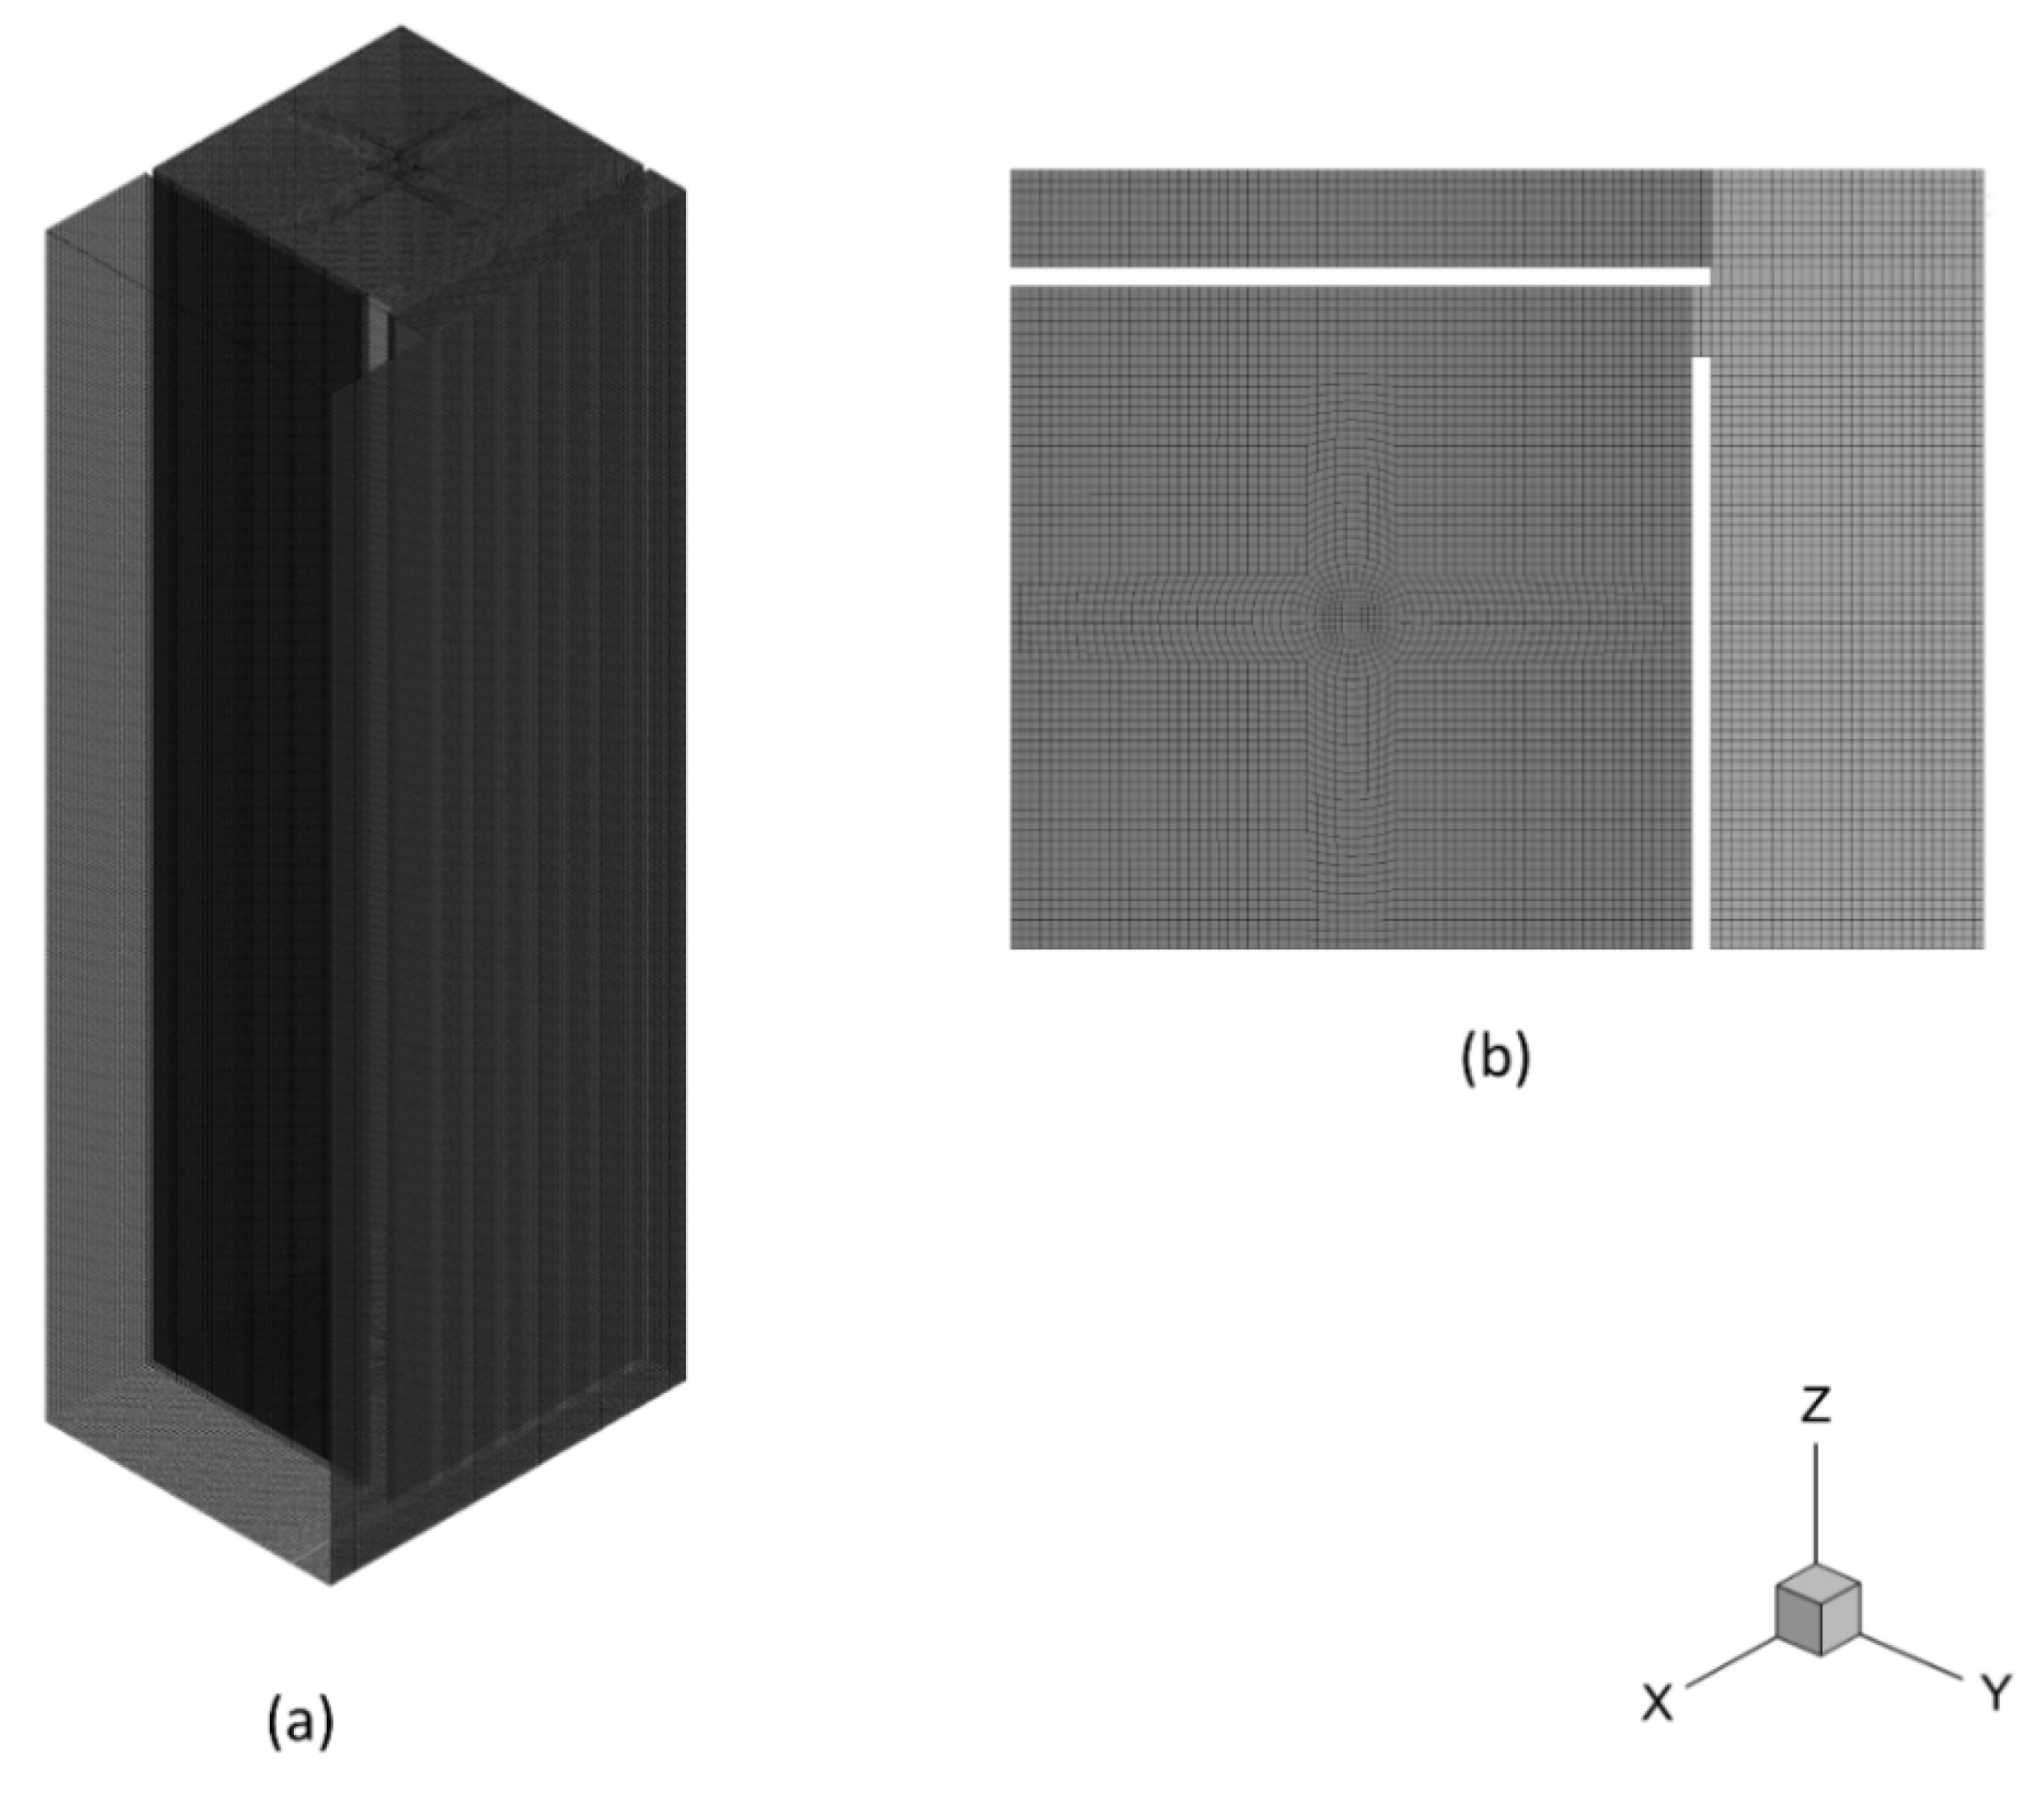
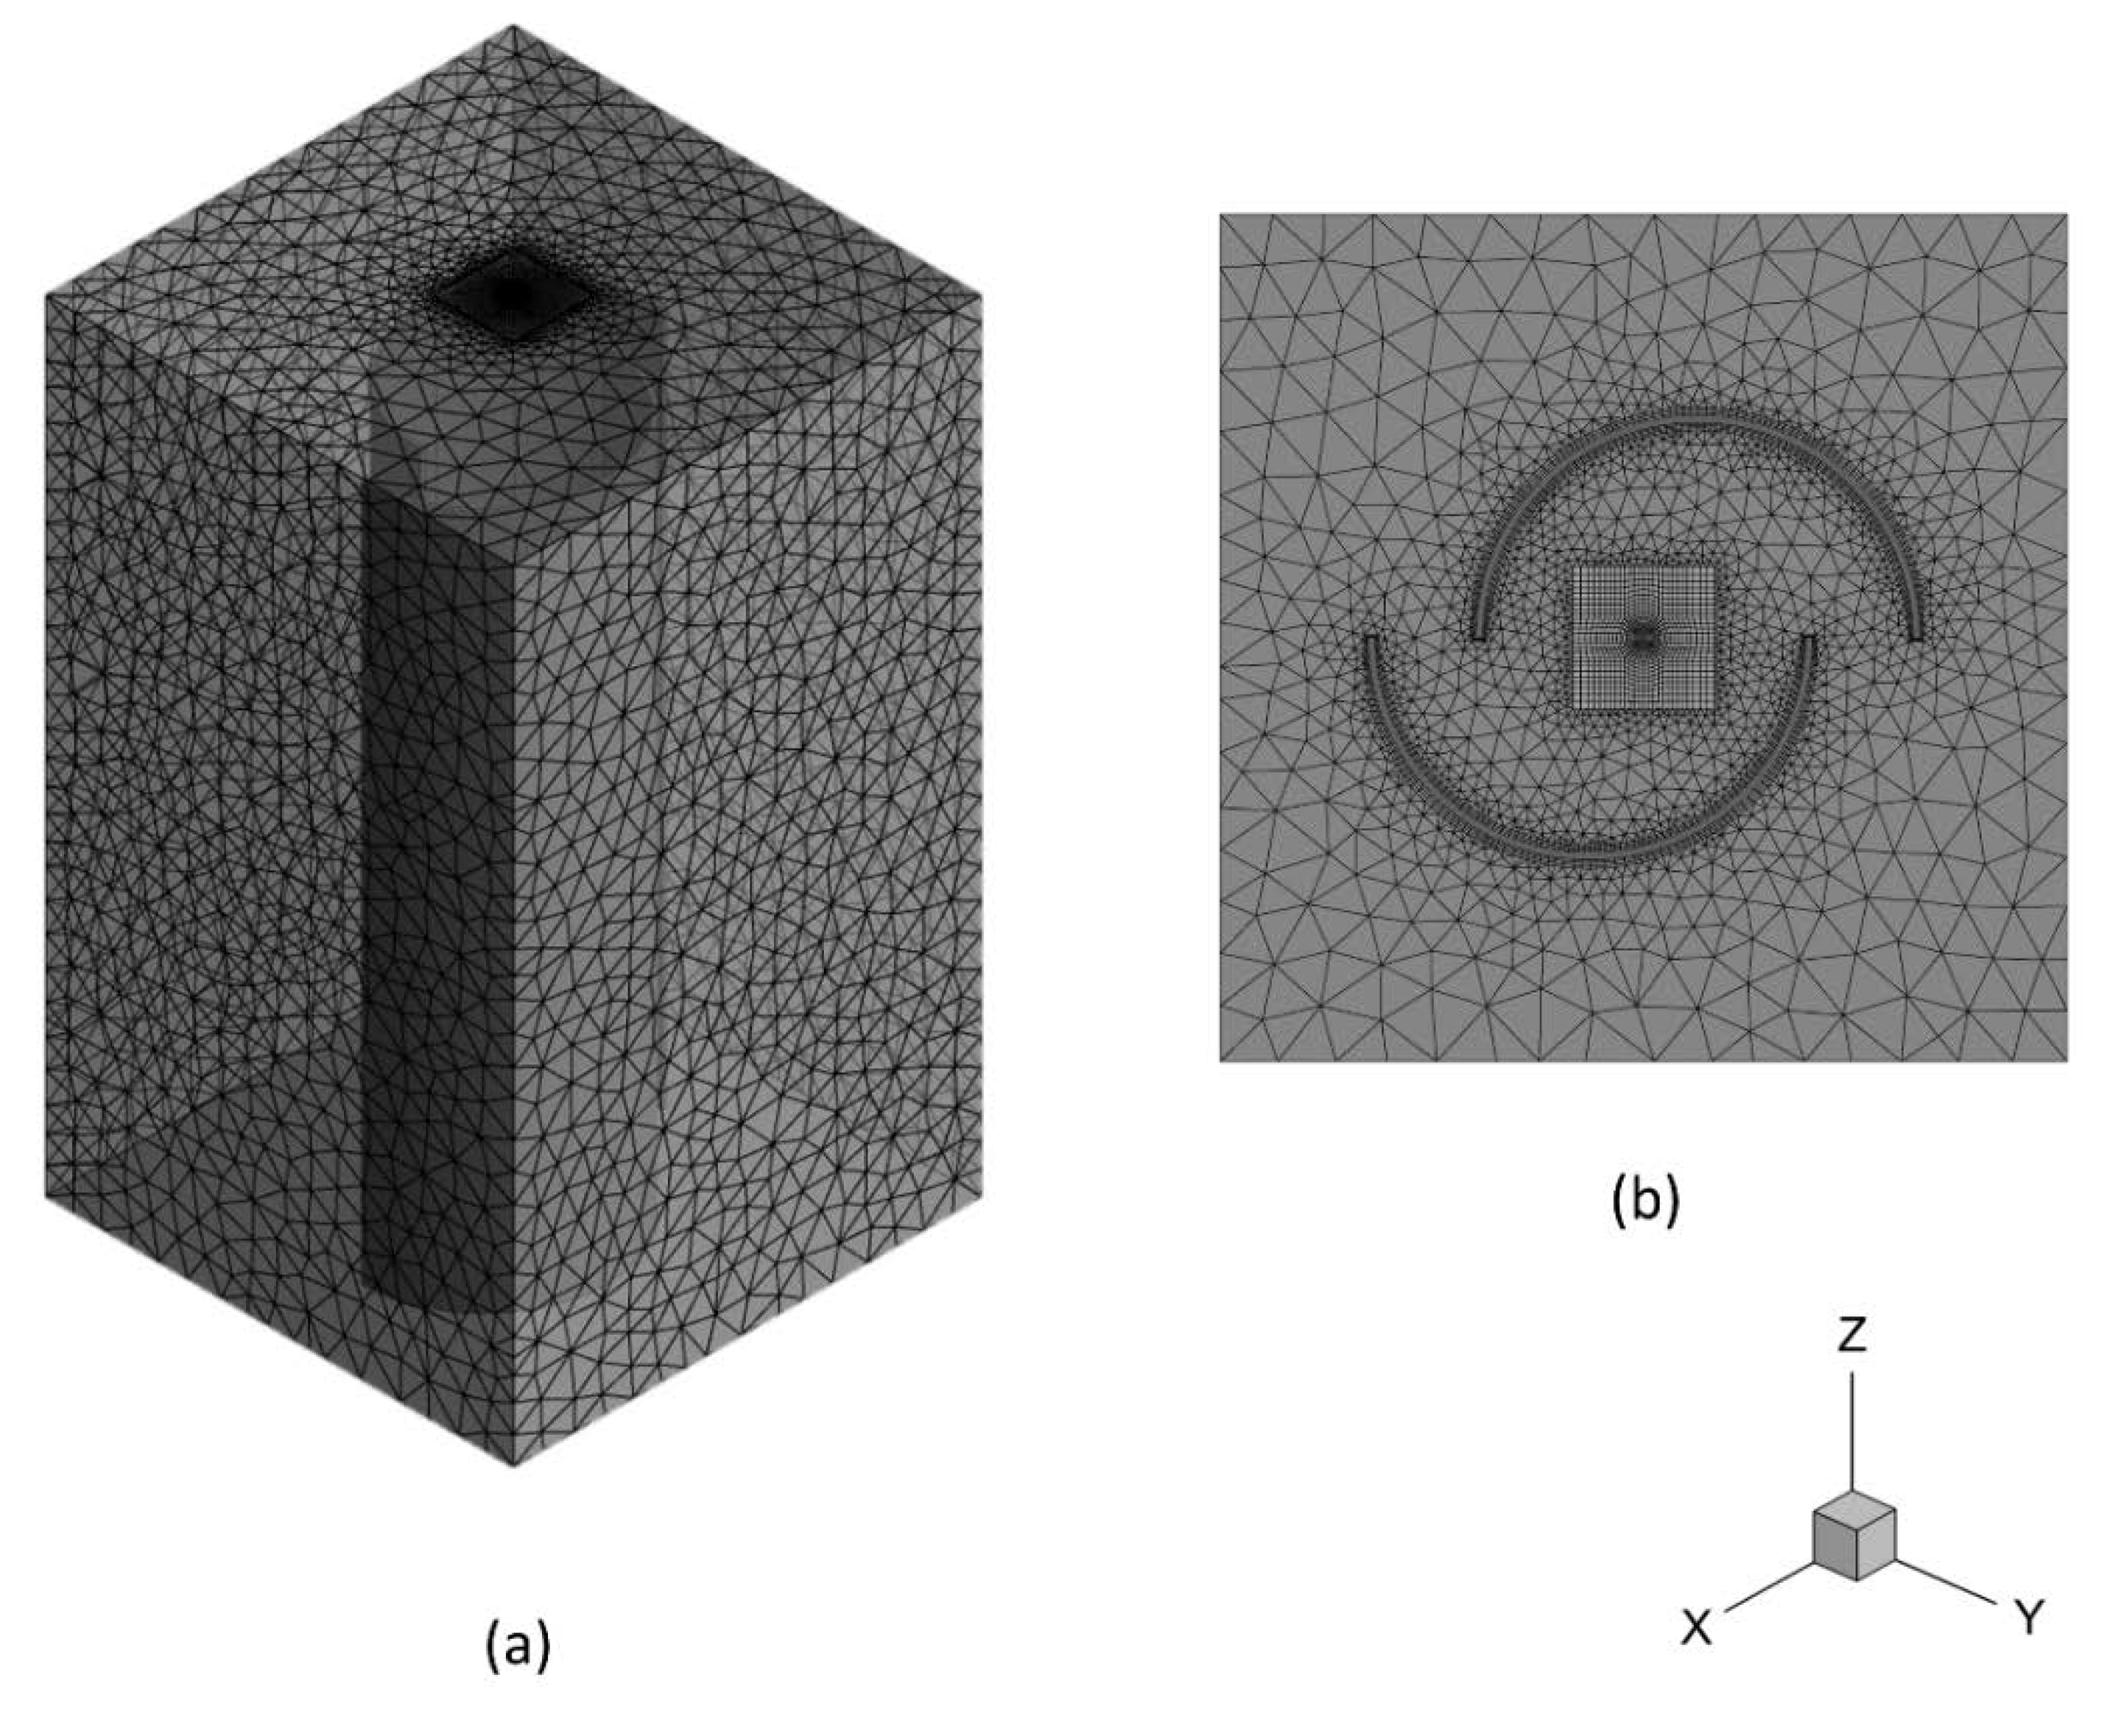
The meshing system was designed by the ICEM [43]. Referring to the experimental setup, the structure mesh system was adopted in the simulation of Chow’s two cases (i.e., fully and partially opened cases) as shown in Figure 2. The total size of the computational domain was 0.5 m × 0.4 m × 1.45 m including the extension of the model, to keep numerical stability at computational boundaries, which was 0.15 m in the x-direction and 0.05 m in the y-direction. To ensure sufficient mesh resolution, the size of the meshing elements was determined through the relationship between the heat release rate, ambient density, and ambient temperature. The ANSYS Fluent package was adopted in all fire whirl simulations. For the turbulence model, the Smagorinsky–Lilly subgrid-scale (SGS) model was adopted to resolve the SGS turbulent contribution. In the combustion modelling, the combustion mixture was presented by the mixture fraction, where chemical species concentrations were evaluated based on the chemistry equilibrium mechanism. The discrete ordinates radiation model was utilized to track the radiative heat transfer between surfaces and combustion species. For the fully and partially opened vertical shaft model, the total number of mesh cells was 3,200,000. The refined boundary layer cells were positioned near the walls. For the Hartl’s case, as the model included two staggered cylinders, hybrid mesh (i.e., structured hexagonal and unstructured tetrahedral) was applied to discretise the computation domain, as shown in Figure 3. The top exhaust was removed and the overall vertical height was reduced to 0.89 m to simplify experimental geometry. Therefore, the total size of the computational domain was 0.6 m × 0.6 m × 0.89 m. To enhance the numerical stability, the structured mesh was positioned at the centre of the model (i.e., with the size of 0.05 m × 0.05 m × 0.89 m), where each grid was 0.001 m × 0.001 m × 0.001 m, with a total number of 2.22 million grid cells. The outer volume in the model was meshed with the unstructured tetrahedral mesh. The total number of tetrahedra cells was 9.31 million. The pressure-based method was utilized to solve filtered governing equations by applying the SIMPLE scheme for velocity–pressure coupling. The second-order implicit was used to calculate transient formulation.
Due to the heat release rate was kept relatively steady in the fully developed fire whirl stage, the influence of fuel evaporation rate by the radiation feedback can be neglected. The liquid fuel bed and the pressure gas burner, therefore, were simplified as a fixed velocity mass-flow inlet. To generate diffusion flow at the fuel inlet surface, the gas pressure of inlet was set up to 0 ps. Moreover, all wall boundaries were considered as the no-slip stationary wall. At the wall boundary, refined boundary layer cells were generated to satisfy the requirement of the alternative near-wall approach for LES based on the work of Werner and Wengle [44]. In their model, the wall shear stress was resolved by the analytical integration of the power law near-wall velocity distribution. To ensure proper entertainment into the combustion zone, a user-defined function (UDF) was implemented to consider the static pressure change along the vertical direction for the initialization and far-field pressure boundaries. The pressure change was evaluated as follows: p g a u g e = p 0 ρ a m b i e n t · g · Z .

4. Results and Discussions

4.1. Validation of Time-Averaged Centreline Flame Temperature

In the fire experiment by Chow and Han [14], the pool fire tests were carried out for a total burning time ranging from 150 to 180 s. Only steady-state temperature measurements were made using the thermocouple tree. For numerical validations, following our previous study [20], the time-weighted averaging calculation was applied to the predicted instantaneous temperatures with a moving average window of approximately 40 s. In addition, bare-wire K-type thermocouple trees were adopted for temperature measurements at the centre of the fire whirl. According to Chow and Han [14], the stainless steel thermocouple probes with a diameter of 1.5 mm were used throughout the experiment. Due to the lack of thermal shielding, the intense heat convection and radiation near the flame could cause an error in the actual reading at the high-temperature region (i.e., at the centre of the fire) [45]. To remedy the associated errors, Wen et al. [45] proposed a correction method to revise the temperature reading based on the thermal equilibrium assumption as follows:
q ˙ c o n v e c t i v e   t o   a n d   f r o m   t h e r m o c o u p l e = q ˙ r a d i a t i v e   t o   a n d   f r o m   t h e r m o c o u p l e
h s , c o n v ( T g , c o r r T t h e r ) = ε t h e r ( σ T t h e r 4 q ˙ r )
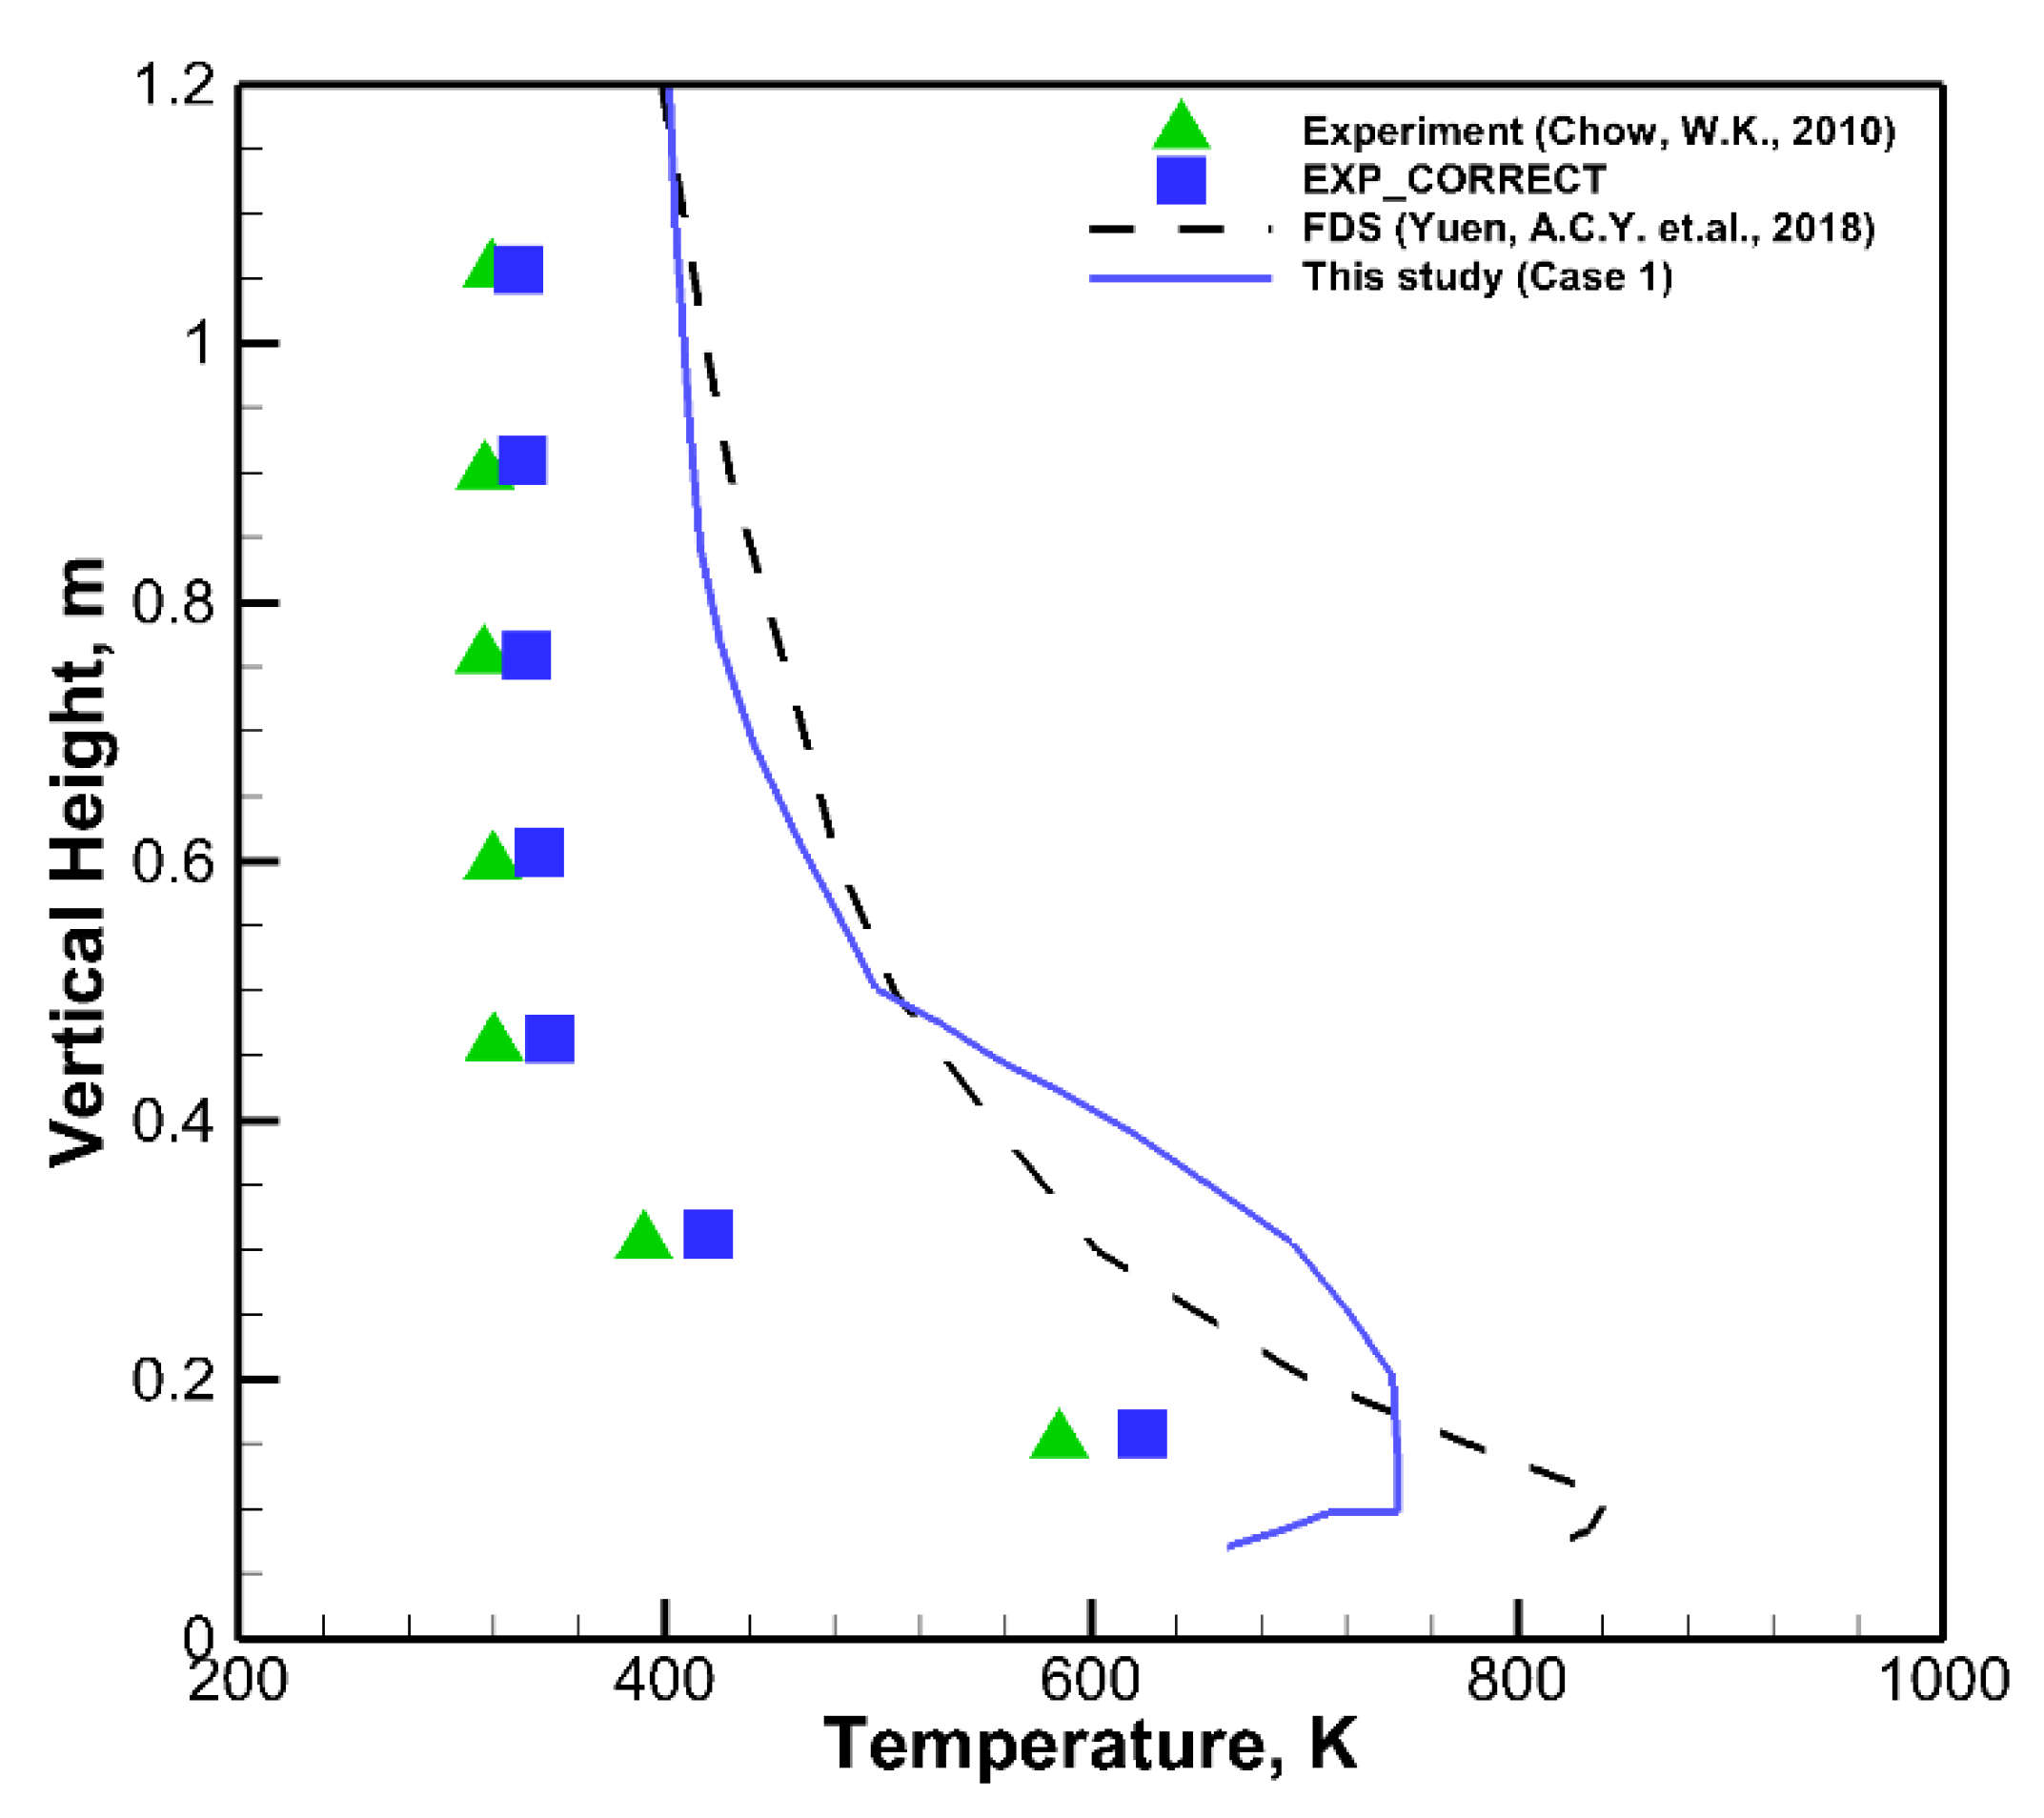
where T g , c o r r is the corrected gas temperature, T t h e r is the thermocouple-measured value, σ is the Stefan–Boltzmann constant which equals to 1.699 × 10 8 , q ˙ r is the local radiative flux computed by the radiation model, and h s , c o n v is the convective heat transfer coefficient which is calculated by an empirical correlation for a sphere in crossflow [20]. Figure 4 shows the comparison between the corrected experimental readings and predicted time-averaged temperature distribution along the centreline of the fire whirl. In general, the numerical predictions were in satisfactory agreement with the corrected experimental data. The numerical scheme successfully captured the main tendency of the centreline temperature distribution. The predicted maximum temperature of 467 °C occurred at 0.08–0.1 m above the fuel bed. As depicted, the predicted temperature profile was overpredicted around 19% at 0.2–0.4 m. The prediction errors could be attributed to the following reasons. Firstly, the equilibrium chemistry model was adopted for handling the combustion process of the fire whirl. In reality, the combustion process could become non-equilibrium due to transient turbulent mixing, leading to fuel-rich or fuel-limited conditions. The equilibrium model could, therefore, overestimate the heat generation of the combustion process, leading to overpredictions of the flame temperature. Secondly, with the limited computational resources, only thirteen species, as shown in Table 2, were considered as the intermediate species in the simulation.
Other intermediate species generated during the incomplete combustion process were neglected. The simplified intermediate species could pose error to the combustion heat release rate, causing overprediction of the temperature profile. Lastly, measuring error could also be a factor contributing to the discrepancies in validation. Due to asymmetric entrainment from the single ventilation gap, the fully developed fire whirl tended to skew away from the air entrainment gap. Thermocouple probes were also slightly adjusted towards the tilted flame structure (as discussed in our previous work [33]). As a result, temperature measurement was not precisely located at the centre of the experimental model. Flame temperature readings were taken slightly offset from the centre of experimental shaft posing error in the measured results. In general, the numerical scheme adopted in the present study successfully captured the centreline temperature profile of a small-scale fire whirl.
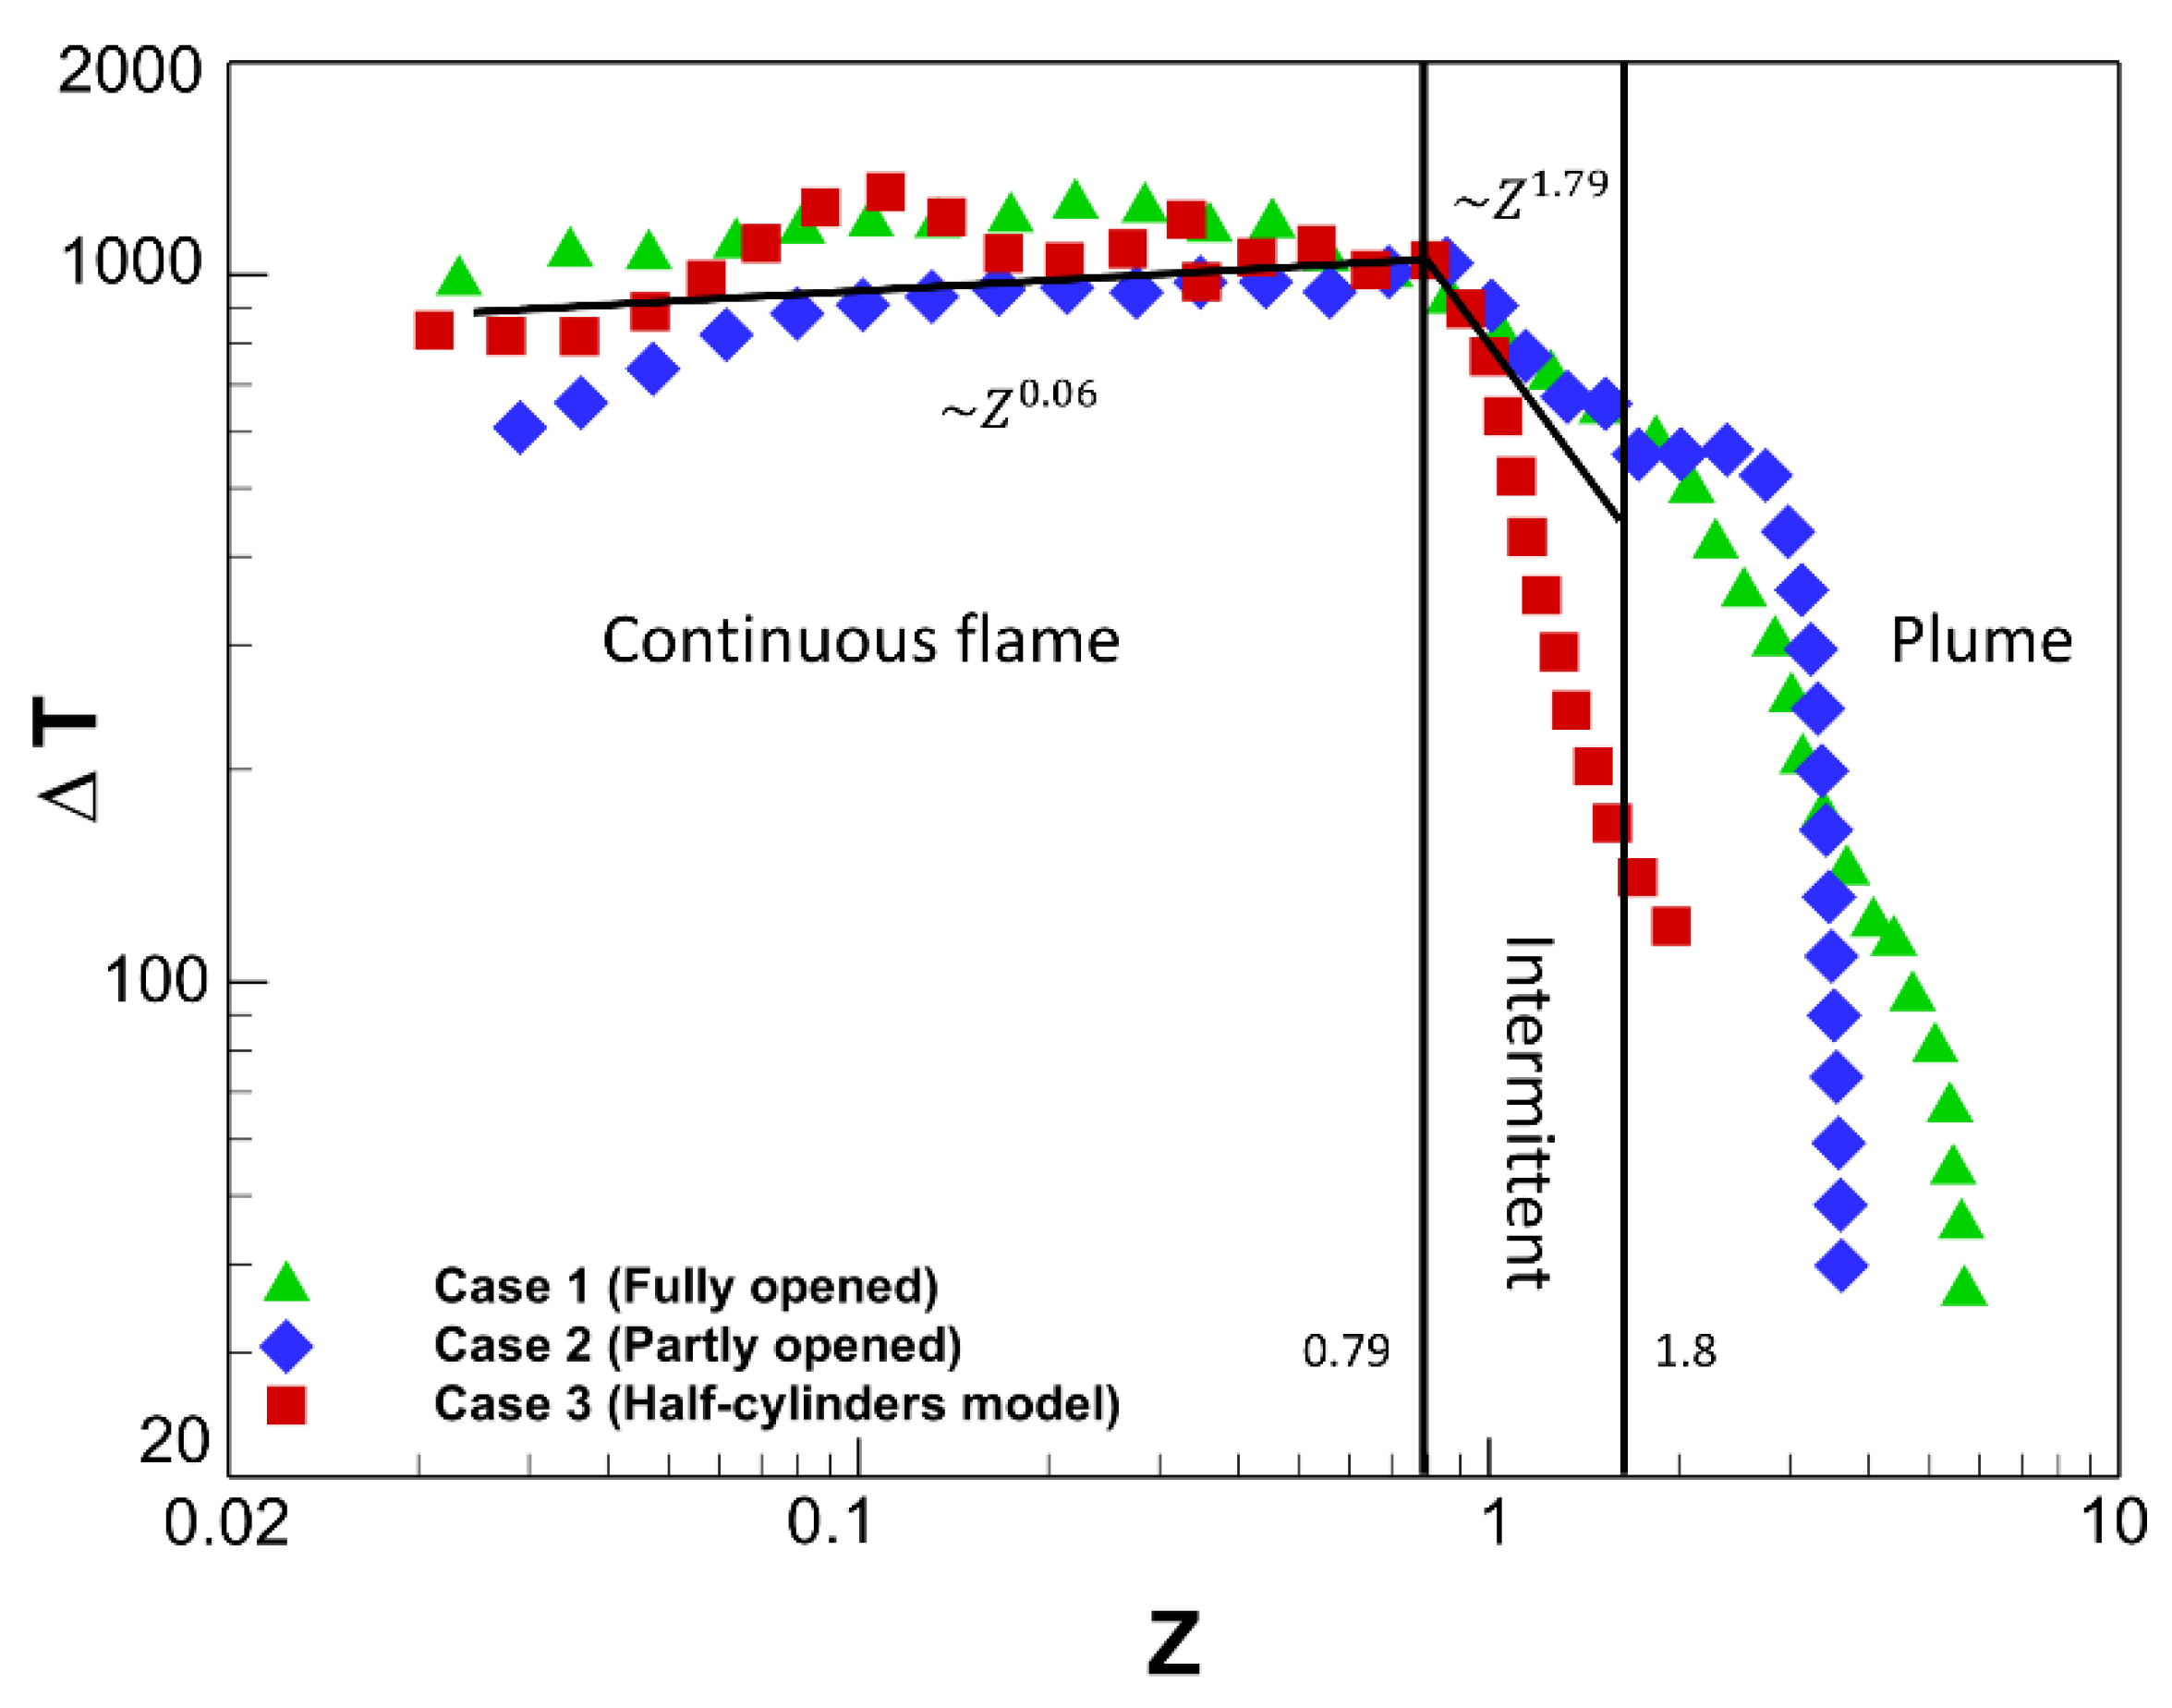
To further verify the creditability of the numerical model, the predicted time-averaged excess temperatures ( Δ T = T T ) for Case 1 and Case 2 (i.e., fully and partially opened cases, respectively) and Case 3 (i.e., model with two half-cylinders) were compared against the empirical correlation with the medium-scale fire whirls [19]. Z was the normalized vertical height (e.g., Z = H / H f , w h e r e   H f = mean flame height) as shown in Figure 5. As depicted, the numerical predictions were in satisfactory agreement with the empirical correlation in the continuous flame region. The comparison indicated the similar combustion behaviour between small- and medium-scale fire whirls within the continuous flame. Numerical predictions for Case 1 and Case 2 were in good agreement with the correlations at the intermittent flame. Predictions for Case 3 exhibited a relatively different decaying slope. This could be attributed to the different entrainment mechanisms and flame structures. In this experiment, air entrainment was initiated by two, staggered, half-cylinders, which were fundamentally different from the rectangular entrainment gap used in Chow and Han [14] and Lei et al. [19] experiments. Moreover, the vertical shaft simulation presented a cylindrical fire whirl, while this model, the half-cylinder model, presented a conical fire whirl in the simulation, and the difference in flame structures will further be discussed in a later section. According to Jiao Lei et al. [12], cylindrical fire whirls have higher imposed circulation and flame velocity, and the intensity of fuel–air mixing in the intermittent region would be sustained at the same level as in the continuous flame region. The temperature of the vertical shaft model, therefore, decreased relatively slowly in the intermittent flame and plume region.

4.2. Validation of Time-Averaged Velocity Field

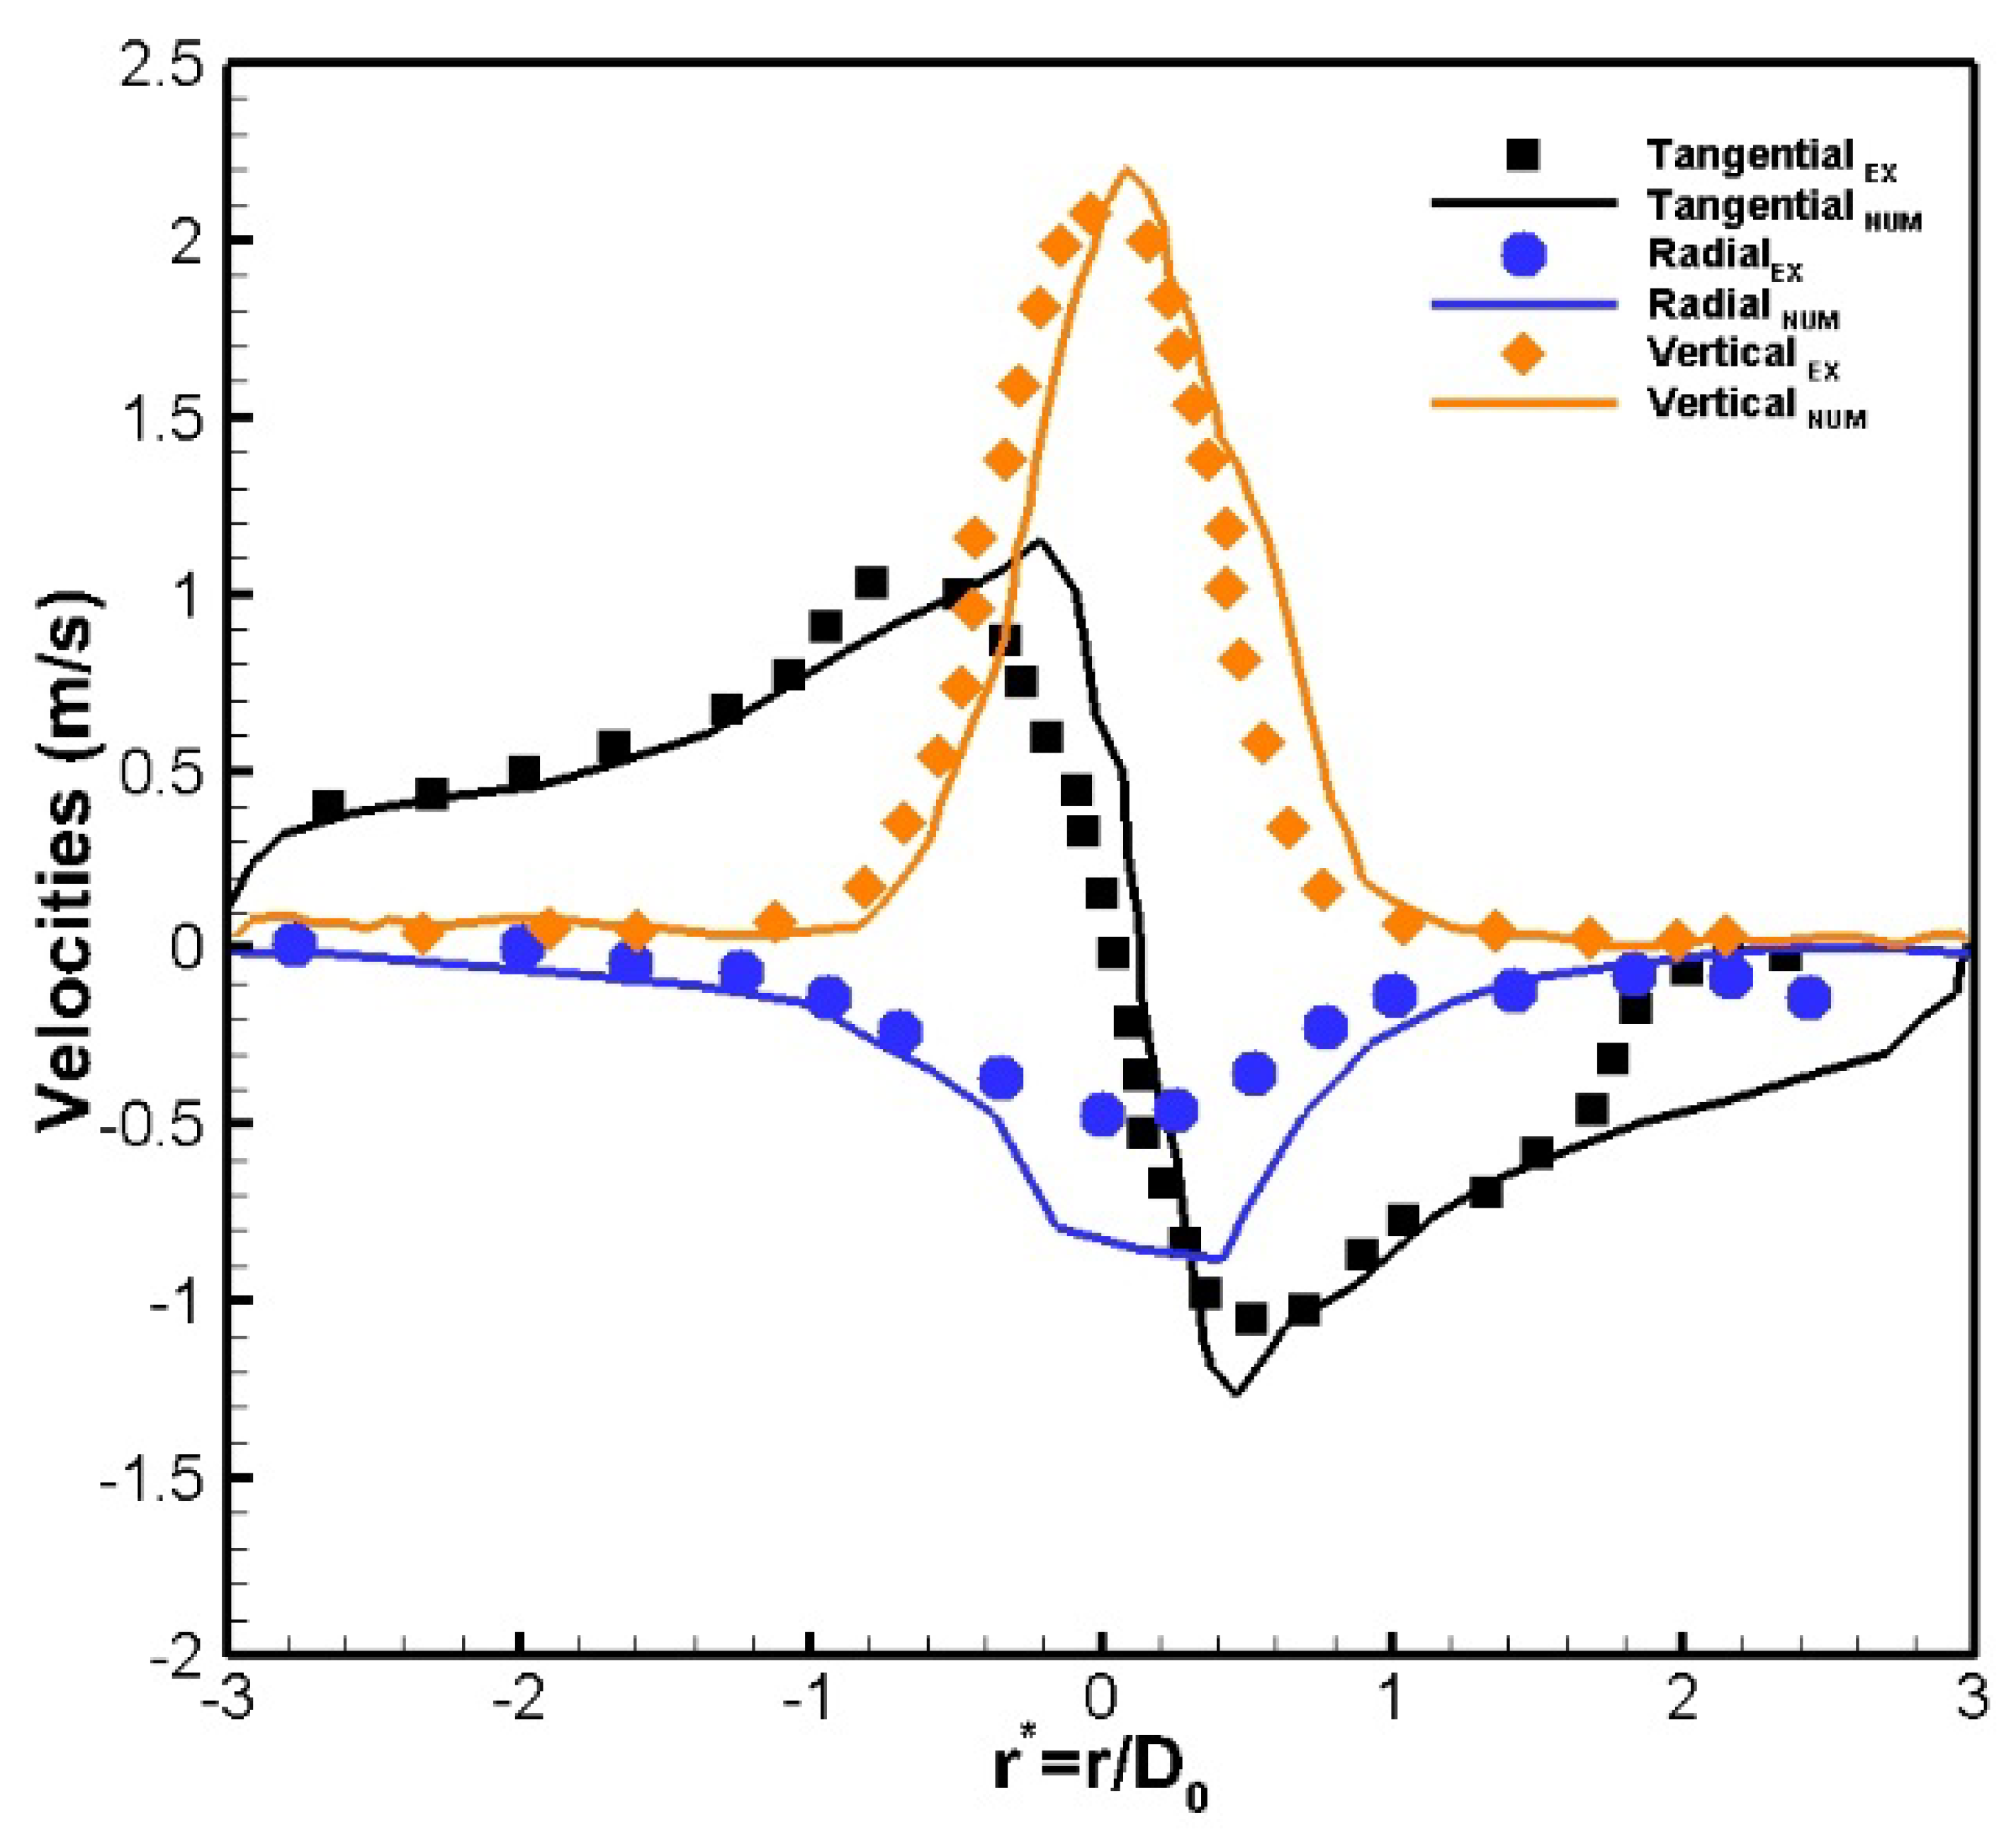
To analyse the swirling motion within the fire whirl, it was crucial to thoroughly validate the predicted velocity field with experimental data. Unfortunately, detailed velocity field measurements were not conducted by Chow and Han [14]. In this study, for the very first time, the predicted velocity field was thoroughly validated against the SPIV measurements of a small-scale fire whirl conducted by Hartl and Smits [7]. To be consistent with the experimental data, time-averaging was applied to the numerical predictions for approximately 20 s after the fire whirl had been fully developed for at least 40 s. Figure 6 shows the comparison of the measured and predicted time-averaged velocity components along a horizontal line at the centre of the fire whirl at 0.08 m above the fire bed. Although the symmetrical experimental arrangement was adopted in the SPIV measurements, it is worth noting that the measured vertical and radial velocities exhibited non-symmetric behaviour. As depicted in Figure 6, the peak vertical velocity was slightly offset from the centreline of the fire. Similarly, the two, opposite, angular velocity peaks were also slightly shifted to the left from the fire centre (i.e., negative radial locations). Moreover, a noticeable angular velocity decay was observed on the right side of the figure, while no noticeable decline was observed on the left side of the figure. As discussed in the previous section, the motion of the fire whirl was highly unstable, causing it to wander in and out of the measuring laser sheet. This could introduce uncertainties in the time-averaged velocities leading to the non-symmetric profiles. Furthermore, the surrounding room conditions during the experiment could also contribute to the uncertainties of the measurements.
For numerical predictions, as all boundary conditions were symmetric in the simulation, the predicted velocity profiles were largely symmetric with only minor fluctuating noise remaining after time-averaging. As depicted, the predicted axial velocity peak centre was more closed to the middle of the model compared to the measured result, which was slightly off from the centre. Nevertheless, the predicted vertical velocity peak value was in excellent agreement with the measurements. Similarly, an excellent comparison was also shown for the angular velocity peak values. The distance between two angular velocity peaks represents the core diameter of the fire whirl. Comparing with the experimental data, the predicted core diameter was slightly underpredicted, indicating that the intensity of the swirl motion was slightly overpredicted by the numerical scheme. This was also evidenced in the slightly overpredicted radial velocity in the comparison. The discrepancy could again be attributed to the equilibrium chemistry assumption adopted in the present numerical scheme. The assumption tends to overestimate the completeness of the combustion process, which overestimates the density contrast between the fire core and surrounding air, leading to stronger turbulence suppression. According to Lei et al. [2], the flame elongation and swirling core formation are closely related to turbulence suppression. Stronger suppression could encourage a higher swirling flame structure exhibiting a higher radial velocity in the predicted results. In general, the predicted results were in good agreement with the experimental measurement. This paper presents a complete numerical scheme to capture the swirling flame structure of a fire whirl, which is thoroughly validated against the SPIV measurements.

4.3. Normalization of Tangential Velocity and Vortex Core Radius

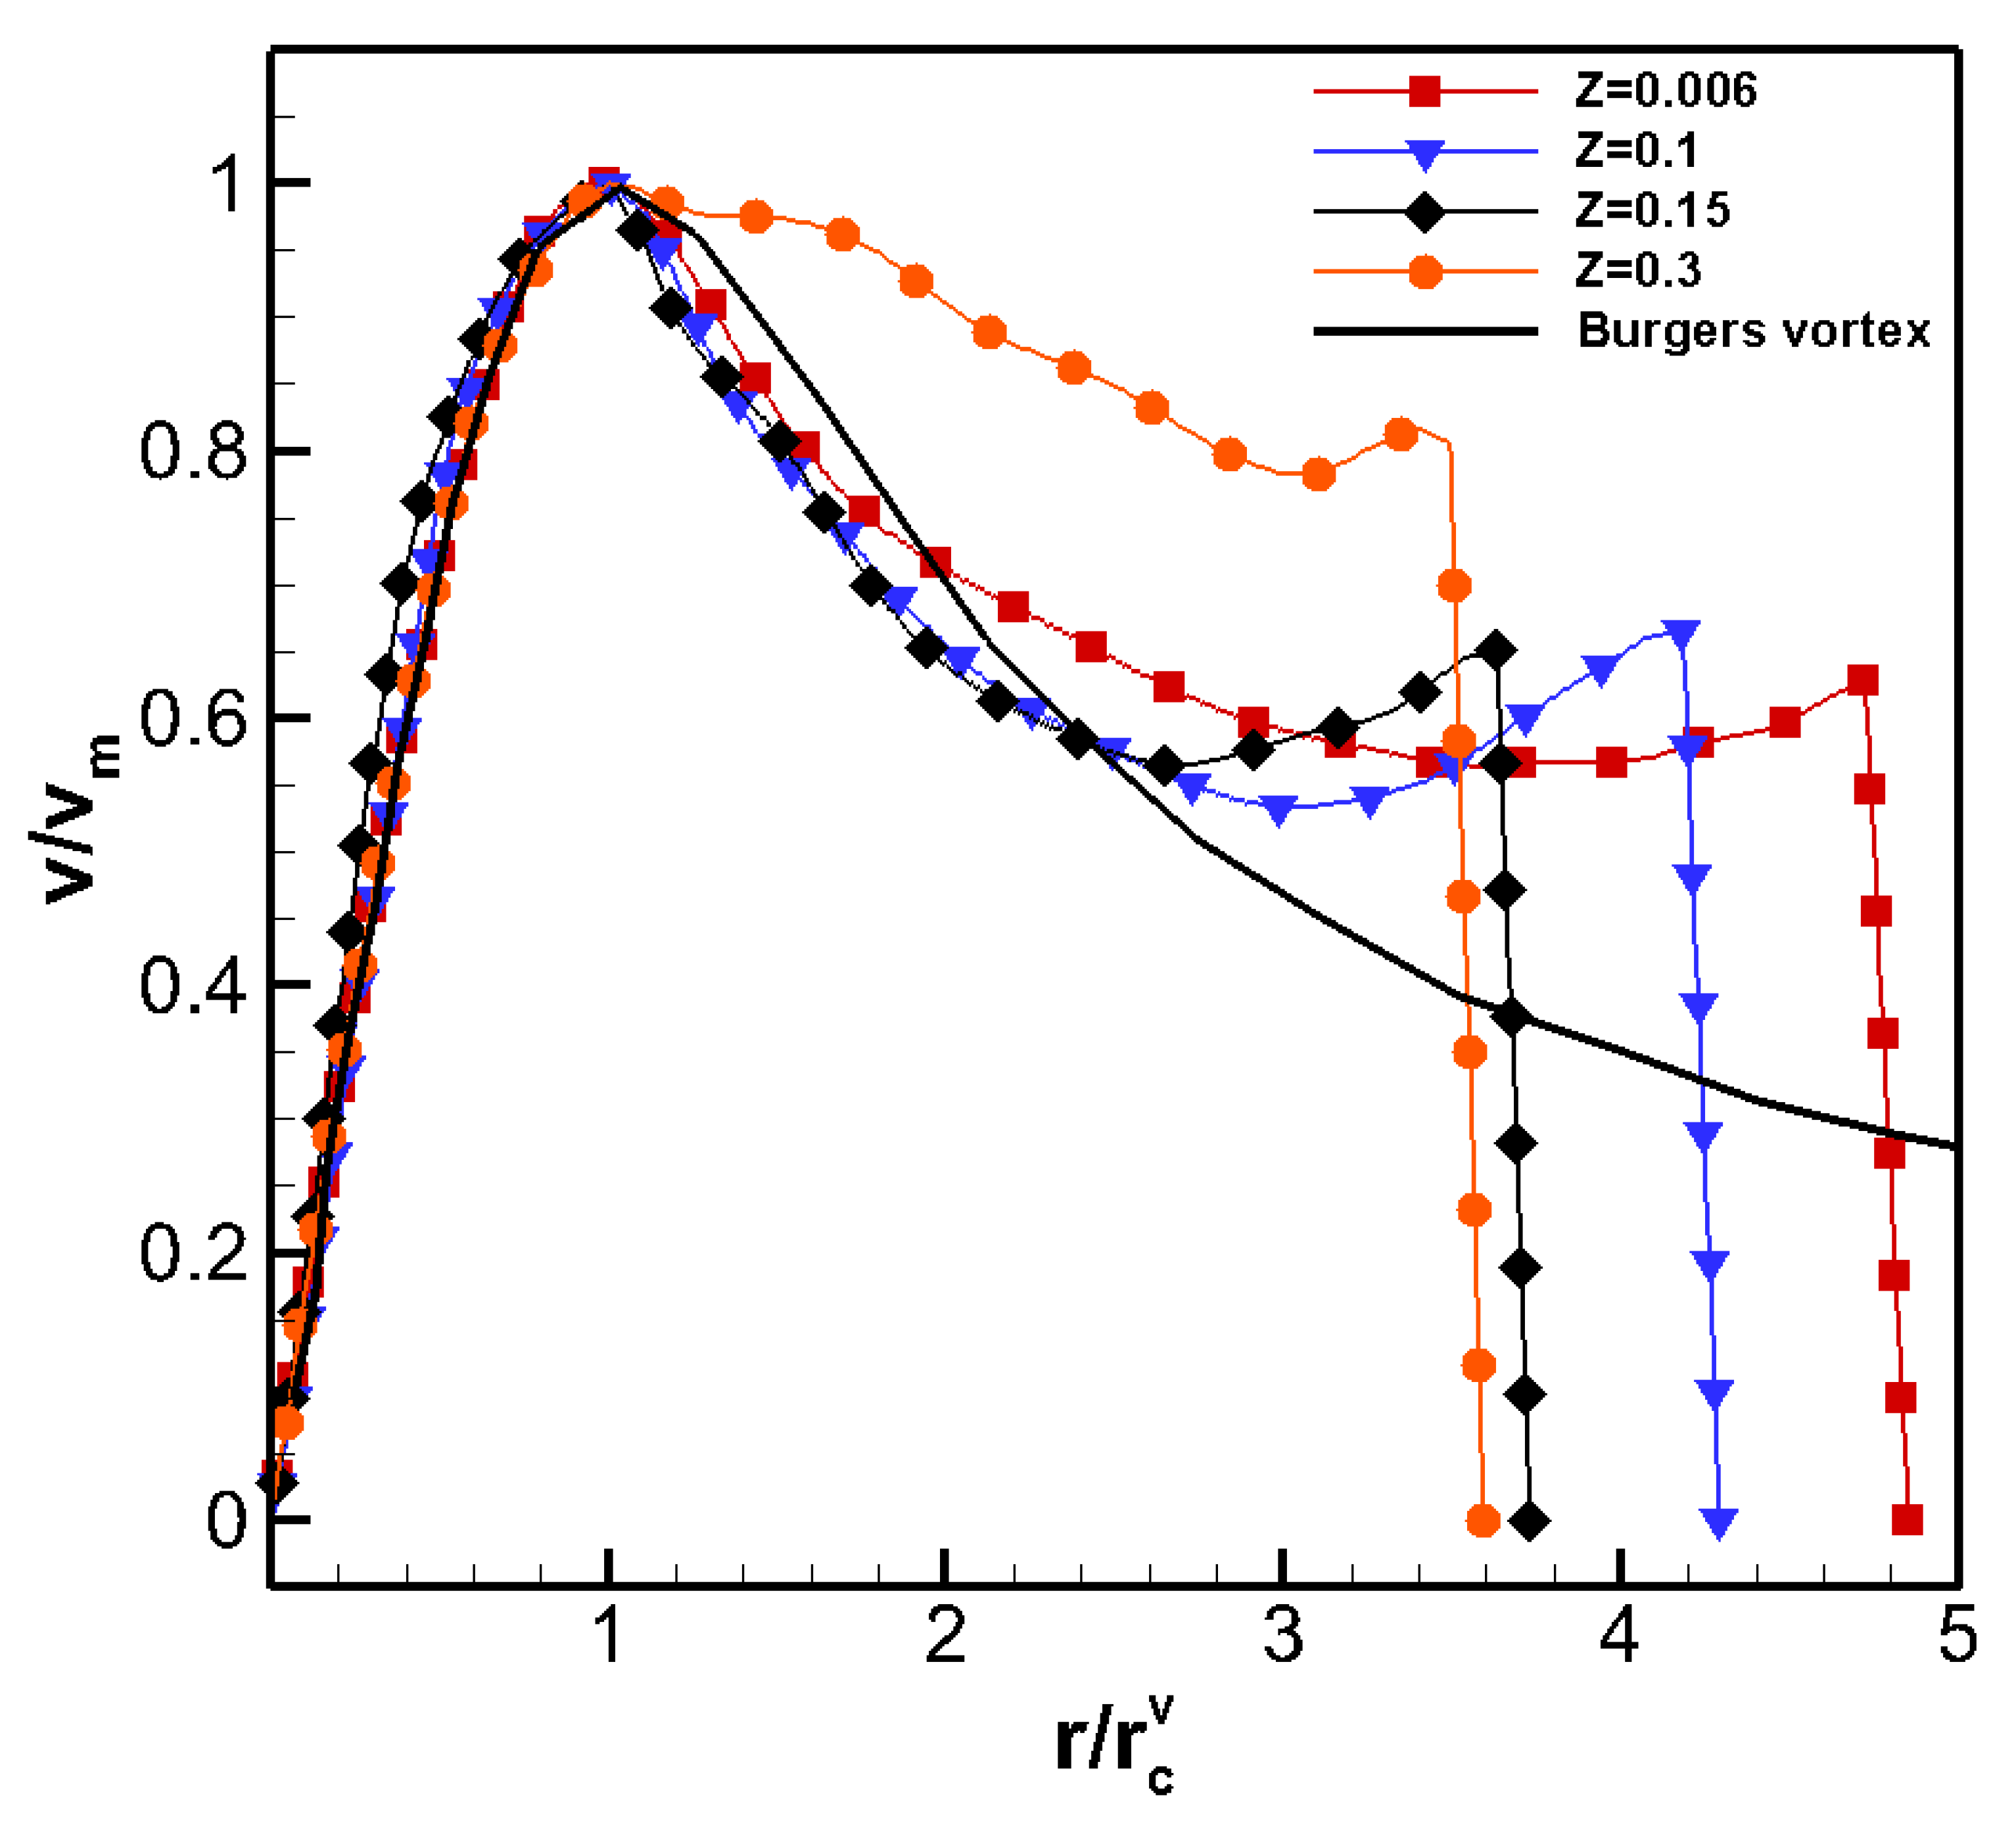
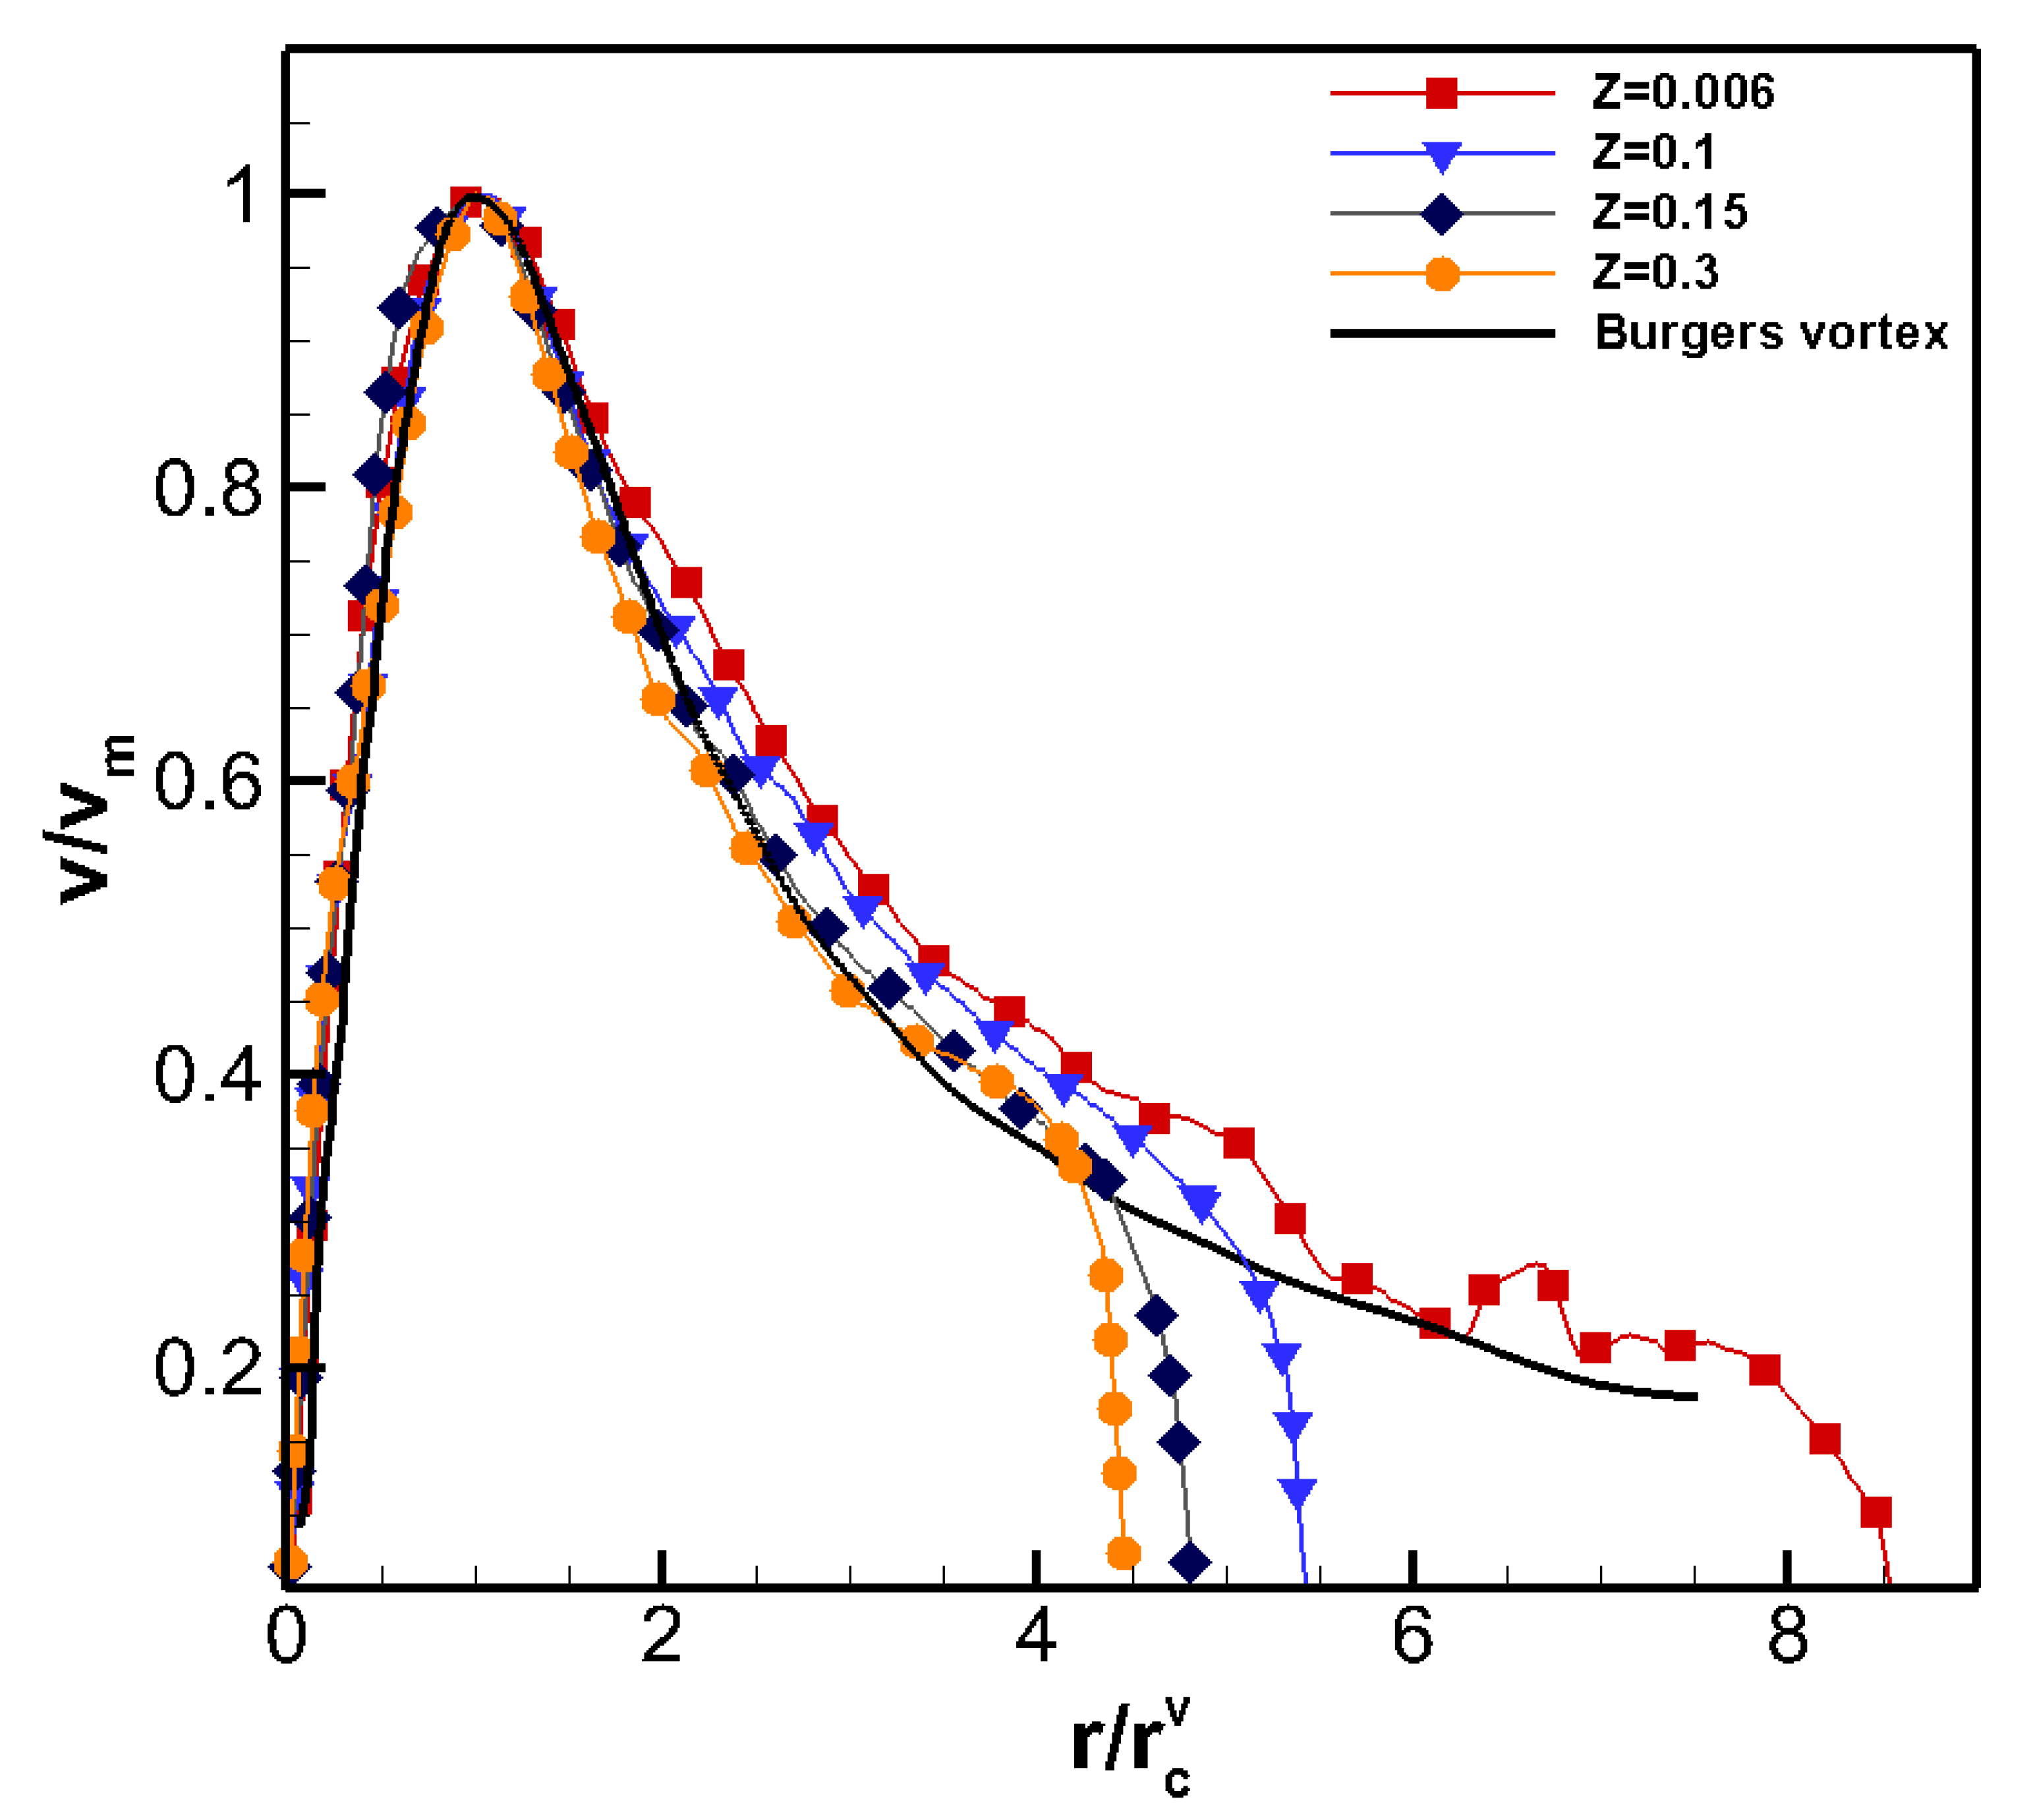
On the basis of many previous studies [7,14,18,19,20], velocity profile in the plane perpendicular to the whirl axis fits the Burgers vortex assumption that the vortex consists of an inner, rigid, rotating core and an outer, free vortex. According to previous studies [7,14,18,19,20], velocity profile in the plane perpendicular to the whirl axis aligns with the Burgers vortex assumption, where the vortex consists of an inner, rigid, rotating core and an outer, free vortex. The flow will be accelerated within the inner, rigid, rotating core and maximum tangential velocity will be achieved at the edge of the rotating core. On the other hand, the flow will be decelerated in the outer, free, vortex region. In this study, the tangential velocities were normalized by maximum tangential velocity ( v m ) and the radial positions were normalized by the radius of the maximum tangential velocity ( r c v ). The tangential vortex core radius is defined as the location where the tangential velocity equals the maximum tangential velocity at the same level [19]. In Figure 7 and Figure 8, the normalized tangential velocities were plotted against the normalized radial position for Case 1 and Case 3, respectively. Due to density difference, the tangential velocity will decrease along the vertical direction, the turbulence suppression will reduce, but the diameter of the vortex core will increase. As depicted in Figure 7 and Figure 8, the position where normalized tangential velocities achieved zero again tended to be closing to the centre of vertex core in both models. Within the inner, rigid, rotating core (e.g., r / r c v 1.0 ), the normalized tangential velocities of the half-cylinder model and vertical shaft model fitted well by the Burgers vortex line, and both of them increased quickly. Due to the smooth chambered wall surface in the half-cylinder model, the normalized tangential velocities at different heights decreased steadily within the outer, free vortex ( 1 < r / r c v 9 ). All velocities were reasonably against the Burgers vortex assumption. While, in the fully opened vertical shaft model, as a result of the effect of asymmetric ventilation condition and shaft geometry (e.g., flat wall), tangential velocities increased significantly at the near wall region and sharply decreased to zero at the wall surface, which meant that the air movement at the near wall region was related to inlet flow induced by the vertical gap. Moreover, the normalized velocity at normalized height equaled 0.3 ( z = 0.3 ), decayed slower than the line of the Burgers vortex function, and slightly increased at the near wall region. It indicated that the outer, free vortex at this level ( z = 0.3 ) was dominated by the air entrainment passing through the vertical gap.

4.4. Formation of Whirling Motion and Its Impact on Flame Shape and Height

With the validated temperature and velocity field, it was now possible to analyse the whirling structure and its relationship with the development of fire whirls within the two experiments. In the fire experiment by Chow and Han [13], different development stages of the fire whirl were identified based on the shape of the flame structure observed throughout the experiment. In the present numerical study, following the study by Lei et al. [19], the shape flame structure was presented by the iso-surface of the mixture fraction, where its value was equivalent to the stoichiometric ratio.
f = γ / ( ν + γ )
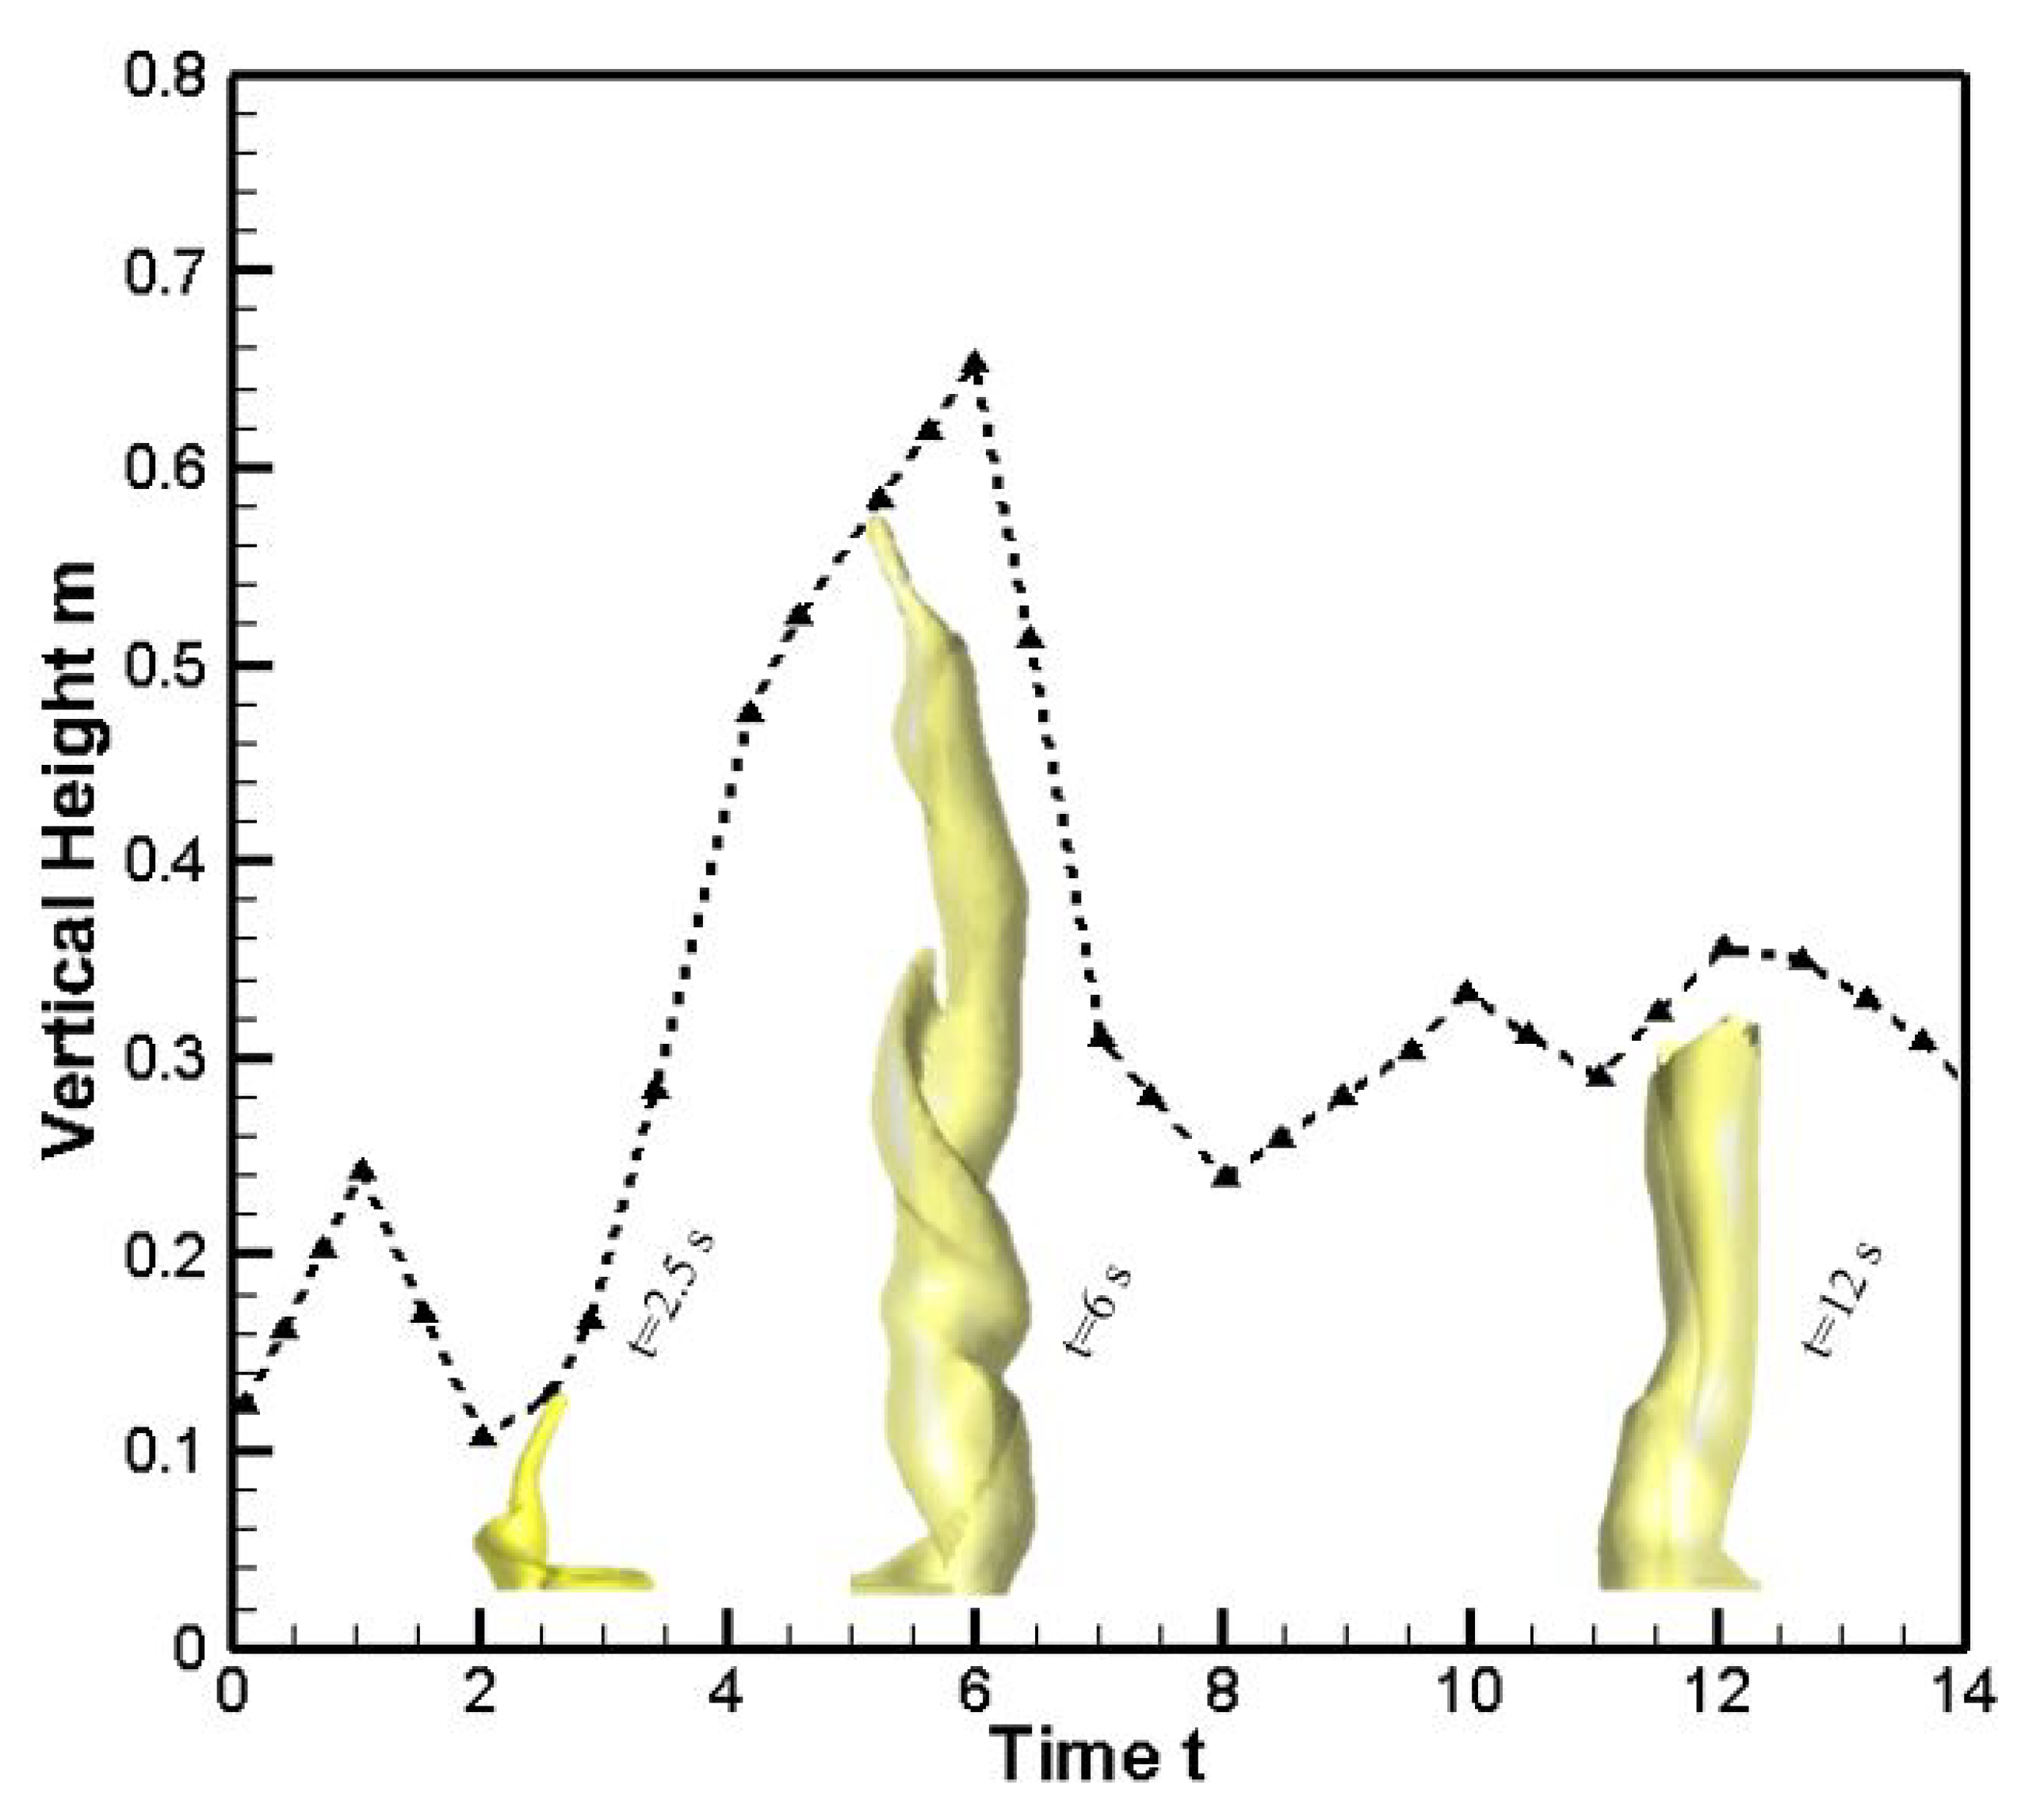
where γ = ( f u e l / a i r ) a c t u a l ( f u e l / a i r ) s t o i c h i o m e t r i c and ν is the air-to-fuel ratio on a mass basis. Equation (27) calculates the mixture fraction at stoichiometric conditions when ν = 1 . Figure 9 and Figure 10 show the predicted revolution of flame height and the instantaneous flame structure after fire ignition for Case 1 and Case 3, respectively. As depicted in the two figures, both fire whirl developments shared similar characteristics at the initial stage. The flame in both experiments first emerged as a free-standing plume fire after ignition (see the first flame height peak in both figures). Afterwards, due to the air entrainment, the fire structure became unstable and highly titled above the fuel bed. At this stage, the flame height reached its lowest point in both experiments. After the lowest point, the flame height gradually increased as the self-rotational motion started to strengthen and intensify the combustion and fire heat release rate. When the fire coupled with the self-rotational motion along the centreline above the fuel bed, the fire whirl attached to the fully developed stage, where flame structure was elongated to its maximum height (see the instantaneous flame structure at 6 and 6.4 s in both figures).
At the fully developed stage, the flame structure is strongly influenced by turbulent suppression. According to Liu et al. [18], depending on the imposed circulation, the fully developed fire whirl could exhibit three distinctive flame shapes: conical fire whirl, cylindrical fire whirl, and curved cylindrical fire whirl. Due to the different air entrainment mechanisms, the fully developed fire whirl also exhibited two different flame shapes in both experiments. As depicted in Figure 9, the predicted flame height decreased substantially after reaching the maximum point, indicating that the fire whirl transformed from conical to cylindrical fire whirl. Meanwhile, in the Hartl and Smits experiment, the predicted result showed that the fire whirl remained as a conical fire whirl and the flame height was retained at a similar level for an extended period.

4.5. Formation of Vortex Core Due to Asymmetric and Symmetric Air Entrainment

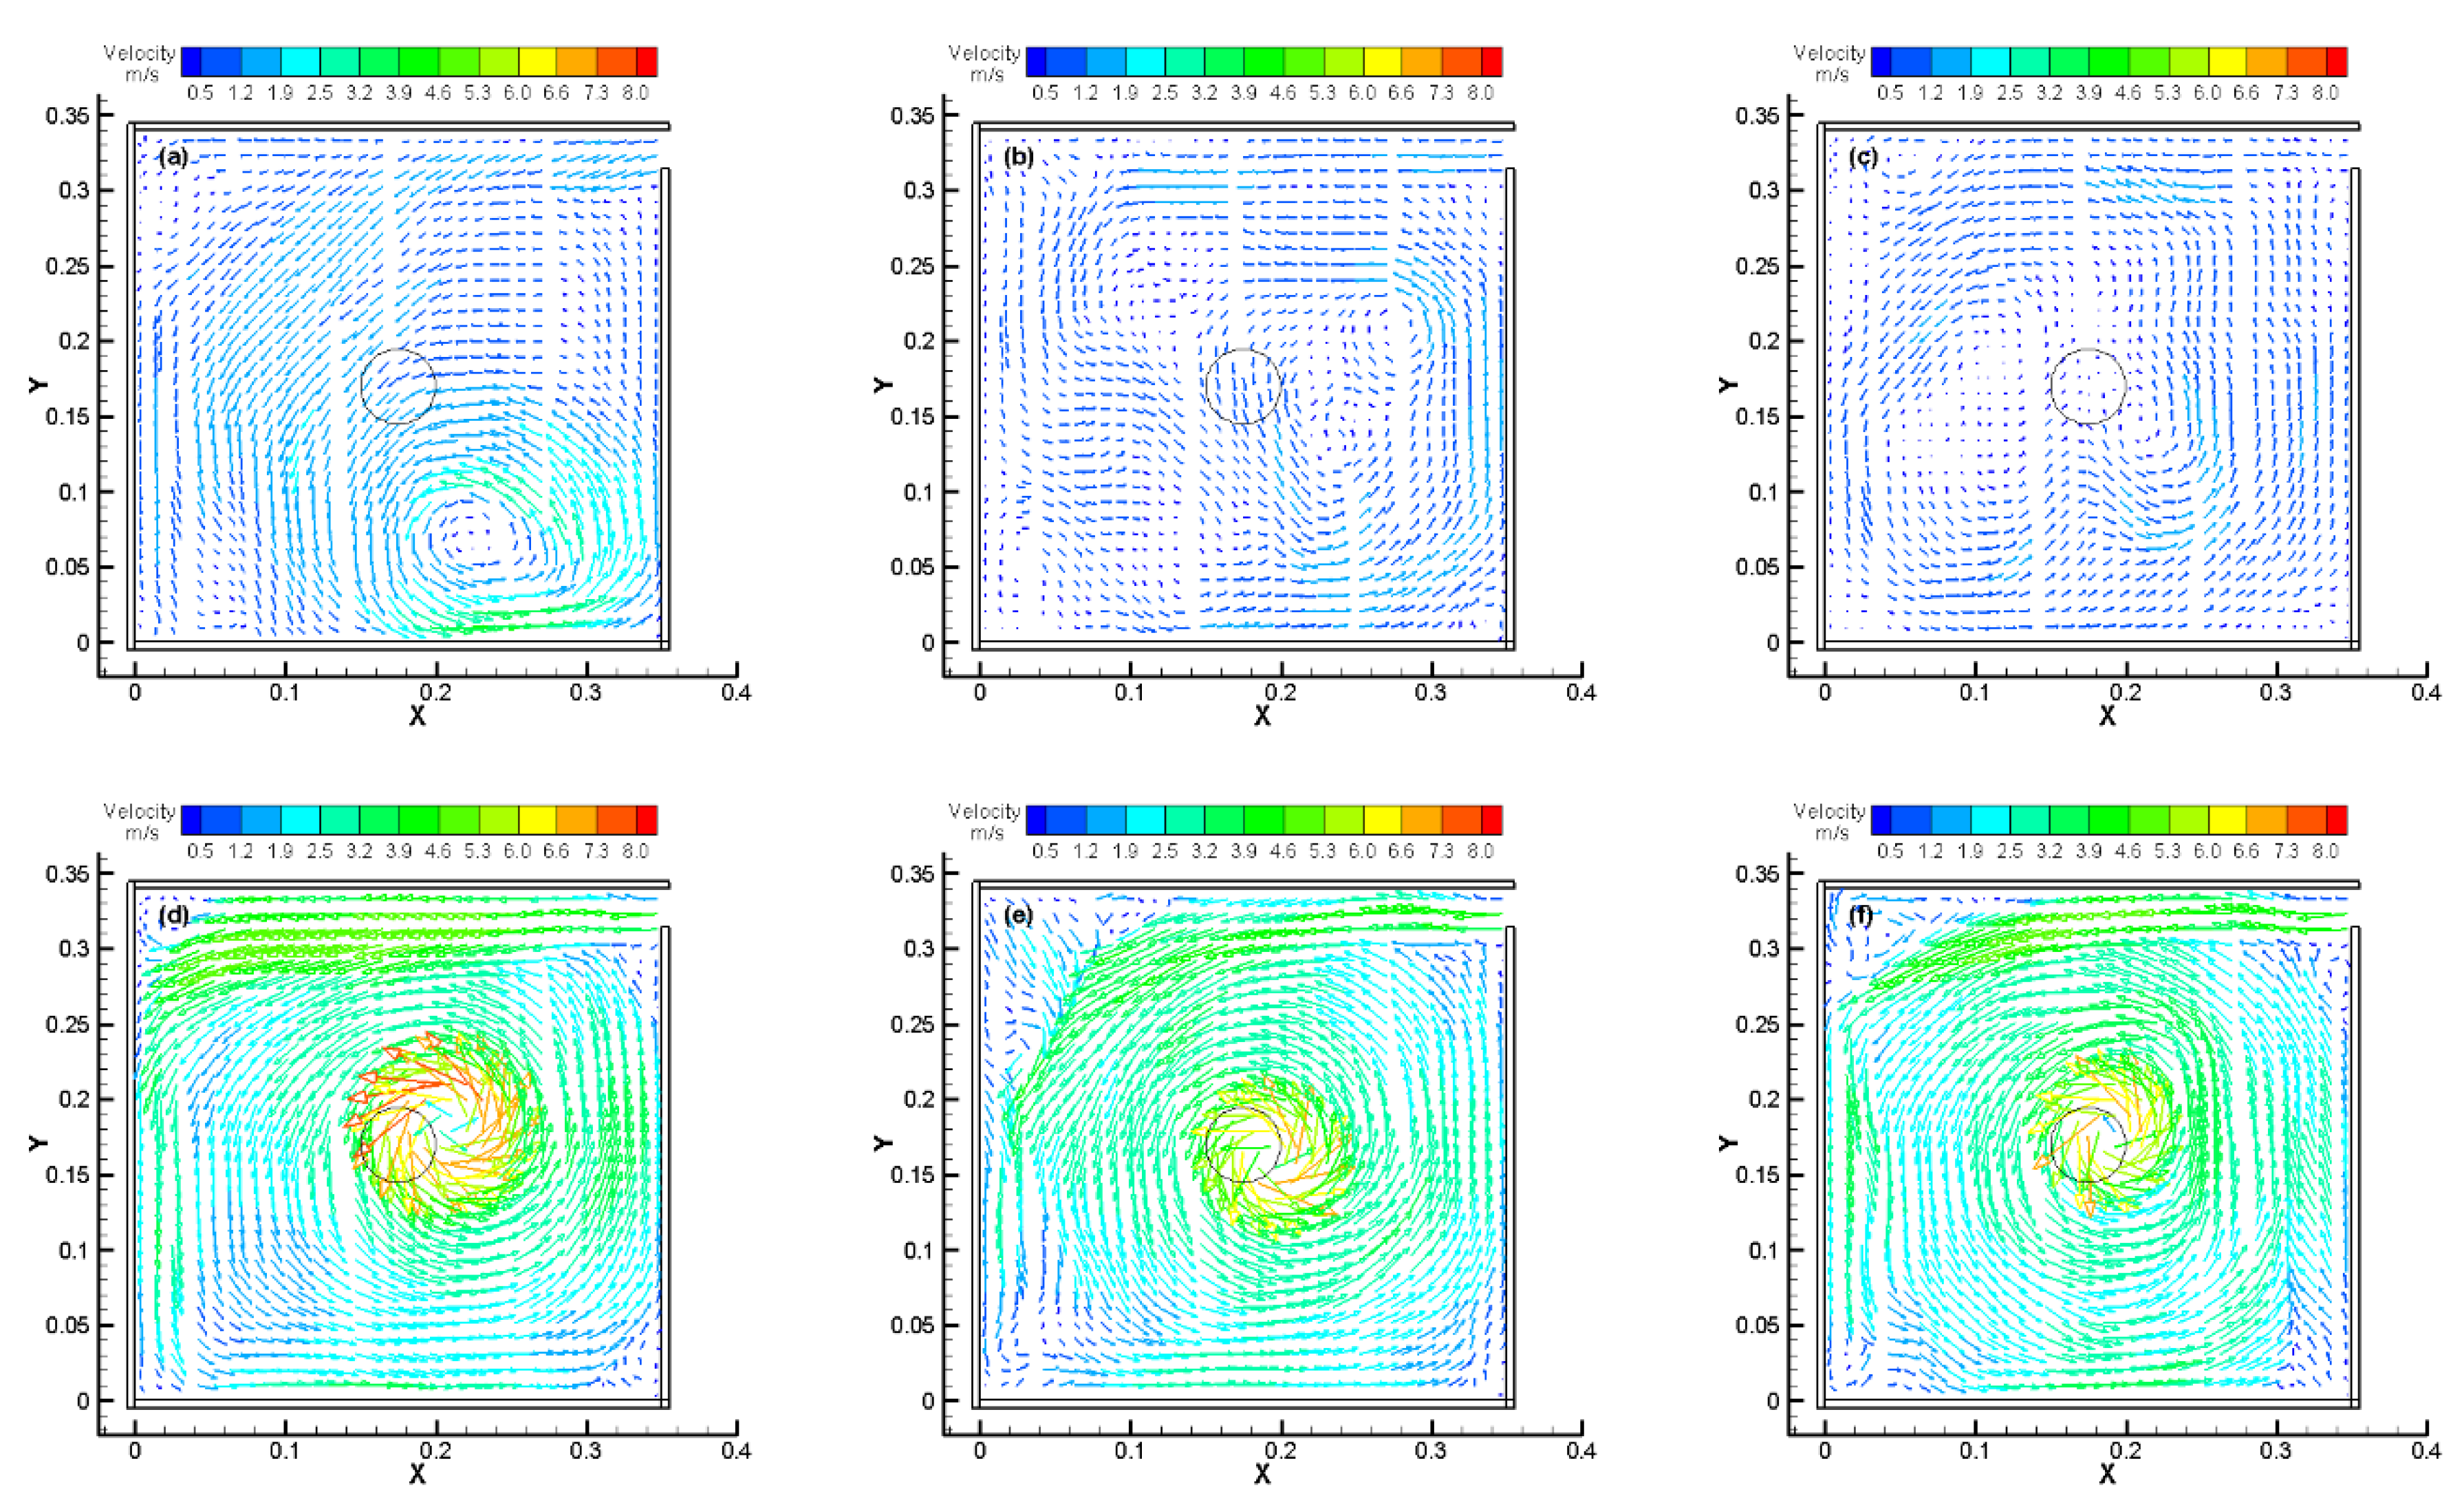
A closer examination of the predicted flow field could provide some insights on the whirling motion by induced air entrainment. Figure 11 and Figure 12 show the predicted instantaneous velocity field at three levels (i.e., 0.05, 0.25, and 0.45 m) above the fire bed for the two fire experiments (e.g., Case 1 and Case 3, respectively). Figure 11a–c shows the velocity distribution at the three levels when the fire whirl was at the flame rising stage (i.e., stage 2). As depicted, at the lower levels, the entrained air entered from the vertical gap and initiated a strong rotational vortex skewing towards the bottom left corner. This rotational vortex induced a leaning flame structure towards the vertical wall. At the higher level, the velocity distribution became more uniform, indicating that the rotational vortex was mainly concentrated at the lower levels. The resultant flame height was therefore substantially reduced. In the fully developed stage (i.e., stage 3), the vortex core was in cyclostrophic balance. A clear vortex core structure can be observed at all three levels (Figure 11d–f). It is noteworthy that the vortex core was slightly offset from the centreline of the fuel bed. This could be caused by asymmetric air entrainment from the single air gap, which also agreed with the experimental observations. In stage 4, the vortex core structures remained largely similar to that in stage 3. Tangential velocities between the vortex core and surrounding walls were however increased compared with that in stage 3, indicating that the flame structure transited to the cylindrical fire whirl shape. For the Hartl and Smits experiment, a similar velocity distribution and flow structure can also be observed. Although symmetric air entrainment was adopted in the experiment, as shown in Figure 11a, the predicted vortex cores were noticeably offset from the centre of the fire bed at the lower levels. This indicated that the fire whirl was at stage 2 of its development with a leaning flame structure and relatively reduced flame height. In the fully developed stage, due to symmetric air entrainment, a clear vortex core can be observed along the centreline of the fire bed. The vortex core and strength of its tangential velocity remained in the later stage (Figure 12d–f), indicating that the flame structure remained in the conical shape throughout the experiment.

4.6. Imposed Air Entrainment and Its Impact on the Vortex Core

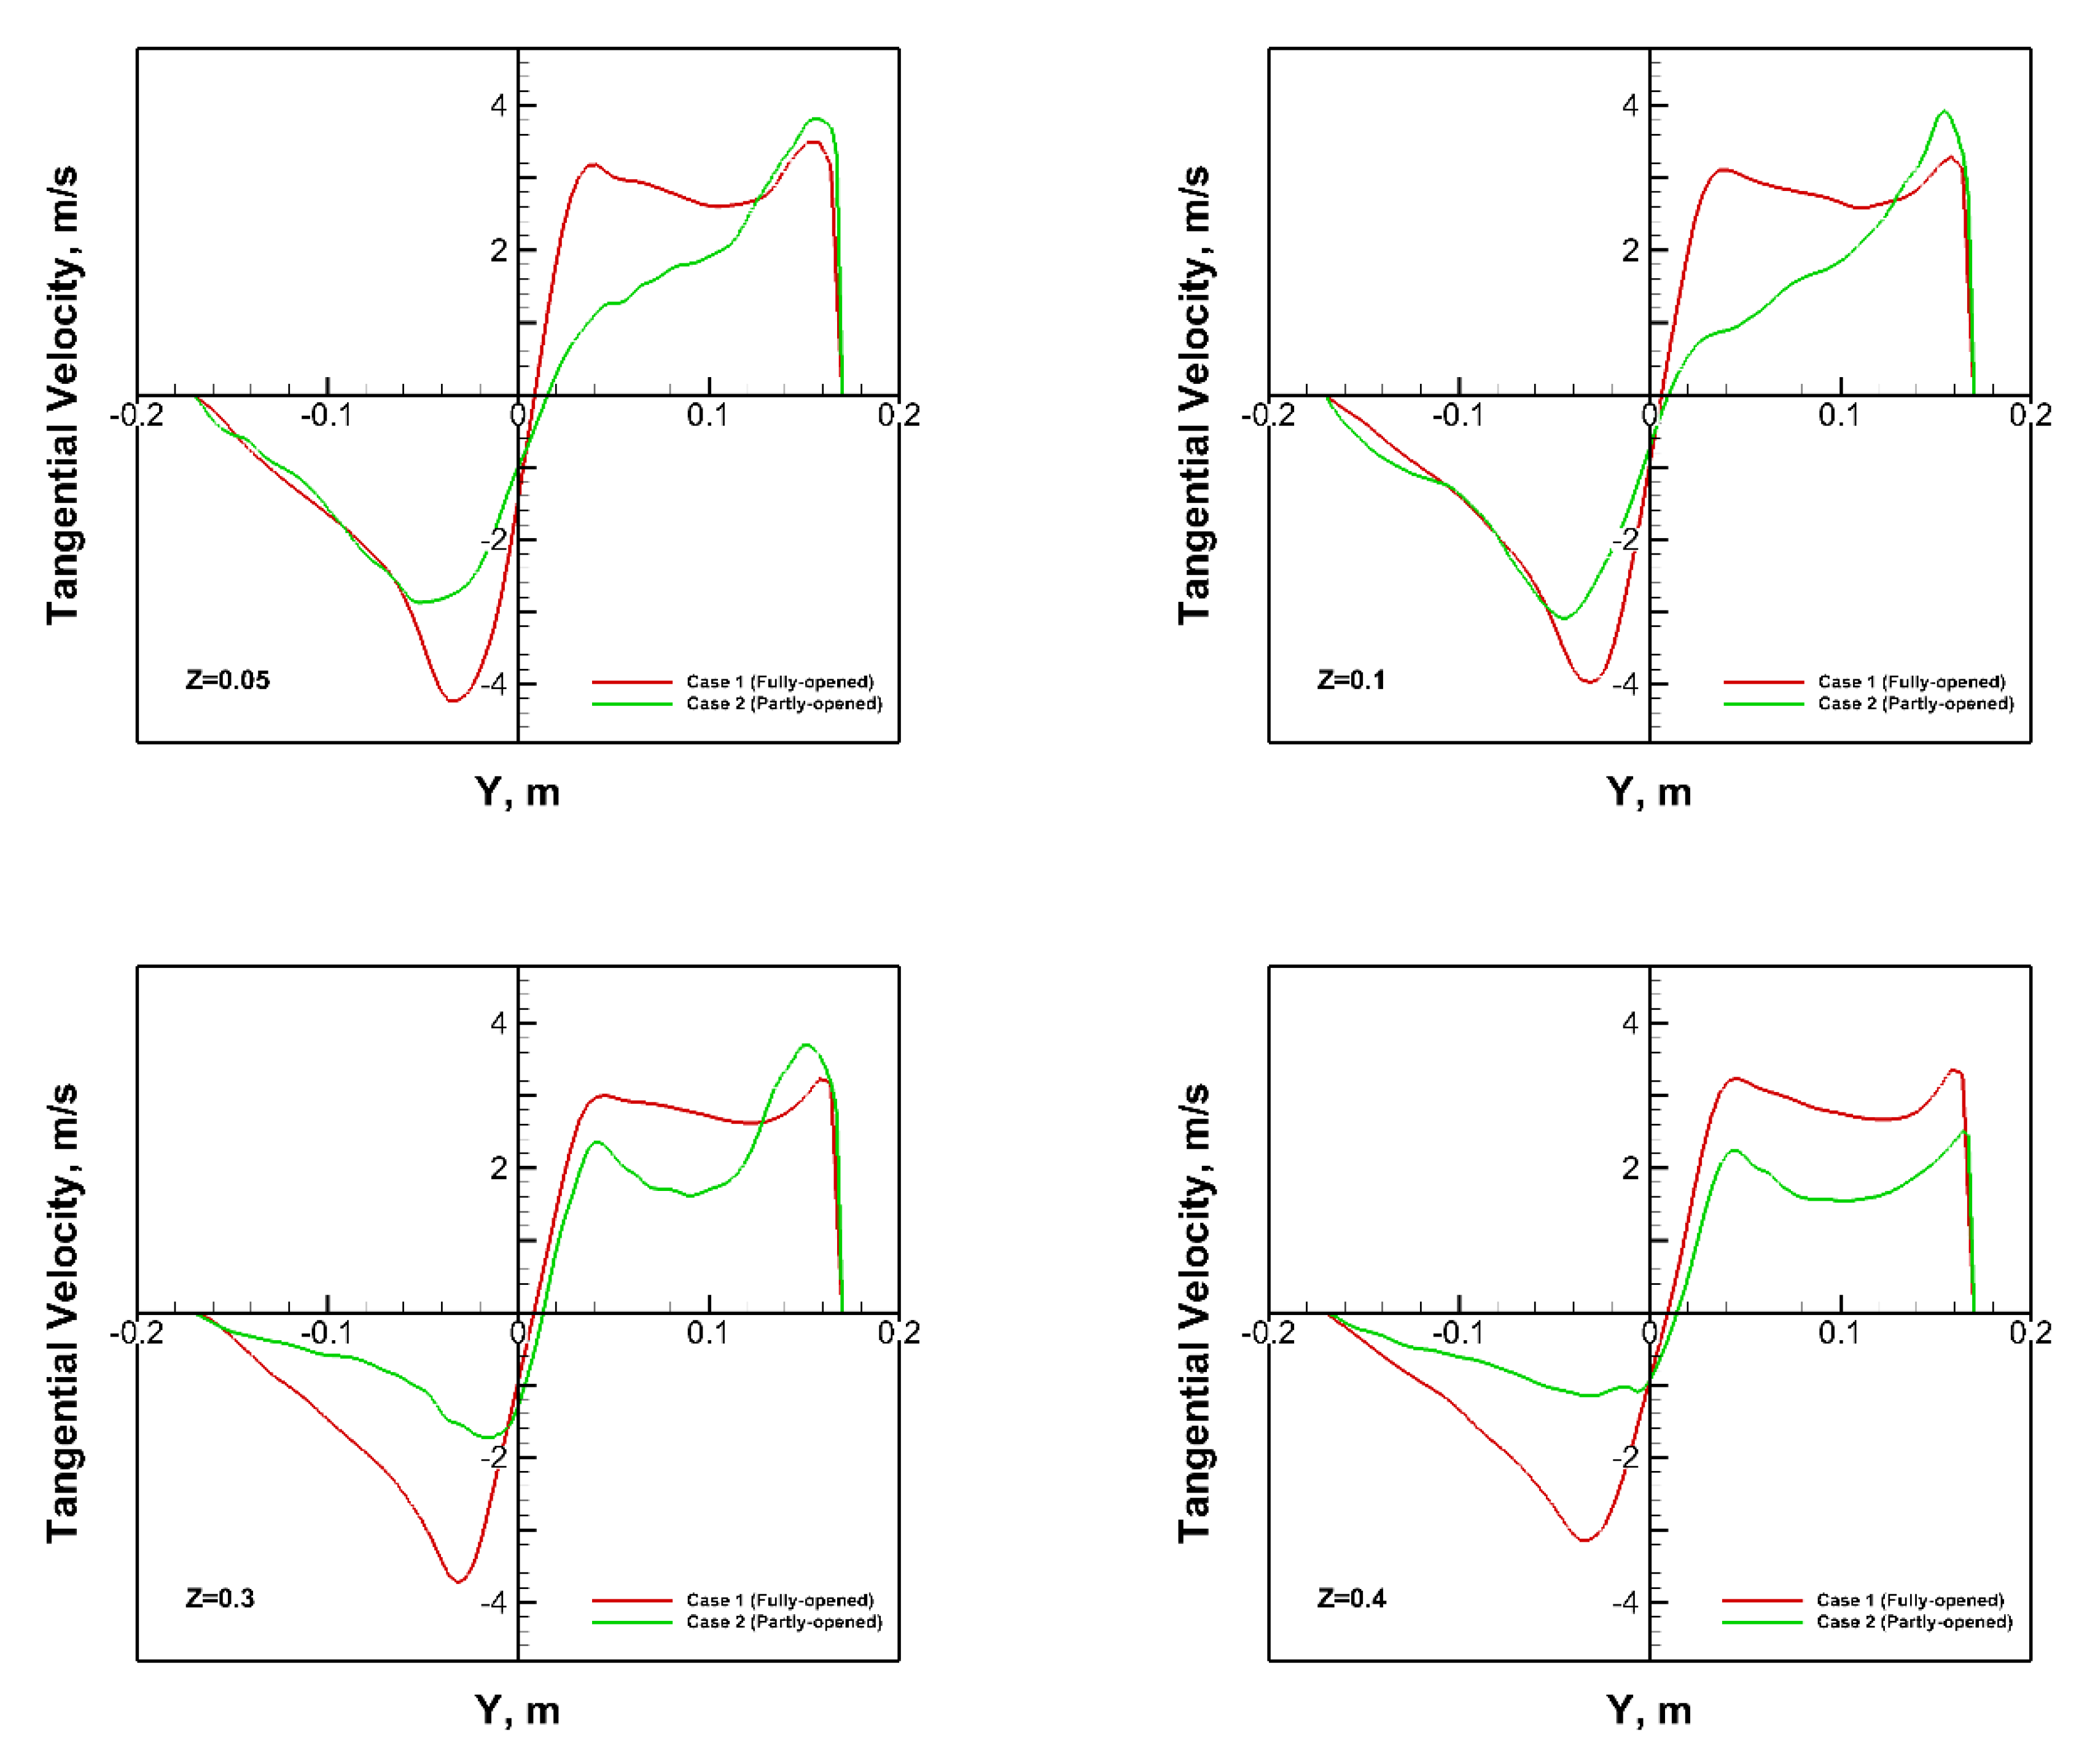
To investigate the influence of air entrainment on the formation and stability of the fire whirl, the vertical gap could be partially opened in the Chow and Han experiment. With the same aim, numerical simulations were also carried out to capture the air entrainment mechanism and its impact on fire whirl characteristics under a partially open configuration. In the present study, the vertical gap was partially opened to 0.4 m above the floor level (Figure 1a). Figure 13 shows the comparison of the predicted vortex core region of two fire whirls under the fully and partially opened ventilation conditions. The figure provides a clear visualization of the two distinguished types of behaviour of the two vortex cores. As depicted, under the fully opened ventilation condition, the vortex core exhibited a persistent, stable, rotating flow structure. The high vorticity core appeared to be a rigid-like body established above the fire bed and extended to the full height of the vertical shaft. In contrast, for the partially opened ventilation condition, the vortex core became an unstable and weak rotating structure. The height of the vortex core also reduced significantly below the height of opening (i.e., 0.4 m). The numerical simulation was in agreement with the experimental observations and ascertained that the impact of the imposed air entrainment was crucial on the onset of fire whirls and the stability of the vortex core.
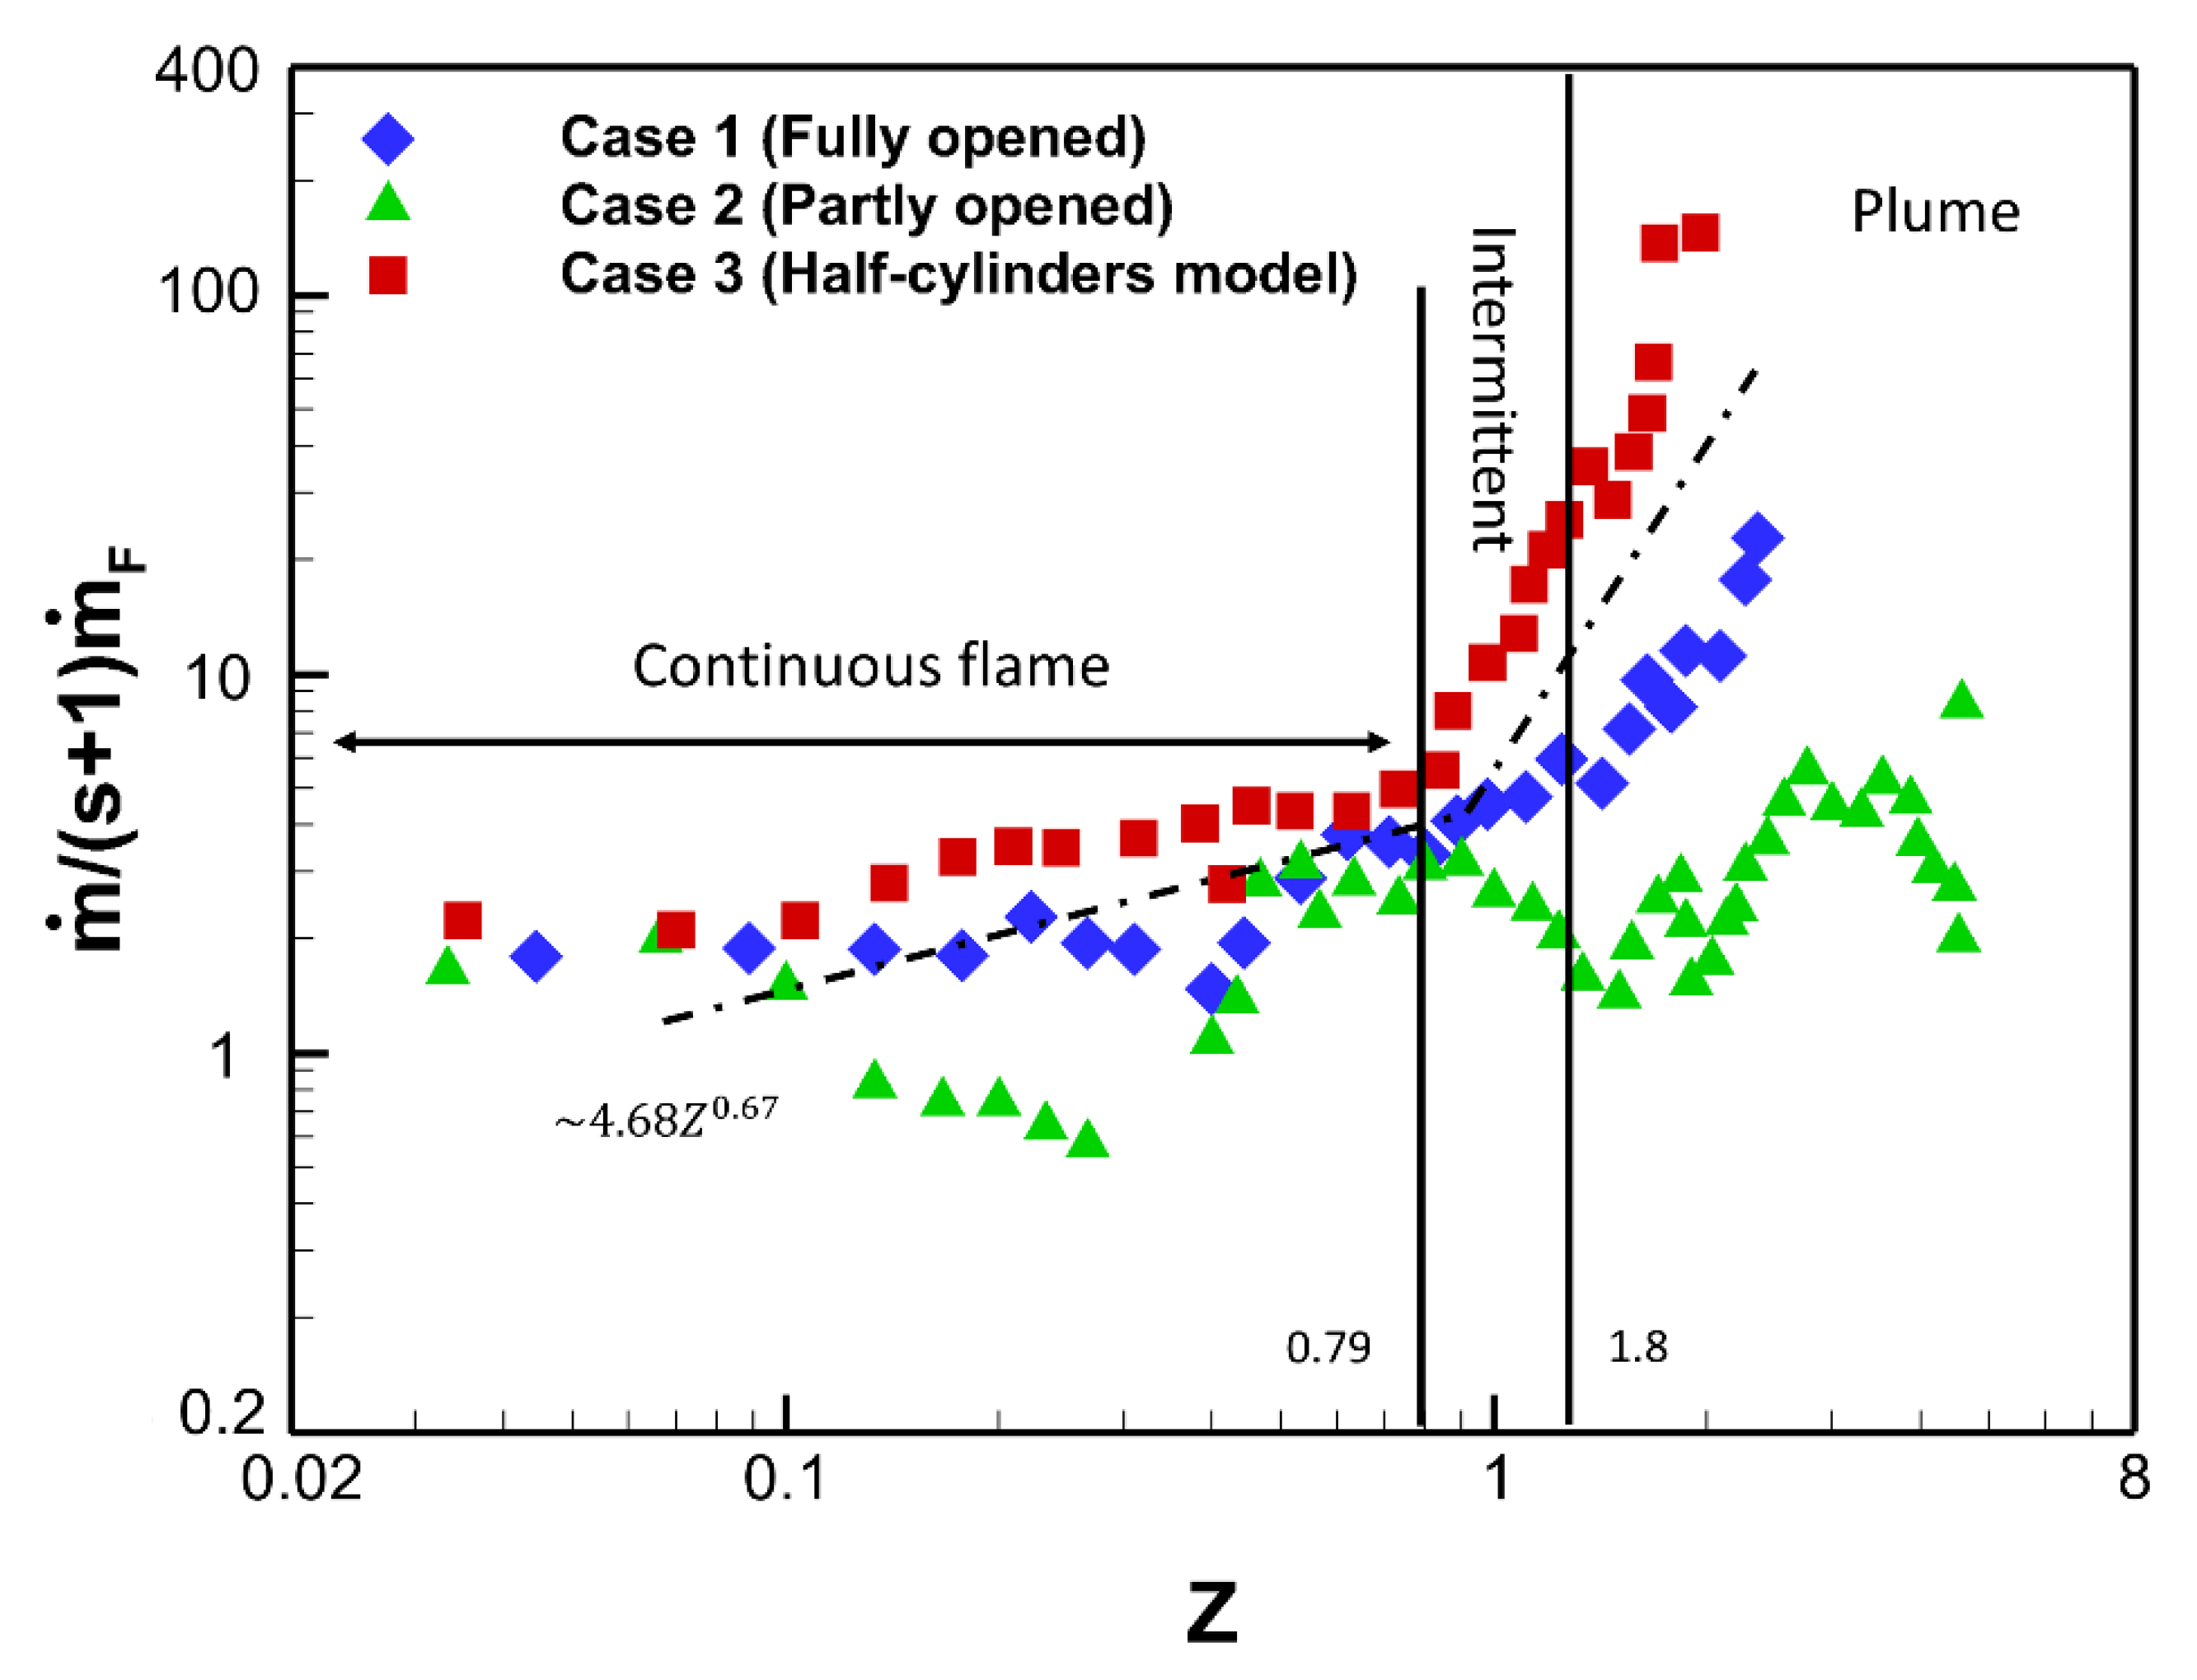
Figure 14 shows the predicted normalized mass flow rate, where ( s + 1 ) m ˙ f is the stoichiometric value with respect to the fuel, along with the normalized height of the fire whirl plumes. The axial mass flow rate ( m ˙ f ) can be obtained by the following numerical integration:
m ˙ f = 2 π 0 r c w ρ w ¯ r d r
Lei et al. [19] showed that, due to the stabilizing effect of fire whirl, the shear stresses are strictly suppressed. Therefore, in a fire whirl, the mass flux ρ w ¯ = ρ w . In addition, the integral upper limit r c w is the plume radius, where the axial velocity decays to the half-maximum value at the selected level, and w is the axial velocity. In general, throughout the fire whirl plume (i.e., along the continuous flame, intermittent flame, and plume region), a higher normalized mass flow rate was imposed on the fire whirl in the Hartl and Smits experiment. This was caused by the axisymmetric two-sided opening configuration. For the Chow and Han experiment, within the continuous flame region, there was no substantial difference between the fully and partially opened ventilation conditions. It indicated that the air entrainment behaviour in the bottom of the inflow boundary layer was similar in both cases. In the intermittent and plume regions, the mass flow rate of air entrainment decreased significantly from 1 to 0.5 due to blockage of opening. On the other hand, the air entrainment increased gradually with the height for the fully opened case. The decreased air entrainment might not be sufficient to sustain the combustion causing instability of the flame structure. This also explained the longer burning time (indicating a lower heat release rate) as reported in the experiment.
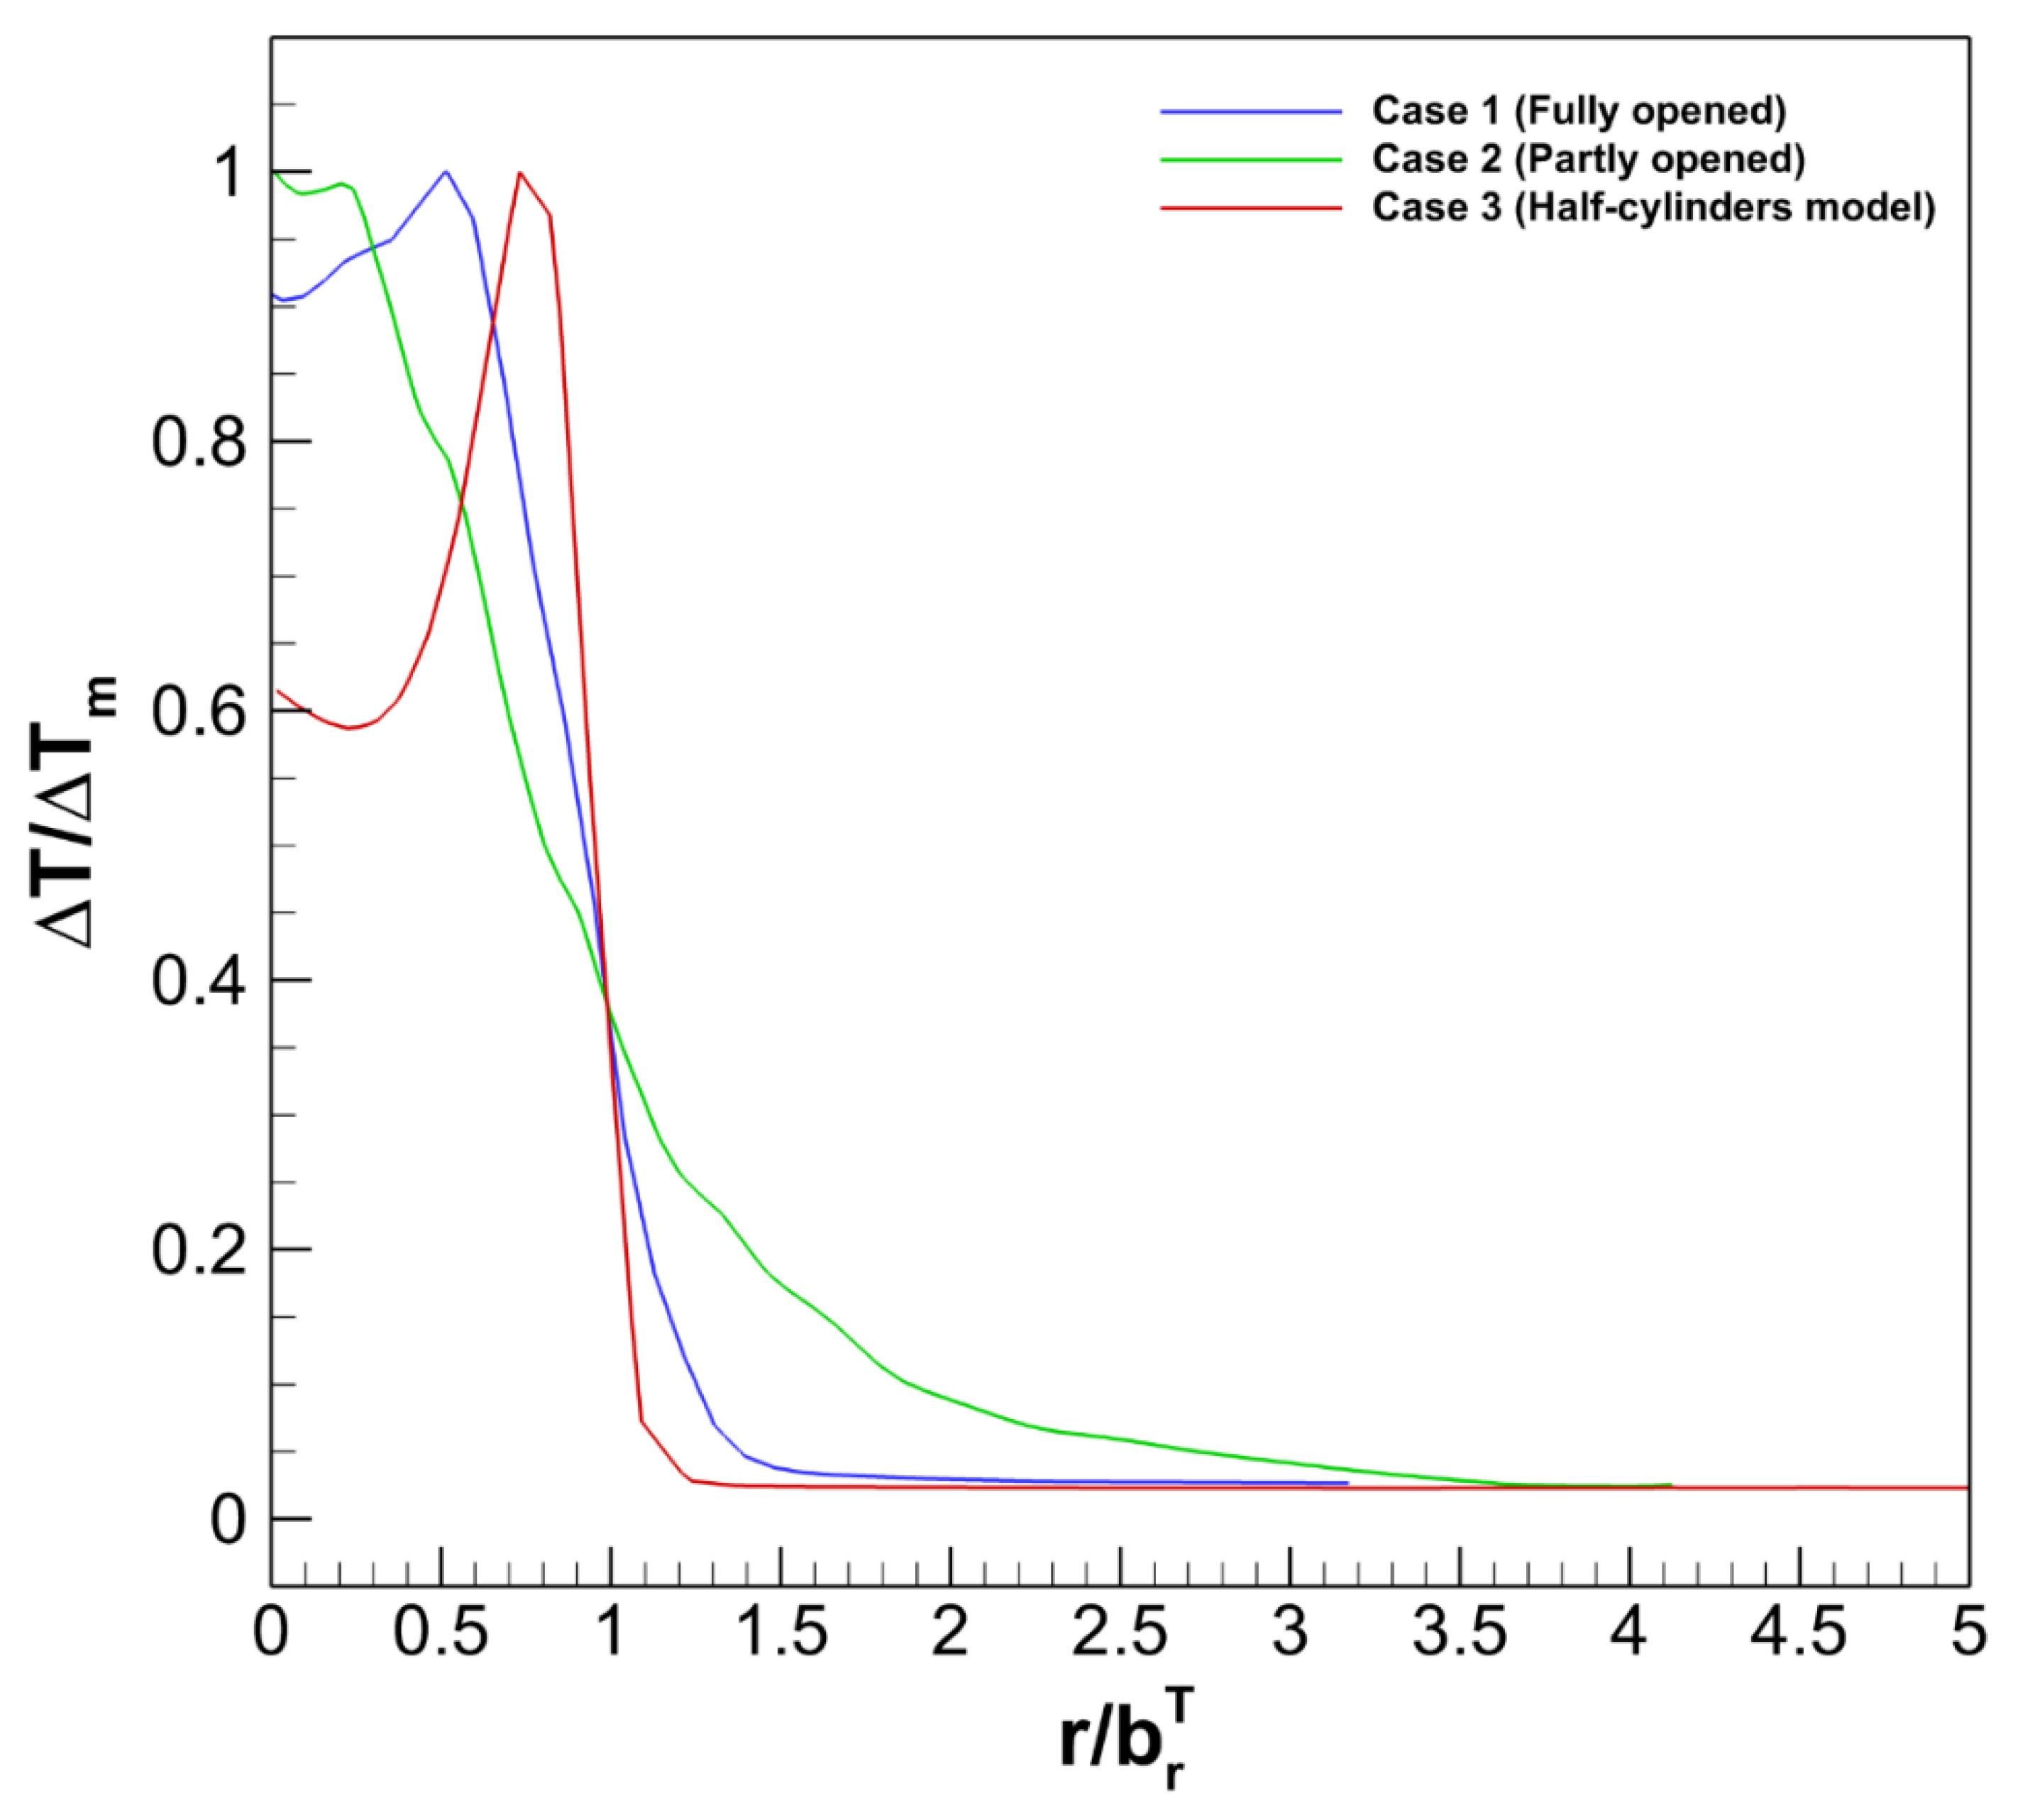
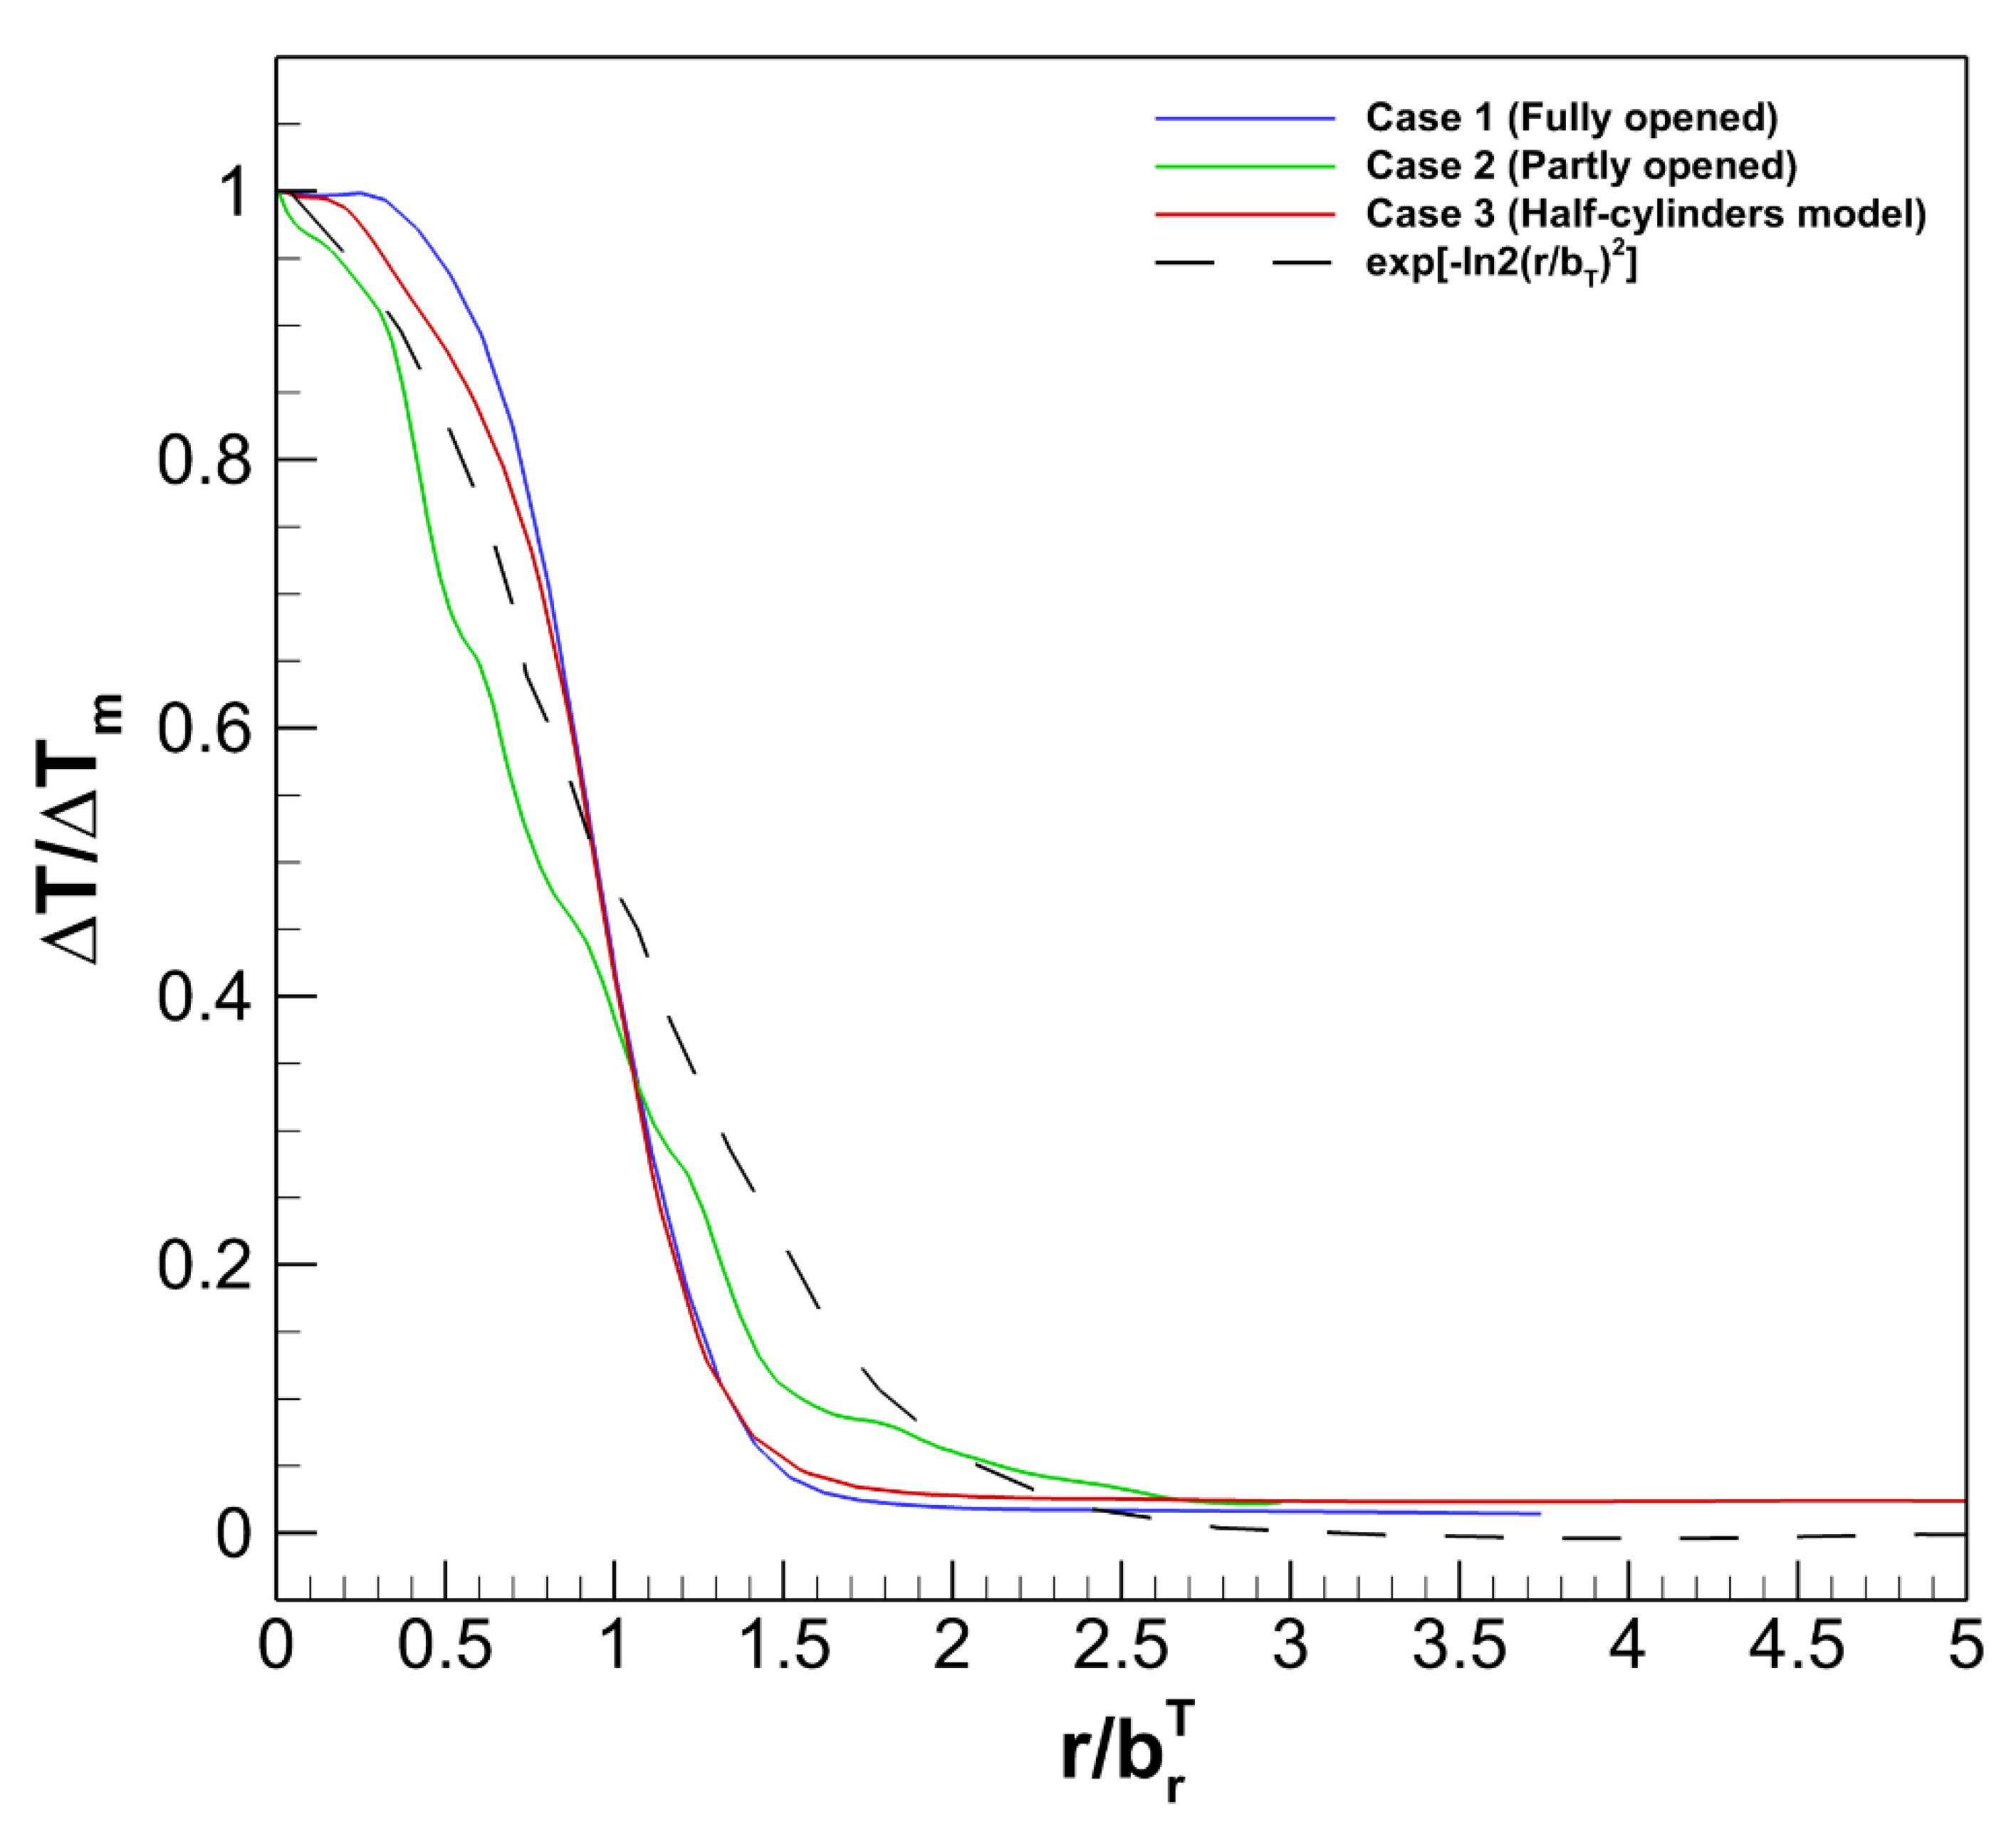
The impact of air entrainment on the combustion process can be evidenced in Figure 15 and Figure 16, which show the normalized radial profile of excess temperature in the continuous and intermittent regions for three fire whirl plumes. Here, the radial profile was normalized by the vortex core radius defined by the maximum tangential velocity. As depicted, in the continuous region, one can observe a noticeable temperature dip within the vortex core (i.e., below 1) in the Hartl and Smits experiment. This indicated a fuel-rich condition within the vortex core, where the excess temperature was suppressed due to limited oxygen. It is well known that the flow within the vortex core is in cyclostrophic balance, where radial fluid motion is suppressed, causing limited mixing within the core structure. The higher the swirling of the vortex core, the stronger the suppression is imposed in the mixing. A similar temperature dip can also be observed in the fully opened Chow and Han experiment. Nevertheless, an insignificant decrease in temperature was shown for the partially opened case, indicating a relatively weak rotational motion and radial motion suppression within the vortex core. Excess temperature, caused by the radial heat transfer towards the centre of the core, exhibited a plateau-like distribution within the vortex core. As depicted, the temperature profile started to decay rapidly at the vicinity of the vortex core. The decay profiles were in satisfactory agreement with the empirical decay functions proposed by Lei et al. [19]. For the partially opened case, a noticeable fluctuation in temperature can be observed along the radial direction. This was caused by the noise in the time-averaging process, where a fire whirl structure was found unstable under the partially opened condition.

4.7. Tangential Velocity and Stability of the Vortex Core

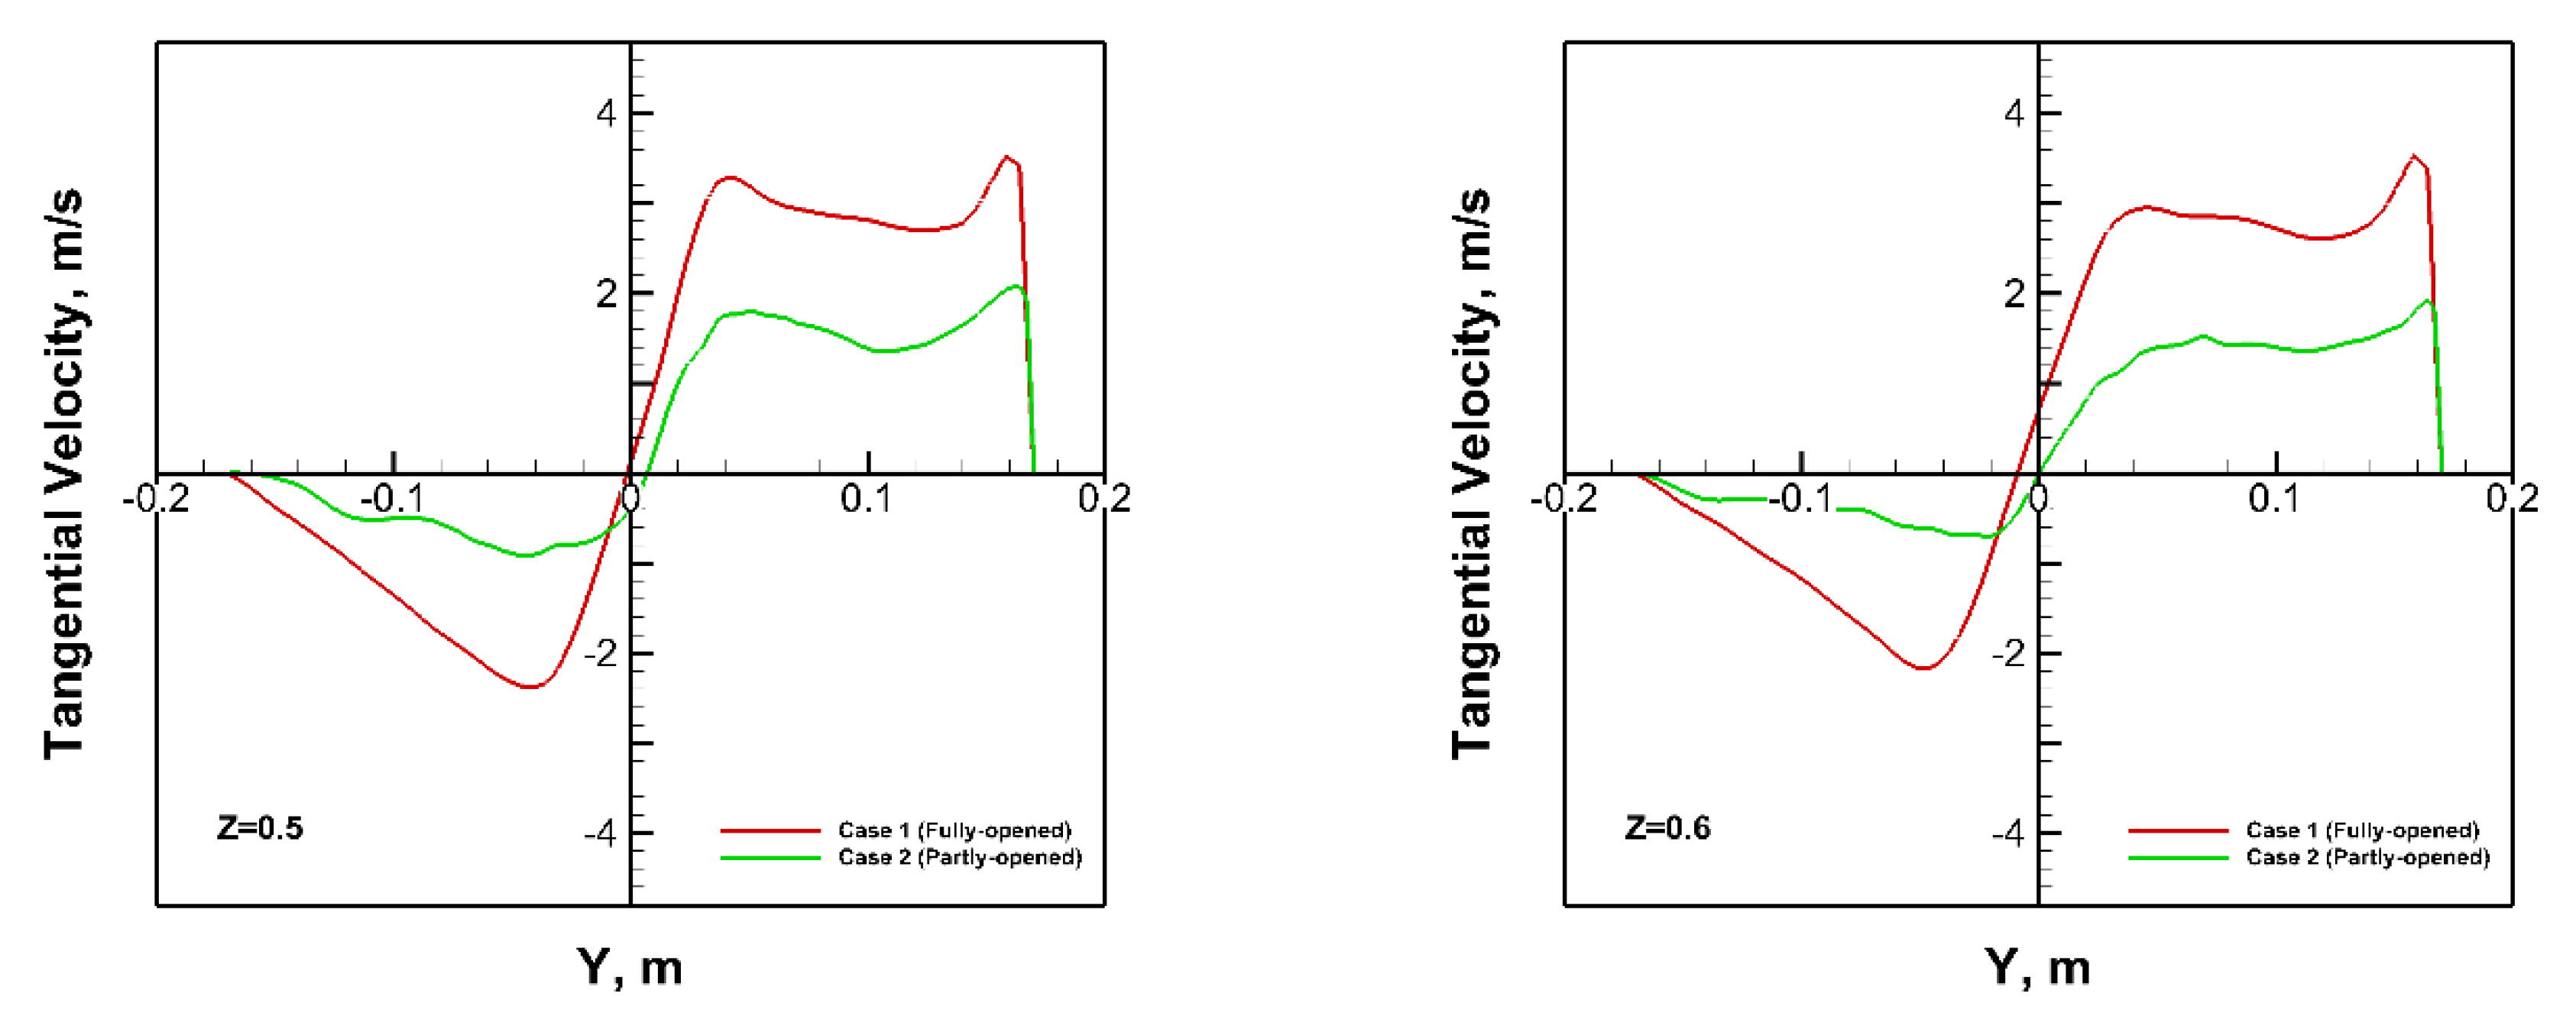
Figure 17 shows the predicted time-averaged tangential velocity along the vertical centreline of the fire bed under the fully and partially opened ventilation conditions. As depicted, at the bottom boundary layer levels (i.e., z = 0.05–0.1 m), circulation motion was imposed by the entrained air from the opening. Due to the restricted opening (i.e., less opening area), the imposed tangential velocities from the partially opened case were slightly higher than that of the fully opened one. For the fully opened case, starting from z = 0.1 m, two noticeable velocity peaks were found near the centre. It is worth noting that the two peaks were of the similar absolute magnitude, which was roughly equal to imposed air entrainment, indicating the onset of the self-rotating vortex core. On the other hand, for the partially opened case, there was no distinct velocity peak within the bottom boundary layer. The absence of tangential peaks suggested no formation of vortex core due to the relatively weak circulation motion. Similar findings are also shown in Figure 13, where vortex core was not visible in the bottom boundary layer for the partially opened case. The onset of self-rotating vortex core was only found at a higher level (i.e., z = 0.3–0.4 m). Beyond the opening (i.e., z = 0.5–0.6 m), without the imposed air entrainment, the vortex core started to collapse, while the rotating motions dissipated to the outer vortex region. The predictions suggested that imposed circulation was crucial to maintain the stability of the vortex core. In contrast, with the consistent entrained air, the vortex core remained stable in the fully opened case.

5. Conclusions

In this article, numerical simulations were performed to attempt to thoroughly validate a generic fire field. The generic fire field incorporated all essential physical considerations in fire dynamics, including LES turbulent closure, subgrid-scale combustion with presumed PDF approach, discrete ordinates radiation model, and two-equation soot formation model. To the best of our knowledge, for the first time, the numerical predictions were thoroughly validated against two experimental small-scale fire whirl measurements, where temperature and detailed velocity field were recorded. The predicted temperature profile and velocity field at the vicinity of the vortex core were in good agreement with the experimental results. The presented validation ascertained the capacity and potential of the adopted fire field model in capturing the swirling vortex and dynamic behaviour of fire whirls. Quantitative analyses were carried out based on the validated numerical model. The major findings are summarized as follows:
1
The centreline temperature variations within the continuous flame are consistent with the empirical correlation by Lei et al. [18] based on their medium-scale fire whirl measurements.
2
The dimensionless study shows that the tangential velocity within the vortex core follows the fundamental Burgers vortex equation. In the Chow and Han experiment, the tangential velocities start to increase and deviate from the Burgers equation at approximately three times of the vortex radius, where air entrainment from the ventilation gap is imposed. In the Hartl and Smits experiment, the tangential velocities decay rapidly at r / r c v 4 due to the boundary of the two half-cylinders.
3
The development stages of the fire whirls, including the flame rising, fully developed conical fire, and fully developed cylindrical fire stages, are successfully captured by the numerical model.
4
The swirling velocity within the vortex core suppresses the fuel–air mixing and its associated combustion process, causing a noticeable temperature dip at the fire centre. A stronger swirling motion results in a more significant temperature decrease.
5
The air entrainment is crucial in providing imposed circulation for the onset of self-rotating fire whirls. A partially opened ventilation gap significantly weakens the circulation motion, causing insufficient air entrainment within the inflow boundary layer and causing instability to the fire whirl structure. The numerical findings confirm that the strong inflow boundary layer is the key factor affecting the onset of self-rotational motion of fire whirls.

Author Contributions

Data curation, X.F.; Investigation, X.F.; Supervision, A.C.Y.Y., G.H.Y., E.W.M.L. and S.C.P.C.; Writing—original draft, X.F., Writing—review & editing, S.C.P.C. All authors have read and agreed to the published version of the manuscript.

Funding

The financial support provided by the Australian Research Council Industrial Training Transformation Centre (IC170100032) is gratefully acknowledged.

Conflicts of Interest

The authors declare no conflicts of interest.

Nomenclature

a, bExponents of the beta probability density function
b n u c * Normalized radical nuclei concentration
C p Specific heat ( J · k g 1 · K 1 )
C s Smagorinsky constant
Cα, Cβ, Cγ, C ω , C o x i d Exponential constants for soot quantities
C v a r Dynamic stress constant
D Fire bed width
E b Blackbody radiation
g ¯ Gravitational vector
h f , i O The ith species standard heat of formation
h s Sensible enthalpy
h i 0 ( T r e f , i ) Formation enthalpy at the reference temperature
H ¯ Mean enthalpy
I j Radiation intensities
k t Turbulent thermal conductivity
K a Gas radiative absorption coefficient
K a . g , K a , s Absorption coefficients for filter gas and soot
k A , k B , k C , k Z Reaction coefficients for soot oxidation
m ˙ f Axial mass flow rate
M Soot mass concentration
N Soot number density
pPressure
PrPrandtl number
p ( f ) Beta probability density function (PDF)
q j Scalar quantities diffusion flux
rPlume radial
ScSchmidt number
S h Source term of the radiation
S ¯ s o o t Mean reaction rate
TTemperature
T a , T γ Activation temperatures for soot quantities
t Time
uiVelocity vector
Y s o o t Soot mass fraction
f 2 Mixture fraction variance
fMixture fraction
X p r e c Mole fraction of soot precursor
ZNormalized vertical height
Greek letters
α Rate of particle nucleation for soot number density
β Rate of particle nucleation for soot number density
μ t Turbulent viscosity
σ Stefan–Boltzmann constant
σ i j Stress tensor due to molecular viscosity
ρ Density
ρ s o o t Mass density of soot
τ i j Subgrid-scale stress
ζ n Soot particle number
ζ s Soot volume fraction
ΔSubgrid length scale
ζ i , η i , ξ i Direction cosines
φ Scale quantities
γ Air-to-fuel ratio on a mass basis
Subscripts
hRadiative and heat transfer to wall boundaries
cVortex core
sootSoot
tTurbulence
fFlame
Ambient
Superscripts
wAxial velocity
vTangential velocity

References

  1. Chuah, K.H.; Kuwana, K.; Saito, K. Modeling a fire whirl generated over a 5-cm-diameter methanol pool fire. Combust. Flame 2009, 156, 1828–1833. [Google Scholar] [CrossRef]
  2. Lei, J.; Liu, N.; Lozano, J.S.; Zhang, L.; Deng, Z.; Satoh, K. Experimental research on flame revolution and precession of fire whirls. Proc. Combust. Inst. 2013, 34, 2607–2615. [Google Scholar] [CrossRef]
  3. Matsuyama, K.; Tanaka, F.; Ishikawa, N.; Tanaka, S.; Ohmiya, Y.; Hayashi, Y. Experimental and numerical studies on fire whirls. In Proceedings of the 6th Asia-Oceania Symposium on Fire Science and Technology, AOFST 6, Daegu, Korea, 17–20 March 2004. [Google Scholar]
  4. Zhou, K.; Liu, N.; Lozano, J.S.; Shan, Y.L.; Yao, B.; Satoh, K. Effect of flow circulation on combustion dynamics of fire whirl. Proc. Combust. Inst. 2013, 34, 2617–2624. [Google Scholar] [CrossRef]
  5. Zou, G.W.; Chow, W.K. Generation of an internal fire whirl in an open roof vertical shaft model with a single corner gap. J. Fire Sci. 2015, 33, 183–201. [Google Scholar] [CrossRef]
  6. Zou, G.W.; Yang, L.; Chow, W.K. Numerical Studies on Fire Whirls in a Vertical Shaft. In Proceedings of the Inaugural US-EU-China Thermophysics Conference-Renewable Energy 2009, Beijing, China, 28–30 May 2009; Tao, Y., Ma, C., Eds.; ASME: New York, NY, USA, 2009. [Google Scholar]
  7. Hartl, K.A.; Smits, A.J. Scaling of a small scale burner fire whirl. Combust. Flame 2016, 163, 202–208. [Google Scholar] [CrossRef]
  8. Satoh, K.; Yang, K.T. Simulations Of Swirling Fires Controlled By Channeled Self-generated Entrainment Flows. Fire Saf. Sci. 1997, 5, 201–212. [Google Scholar] [CrossRef] [Green Version]
  9. Emmons, H.W.; Ying, S.-J. The fire whirl. Symp. Int. Combust. 1967, 11, 475–488. [Google Scholar] [CrossRef]
  10. Soma, S.; Saito, K. Reconstruction of fire whirls using scale models. Combust. Flame 1991, 86, 269–284. [Google Scholar] [CrossRef]
  11. Chuah, K.H.; Kushida, G. The prediction of flame heights and flame shapes of small fire whirls. Proc. Combust. Inst. 2007, 31, 2599–2606. [Google Scholar] [CrossRef]
  12. Lei, J.; Liu, N.; Jiao, Y.; Zhang, S. Experimental investigation on flame patterns of buoyant diffusion flame in a large range of imposed circulations. Proc. Combust. Inst. 2017, 36, 3149–3156. [Google Scholar] [CrossRef]
  13. Chow, W.K. A study on relationship between burning rate and flame height of internal fire whirls in a vertical shaft model. J. Fire Sci. 2013, 32, 72–83. [Google Scholar] [CrossRef]
  14. Chow, W.K.; Han, S.S. Experimental Investigation on Onsetting Internal Fire Whirls in a Vertical Shaft. J. Fire Sci. 2009, 27, 529–543. [Google Scholar] [CrossRef]
  15. Chow, W.K.; He, Z.; Gao, Y. Internal Fire Whirls in a Vertical Shaft. J. Fire Sci. 2010, 29, 71–92. [Google Scholar] [CrossRef]
  16. Rodi, W. Comparison of LES and RANS calculations of the flow around bluff bodies. J. Wind Eng. Ind. Aerodyn. 1997, 69–71, 55–75. [Google Scholar] [CrossRef]
  17. Battaglia, F.; Mcgrattan, K.B.; Rehm, R.G.; Baum, H.R. Simulating fire whirls. Combust. Theory Model. 2000, 4, 123–138. [Google Scholar] [CrossRef]
  18. Lei, J.; Liu, N.; Tu, R. Flame height of turbulent fire whirls: A model study by concept of turbulence suppression. Proc. Combust. Inst. 2017, 36, 3131–3138. [Google Scholar] [CrossRef]
  19. Lei, J.; Liu, N.; Zhang, L.; Satoh, K. Temperature, velocity and air entrainment of fire whirl plume: A comprehensive experimental investigation. Combust. Flame 2015, 162, 745–758. [Google Scholar] [CrossRef]
  20. Yuen, A.C.Y.; Yeoh, G.H.; Cheung, S.C.P.; Chan, Q.N.; Chen, T.B.Y.; Yang, W.; Lu, H. Numerical study of the development and angular speed of a small-scale fire whirl. J. Comput. Sci. 2018, 27, 21–34. [Google Scholar] [CrossRef]
  21. Parente, R.M.; Pereira, J.M.C.; Pereira, J.C.F. On the influence of circulation on fire whirl height. Fire Saf. J. 2019, 106, 146–154. [Google Scholar] [CrossRef]
  22. Cheung, A.L.K.; Lee, E.W.M.; Yuen, R.K.K.; Yeoh, G.H.; Cheung, S.C.P. Capturing the Pulsation Frequency of a Buoyant Pool Fire using the Large Eddy Simulation Approach. Numer. Heat Transf. Part A Appl. 2007, 53, 561–576. [Google Scholar] [CrossRef]
  23. Warrantz, U.; Mass, U.; Debbie, R.W. Combustion; Springer: Berlin/Heidelberg, Germany, 1996. [Google Scholar]
  24. Cheung, S.C.P.; Yeoh, G.H.; Cheung, A.L.K.; Yuen, R.K.K.; Lo, S.M. Flickering Behavior of Turbulent Buoyant Fires Using Large-Eddy Simulation. Numer. Heat Transf. Part A Appl. 2007, 52, 679–712. [Google Scholar] [CrossRef]
  25. Sivathanu, Y.R.; Gore, J.P. Coupled radiation and soot kinetics calculations in laminar acetylene/air diffusion flames. Combust. Flame 1994, 97, 161–172. [Google Scholar] [CrossRef]
  26. Zhou, X.; Luo, K.H.; Williams, J.J.R. Numerical studies on vortex structures in the near-field of oscillating diffusion flames. Heat Mass Transf. 2001, 37, 101–110. [Google Scholar] [CrossRef]
  27. Smagorinsky, J. General circulation experiments with the primitive equations. Mon. Weather Rev. 1963, 91, 99–164. [Google Scholar] [CrossRef]
  28. Kang, Y.; Wen, J.X. Large eddy simulation of a small pool fire. Combust. Sci. Technol. 2004, 176, 2193–2223. [Google Scholar] [CrossRef]
  29. Erlebacher, G.; Hussaini, M.Y.; Speziale, C.G.; Zang, T.A. Toward the large-eddy simulation of compressible turbulent flows. J. Fluid Mech. 1992, 238, 155–185. [Google Scholar] [CrossRef] [Green Version]
  30. Xin, Y.; Gore, J.P.; McGrattan, K.B.; Rehm, R.G.; Baum, H.R. Fire dynamics simulation of a turbulent buoyant flame using a mixture-fraction-based combustion model. Combust. Flame 2005, 141, 329–335. [Google Scholar] [CrossRef]
  31. Sivathanu, Y.R.; Faeth, G.M. Generalized state relationships for scalar properties in nonpremixed hydrocarbon/air flames. Combust. Flame 1990, 82, 211–230. [Google Scholar] [CrossRef] [Green Version]
  32. Ibdir, H.; Arastoopour, H. Modeling of multi-type particle flow using kinetic approach. AICHE J. 2005. [Google Scholar] [CrossRef]
  33. Cheung, S.C.P.; Yuen, R.K.K.; Yeoh, G.H.; Cheng, G.W.Y. Contribution of soot particles on global radiative heat transfer in a two-compartment fire. Fire Saf. J. 2004, 39, 412–428. [Google Scholar] [CrossRef]
  34. Moss, J.B.; Stewart, C.D.; Syed, K.J. Flowfield modelling of soot formation at elevated pressure. Proc. Combust. Inst. 1988, 22, 413–423. [Google Scholar] [CrossRef]
  35. Justesen, P. A numerical study of oscillating flow around a circular cylinder. J. Fluid Mech. 1991, 222, 157–196. [Google Scholar] [CrossRef]
  36. Yuen, A.C.Y.; Yeoh, G.H.; Timchenko, V.; Cheung, S.C.P.; Chan, Q.N.; Chen, T.B.Y. On the influences of key modelling constants of large eddy simulations for large-scale compartment fires predictions. Int. J. Comput. Fluid Dyn. 2017, 31, 324–337. [Google Scholar] [CrossRef]
  37. Brookes, S.J.; Moss, J.B. Predictions of soot and thermal radiation properties in confined turbulent jet diffusion flames. Combust. Flame 1999, 116, 486–503. [Google Scholar] [CrossRef]
  38. Lindstedt, R.P.; Louloudi, S.A. Joint-scalar transported PDF modeling of soot formation and oxidation. Proc. Combust. Inst. 2005, 30, 775–783. [Google Scholar] [CrossRef]
  39. Fenimore, C.P.; Jones, G.W. Oxidation of soot by hydroxyl radicals. J. Phys. Chem. 1967, 71, 593–597. [Google Scholar] [CrossRef]
  40. Jamaluddin, A.S.; Smith, P.J. Predicting Radiative Transfer in Rectangular Enclosures Using the Discrete Ordinates Method. Combust. Sci. Technol. 1988, 59, 321–340. [Google Scholar] [CrossRef]
  41. Kent, J.H.; Honnery, D.R. A soot formation rate map for a laminar ethylene diffusion flame. Combust. Flame 1990, 79, 287–298. [Google Scholar] [CrossRef]
  42. Aboelkassem, Y.; Vatistas, G.H.; Esmail, N. Viscous dissipation of Rankine vortex profile in zero meridional flow. Acta Mech. Sin. 2005, 21, 550–556. [Google Scholar] [CrossRef]
  43. Ansys, R. Academic Research Mechanical, Release 17.2, Help System; ANSYS, Inc.: Canonsburg, PA, USA, 2016. [Google Scholar]
  44. Werner., H.; Wengle, H. Large-eddy simulation of turbulent flow over and around a cube in plate channel. In Proceedings of the 8th Symposium on Turbulent Shear Fow, Munich, Germany, 9–11 September 1991; Volume 19, pp. 155–158. [Google Scholar]
  45. Wen, J.X.; Huang, L.Y.; Roberts, J. The effect of microscopic and global radiative heat exchange on the field predictions of compartment fires. Fire Saf. J. 2001, 36, 205–223. [Google Scholar] [CrossRef]
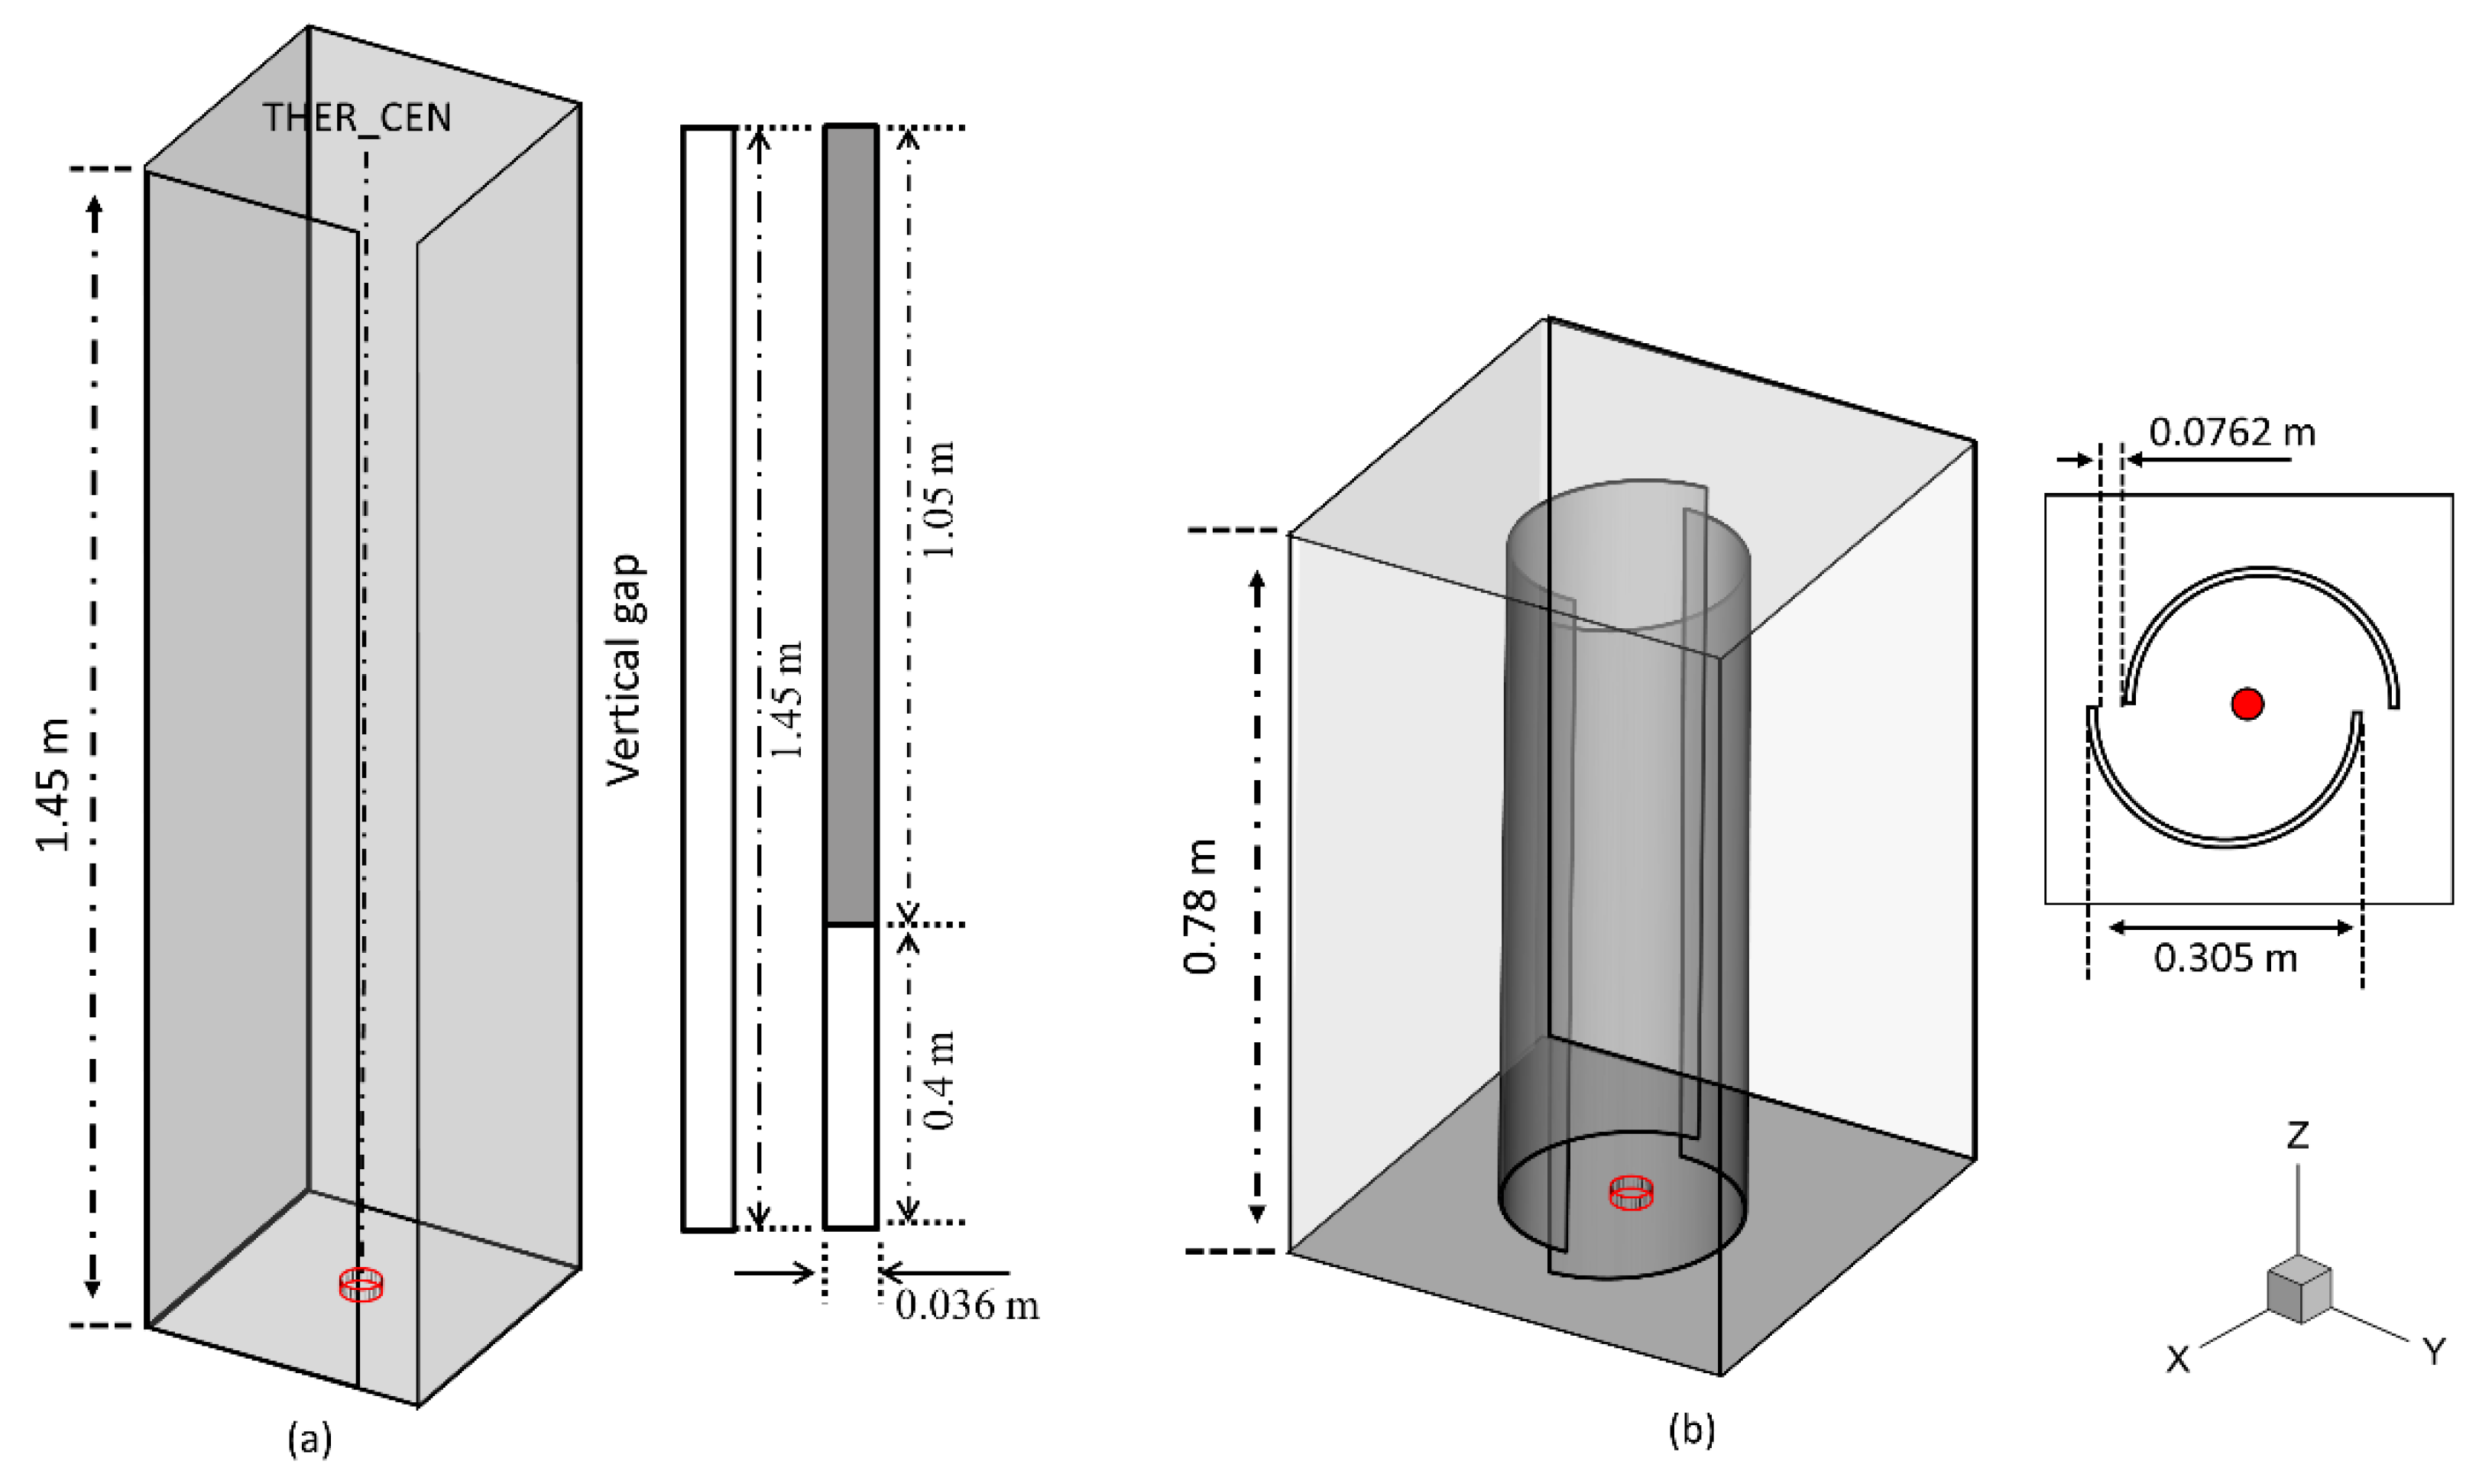
Figure 1. Schematic sketch of three-dimensional view of the (a) half-cylinder model and (b) fully opened and partially opened vertical shaft model.
Applsci 10 03428 g001
Figure 2. Mesh resolution for the vertical shaft model including (a) a cross-sectional view and (b) an isometric three-dimensional view.
Applsci 10 03428 g002
Figure 3. Mesh configuration for the pressure gas burner cylinder model including (a) a cross-sectional view and (b) an isometric three-dimensional view.
Applsci 10 03428 g003
Figure 4. Centreline temperature comparisons between the numerical model and experiment for the fully opened vertical shaft model.
Applsci 10 03428 g004
Figure 5. Comparison of the predicted centreline temperatures for the three fire whirls against the empirical correlation proposed by Lei et al. [19].
Applsci 10 03428 g005
Figure 6. Comparison of the predicted axial, tangential, and radial time-averaged velocities against the experimental measurements by Hartl and Smits [7].
Applsci 10 03428 g006
Figure 7. Radial profiles of tangential velocity versus the normalized height for Case 1 (the fully opened vertical shaft model).
Applsci 10 03428 g007
Figure 8. Radial profiles of tangential velocity versus the normalized height for Case 3 (the half-cylinder model).
Applsci 10 03428 g008
Figure 9. Flame height and flame structures versus time for Case 1 (the fully opened vertical shaft model).
Applsci 10 03428 g009
Figure 10. Flame height and flame structures versus time for Case 3 (the half-cylinder model).
Applsci 10 03428 g010
Figure 11. Velocity vector plots cutting at vertical plane (z = 0.05) at different fire whirl stages (ac): the flame rising stage; (df): the conical fire whirl; (gi): the cylindrical fire whirl) for the fully opened vertical shaft model.
Applsci 10 03428 g011aApplsci 10 03428 g011b
Figure 12. Velocity vector plots cutting at the vertical plane (z = 0.05) at different fire whirl stages (ac): the flame rising stage; (df): the conical fire whirl for the two half-cylinder models.
Applsci 10 03428 g012
Figure 13. The vortex core region (i.e., the second invariant of the velocity gradient tensor of 197) for Case 1 (fully opened) and Case 2 (partially opened) vertical shaft model.
Applsci 10 03428 g013
Figure 14. Normalized mass flow rate versus the normalized height throughout the fire whirl plumes.
Applsci 10 03428 g014
Figure 15. Radial profile of excess temperature in the continuous flame.
Applsci 10 03428 g015
Figure 16. Radial profile of excess temperature in the intermittent flame.
Applsci 10 03428 g016
Figure 17. Time-averaged tangential velocities at different heights (i.e., 0.05 m, 0.1 m, 0.3 m, 0.4 m, 0.5 m, and 0.6 m) for the fully and partially opened vertical shaft model.
Applsci 10 03428 g017aApplsci 10 03428 g017b
Table 1. Case summary.
Case No.Fuel TypeVertical GapVertical Gap Height, mVertical Gap Width, m
1PropaneVertical shaft
Fully opened
1.450.036W.K Chow; S.S. Han [10]
2PropaneVertical shaft
Partially opened
0.40.036W.K Chow; S.S. Han [10]
3Dimethyl etherTwo half-cylinders0.890.0762K.A. Hartl; A.J. Smits [14]
Table 2. Species summary.
ReactantsIntermediate SpeciesProduct
Cases 1 and 2 C 3 H 8 , O 2 , N 2 C 2 H 2 O , HOCO , HCOOH , HONO , CHO , HCO , C 2 H 6 , H 2 O 2 , O , H , OH , CO , H 2 , HO 2 , C ( s ) CO 2 , H 2 O , N 2
Case 3 CH 3 OCH 3 , O 2 , N 2 O 3 , HOC , HCO , CHO , OH , O , HONO , HO 2 , H 2 O 2 , H 2 , H , C O CO 2 , H 2 O , N 2