1. Introduction
In recent years, object detection in remote sensing images has been frequently used in a wide range of areas such as land planning, city monitoring, traffic monitoring, and agricultural applications. Object detection is essential in the field of aerial and satellite image analysis but it is also difficult. The problem is that the objects in the images are of various dimensions and sizes. In addition, these high-resolution images from planes or satellites have complex and scattered backgrounds of excessively detailed ground objects. Object detection methods using deep learning techniques have received increasing attention in recent years and as a result of this, they have achieved state-of-the-art performance [
1]. Among these object detection methods, the faster region-based convolutional neural network (faster R-CNN) [
2] is quite successful. This method consists of two steps. In the first step, a region proposal network (RPN) generates several hundred or thousands of candidate region proposals. In the second step, the object/non-object classification is done by feature extraction of region proposals.
In the faster R-CNN method, feature extraction is performed by using a convolutional neural network (CNN) [
3]. As the CNN has a fixed input sampling frame, it fails to detect objects with high complexity and clutter in remote sensing images. At this point, the deformable convolutional concept [
4] is introduced. It makes convolution operation on different areas of each input sample depending on the offsets, regardless of the fixed geometric shape of the standard convolution process.
It is very important to use high-resolution features to detect small objects in remote sensing images. However, these features are in the shallow CNN layers. Feature pyramid network (FPN) [
5] has been introduced to extract these features. Batch normalization (BN) [
6] is often used in the training phase of remote sensing images. BN achieves successful results in training with large batch sizes. However, large batches require the same amount of multiple GPU power (such as systems with 8 or 16 GPUs). Weight standardization (WS) [
7] has been introduced for successful training with small batch numbers in single GPU systems. The publicly available 10-class geospatial object detection (NWPU-VHR 10) [
8] dataset was used for testing the model we proposed. The studies using this data set are summarized below:
Cheng at al. [
9] developed a practical and rotation-invariant framework for multi-class geospatial object detection and geographic image classification based on the collection of part detectors (COPD). The COPD is composed of a set of representative and discriminative part detectors, where each part detector is a linear support vector machine (SVM) [
10] classifier used for the detection of objects.
Peicheng et al. [
11] proposed a novel and effective approach to learning a rotation-invariant CNN (RICNN) model for advancing the performance of object detection, which is achieved by introducing and learning a new rotation-invariant layer on the basis of the existing CNN architectures.
Li et al. [
12] proposed a novel deep-learning-based object detection framework including region proposal network and local-contextual feature fusion network designed for remote sensing images. They called the proposed model the rotation insensitive and context enhanced object detection (RI-CAO) network. They developed a double-channel feature fusion network that can learn local and contextual properties along two independent pathways.
Wang et al. [
13] proposed an anchor-free and sliding-window-free deconvolutional region proposal network (DODN) and constructed a two-stage deconvolutional object detection network. Instead of using an anchor mechanism, they used a deconvolutional neural network followed by a connected region generation module to generate reference boxes.
In this study, a multi-scale Faster R-CNN method based on deformable convolution is proposed for single/low GPU systems. Our contributions are as follows:
Faster R-CNN feature extractor backbone, which uses the standard convolution grid structure for object detection, has been updated to use deformable convolution and a new backbone has been proposed.
FPN has been added to the faster R-CNN structure to use the features in the higher layers as well as in the shallow layers for the detection of small objects in remote sensing images.
In order to increase the success of the training in single GPU systems, WS structure is used instead of BN and very successful results are obtained.
Our study is the first to propose a model by combining deformable convolution, feature pyramid network, and weight standardization techniques with faster R-CNN.
In the second section of this study, deformable convolution network, weight standardization and feature pyramid network structures are explained. The third section describes the structure of the improved faster R-CNN model, which we have introduced using the structures mentioned in the second section. The fourth section discusses the dataset, which is used to observe the contribution of the proposed model and the results of experiments and comparison of our method with the others in terms of success. The fifth section presents the conclusions, and finally, the sixth section discusses future work.
2. Related Works
2.1. Faster R-CNN
The faster R-CNN method consists of two networks. These are the RPN and the object detecting network (ODN) (
Figure 1). The RPN scales the regions, which are called anchors, according to their rate of object availability (usually 70%) and sends the regions that exceed a certain rate to the object detection network. Anchors play an important role in the faster R-CNN algorithm. The anchor is actually a specific box of dimensions. The Faster R-CNN has nine anchors of different sizes. In the regional proposal network phase, these anchors are hovered over the image to identify areas that may contain objects.
The outputs of the regional proposal network are not fixed due to the different dimensions of the anchors. The input of the object detection network is fixed. Region of interest (ROI) pooling is used to resolve the mismatch between two networks. With the help of ROI, the size of the regions is equalized. Two operations are performed in the object detection network. The first is the classification of background and foreground objects within the region. The foreground object that emerged by classification is represented by multiple boxes due to the different anchor dimensions. At this point, the box with the highest rate is selected by the maximum suppression method and the object is thus detected.
2.2. Deformable Convolutional Network
The regular convolutional unit samples the input property map at fixed locations and generates the output by calculating the weighted sum of the samples. Recently, deformable convolution has been proposed to overcome the limitations of standard convolution (
Figure 2).
Regular convolution is operated on a regular grid R. Deformable convolution is operated on R but with each point augmented by a learnable offset . Convolution is used to generate 2N number of feature maps corresponding to N 2D offsets (x-direction and y-direction for each offset).
Regular convolution calculated as follows:
Deformable convolution calculated as follows:
is used to sort the R positions,
and
denote the weight and pre-specified offset for output location, respectively. In Equation (1), the output property map is computed for each location of position
in
. In addition to Equation (1), in Equation (2), offset
is taken into account.
As shown in
Figure 3, deformable convolution selects values from different locations for standard convolution in the input image or property maps. As a result of this, the deformable convolution which is fixed to larger objects selects more receptive areas and exposes more features related to objects. This makes it easy to detect small objects in remote sensing images.
2.3. Feature Pyramid Network
Feature pyramid network combines low-resolution semantically powerful features, with high-resolution semantically weak features using a top-down path and lateral connections. Feature pyramid network which is built on a single input image scale and which has rich semantic features at all levels can be quickly detected without sacrificing speed or memory. The structure of the feature pyramid network is shown in
Figure 4.
2.4. Weight Standardization
The idea of weight standardization is very simple. Traditional techniques such as cluster, layer, sample, and group normalization basically perform normalization in feature activation, while WS performs normalization in weight (convolution filter) (
Figure 5).
In weight standardization, instead of directly optimizing the loss L on the original weights
Ŵ, we reparameterize the weights
Ŵ as a function of W, i.e.,
Ŵ = WS(
W), and optimize the loss
L on
W by stochastic gradient descent (SGD):
where
In Equation (3), is used to prevent partition operation from infinity but it is a very small value (nearly 0). In addition, in Equation (5), denotes the weighted sum of input channels within the kernel region of each output channel and denotes the square root of the difference between reparameterize the weights and . In Equation (4), the output property map of a standard convolution layer with the bias term set to 0 is calculated. in Equation (4) is re-parameterized to obtain WS in Equation (5).
3. Proposed Improved Faster R-CNN Method for Remote Sensing Object Detection
The model we recommend is based on the latest faster R-CNN, a state-of-the-art object detection system. We attempted to solve the weakness of the regular convolution structure used in the faster R-CNN model for detecting small and mixed objects in remote sensing using the deformable convolution technique. With the FPN technique, the high-resolution features in the shallow layers of the remote sensing images are transferred to the network. WS technique, which reduces batch size in order to provide deep learning training without performance problems in low power/single GPU systems such as single GPU, was added to our model. In our opinion, this is the first study in which these techniques are used in conjunction with the faster R-CNN algorithm and provides an effective remote sensing object detection model for a system with low/single GPU power.
In the proposed method, ResNet50 [
14] with deformable convolution is used to extract high-resolution features. The object is detected using the multi-scale features via the FPN module. The output_stride, which is the ratio of the input resolution to the output resolution, is set to 32 to produce a more intense attribute map. The network structure of our proposed method is shown in
Figure 6.
In the proposed model, features are extracted by the ResNet50 backbone, which is a deformable convolution network. While the standard ResNet50 backbone consists of a convolution neural network, the proposed model uses a deformable convolution network. This allows the backbone to extract features from more receptive areas.
In the model, using FPN structure, features obtained from P2, P3, P4, P5 layers are given to the faster R-CNN model and object detection is performed. In order to provide more effective training on low GPU systems, the WS structure completes the training with one image per GPU. When this value is considered 32 BN, sometimes 64 images/GPU, the effectiveness of WS appears.
4. Experiments and Results
4.1. Experiments Environment and Evaluation Criteria
Experiments were performed using the MMDetection toolkit [
15] on a desktop PC with Intel
® Core ™ i5 2.4 GHz CPU, 6 GB RAM (Intel®, Santa Clara, CA, USA), single Geforce GTX 1080 graphics card (NVIDIA, Santa Clara, CA, USA) and Ubuntu 16.04 LTS operating system (Canonical, London, United Kingdom) . Program codes were written in Python [
16] using the PyTorch deep learning library [
17].
We used the precision-recall curve (PRC) and average precision (AP) criteria to evaluate the performance of our proposed model. These two criteria have been standardized in the field of study and have been used in many object detection studies [
18,
19,
20,
21].
(1) Precision-Recall Curve (PRC):
Precision determines the accuracy of true positive detections and
Recall determines the proportion of true positives identified as true.
TP, FP, and
FN are used to indicate the number of true positives, the number of false positives, and false negatives, respectively. So, the PRC value is calculated as follows:
If the area overlap ratio between the predicted limit box and the ground reality limit box exceeds 0.5, the detection is considered true positive. Otherwise, the detection is considered false positive. In addition, if more than one detection coincides with the same basic accuracy limiting box, only one is considered true positive, others are considered false positive.
(2) Mean Average Precision (mAP): Recall = 0 to Recall = 1 that is, calculating the average value of Precision over the range in the area under PRC, therefore, the higher the mAP value, the better the performance.
4.2. Data Set Preparation
The NWPU-VHR10 dataset was used for testing the proposed network model. There are 10 classes in this dataset (aircraft, ship, storage tank, baseball diamond, tennis court, basketball court, ground track field, harbor, bridge, and vehicle). The dataset consists of 800 images with spatial resolution ranging from 0.5 to 2 m (650 positive image sets, 150 negative image sets). Since the number of training objects in this dataset is small, the success of the proposed model will be low. In order to prevent this, the data enhancement technique was used. In the phase of data increase blurring, rotating vertically, rotating horizontally, gamma conversion, and random image brightness operations are applied to the images in the dataset.
Figure 7 illustrates sample data augmentation.
4.3. Experiments with Different Training–Test Dataset Rates
In order to evaluate the performance of the proposed model, we conducted experiments with different training-test dataset ratios. 10 sets of experiments were performed for each ratio with randomly selected image sets according to the selected training/test ratios. By calculating the arithmetic mean of the 10 different
mAP results, the final
mAP value was obtained.
Table 1 shows the arithmetic mean results of the experiments by adjusting the dataset according to these ratios.
When the results in
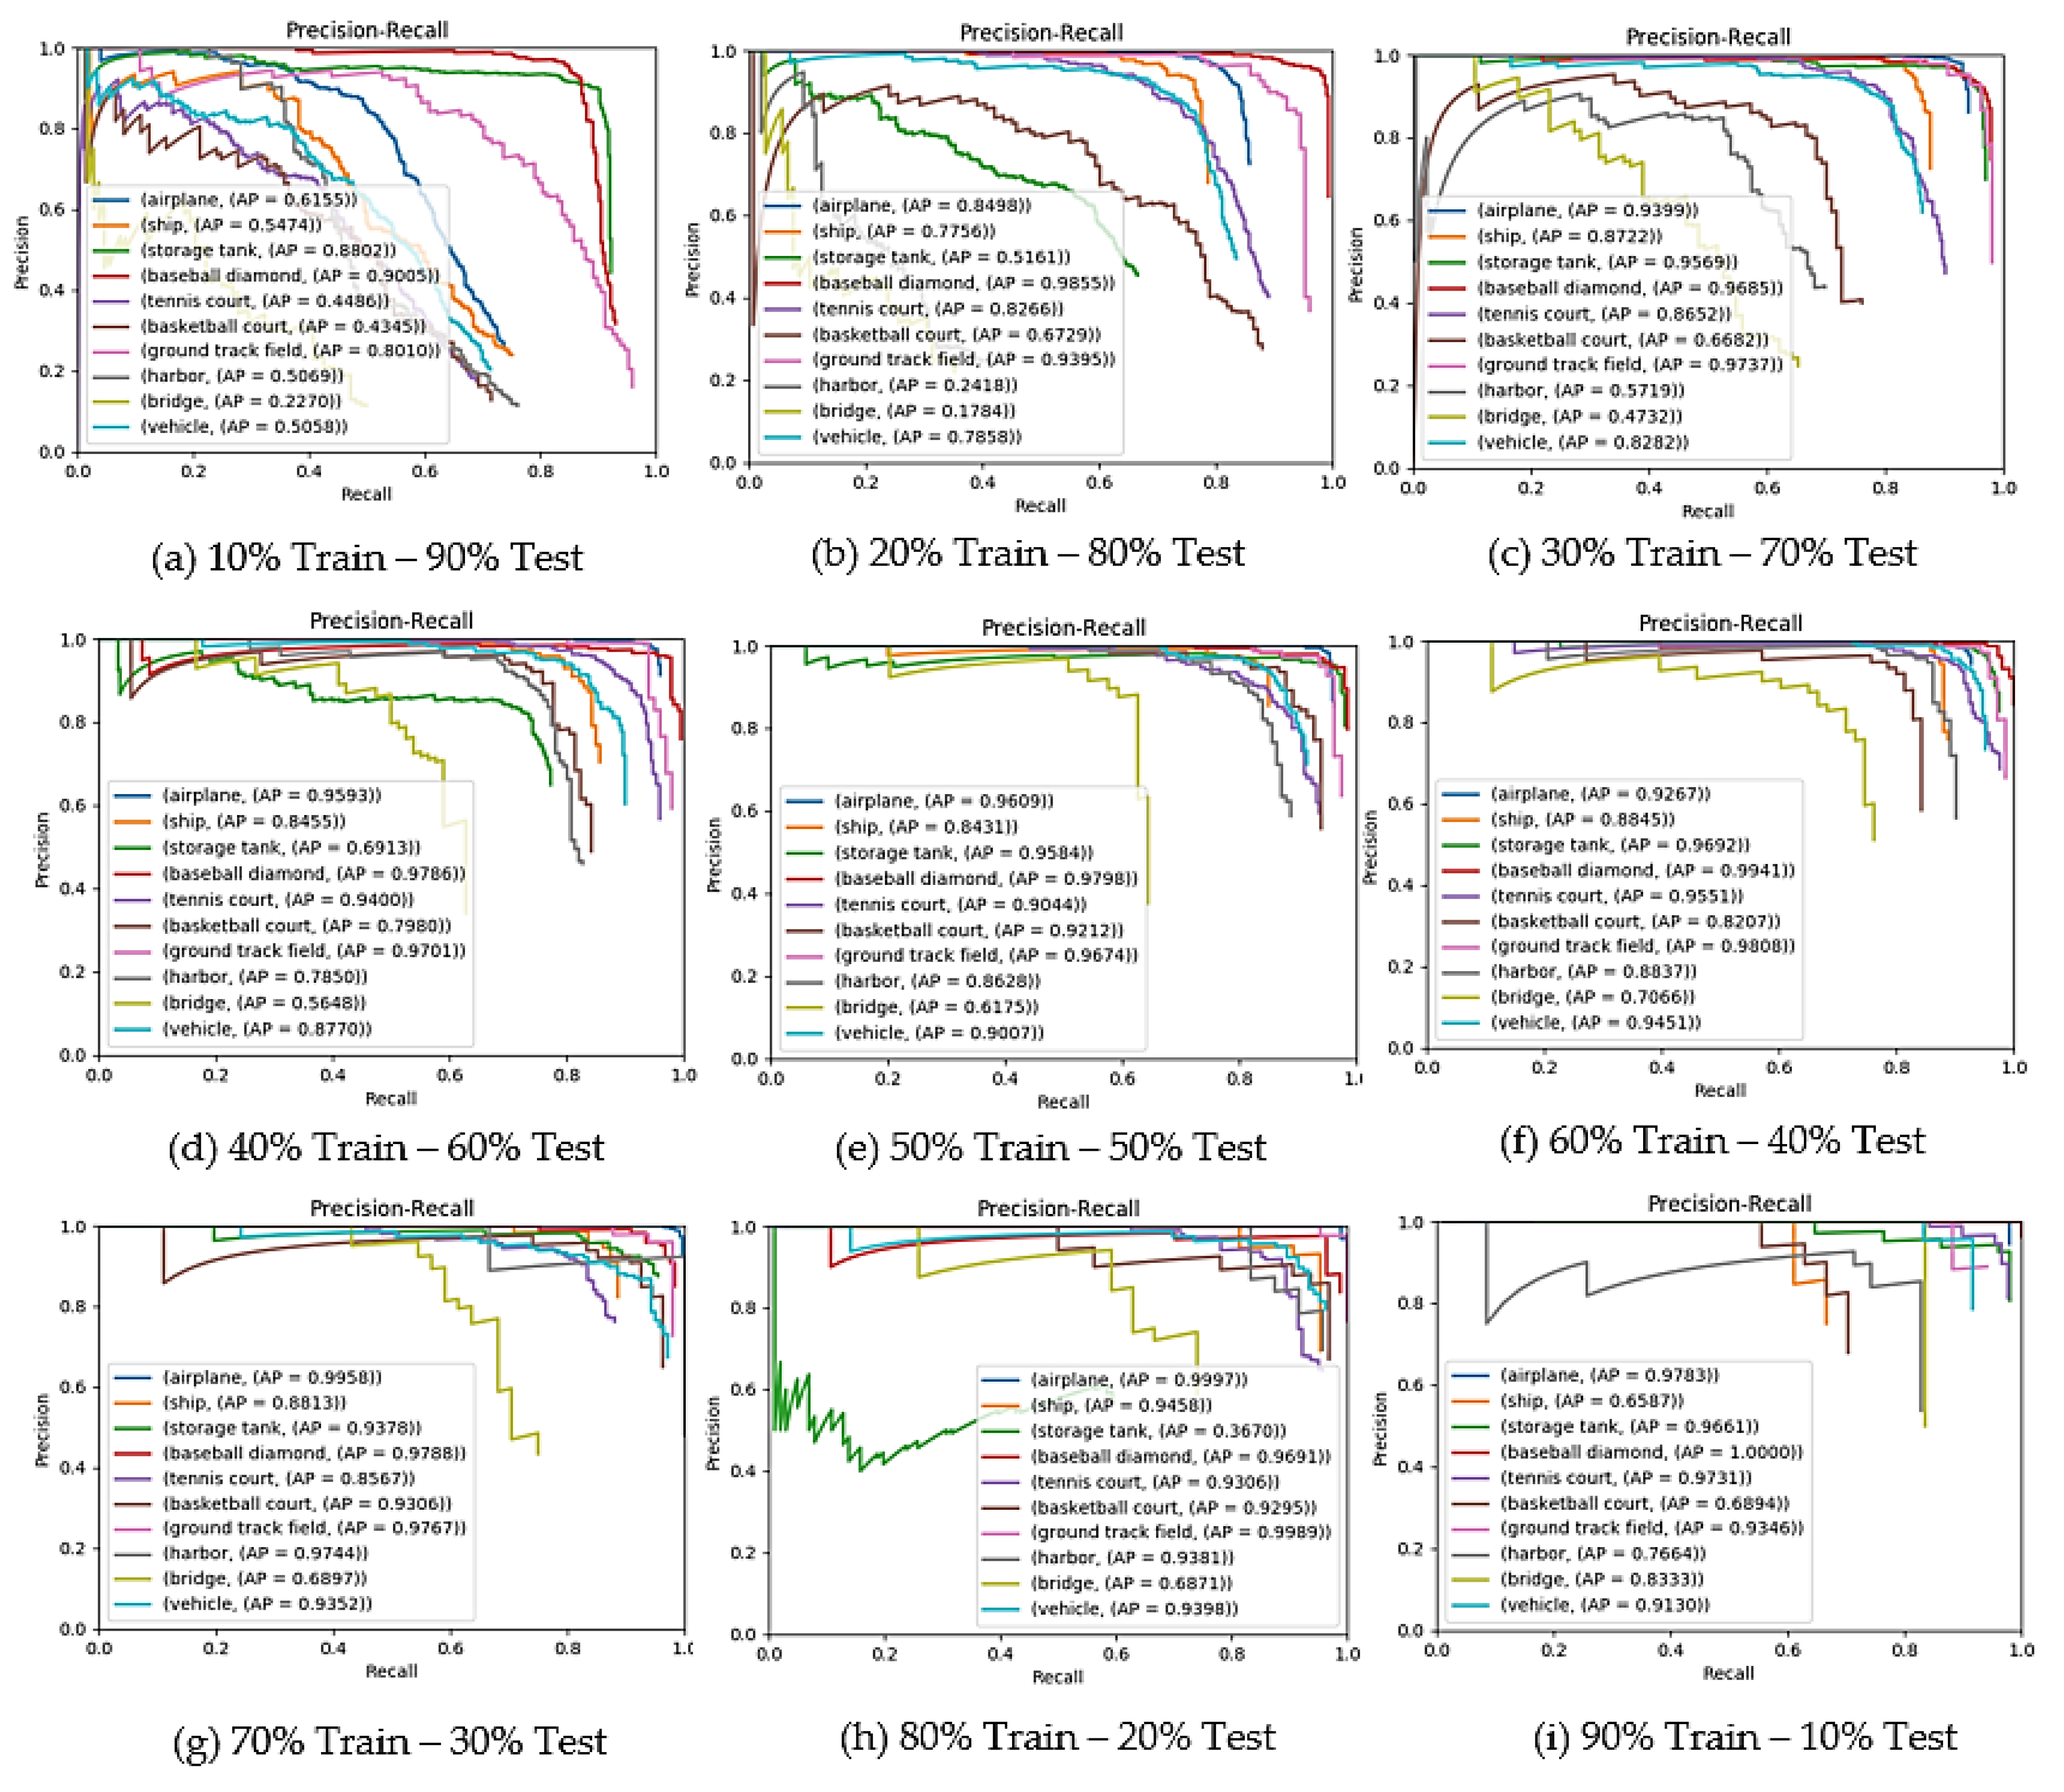
Table 1 were examined we observed that with the further reduction of the number of images in the train dataset, the performance was significantly reduced (success is reduced almost 40%). However, it can be seen from the results that the model we proposed shows very successful performance with little data (0.812
mAP rate with 30% training data). The most successful rate is 70%–30%, which is widely adopted and used frequently in the literature. Increased training data is expected to increase success, while overfitting and lack of test data reduce success (e.g., 90–10 and 80–20 rates). The PR Curves obtained arithmetic mean results of the experiments performed according to the ratios in
Table 1 are shown in
Figure 8.
When the PR curves are examined, it is seen that the lack of data directly affects the performance. This effect becomes more pronounced in the F-measurement results. The proposed faster R-CNN model is stable, despite significant changes in dataset rates. This can be attributed to the fact that the deformable convolution structure extracts attributes from more domains and the FPN gives the attribute from different levels to the detection network.
4.4. Proposed Improved Faster R-CNN Compared with Other Studies
In order to evaluate the performance of our proposed model on the VHR10 dataset objectively, we compared it with other models using the same dataset in the field. Comparison results are shown in
Table 2. Values marked in bold are the highest AP values obtained in the class.
When
Table 2 is examined, it is obvious that the method we propose gives better results compared to other studies. We achieved a 1.7%
mAP increase over DODN, which shows by far the best performance in other studies. This is because firstly, DCN has feature extraction from more receptive areas compared to CNN, and secondly, FPN’s features obtained from different layers are given to the detection network. In addition, the use of WS instead of BN resulted in successful training with the Nvidia GTX 1080 GPU, which is a very weak GPU when compared to very powerful GPUs such as Nvidia TITAN X or Nvidia TITAN XP.
Although our method provides the best performance, detection accuracy for the bridge object category is still low. The reason for this is the imbalance between classes in the dataset we used in the study. This affected the results. While the object detection success of the classes with a higher number of training samples (e.g., plane) increased, the success rate of the classes with fewer training samples (e.g., bridge) decreased. Data augmentation did not change this result. This problem can be solved using the focal loss, loss function [
22] which is proposed to eliminate imbalance between classes. In future studies, the model we propose aims to eliminate the imbalance between classes by using focal loss.
Using our improved faster R-CNN model and class-specific object category classifiers, we performed ten classes of object detection in our test data set.
Figure 9 shows a series of object detection results of the proposed model in which true positives, false positives, and false negatives are represented respectively by green, red, and blue rectangles. Despite the major changes in the orientation and size of the objects, the proposed model successfully identified and localized most of the objects.
5. Conclusions
In this study, the faster R-CNN model is considered because it has obtained very successful results in object detection. Since the regular convolution used in the faster R-CNN structure has a low success in domains containing very small and mixed objects such as remote sensing, we propose a faster R-CNN object detection model reinforced with deformable convolution. Also, FPN used in the proposed model combines low resolution, semantically strong features with high resolution, semantically weak features, and successfully identifies objects of different sizes and shapes (such as bridges and cars). In order to test the robustness of the proposed model, nine different training-test ratios were used. As a result of these tests, our model has achieved very successful results with little training data. WS is used instead of BN in order to make the proposed model more efficient for a small batch size (1 img/GPU) in single GPU systems. This allows home users to train with mid-low GPUs without the need for expensive servers with multiple GPUs.
The VHR10 dataset was used to evaluate the object detection performance of the model we proposed. Experimental results show that our model achieves better results than current models using the same dataset (1.7% mAP increase over the best model).
6. Future Work
Due to the imbalance between the classes in the dataset we used, the detection rate of the bridge class was lower than the other classes. Data augmentation did not change this result. In the next study, we aim to use the focal loss function [
23] which eliminates the problem created by datasets that have an imbalance between classes. In addition to this, how to optimize the network structure to balance the conflict between performance and efficiency is a key issue to consider in our future work.
Author Contributions
Conceptualization, A.K. and N.B.; methodology, A.K. and N.B.; software, A.K.; validation, A.K. and N.B.; formal analysis, A.K and N.B.; investigation, A.K. and N.B.; resources, A.K. and N.B.; data curation, A.K. and N.B. writing-original draft preparation, A.K. and N.B.; writing-review and editing, A.K. and N.B.; visualization, A.K.; supervision, N.B.; project administration, N.B. All authors have read and agreed to the published version of the manuscript.
Funding
There is no extra funding.
Conflicts of Interest
The authors declare no conflicts of interest.
References
- Jiao, L.; Zhang, F.; Liu, F.; Yang, S.; Li, L.; Feng, Z.; Qu, R. A Survey of Deep Learning-Based Object Detection. IEEE Access 2019, 7, 128837–128868. [Google Scholar] [CrossRef]
- Ren, S.; He, K.; Girshick, R.; Sun, J. Faster R-CNN: Towards Real-Time Object Detection with Region Proposal Networks; Neural Information Processing Systems Foundation, Inc.: La Jolla, CA, USA, 2015; pp. 91–99. [Google Scholar]
- Bengio, Y.; Goodfellow, I.; Courville, A. Deep Learning; MIT Press: Cambridge, MA, USA, 2016; pp. 326–366. [Google Scholar]
- Dai, J.; Qi, H.; Xiong, Y.; Li, Y.; Zhang, G.; Hu, H.; Wei, Y. Deformable convolutional networks. In Proceedings of the IEEE International Conference on Computer Vision, Venice, Italy, 22–29 October 2017. [Google Scholar]
- Tsung-Yi, L.; Dollar, P.; He, K.; Hariharan, B.; Belongie, S. Feature Pyramid Networks. In Proceedings of the IEEE Conference on Computer Vision and Pattern Recognition (CVPR), Honolulu, HI, USA, 21–26 July 2017. [Google Scholar]
- Ioffe, S.; Szegedy, C. Batch Normalization: Accelerating Deep Network Training by Reducing Internal Covariate Shift. arXiv 2015, arXiv:1502.03167. [Google Scholar]
- Qiao, S.; Wang, H.; Liu, C.; Shen, W.; Yuille, A. Weight Standardization. arXiv 2019, arXiv:1903.10520. [Google Scholar]
- NWPU-VHR10 DataSet. Available online: http://www.escience.cn/people/gongcheng/NWPU-VHR-10.html (accessed on 15 July 2019).
- Cheng, G.; Han, J.; Zhou, P.; Guo, L. Multi-class geospatial object detection and geographic image classification based on collection of part detectors. ISPRS J. Photogramm. Remote Sens. 2014, 98, 119–132. [Google Scholar] [CrossRef]
- Evgeniou, T.; Pontil, M. Support Vector Machines: Theory and Applications. In Advanced Course on Artificial Intelligence (ACAI); Springer: Berlin/Heidelberg, Germany, 1999. [Google Scholar]
- Peicheng, Z.; Cheng, G.; Junwei, H. Learning Rotation-Invariant Convolutional Neural Networks for Object Detection in VHR Optical Remote Sensing Images. IEEE Trans. Geosci. Remote Sens. 2016, 54, 7405–7416. [Google Scholar]
- Li, K.; Cheng, G.; Bu, S.; You, X. Rotation-Insensitive and Context-Augmented Object Detection in Remote Sensing Images. IEEE Trans. Geosci. Remote Sens. 2018, 56, 2337–2349. [Google Scholar] [CrossRef]
- Wang, C.; Shi, J.; Yang, X.; Zhou, Y.; Wei, S.; Li, L.; Zhang, X. Geospatial Object Detection via Deconvolutional Region Proposal Network. IEEE J. Sel. Top. Appl. Obs. Remote Sens. 2019, 12, 1–14. [Google Scholar] [CrossRef]
- He, K.; Zhang, X.; Ren, S.; Sun, J. Deep Residual Learning for Image Recognition. In Proceedings of the IEEE Conference on Computer Vision and Pattern Recognition (CVPR), Las Vegas, NV, USA, 27–30 June 2016. [Google Scholar]
- Mmdetection Toolkit. Available online: https://github.com/open-mmlab/mmdetection (accessed on 24 May 2019).
- Van Rossum, G. Python; Corporation for National Research Initiatives (CNRI): Reston, VA, USA, 1995. [Google Scholar]
- Available online: https://www.python.org/ (accessed on 20 June 2018).
- PyTorch Library. Available online: https://pytorch.org/ (accessed on 12 December 2018).
- Cheng, G.; Han, J.; Guo, L.; Qian, X.; Zhou, P.; Yao, X.; Hu, X. Object detection in remote sensing imagery using a discriminatively trained mixture model. ISPRS J. Photogram. Remote Sens. 2013, 85, 32–43. [Google Scholar] [CrossRef]
- Zhang, D.; Han, J.; Cheng, G.; Liu, Z.; Bu, S.; Guo, L. Weakly supervised learning for target detection in remote sensing images. IEEE Geosci. Remote Sens. Lett. 2015, 12, 701–705. [Google Scholar] [CrossRef]
- Han, J.; Zhang, G.; Cheng, G.; Guo, L.; Ren, J. Object detection in optical remote sensing images based on weakly supervised learning and high-level feature learning. IEEE Trans. Geosci. Remote Sens. 2015, 53, 3325–3337. [Google Scholar] [CrossRef]
- Eikvil, L.; Aurdal, L.; Koren, H. Classification-based vehicle detection in high-resolution satellite images. ISPRS J. Photogram. Remote Sens. 2009, 64, 65–72. [Google Scholar] [CrossRef]
- Lin, T.; Goyal, P.; Girshick, R.; He, K.; Dollar, P. Focal loss for object detection. In Proceedings of the IEEE International Conference on Computer Vision, Venice, Italy, 22–29 October 2017. [Google Scholar]
© 2019 by the authors. Licensee MDPI, Basel, Switzerland. This article is an open access article distributed under the terms and conditions of the Creative Commons Attribution (CC BY) license (http://creativecommons.org/licenses/by/4.0/).


