Article

Nanofiltration of Simulated Acid Mine Drainage: Effect of pH and Membrane Charge

by
Ye Wee Siew
1,
Karina Listiarini Zedda
2 and
Svetlozar Velizarov
1,*
1
LAQV-Requimte, DQ, FCT, Universidade NOVA de Lisboa, 2829-516 Caparica, Portugal
2
R&D Membranes, BU Liquid Purification Technologies, LANXESS-IAB Ionenaustauscher GmbH, D-06731 Bitterfeld-Wolfen, Germany
*
Author to whom correspondence should be addressed.
Appl. Sci. 2020, 10(1), 400; https://doi.org/10.3390/app10010400
Submission received: 30 November 2019 / Revised: 28 December 2019 / Accepted: 3 January 2020 / Published: 5 January 2020
(This article belongs to the Section Environmental Sciences)

Abstract

:
Acid mine drainage (AMD) is a severe form of environmental pollution that has the potential to contaminate surface and ground waters by introducing heavy metals and lowering the pH. The feasibility of using nanofiltration (NF) as a potentially attractive and cost-effective remediation method to treat acid mine drainage was investigated in this study. The performance of an acid-stable NF membrane focusing on the effects of the water pH and membrane charge on ion rejection was systematically studied. A single salt solution experiment showed that Mg, Cu, and Mn containing species were highly rejected at above 97%. Below the membrane iso-electric point (IEP), Mn showed an increased rejection of 99%, while Mg and Mn rejections were relatively constant within the investigated pH range of pH 2 to 7. Rejection of monovalent Cl decreased with increasing concentration of an accompanying divalent SO42−, showing that Donnan related effects are more prominent at higher ionic concentrations. The sulfate rejection decreased drastically below pH 3 due to the formation of HSO4, which permeated through the membrane, which can be utilized as a way of separation of the metals from the accompanying sulfur-containing compounds. For mixed salt solutions, rejection of silicate dropped from 52% to 38% when magnesium sulfate was added, owing to shielding of the membrane surface charge by Mg2+ ions. The NF process performance with a simulated AMD solution was found to be similar to that with model salt solution experiments, both in terms of ion rejection values and general pH-dependent rejection trends. The results obtained can be used as a fast preliminary tool for evaluating the feasibility of using NF for treating AMD with a given ionic composition and pH.

1. Introduction

Acid mine drainage (AMD) is an acidic, sulfur-rich, metallic wastewater, originating from mine discharge of both operational and abandoned mines [1]. During mining operations, sulfide minerals such as pyrite (FeS2), mackinawite (FeNiS), and chalcocite (Cu2S) are being exposed. These exposed minerals are oxidized by the combined effect of water and oxygen resulting in the release of metal and sulfates. For example, AMD can be formed from pyrite through a series of oxidative reactions (Equations (1)–(4)) where ferric iron acts as the primary oxidant [2,3]:
2FeS2 (s) + 7O2 (g) + 2H2O (l) → 2Fe2+ (aq) + 4SO42− (aq) + 4H+ (aq),
4Fe2+ (aq) + O2 (g) + 4H+ (aq) → 4Fe3+ (aq) + 2H2O (l),
Fe3+ (aq) + 3H2O (l) → Fe(OH)3 (s) +2H+ (aq),
FeS2 (s) + 14Fe3+ (aq) + 8H2O (l) → 15Fe2+ (aq) + 2SO42− (aq) + 16H+ (aq).
Typically, AMD is characterized by high acidity (pH 2 to 4), high sulfate concentration (1000 to 20,000 mg/L) and elevated concentration of metal mixtures which may include iron, manganese, copper, calcium, lead, magnesium, sodium, and nickel [4,5]. When left untreated, AMD can contaminate soils and water sources (ground and surface) by introducing heavy metals and lowering pH, thus pollution by AMD endangers the well-being of humans, animals, plants, and the ecology as a whole. AMD composition can vary in pH and ionic composition, depending on the mine location and mineral rock types. As a result of these diverse conditions, the choice of treatment is dictated by both economic and environmental factors.
For the selection of AMD treatment, Johnson and Hallberg [3] suggested three guidelines. Firstly, decision-makers have to be wary of the hidden economic and environmental costs associated with each treatment. For example, the cost of fossil fuels for transportation of materials and the price of waste disposal are usually overlooked. Secondly, it is important to ensure the sustainability of the chosen remediation method. Ideally, the end products of mine water treatment should be viewed as a potential resource rather than waste and valorized, accordingly. Sales of recovered and recycled resources could be used to fund the cost of treatment. Lastly, legislation and regulation from the relevant environmental authorities is the overriding factor that determines the choice of the treatment system. The disposal and wastewater discharge criteria usually demand near complete removal of sulfate, metals, and acidity from the AMD.
So far, lime neutralization and biological treatment have been used as conventional treatment approaches to AMD. However, alternative methods such as ion exchange and membrane separation have the advantage to recover metal and acid in addition to AMD mitigation, as an effort to achieve zero liquid discharge [6].
Lime (Ca(OH)2) or limestone (CaCO3) are added to AMD to precipitate sulfate as gypsum and metals as hydroxides. The gypsum sludge is then removed by gravity separation, which raises the pH [7]. Massive amounts of gypsum sludge with no economic value are generated and have to be disposed of in large land areas. Moreover, this process is expensive, labor-intensive, and unable to meet the discharge criteria in some instances [8].
Biological treatment systems can be classified based on either active systems (bioreactors) or passive systems (aerobic and anaerobic wetlands) [3]. In general, biological systems rely on the ability of sulfate-reducing bacteria found in carbon sources (e.g., manure, wood chips) to generate alkalinity in AMD and remove metals. Sulfate is reduced to sulfide to form metal precipitates. Concurrently, hydrogen sulfide generated by the bacteria raises the wastewater pH [8,9].
Separation by ion exchange (IEX) technology is based on selective binding and elution interaction between the ions and appropriate IEX resins. It is a simple technology, which is efficient in removing trace impurities, and especially suitable if large volumes of dilute ionic solutions are to be treated. It is possible to remove copper (II) using a chelating ion exchanger under acidic conditions [10]. Recovery of copper, nickel, and cobalt from AMD using IEX has been proven successful by Nodwell and Kraotvil [11]. IEX becomes less attractive if concentrated AMD is to be treated because of the need for more frequent IEX resin regeneration.
Membrane technology is an attractive alternative to conventional AMD treatment options. Both reverse osmosis (RO) and nanofiltration (NF) are well-established methods for water desalination. They are highly efficient, cost-effective, and easy to scale-up processes. In the face of an ever-increasing stringent environmental criteria, applications of RO and NF are gaining acceptance from the mining industry. It is considered that NF offers a good opportunity compared to conventional methods to treat AMD, such as the preferential passage of mono-charged ions (e.g., hydrogen sulfate, protons) allowing for further recovery of sulphuric acid and high rejection of multi-charged ions, such as transition metals and rare earth elements [12]. NF is preferred over RO when treating metal pollutants as it provides a higher permeate flux at a lower pressure while yielding acceptable rejection performance [13]. This leads to reduced capital investment, and lower system operating and maintenance costs. Moreover, NF can be used to concentrate and recover target metals from AMD, which can be exploited as an invaluable resource commodity [12,14].
Mullet et al. [14] investigated the impact of feed pH and membrane charge on NF performance for AMD treatment for two NF membranes (NF 270 and TS 80). They concluded that the retention of metal cations was maximized when the feed solution pH was below the membrane isoelectric point (IEP). In another study, the performance of three commercial membranes (NF99, DK, GE) at different pressures and concentrations on treating a Chilean copper mine AMD sample was investigated [8]. All membranes tested showed a promising high rejection of heavy metals (>98%). It can be concluded that membrane performance for single and mixed salt solutions can provide a clue to the performance of NF treating AMD streams.

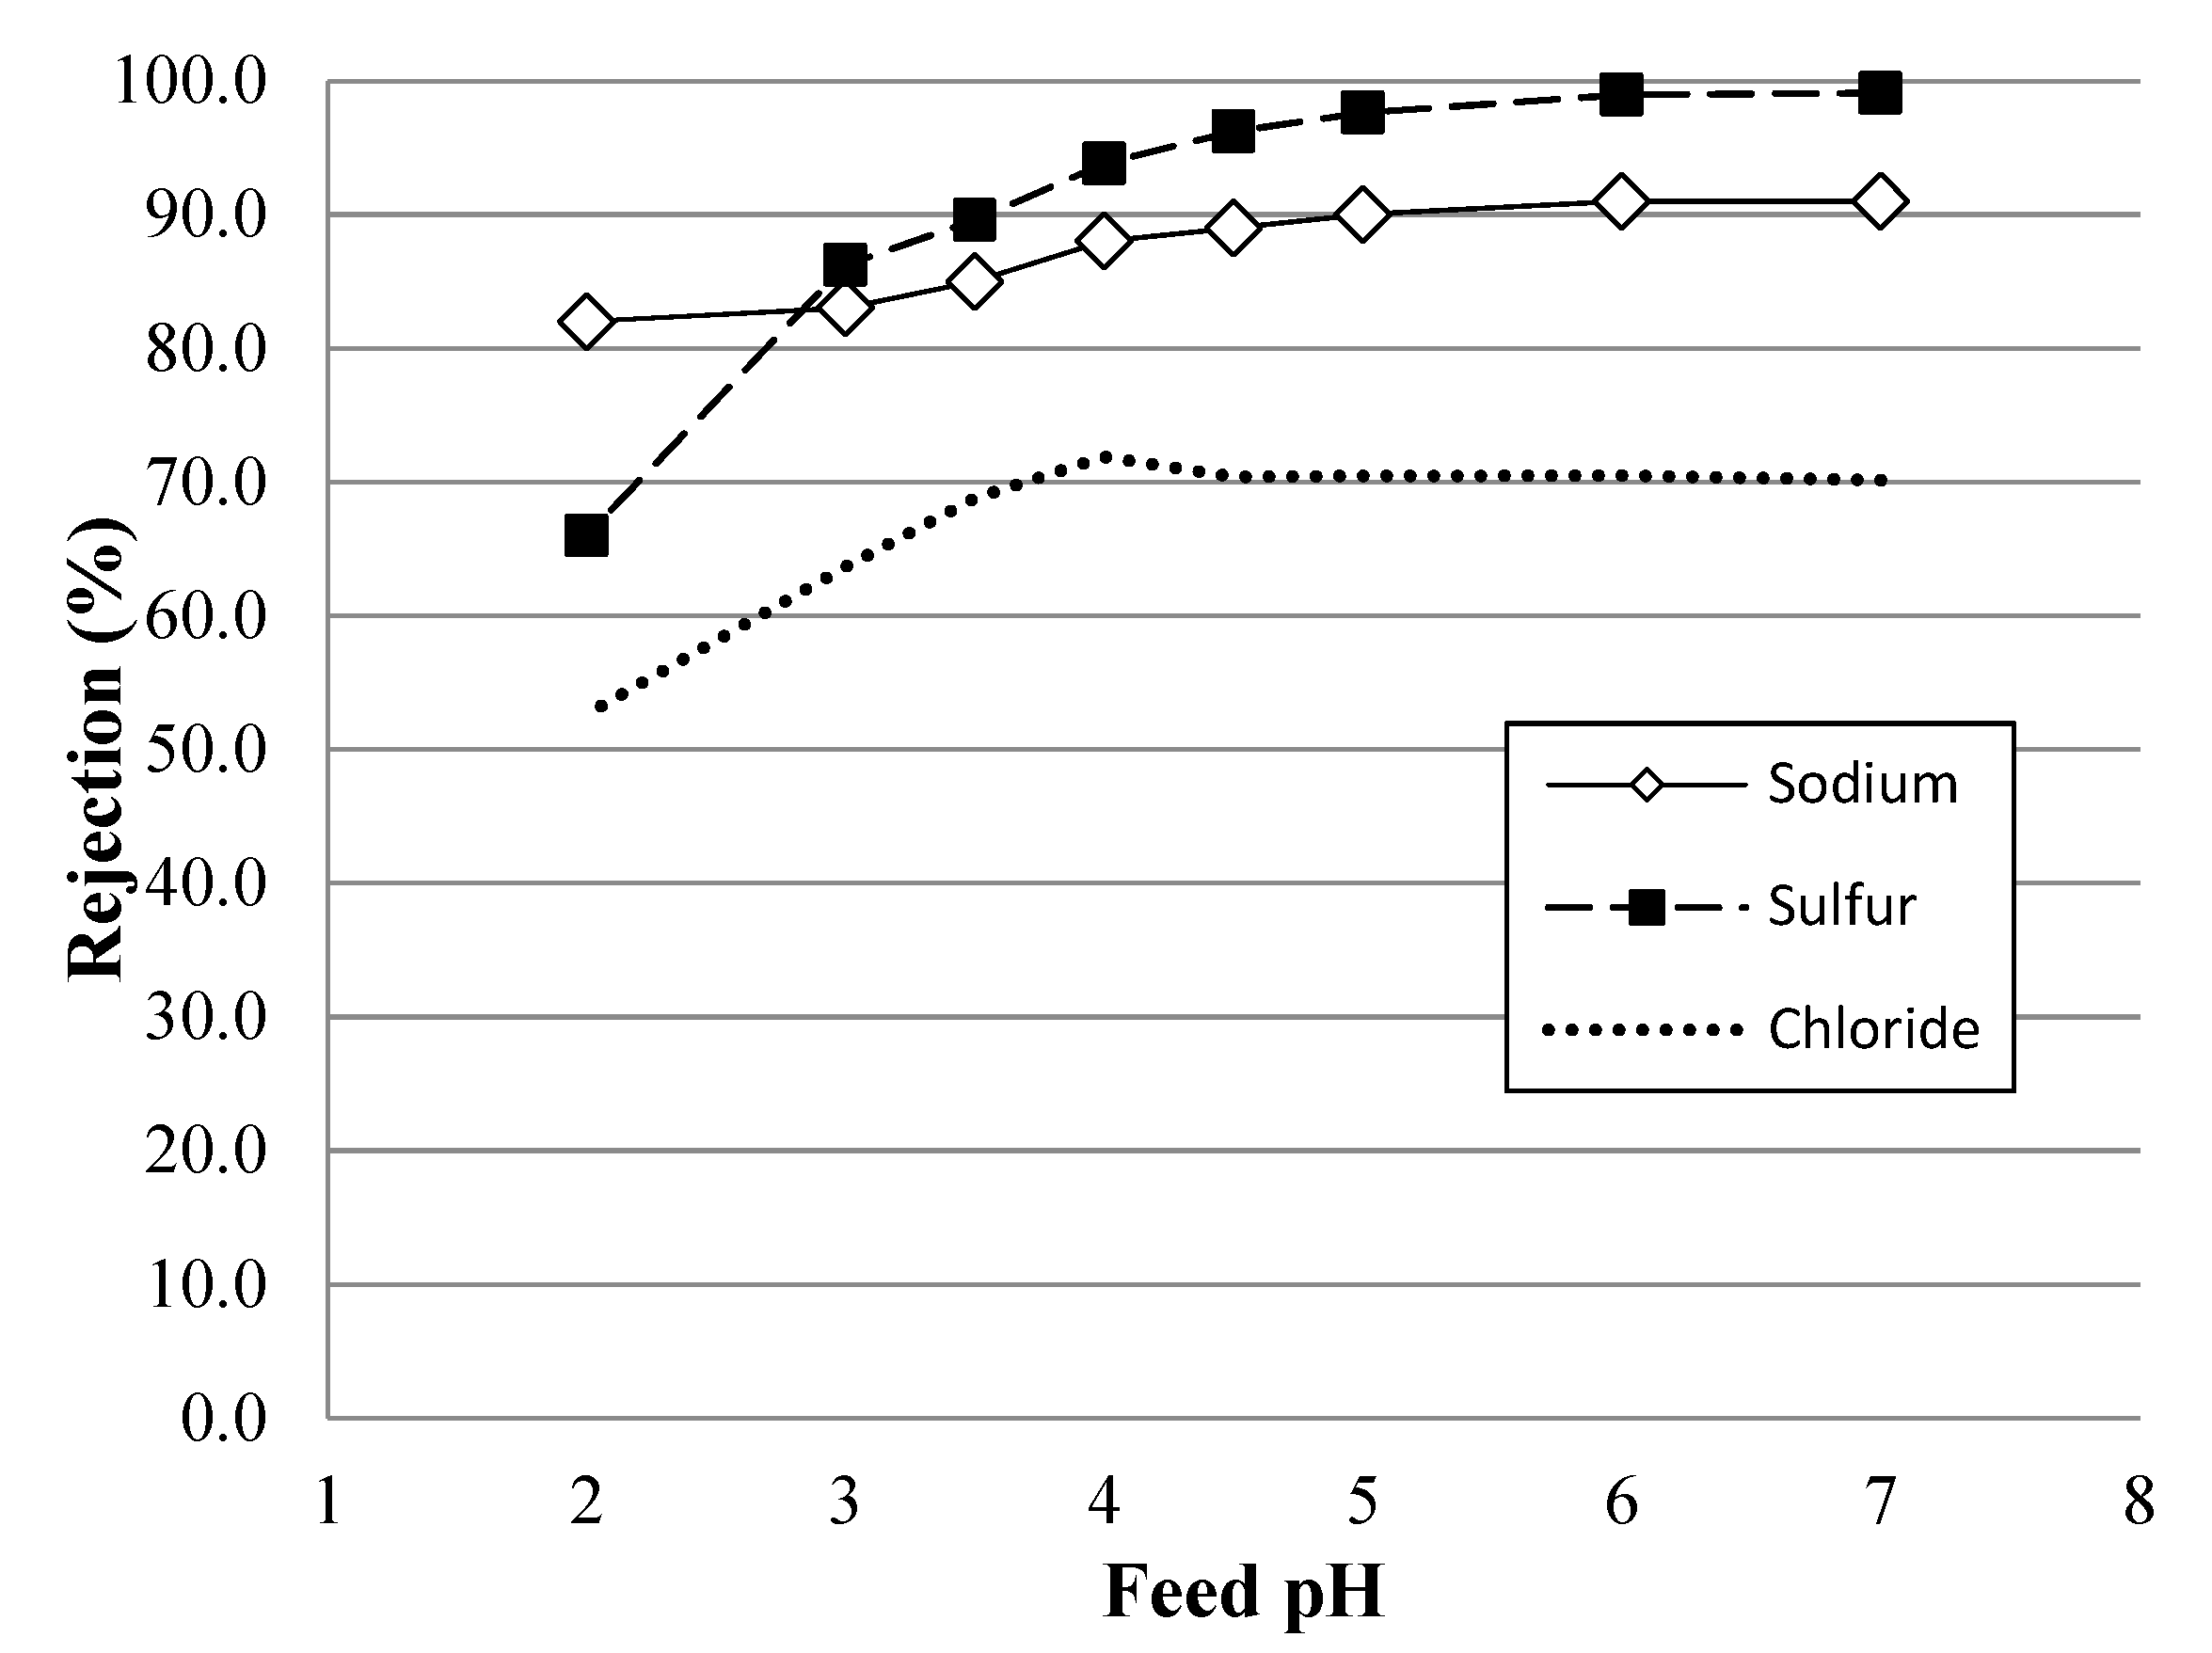
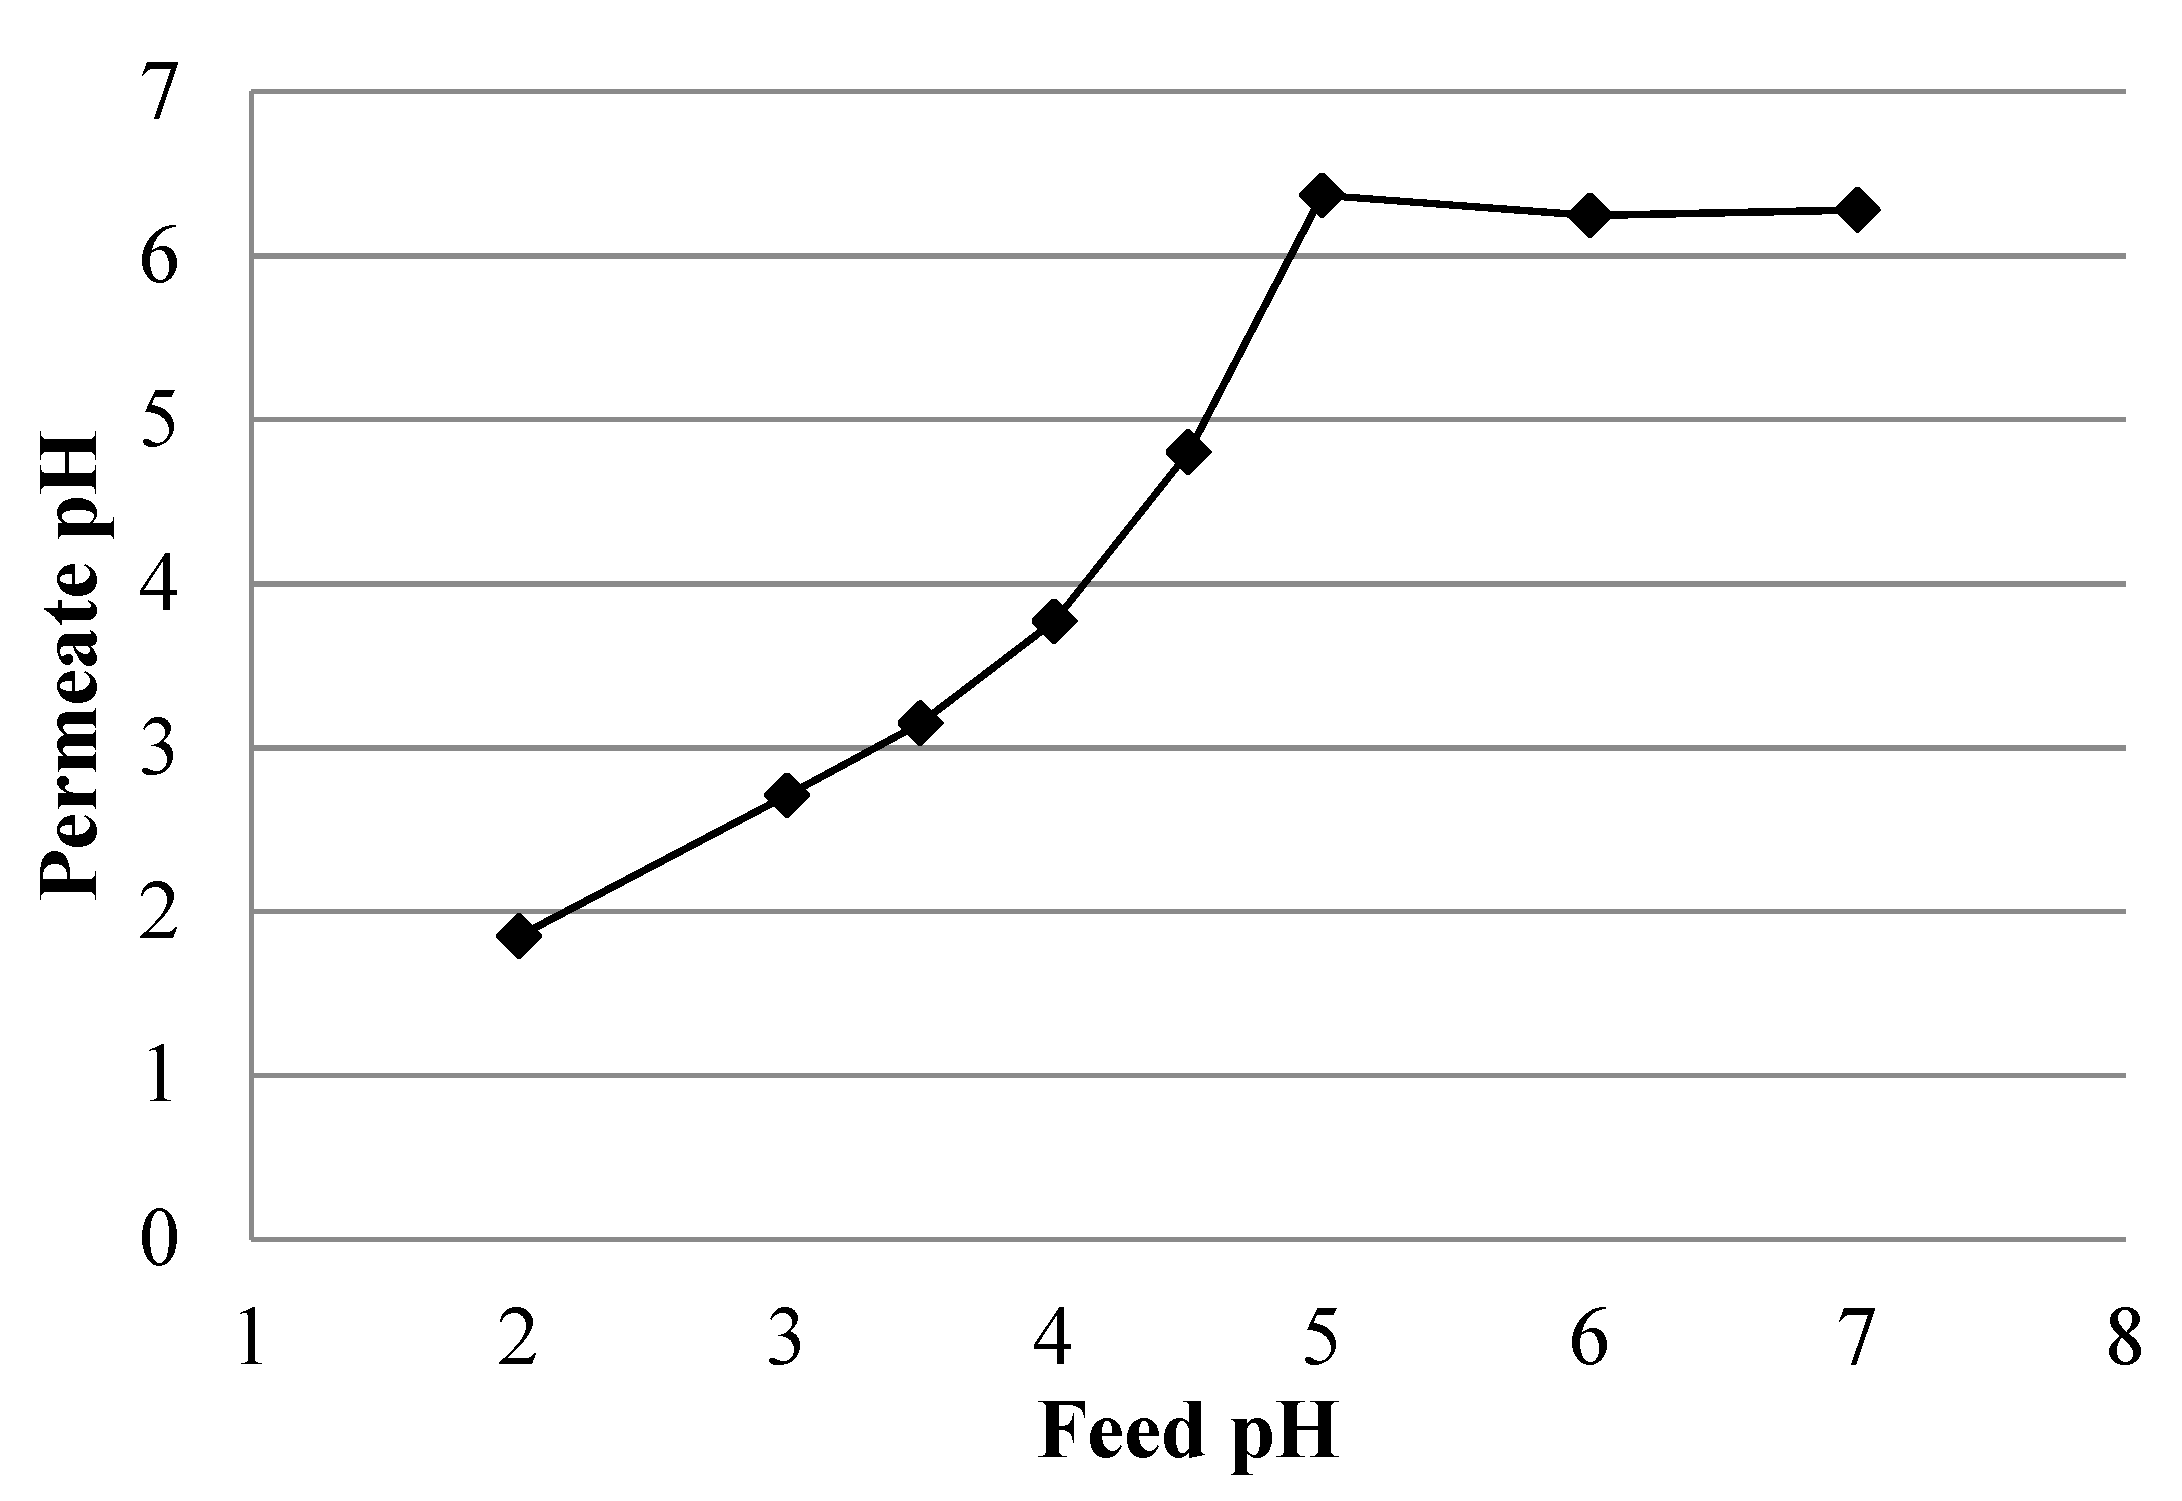
Effect of Feed Solution pH

An NF membrane exhibits an amphoteric behavior and the membrane charge varies according to the feed solution pH that it is exposed to. This was demonstrated in a pioneering study by Hagmeyer and Gimbel [15], in which the zeta potential of Desal 5 DK membrane was expressed as a function of the solution pH. The isoelectric point (IEP) of the membrane corresponds to the intersection of the curve with the x-axis where the zeta potential or net membrane charge is zero. This usually corresponds to the minimum rejection, where size exclusion is the only active separation mechanism [16]. Below the IEP, a positive zeta potential is observed indicating a positive membrane surface charge and vice versa for pH >IEP.
Based on this behavior, the separation performance in terms of permeate flux and solute rejection can be altered. Mänttäri et al. [17] showed that commercial polyamide thin film composite (TFC) membranes exhibit a more open polymeric structure (resulting in higher permeate flux and lower solutes rejection) under alkaline conditions. However, an opposite observation was made by Tang et al. [18] with the permeation of sodium chloride solution using a polyester composite NF membrane. This study found that the electrostatic repulsion between the (–COO–) groups on the membrane surface and the OH groups in the feed solution at high pH results in pore shrinkage which consequently decreases the permeate flux. A higher flux was also observed at low pH due to the conversion of amino groups to RH3N+, which increases the overall hydrophilicity of the membrane and enlarged its pores [19] due to a reduced electrostatic repulsion brought about by the decreased H+ concentration in the feed solution. This discrepancy in reported findings shows that the effect of pH on the separation performance depends largely on the membrane chemistry.
The objective of the present study was to investigate the relationship between ions rejection, feed pH and membrane charge by characterizing the performance of a commercial NF membrane for single salt and mixed salt solutions at different pH values. These salts contain ions found in a typical AMD solution. Subsequently, ion rejection performance for a model AMD at different pH values was systematically investigated and characterized.

2. Materials and Methods

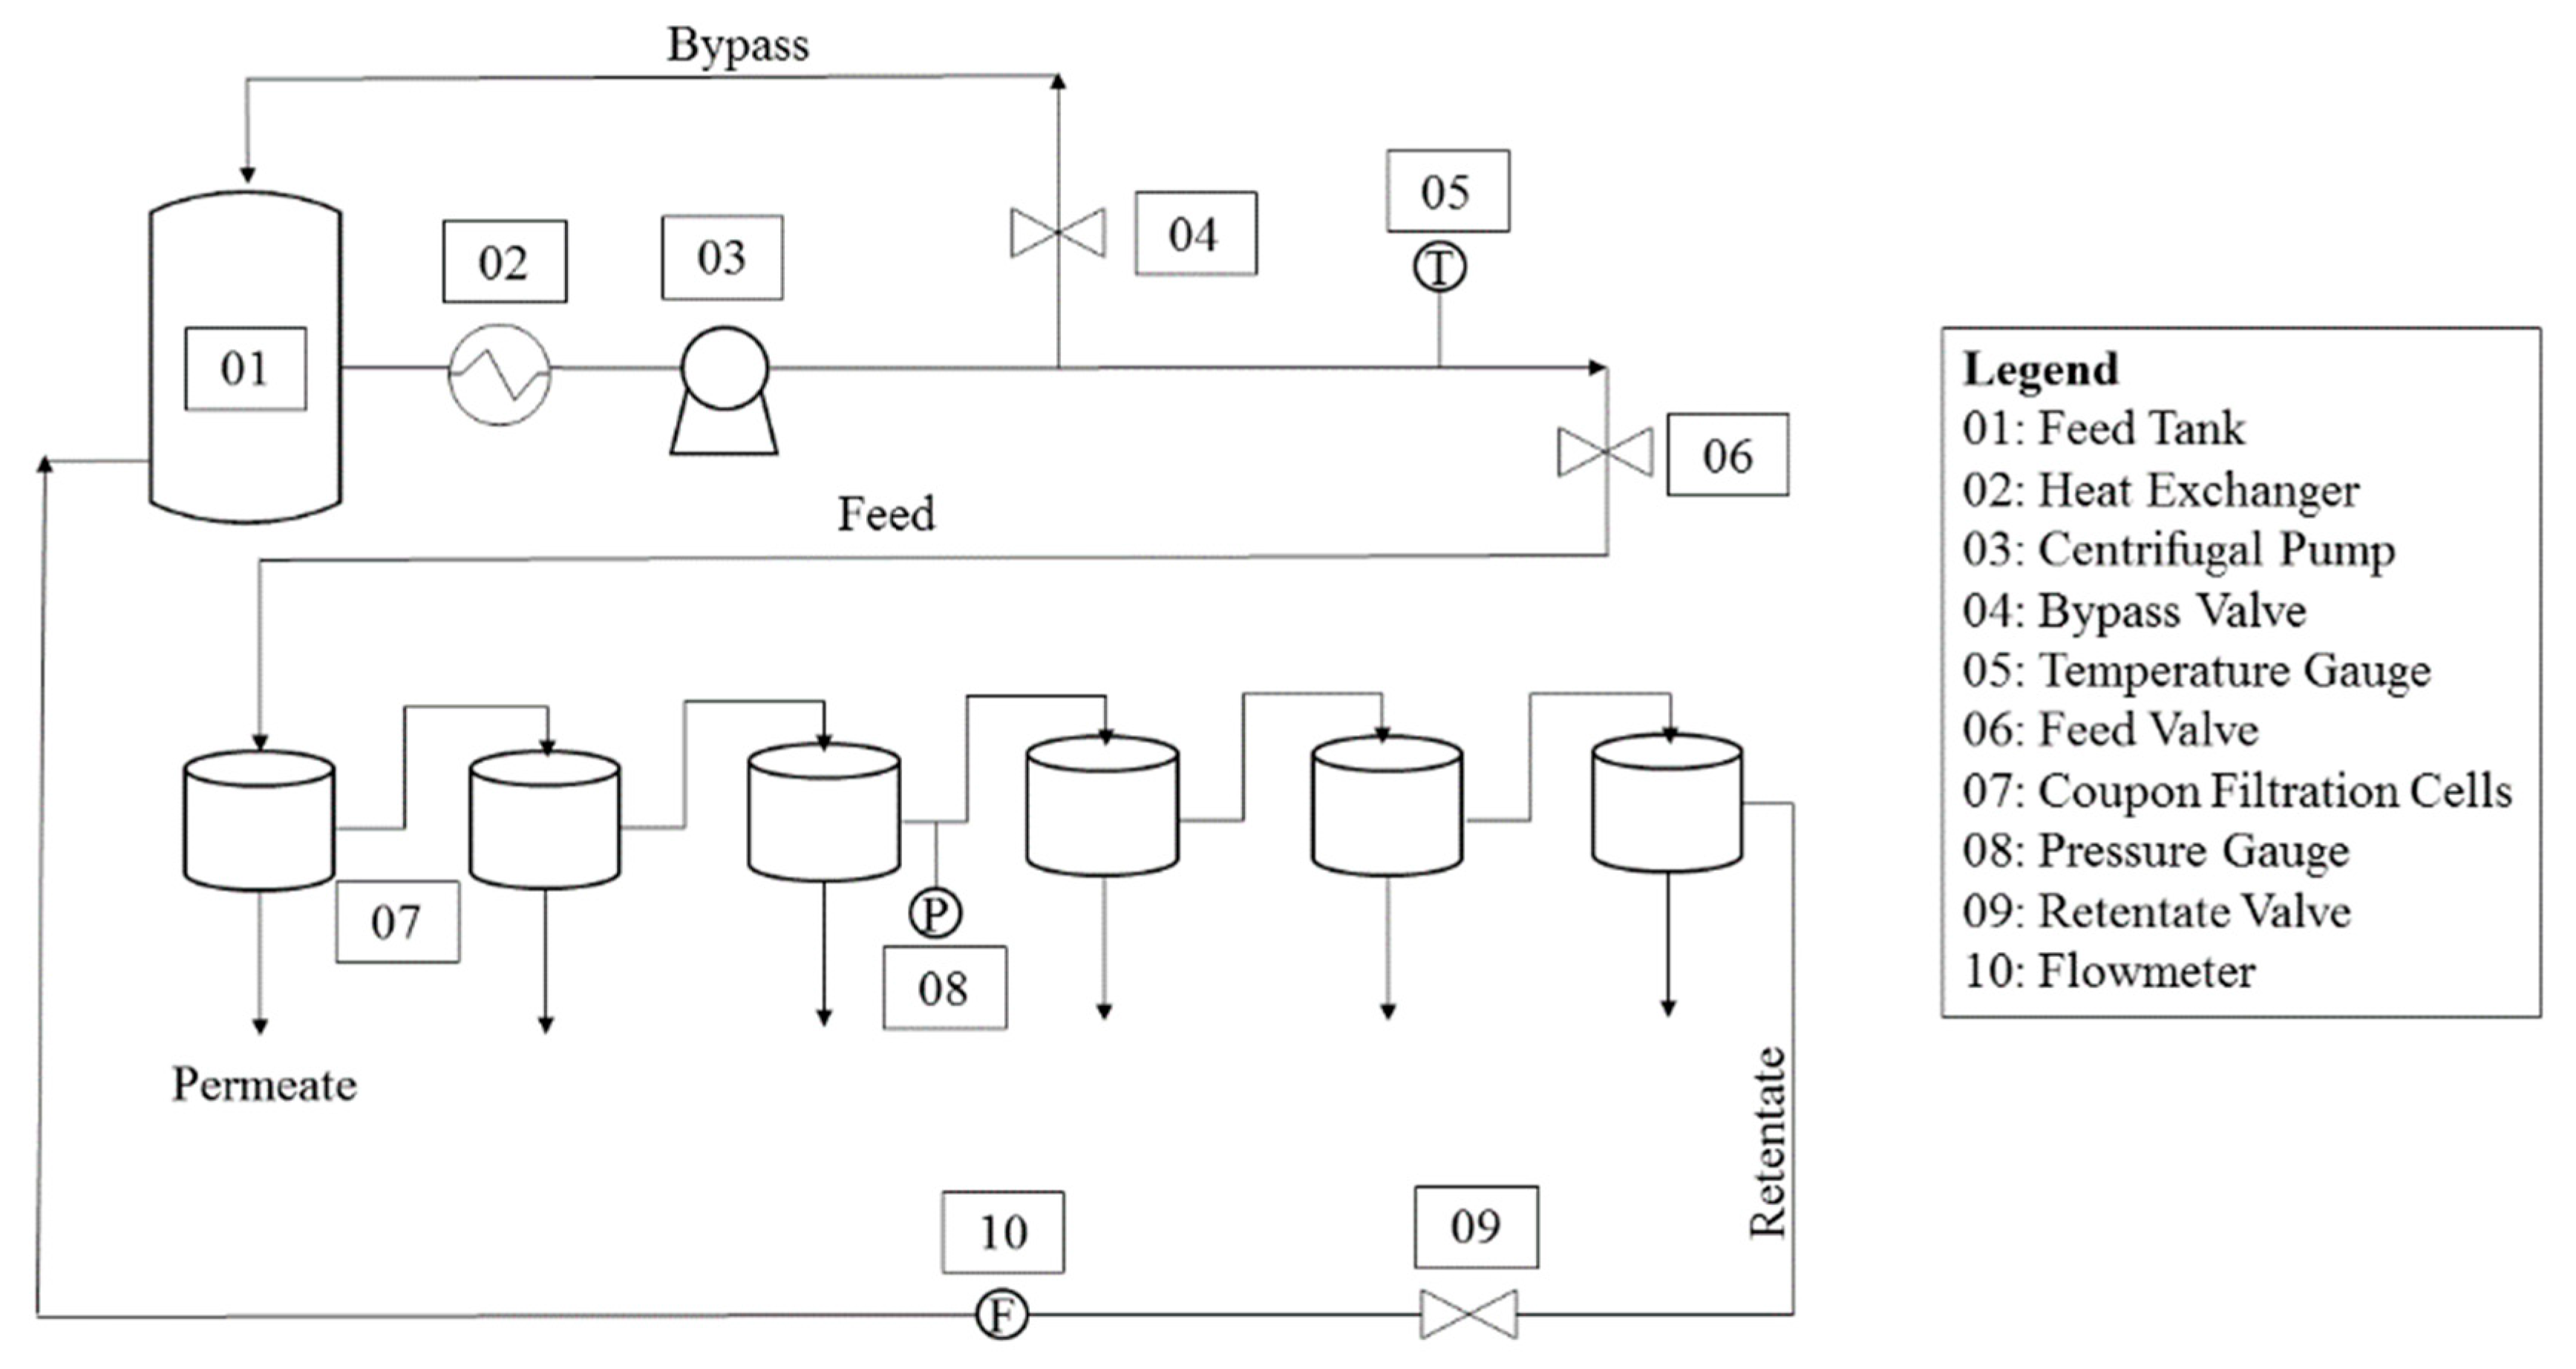
2.1. Materials and Apparatus

An in-house made NF membrane (referred to as Membrane A) was used in this study. It is a thin film composite, which consists of a PAN (polyacrylonitrile) substrate support layer and a surface skin layer, which chemical composition is under know-how protection. This surface skin layer is cross-linked on top of the PAN substrate. The membrane pure water permeability at 25.0 °C was determined to be 1.99 L/(m2.h.bar). The membrane rejection of glucose (3% in RO water) at 40 bar is 96%.
All salts were weighed using a weighing balance (Mettler Toledo XS6002S) and added directly to deionized (DI) water (with approximately 2.0 µS/cm of conductivity and pH 5.8) to make up a target salt solution. MgSO4·7H2O, CaSO4·2H2O, and NaSiO3 were obtained from Sigma Aldrich. CuSO4·5H2O, Mn(NO3)2·5H2O, HCl, and NaOH were obtained from Merck. NaCl, Na2SO4, NaNO3, and C6H12O6 were obtained from Applichem. Single and mixed salt solution feed compositions, as well as the pH range investigated in this study, are shown in Table 1 and Table 2, respectively.
New membrane coupons were used in each set of experiments. Prior to the start and after the end of each experiment set, permeation tests were performed at standard test conditions (2000 mg/L MgSO4 T = 25.0 °C, ∆P = 10 bar and a feed flow rate = 4.0 L/min). Permeate flux and ion rejection results were compared between the start and after the end of the standard condition experiments run for 30 min, so as to ensure that the membrane integrity remained intact throughout a given experiment set. For all experiments, the feed operating pressures were fixed at 10 bar. The feed solution pH values were adjusted to the targeted pH (±0.1) using either 10% (v/v) HCl or 10% (v/v) NaOH.

2.2. Model AMD Solution Design

The model AMD solution used in this study was designed as an average of the compositions of different mine waters as detailed in Table 3 with reference to 6 mine water solutions. They included 3 real mine water (MW) solutions (MW A: Australian Copper MW, Chilean Copper MW, and Brazilian Uranium MW) and 3 model compositions (MW B, MW C, and MW D) recreated from MW A by Mullett et al. [14]. The final target ion concentration was calculated from the salts used in single salt and mixed salt experiments. Table 4 shows the model AMD solution feed composition investigated in this study. Na2SiO3 was omitted from the model AMD solution composition as it causes other salts in the solution to precipitate. Mn and Cu were chosen as the representative heavy metal ions in the model AMD solution.

2.3. Membrane Filtration Experiments

NF experiments were performed using an in-house custom-built flat sheet cross-flow filtration membrane coupon tester (CT) (Figure 1), capable of testing 6 membrane coupons concurrently.
The CT consisted of 6 membrane coupon filtration cells arranged in a series configuration (feed originates from the retentate of the upstream adjacent cell), each with a membrane area of 26.55 cm2. The installation consists also of a 60 L feed tank and a high-pressure centrifugal pump.
Nanofiltration experiments were carried out in a batch recirculation mode (total permeate recovery of about 0.1%). By efficient cell design and appropriate hydrodynamic conditions, the effect of concentration polarization (see Figure A1 and Figure A2 in Appendix A) was rendered negligible during all filtration experiments. As such, the ion rejection and permeate flux were calculated using the following Equations:
R a p p = ( 1 c P c f ) ,
Π = i M R T ,
Δ Π = Π f Π p ,
J v = A ( Δ P Δ Π ) = V p A m t ,
in which the symbols and subscripts have their common meanings as specified in Appendix B.
The target salts were added into the feed tank and recirculated to ensure their complete dissolving and homogenous mixing within the system. Feed sampling was performed before the start of each experiment and, if necessary, adjusted accordingly to the targeted concentrations. The salt concentrations throughout the system were assumed to be constant since the volume loss by permeate sampling (approximately 6 × 50 mL) was negligible compared to the feed volume (60 L).
The feed recirculation flow rate was measured by a flow meter after the last filtration cell. Three valves were used to adjust the fluid flow to the desirable operating conditions. The pressure was measured using a pressure gauge at the retentate of the third filtration cell. This pressure was regarded as the imposed operating pressure, ΔP, as the pressure drop across the 6 membrane coupon filtration cells was insignificant (below 0.05 bar). Lastly, the temperature was maintained at 25 °C using a heat exchanger.
All filtration experiments were first run at 10 bar for 1 h for membrane compaction. After that, permeate samples were collected. The sampling time for all the experiments was 30 min.

3. Analytical methods

3.1. Conductivity—Concentration Calibration Curve

Calibration curves were constructed to establish a relationship between the concentration of magnesium sulfate (10–100 mg/L and 1000–4500 mg/L) and conductivity from pH 3 to 7. Magnesium sulfate salt was weighed using a weighing balance (Mettler Toledo XS6002S and XP504) and added to 1 L of deionized water. The pH, conductivity, and temperature were noted using a multimeter (Schott Prolab 4000) after the salt had completely dissolved. Next, the pH was raised to pH 7 using 10% NaOH from an initial pH of 5.6–5.8. Similarly, the pH and conductivity were noted, after which the pH was lowered stepwise (interval of 1) to pH 3 to obtain the corresponding conductivity. Magnesium sulfate concentration (mg/L) was expressed as a function of conductivity (µS/cm) at pH 3, pH 4, and pH 5 to 7, respectively. Calibration of sodium chloride solution at pH 7 was performed in a similar manner as for the magnesium sulfate solution.

3.2. Spectrophotometer

A VIS spectrophotometer (Hach Lange DR3900) capable of measuring wavelength between 320 to 1100 nm was used in this study. The following Hach LCK cuvette tests were used: LCK 153 and 353 (for sulfate), LCK 329 (for copper), LCK 427 (for calcium and magnesium), LCK 339 (for nitrate), LCW 028 (for silicon), and LCW (for manganese). When necessary, samples were diluted to meet the required concentration range before measurement. Interferences in the cuvettes due to the presence of other ionic species were verified according to the specification. The test concentrations were adjusted accordingly during the design of the experiment set to prevent such errors.

3.3. Argentometric Titration

Chloride ion measurements were performed using argentometric titration. Each sample was titrated against a solution of known silver nitrate concentration. Chloride ions react with silver (Ag I) to form insoluble silver chloride. A blood-red color is formed at the titration end-point.

3.4. Ion Chromatography (IC)

Ion chromatography was used to measure the concentration of anions in the synthetic AMD experiments. The anions bound to the anion exchange resins in the chromatographic column were subsequently eluted based on their charge and size.

3.5. Inductively Coupled Plasma-Optical Emission Spectroscopy (ICP-OES)

ICP-OES was used to measure the concentration of cations in the synthetic AMD experiments. The samples were injected into an argon plasma and excited at high temperatures. The atomic emission emanating from the plasma was collected with a lens and imaged in the silt of a wavelength selection device, where the concentration of the cations was determined.

3.6. Electrokinetic Characterization

Streaming potential measurements of the membrane surface were performed using a SurPASS system (Anton Paar, Graz, Austria) with adjustable gap cell 0.001M KCl salt solution and Ag/AgCl electrodes, as described in previous studies [20,21,22].

4. Results and Discussion

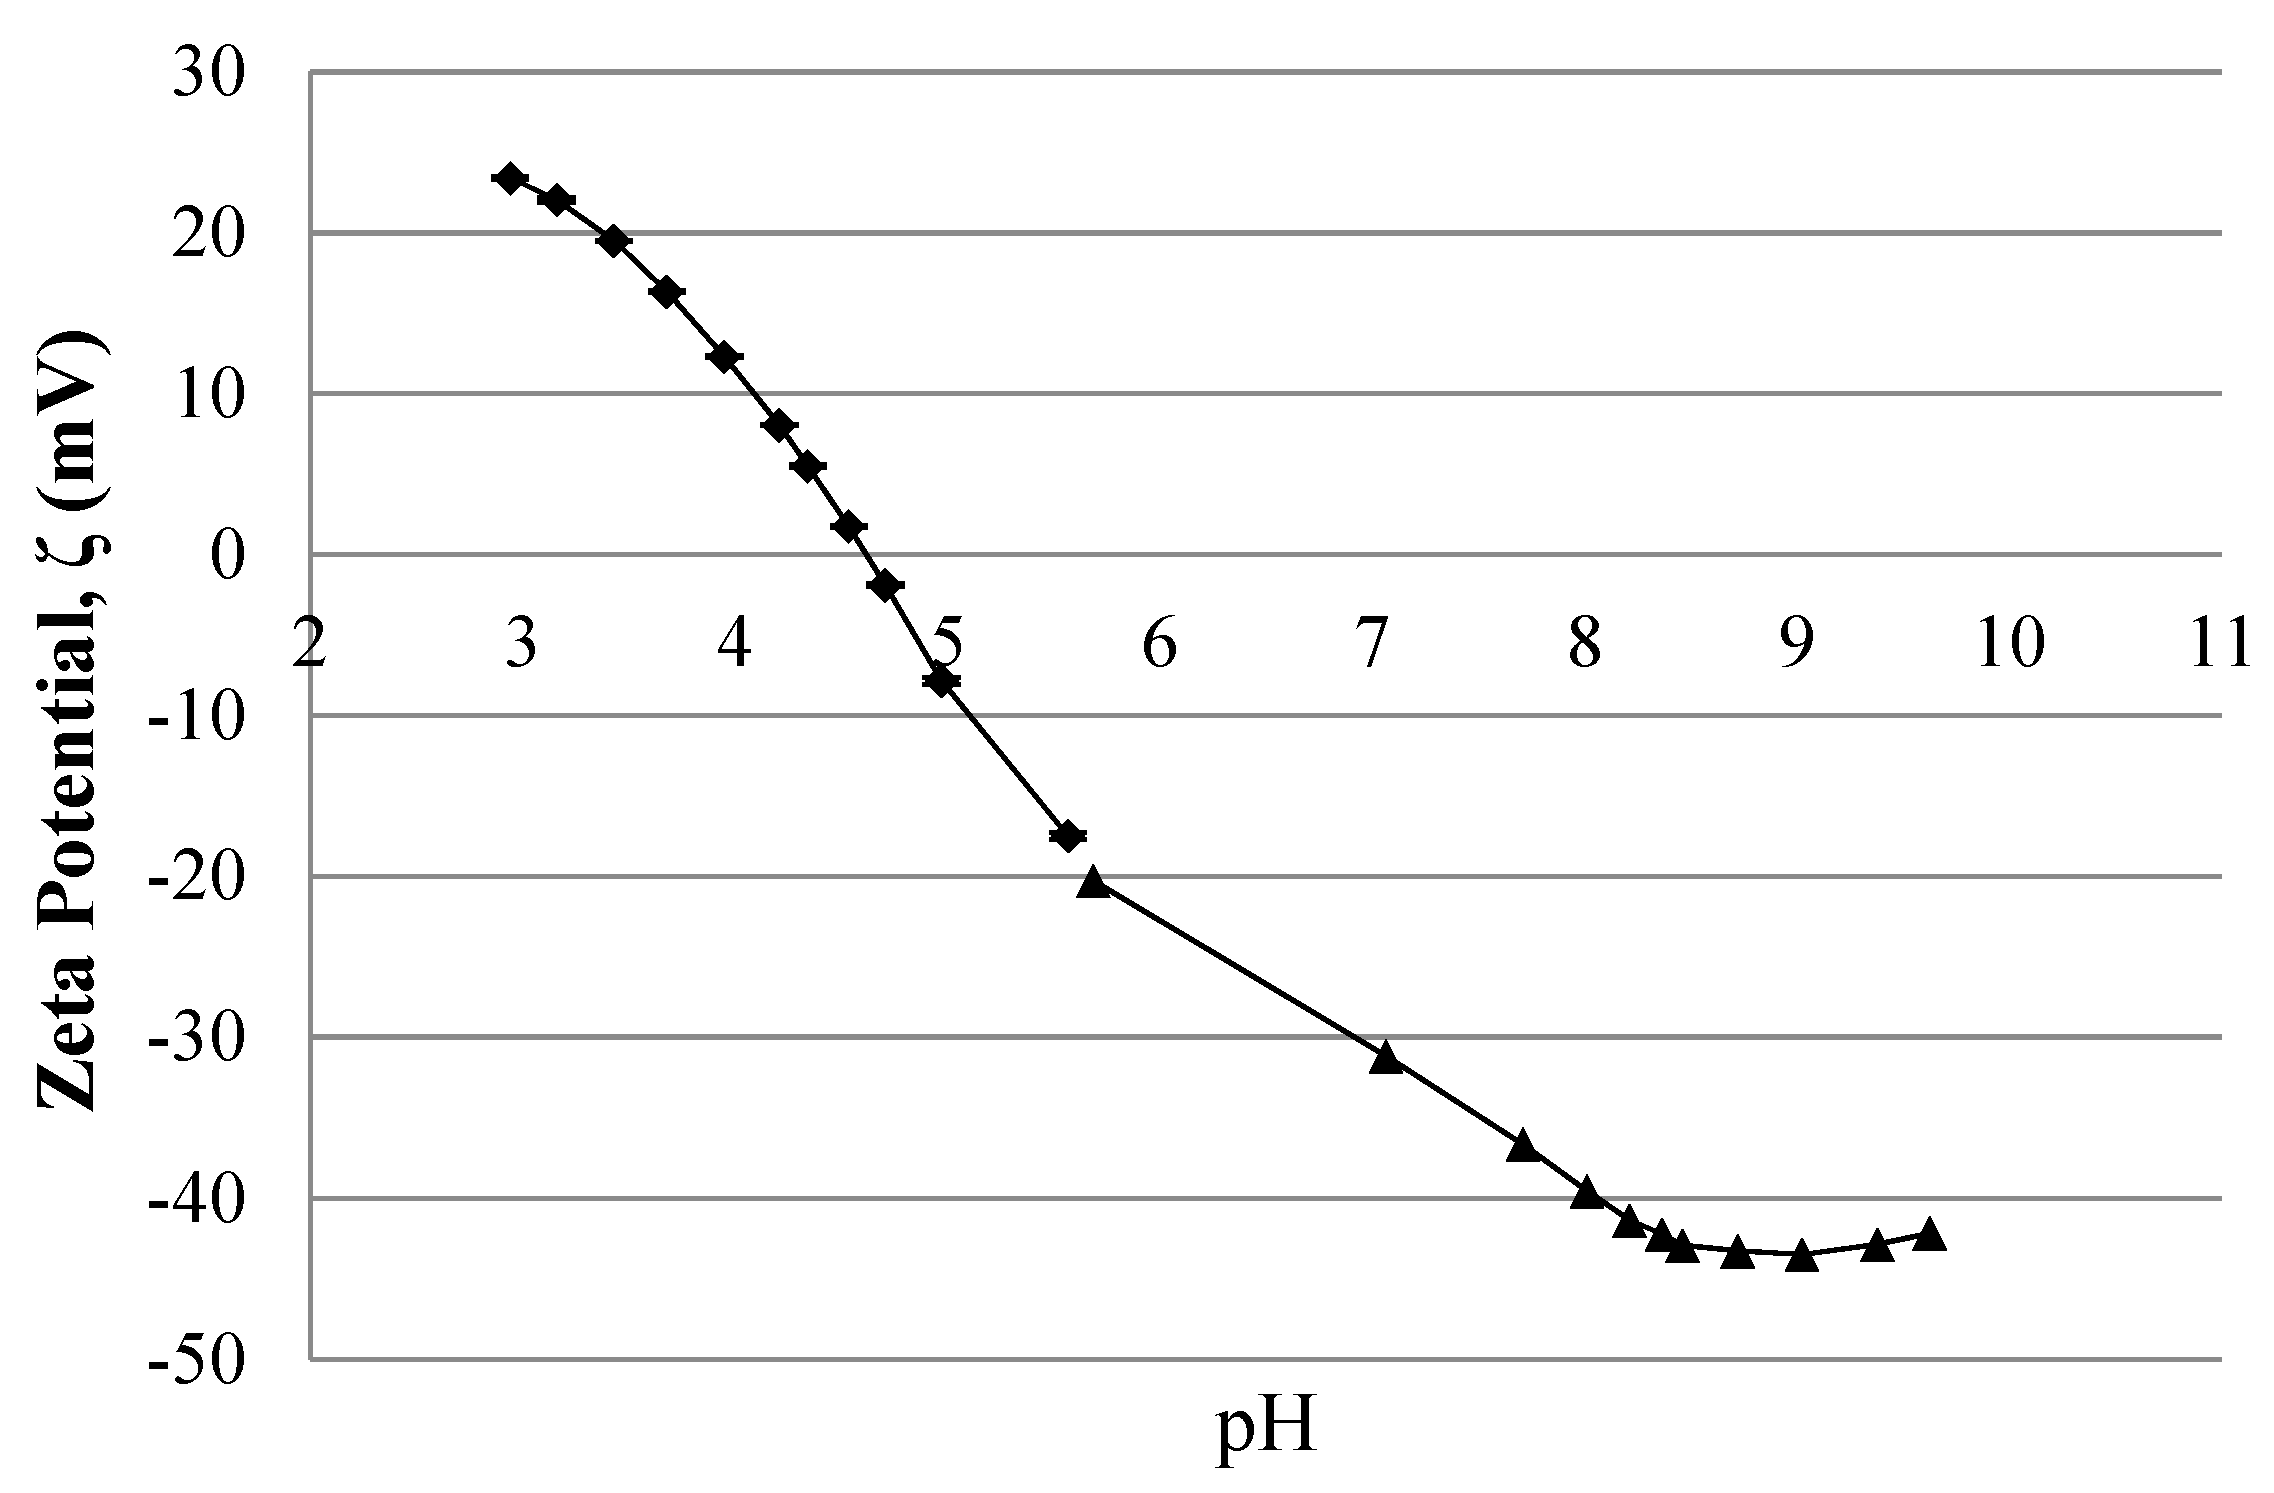
4.1. Streaming Potential Data

In this study, the streaming potential measurements were conducted between pH values of 3 to 10. As can be seen in Figure 2, the isoelectric point (IEP) of the membrane in a KCl solution was found to be at a pH of 4.7 below which the surface becomes positively charged.
Specific adsorption SO42− anions could be expected to shift the IEP to a lower pH value. In any case, at pH 7, for which all standard rejection experiments using magnesium sulfate were performed, Membrane A is negatively charged. At this pH value, rejection of sulfate is greater than the chloride due to stronger electrostatic repulsion (higher valency of SO42− vs. Cl), thus resulting in the Donnan effect, namely preferential rejection of divalent to monovalent ions of the same charge [23]. Passage of Cl ions is more prominent at higher salt concentrations due to the screening effect brought about by increasing Na+ concentration. The presence of Na+ shields the negative charge on the membrane surface causing a decreased Cl rejection. Due to the higher valency and larger size of sulfate, sulfate rejection remained high for all tested concentrations (see Section 4.2).

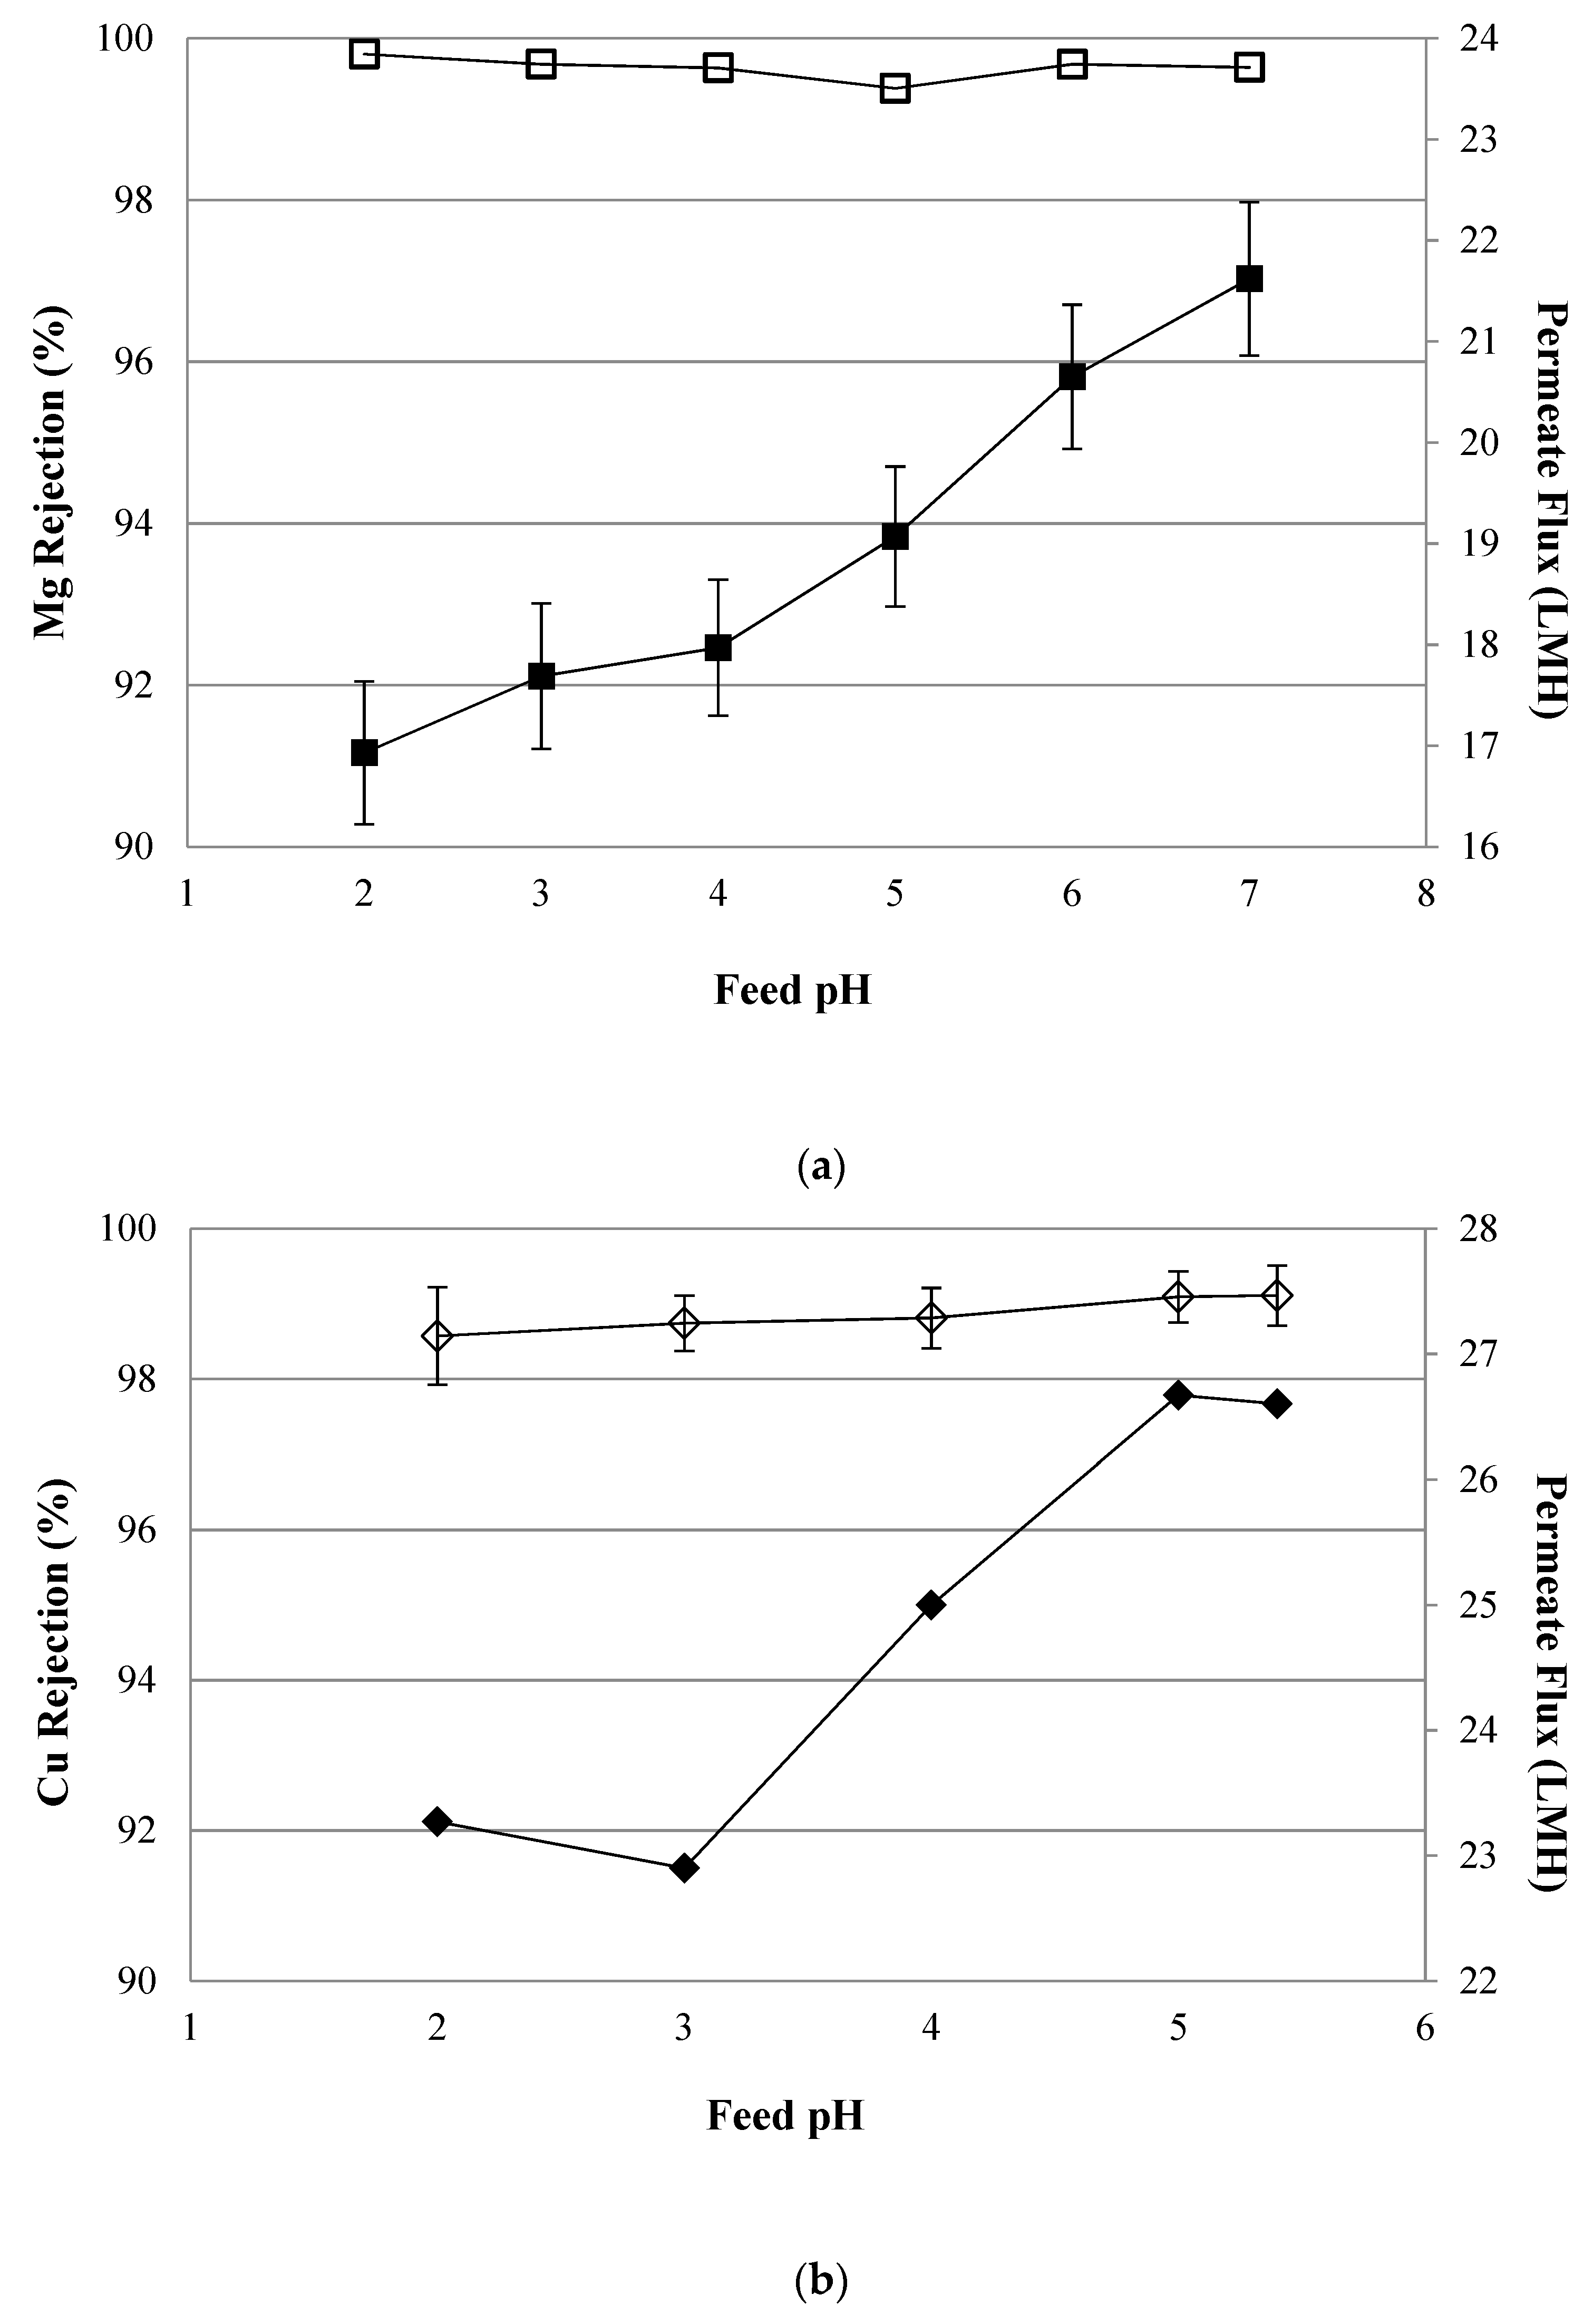
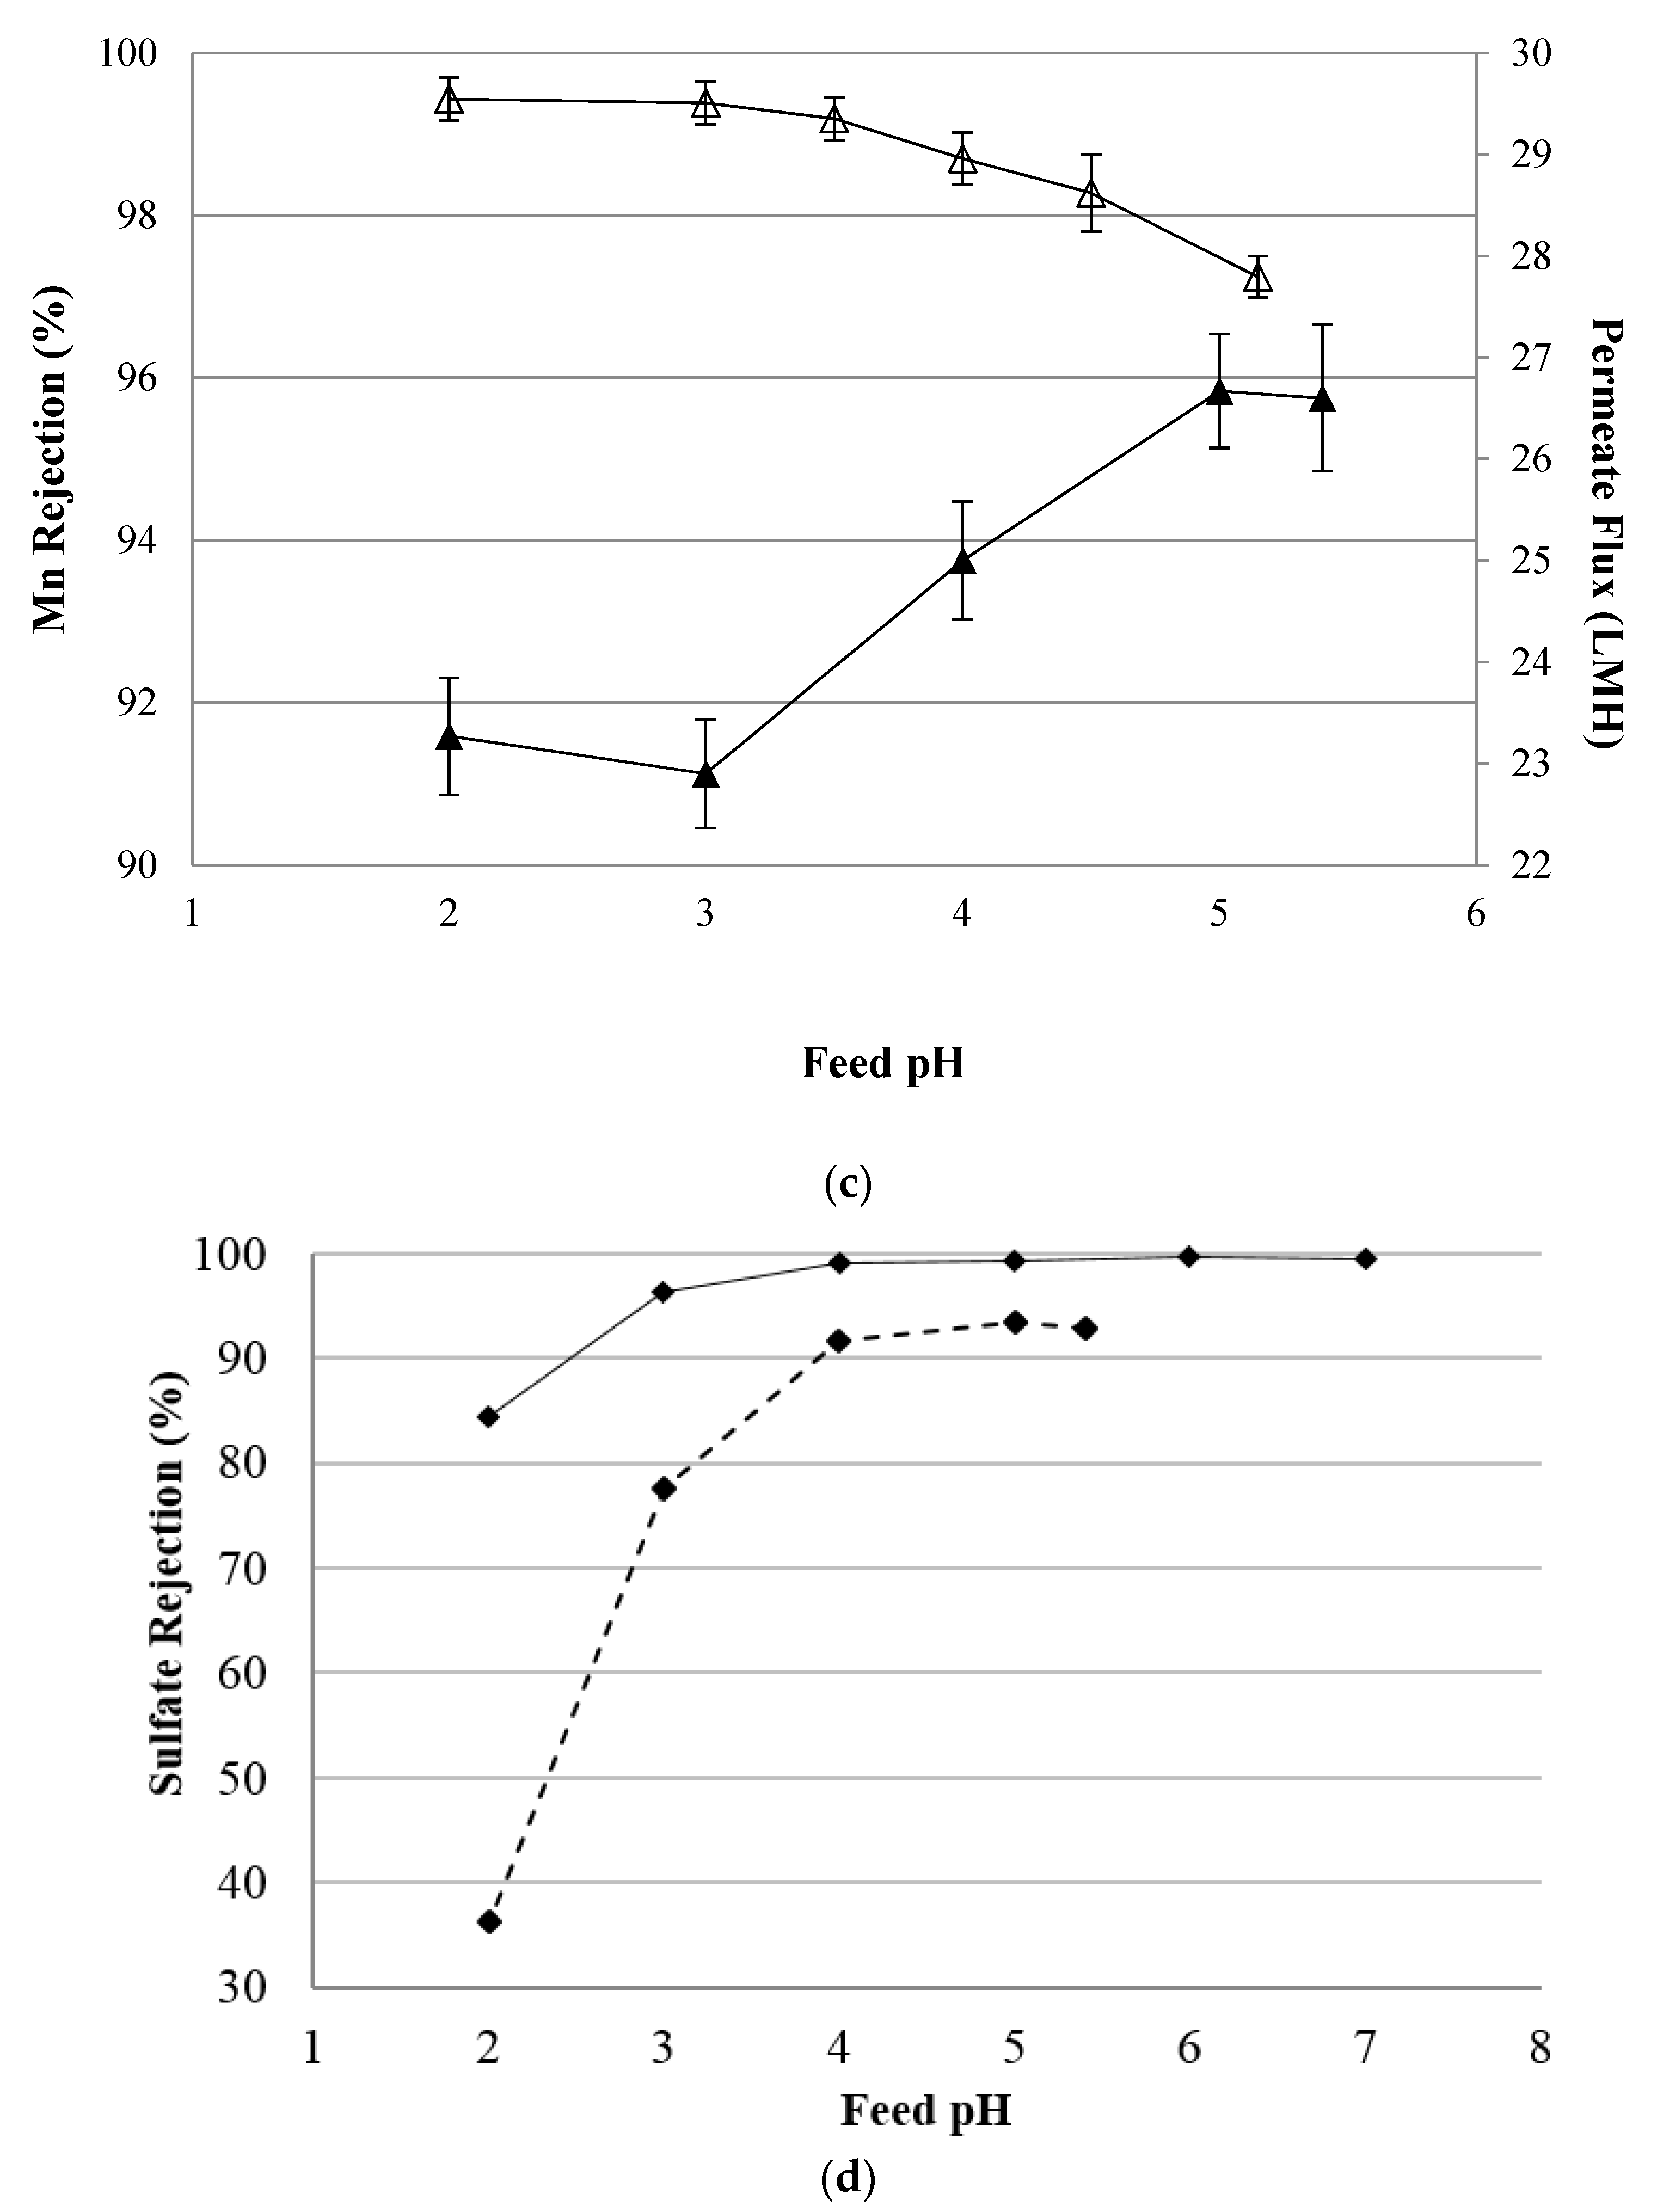
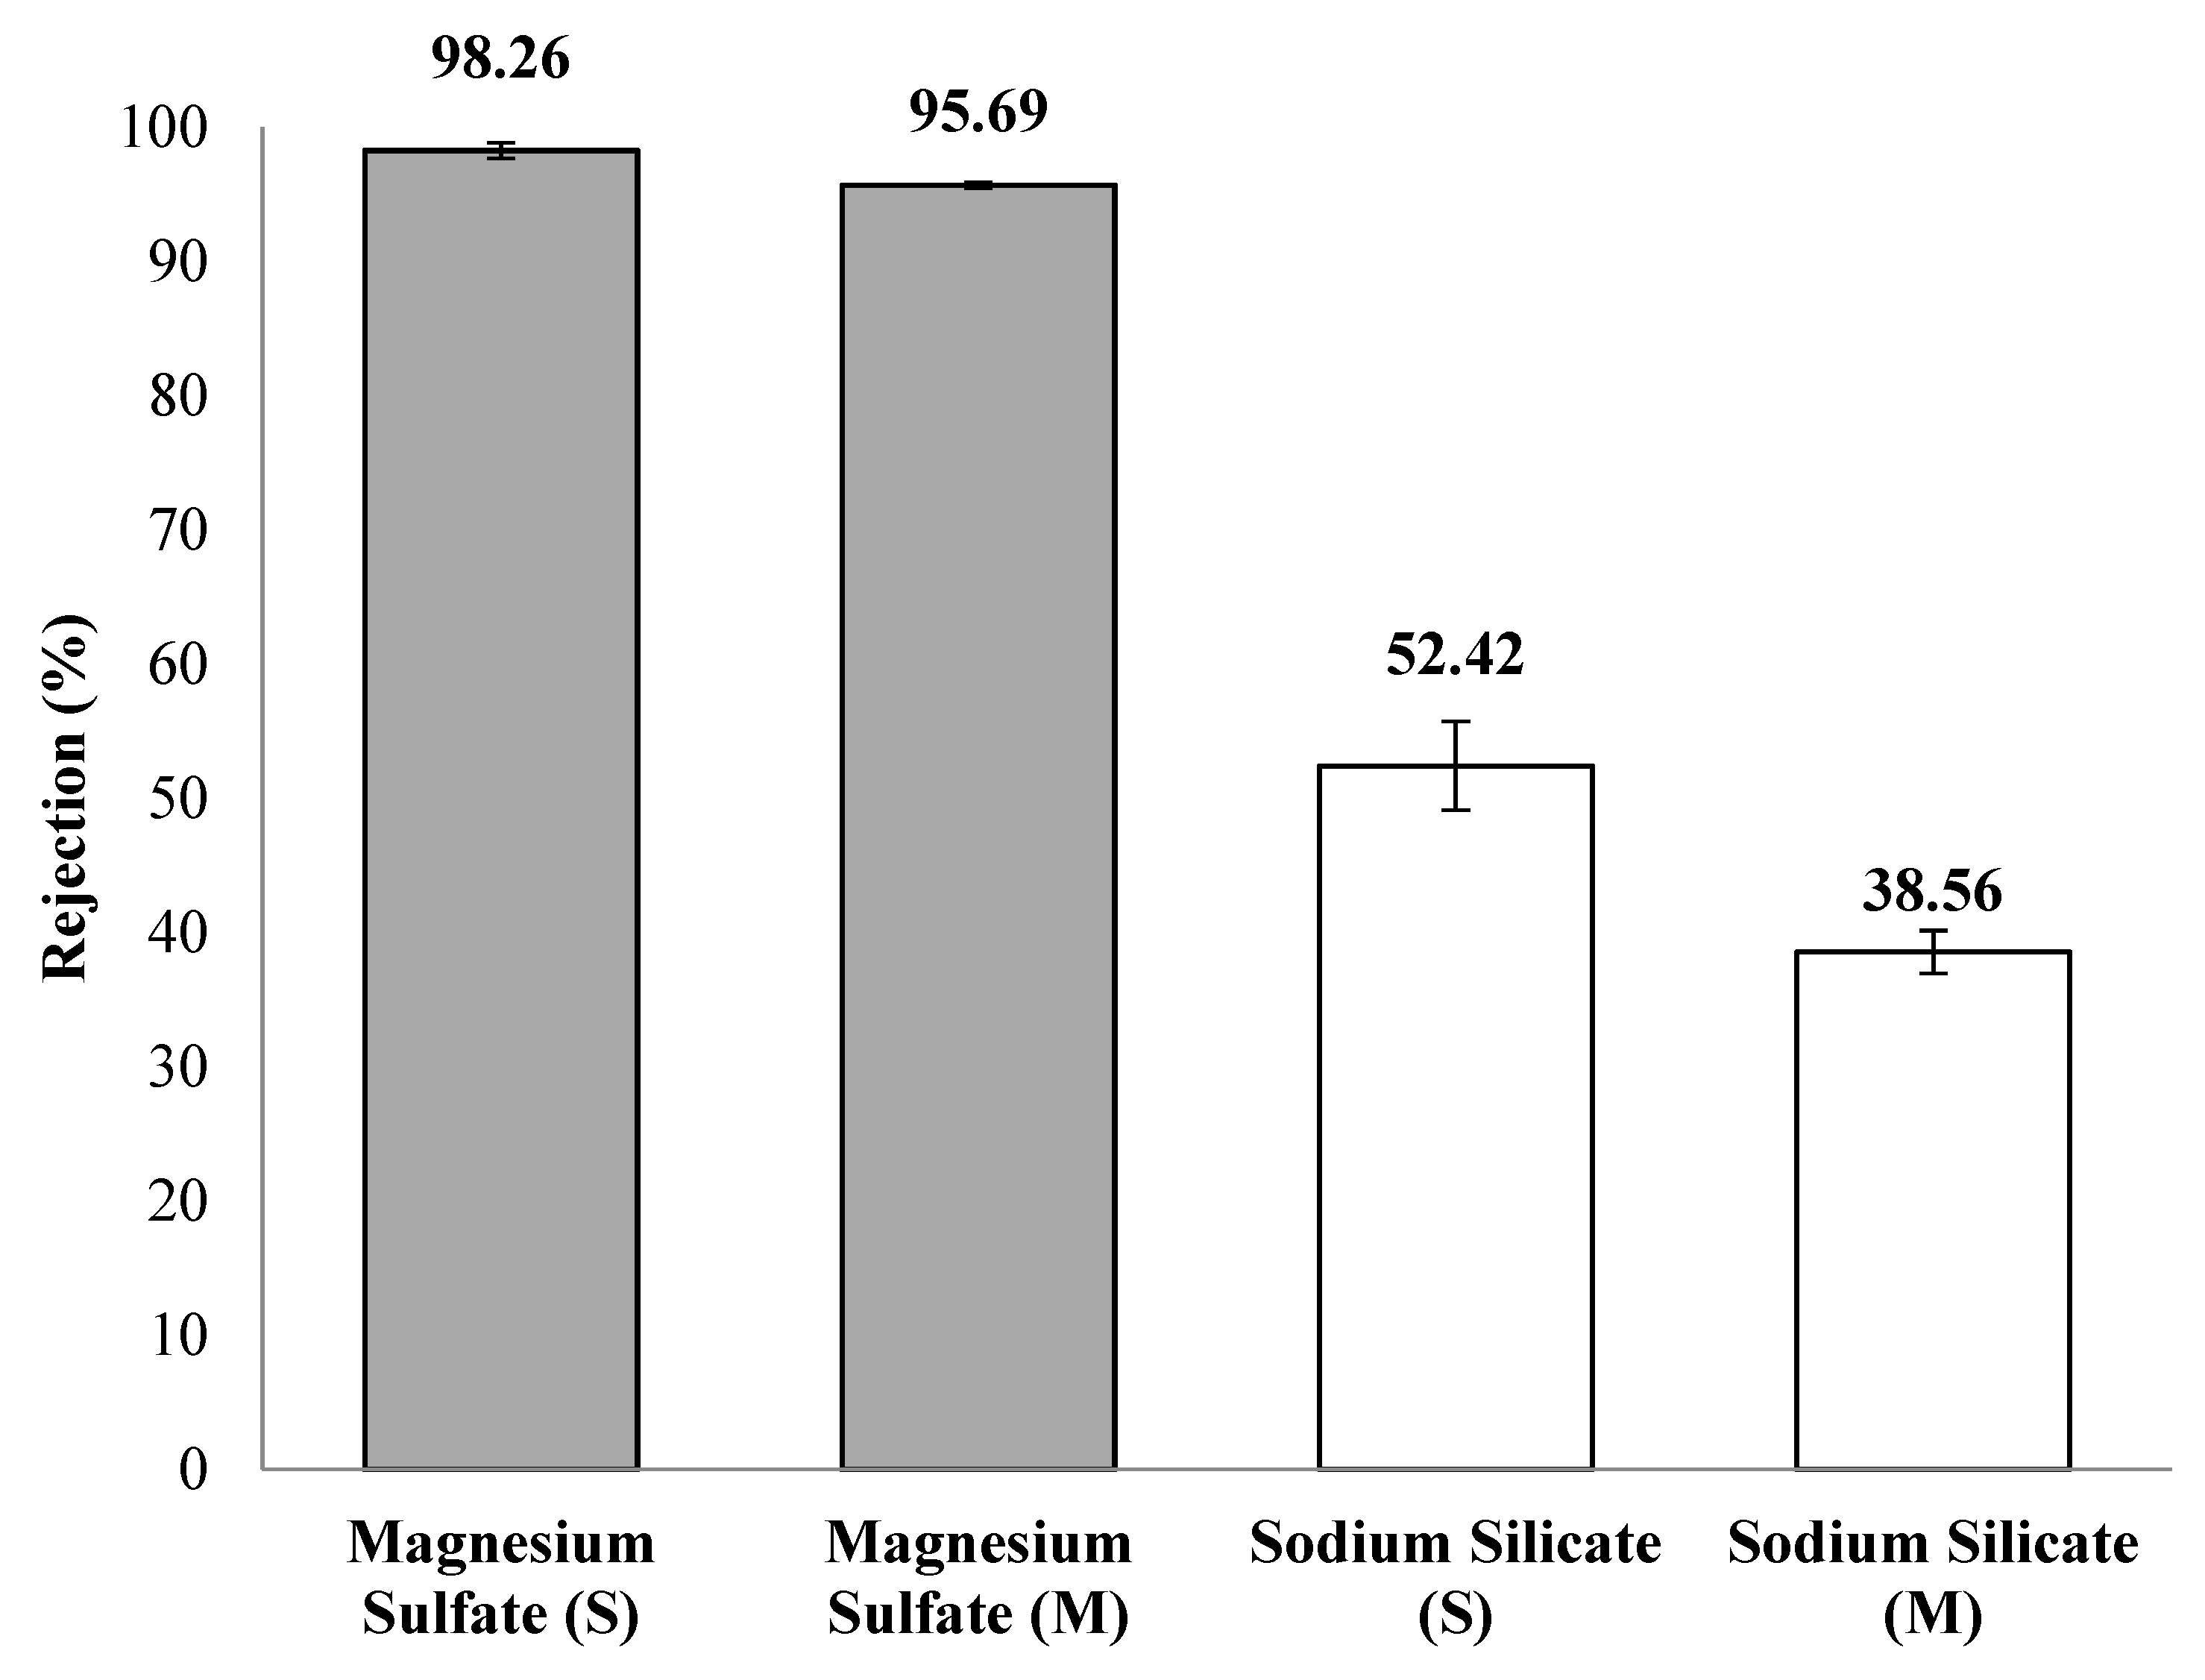
4.2. NF Performance in Single Salt Solutions

To assess the membrane performance with minimal interferences, single salt experiments with selected compounds were performed, namely magnesium sulfate, copper sulfate, and manganese nitrate. In addition, sulfate rejection was determined separately. Figure 3a shows the magnesium rejection and permeate flux as a function of feed pH.
As can be seen, the rejection of Mg2+ ions remained relatively constant (above 99.5%) throughout the investigated pH range, except for a slight dip at pH 5. This may be due to the proximity of this pH value to the membrane IEP, where a minimum ion rejection is to be expected [24,25]. The permeate flux, on the other hand, was higher as the pH value increased. This is contributed by the fact that the membrane became more negatively charged with increasing pH value as can be seen in Figure 2, resulting in a higher hydrophilicity [26,27,28,29]. As reported in the literature, dissociating groups in the polymer skin layer can make the surface more hydrophilic and looser, when charges of the polymer chains start to repel each other at elevated pH [17].
As copper is one of the most commonly found elements in AMD, copper rejection was determined in a single salt rejection experiment, and the data obtained are presented in Figure 3b. It was found that Cu rejection increased slightly with increasing pH, with the lowest rejection of 98.6% at pH = 2 and the highest rejection of 99.1% at pH = 5.4. However, these rejection values can be interpreted as relatively constant after accounting for the standard deviation. For polyamide-based TFC membranes such as Desal DK and NF 270, a trend where the rejection of Cu ions increased with decreasing pH was reported [30,31]. This was due to electrostatic repulsion from the increasing positive charge. Consequently, the rejection of Cu in Membrane A was less dependent on the membrane charge as compared to commercial polyamide-based membranes for Cu rejection (see Figure 3b).
In terms of manganese rejection, Membrane A maintained relatively high values (above 97%) for the investigated pH range of 2 to 5 (Figure 3c). This can be explained by the increasing retention of positively charged manganese cations with respect to decreasing pH. Specific adsorption of Mn2+ cations could be expected to shift the IEP to a higher pH value due to the shielding of the negative membrane charge. As the pH decreased, a stronger electrostatic repulsion between Mn2+ and positive membrane charges occurred. Al Rashdi et al. [31] observed similar rejection values using NF270 where rejection was at a maximum of 90% at pH 1.5. However, the rejection of NF270 dropped rapidly to 20% near the membrane’s IEP value. This shows that Membrane A produces more consistent and stable rejection results compared to NF270, which might be also associated with its denser polymeric structure and, therefore, the stronger contribution of steric (size-exclusion) compared to charge-related effects.
Sulfate rejection was determined in two different single salt solutions: 4000 mg/L magnesium sulfate and 100 mg/L copper (II) sulfate. It might be expected that in these solutions, due to complex co-adsorption of both the cations and the anions on the membrane surface, the IEP remains the same, but the overall surface charge becomes lower. As seen in Figure 3d, the rejection of sulfate in both solutions was relatively constant above the membrane IEP. This shows that the rejection of salt was governed mainly by the electrostatic repulsion of sulfate (SO42−) and the negatively charged membrane.
Below the IEP, a sharp drop in sulfate rejection was observed, most remarkably at pH 2, which is close to the pKa value of sulfate (pKa = 1.92). This could be attributed to the increase in bisulfate (HSO4) concentration in the feed solution due to chemical speciation of sulfate at lower pH values, which could trigger the Donnan effect [32]; at pH 2, sulfate ions are present as SO42− and HSO4 with a ratio of ca. 10% and 50%, respectively [33].
The co-ion Mg2+ was rejected at a greater extent than H+ due to its higher valence charge. Therefore, SO42− anion remained with Mg2+ cation to maintain the overall electroneutrality on the feed side. At the same time, the monovalent HSO4 ions coupled with H+ ions present in the solution, passing through the membrane to the permeate side, thus resulting in a lower permeate pH. The latter is also favored by the significantly higher concentration of very mobile protons (a “conductivity jump”) at a feed pH lower than 3, which can lead to protons permeation (together with Cl) across the membrane. The overall membrane surface charge is also more shielded under such conditions.
As a result of the permeation of HSO4, the overall sulfate rejection significantly decreased at pH values below the membrane IEP. This phenomenon was also observed by Visser et al. [34] and Mullett et al. [14], where sulfate rejection in a mixed system decreased drastically at pH 2 and 3. The fall in sulfate rejection at low pH (36.3% at pH = 2) was more drastic for the CuSO4 experiment compared to the MgSO4 experiment. The explanation for this phenomenon is that the higher permeation of SO42− ions in the CuSO4 solution can be attributed to the reduced effect of membrane charge shielding due to the lower salt concentration (100 mg/L of CuSO4, in comparison to 4000 mg/L of MgSO4).

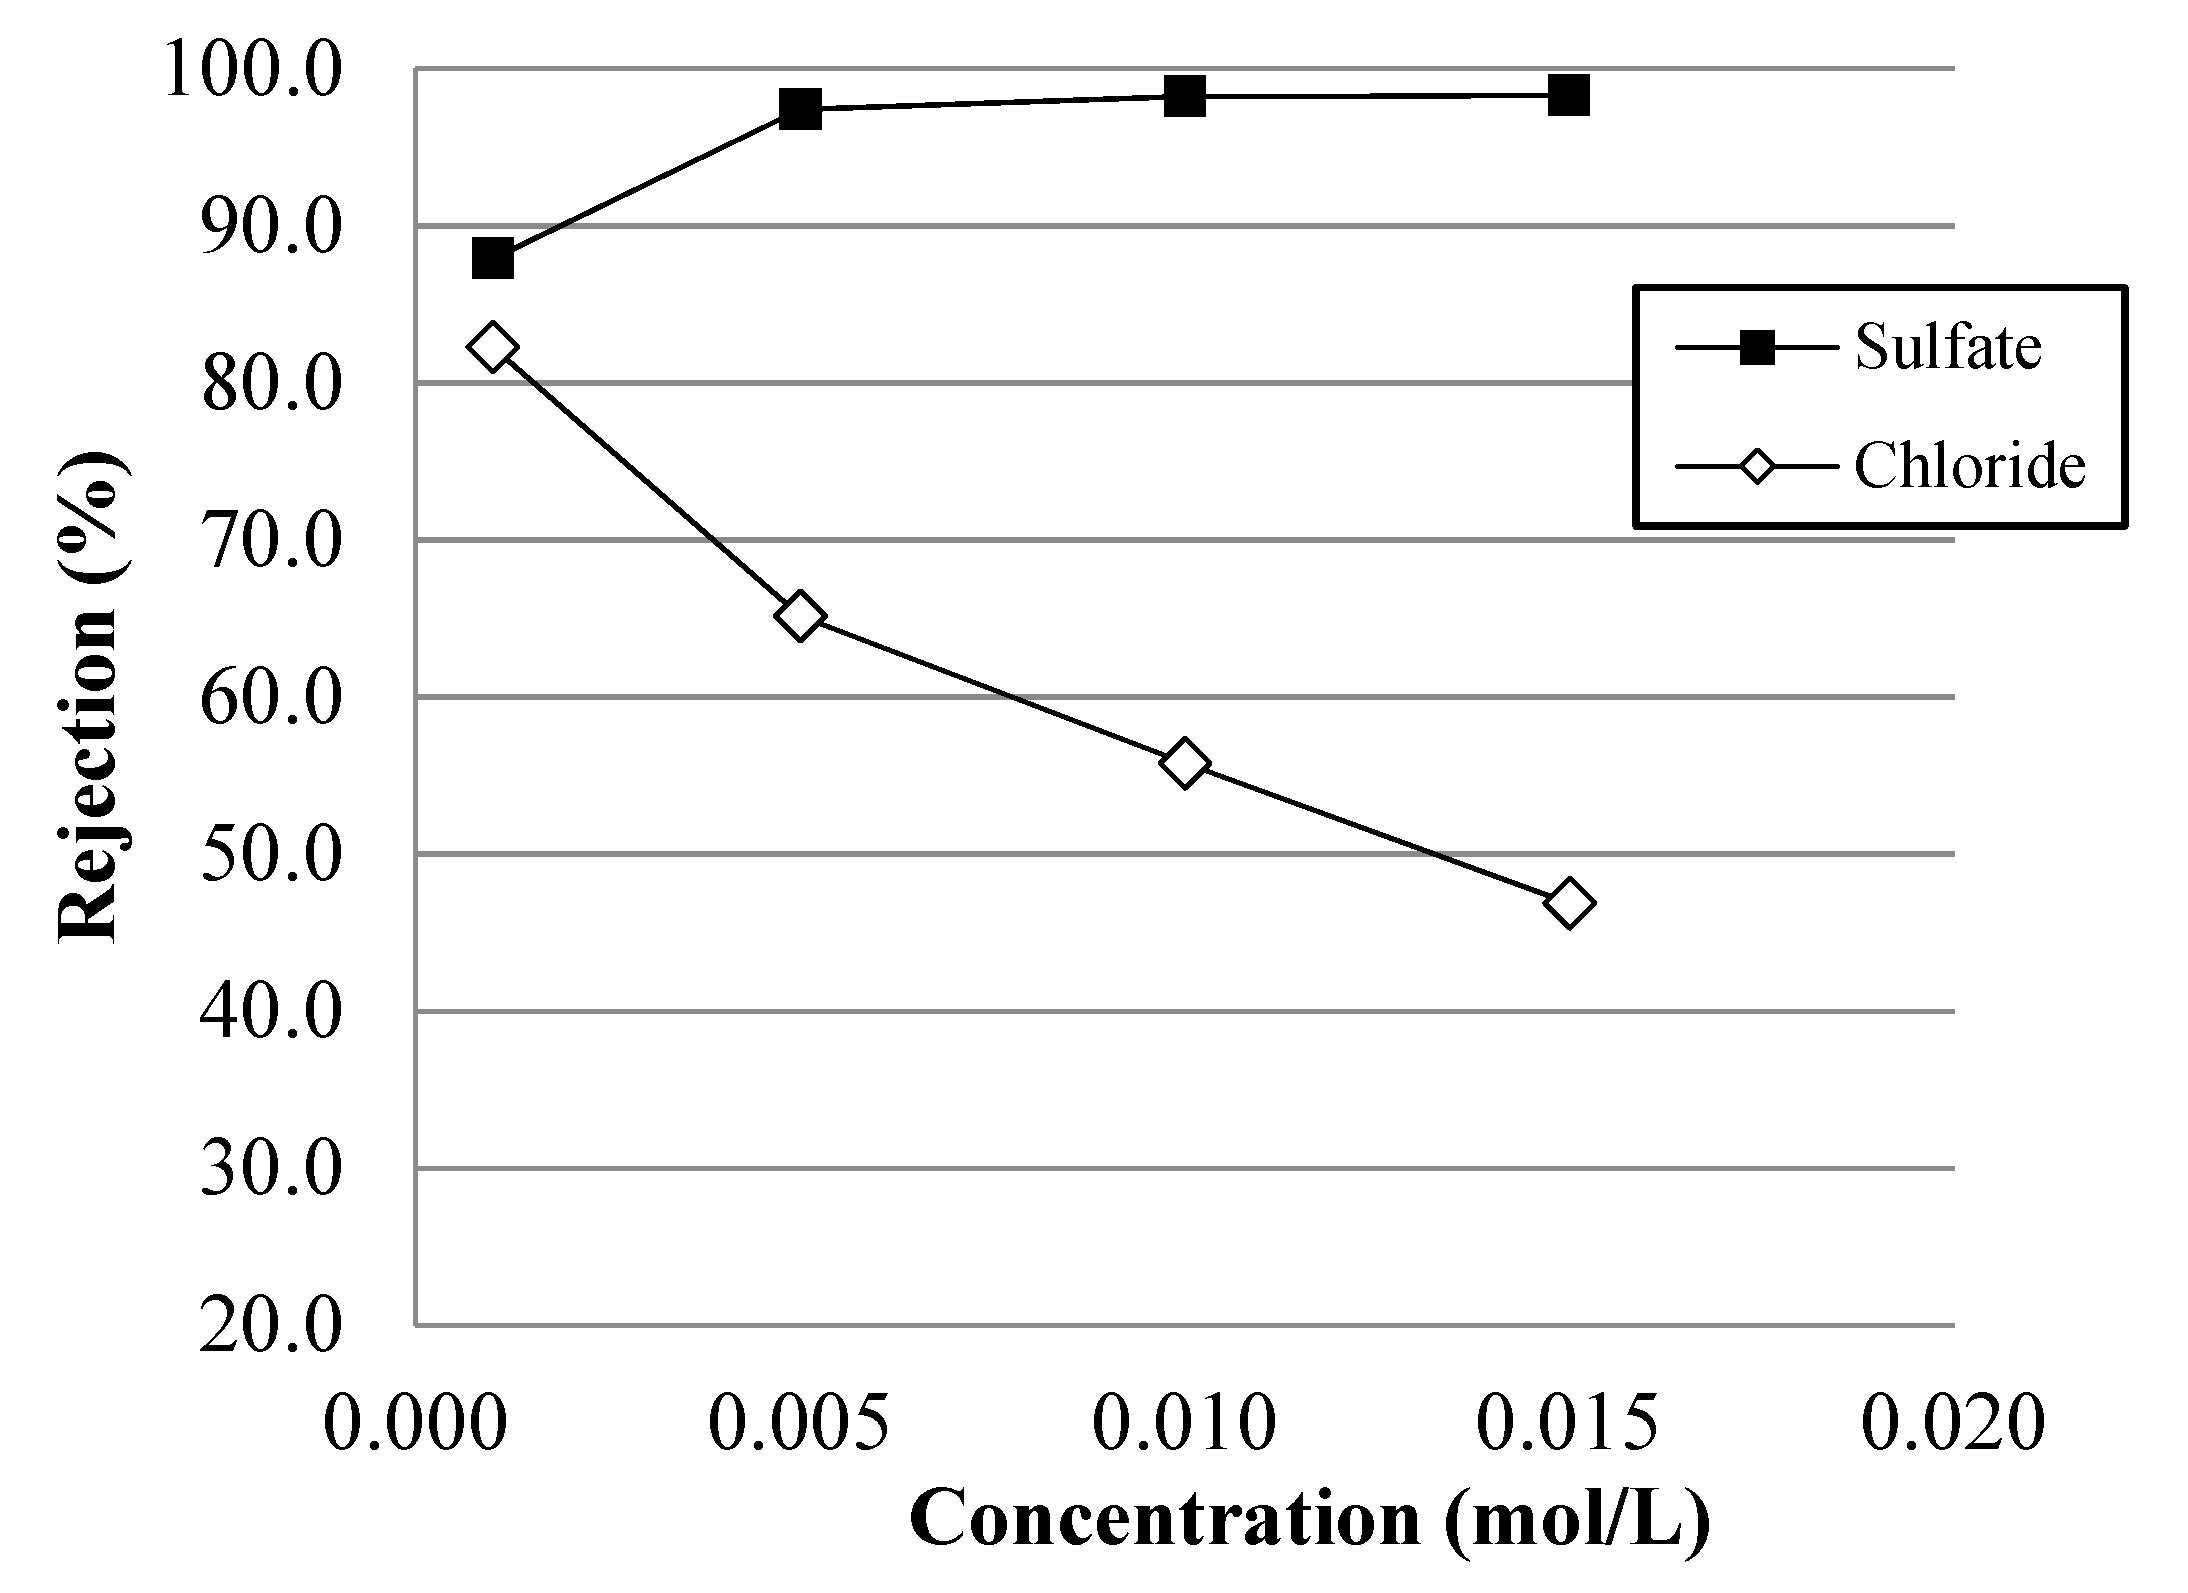
4.3. NF Performance in Mixed-Salt Solutions

Due to the complexity of real acid mine drainage solutions, assessing the membrane performance during AMD filtration is precarious. The complexities arise from the interaction between the membrane surface and the ions in the bulk solution. In addition, the solution chemistry of the bulk solution may change the membrane properties, resulting in different performance as previously tested in single salt solutions. In order to better understand how the membrane behaves in a more complex solution, three different mixed salt solutions were prepared as shown in Table 2.
Chloride rejection (Figure 4) was obtained by performing a charge balance (∑ Charge of Cations = ∑ Charge of Anions) on both the feed and permeate side while taking into account the speciation of sulfate at pH lower than 3. At pH 2, it can be expected that the co-ions, H+, coupled with either Cl or SO42− counter ions to pass through the membrane as HCl and H2SO4, while Na+ remains in the feed side. At relatively low concentrations of H+, within the range of pH 5 to 7, Na+ rejection (Figure 4) remained high and almost constant.
A slight decrease in permeate pH was observed for a feed range of pH 5 to 7 (Figure 5). This may be due to the increased rejection of the trace amounts of OH brought about by the more negatively charged membrane at higher pH.
For single salt sodium silicate solution at pH 7, uncharged H2SiO3 was the dominant silicate species in the solution and HSiO3 was present in trace amounts. Size exclusion was the main rejection mechanism for silicate, thus accounting for the low rejection value of 52.42% (Figure 6). When magnesium sulfate was introduced into the single salt sodium silicate solution, silicate rejection fell further to 38.56%. This was due to the effect of charge shielding by Mg2+ on the negatively charged membrane. HSiO3 was rejected to a lesser extent. Similarly, magnesium sulfate rejection falls in a mixed salt solution due to the shielding effect of the negatively charged membrane by Na+ ions.
At pH 7, Membrane A is negatively charged. At this pH value, rejection of sulfate is greater than the chloride due to stronger electrostatic repulsion (higher valency in SO42− vs. Cl), thus resulting in a system behavior influenced by the Donnan effect related phenomenon, occurring due to preferential rejection of divalent compared to monovalent ions. Passage of Cl is more prominent at higher salt concentrations due to the screening effect brought about by increasing Na+ concentrations. The presence of Na+ shields the negative charge on the membrane surface, thus causing a decreased Cl rejection. Due to its higher valency and larger size, the rejection of sulfate was high for all tested concentrations and was less dependent on the membrane charge (see Figure 7).

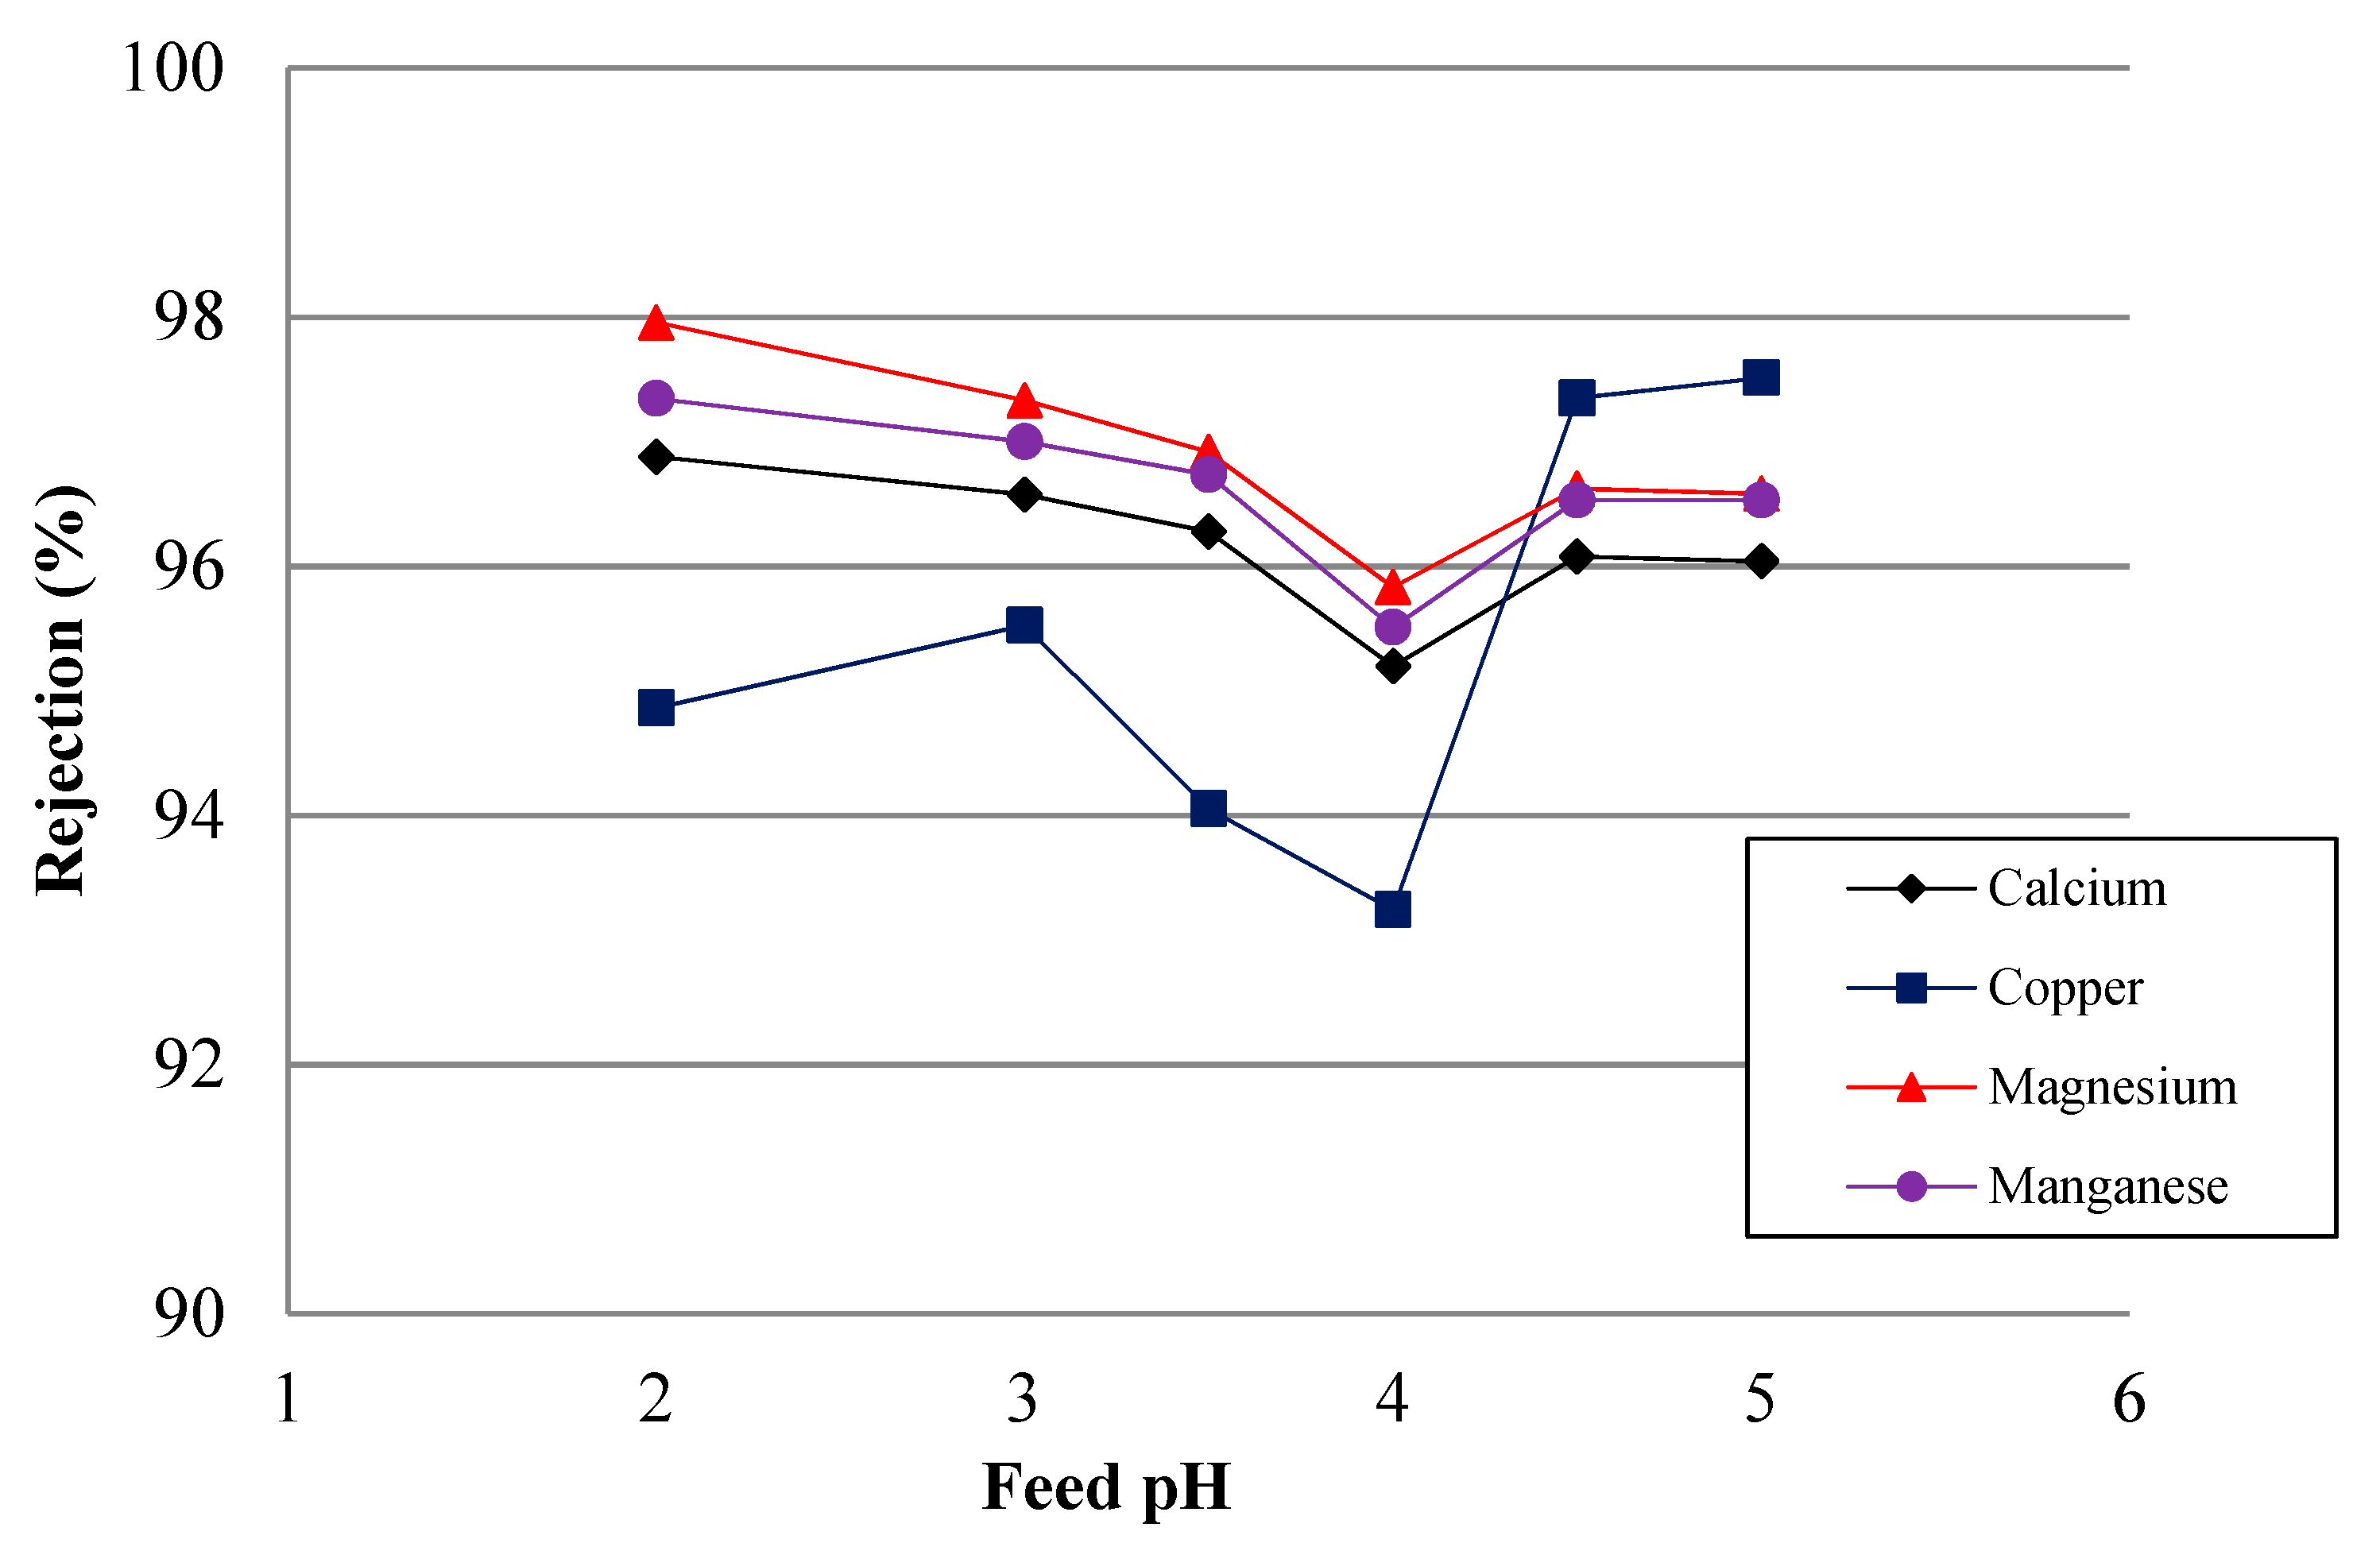
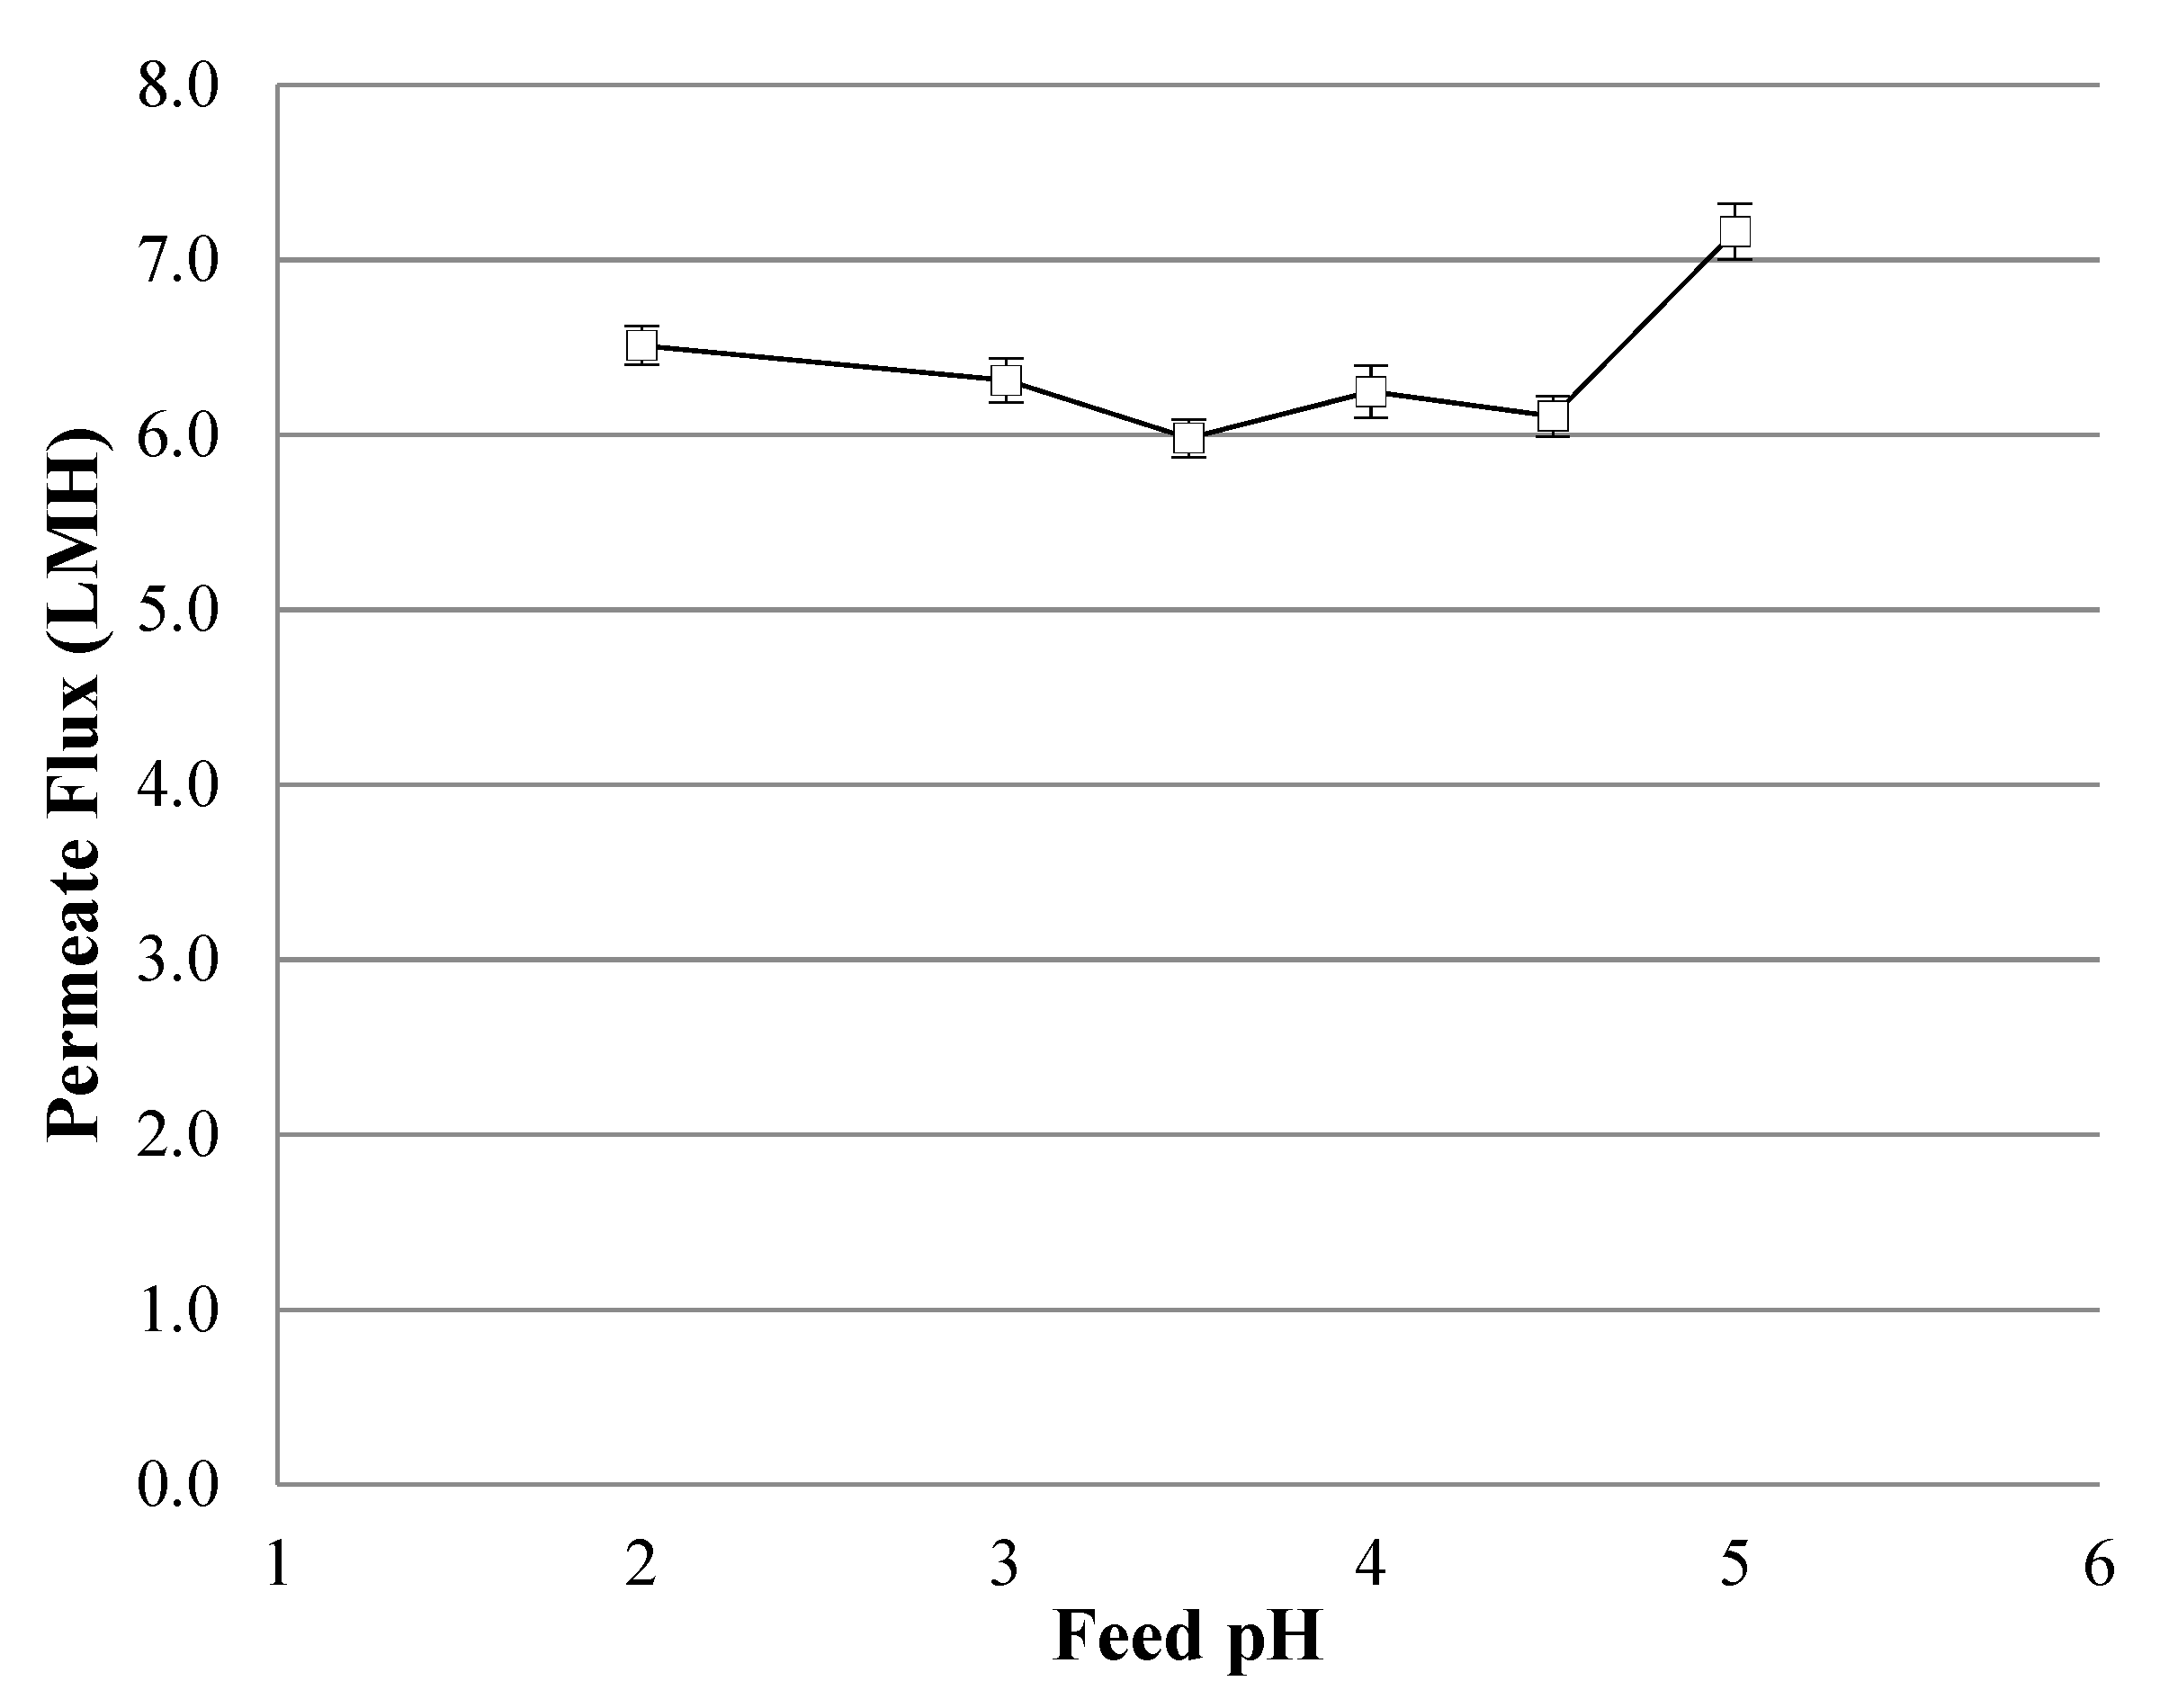
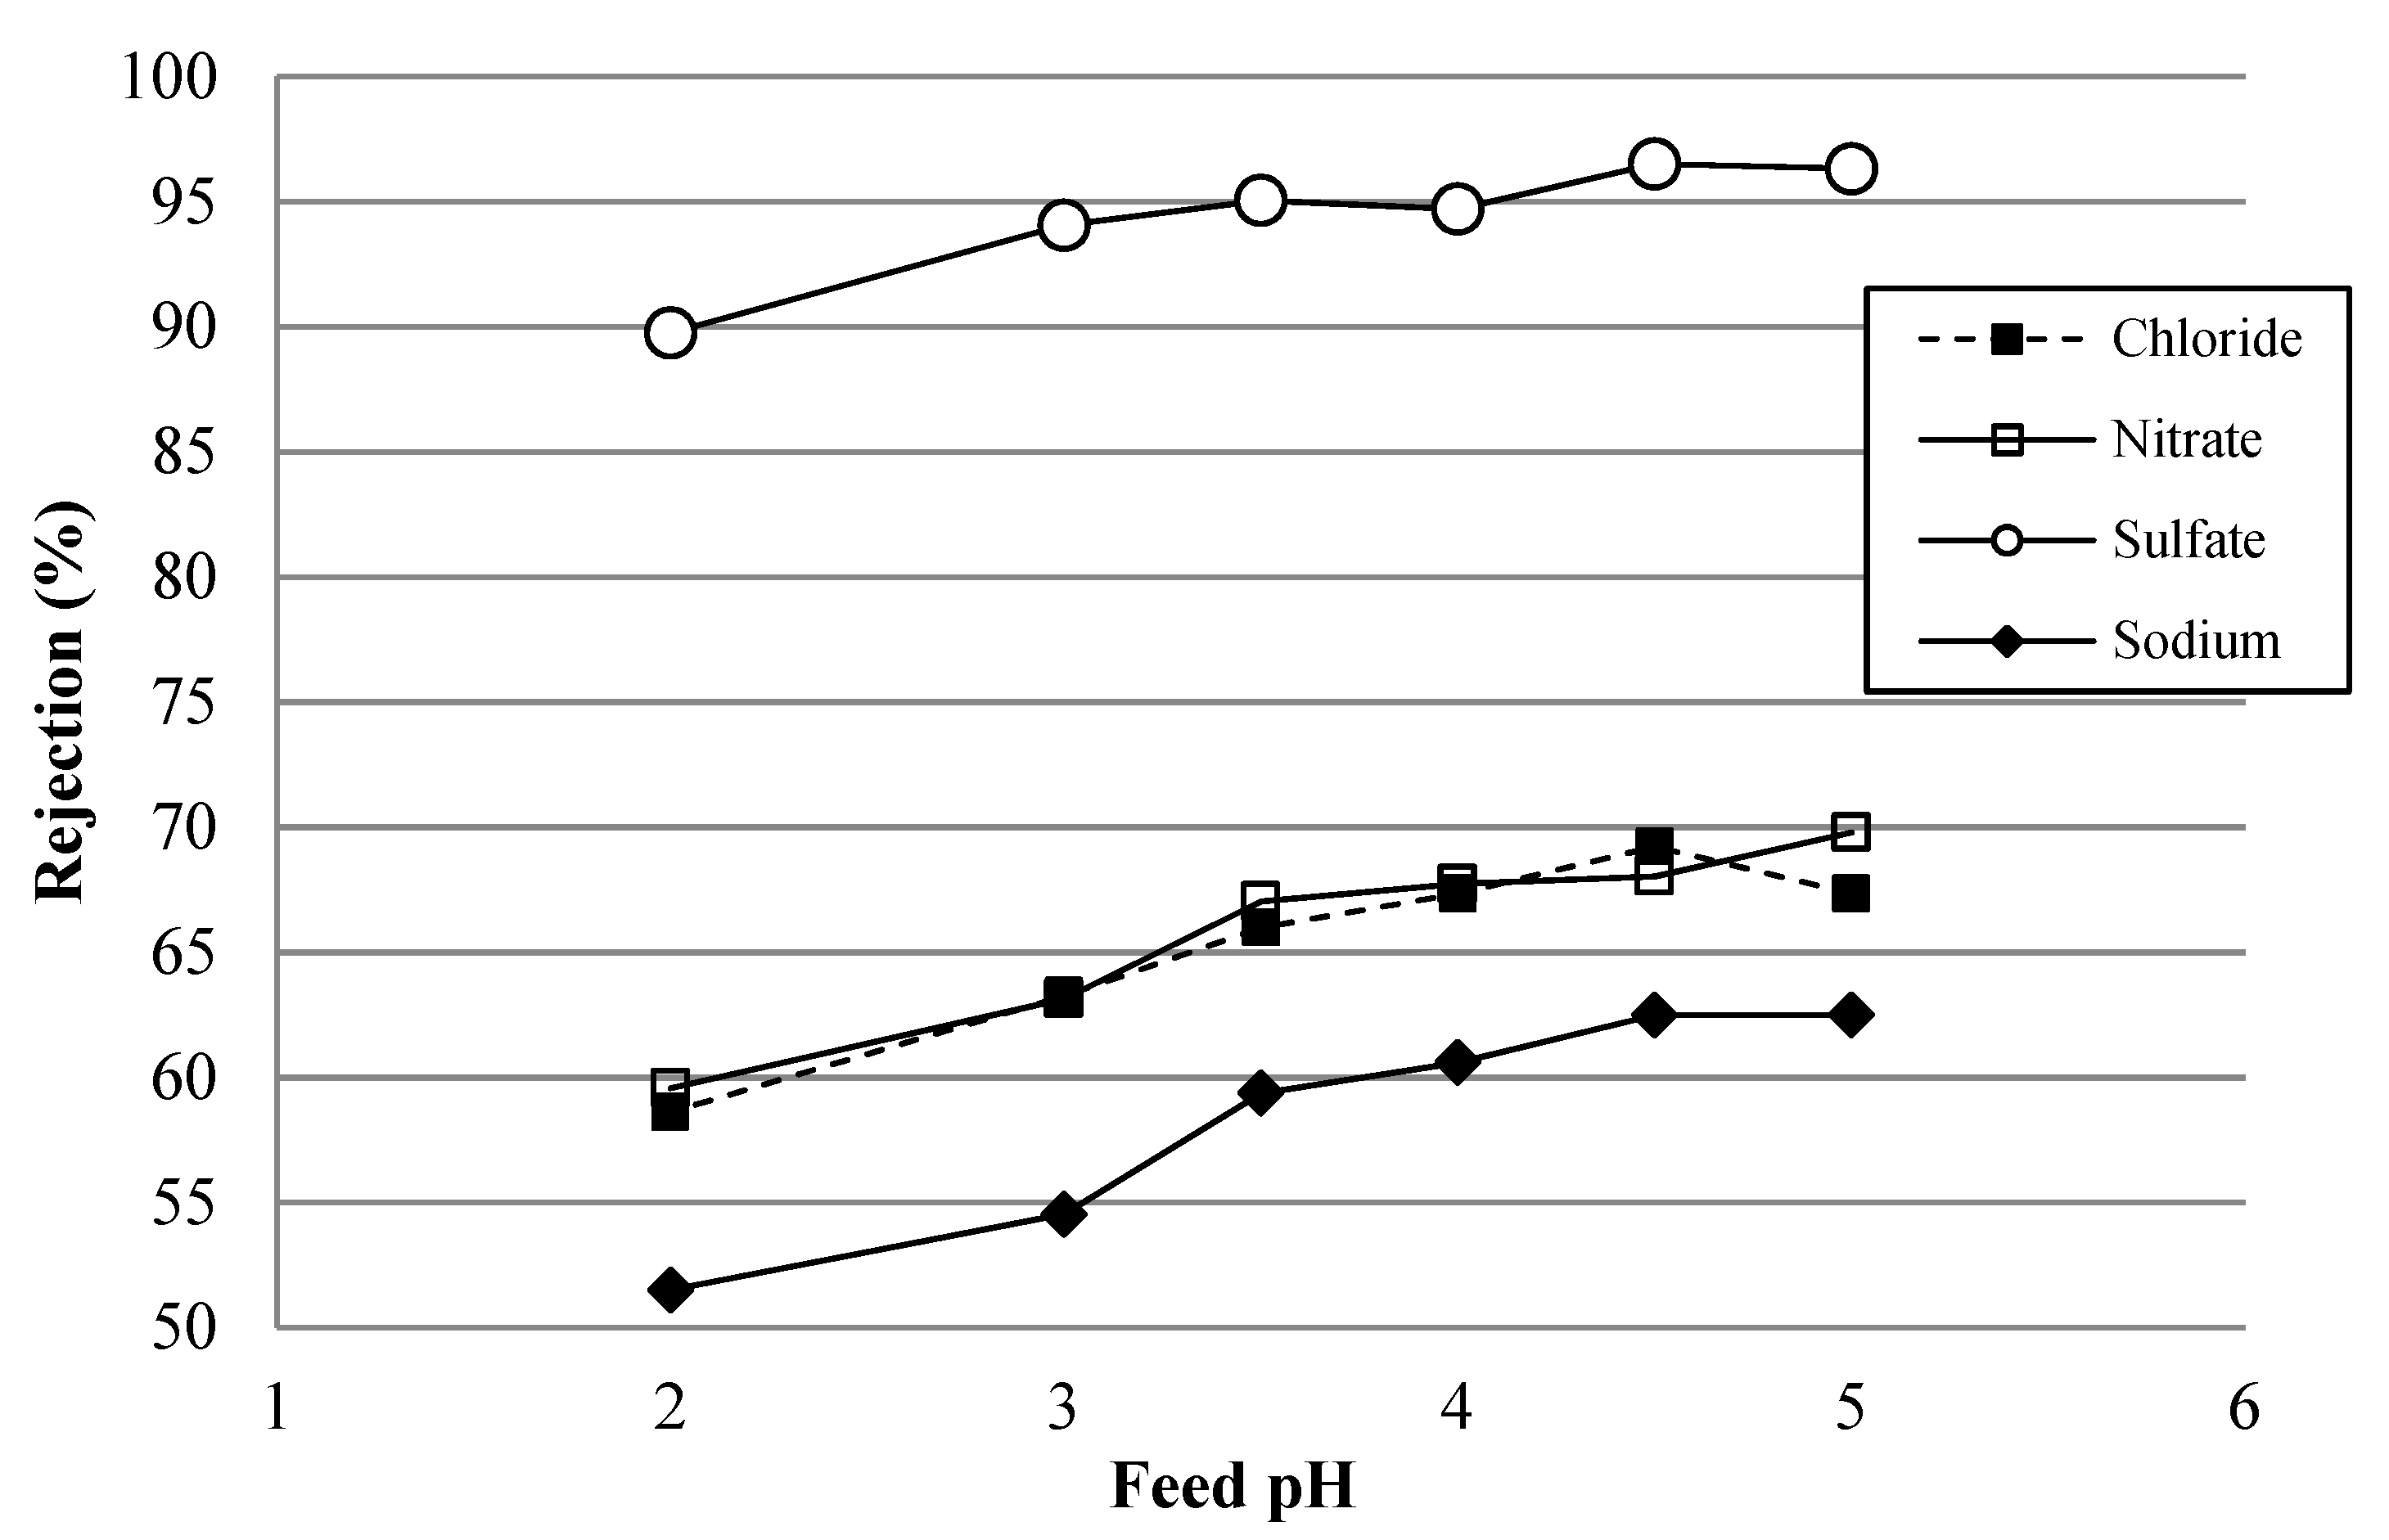
4.4. Simulated AMD Solutions

In the simulated AMD solution, rejection minima were observed at pH 4 (Figure 8). This value is close to the IEP of Membrane A for which the net charge of the membrane approaches zero. At the IEP, size exclusion is the remaining rejection mechanism, therefore, an increased passage of metal ions is registered. The observed rejection minimum (at pH = 4.0) was lower than the IEP obtained from the zeta potential measurement at membrane IEP of pH 4.5–4.7. The observed shift of minimal rejection can be attributed to the fact that the IEP measurements are dependent on the solution chemistry that the membrane is exposed to. Thus, the observed difference in the IEP for the model AMD solution may be due to the adsorption of divalent sulfate anions present in the solution onto the membrane.
With the exception of copper, metal ions rejection increased with decreasing pH due to stronger electrostatic repulsion brought about by a more positively charged membrane. An opposite trend was observed for copper, for which rejection increases with increasing pH. This is possibly due to the appearance of a negatively charged copper complexes, such as Cu(OH)3−, which become increasingly rejected by the more negatively charged membrane with increasing pH. The permeate flux (shown in Figure 9) remains relatively constant throughout the tested pH range. The permeate pH values were lower than the feed pH ones, especially for feed pH lower than 4 as H+ couples with anions and passes through the membrane.
Sodium rejection was lower than that for the larger size divalent cations. In general, sodium rejection increases with increasing solution pH (a more negatively charged membrane). As seen can be in Figure 10, at higher pH, sodium rejection displays a higher rejection value as accompanying divalent anions (SO42−) are highly rejected. However, sodium rejection was lower than expected. This may possibly be due to the permeation of sodium cations with monovalent anions (nitrate and chloride). The anions rejection increases with increasing pH due to a stronger electrostatic repulsion from the negative membrane. Due to their monovalent nature and smaller size, nitrate and chloride expectedly showed lower rejection values than those for sulfate.
While not substituting the necessity of performing validation tests using real acid mine drainage water in a defined case, the results obtained with the simulated AMD solutions can be used as a fast and preliminary evaluation tool of expected performance of the membrane in nanofiltration of real water with a known ionic composition and pH.

5. Conclusions

Rejection of ions in single salt solutions were found to be pH-dependent. Owing to their large size, all-metal cations (Mg, Cu, and Mn) were highly rejected (97% and above) within the tested pH range. Below the membrane IEP, cation rejection increased slightly as a result of stronger electrostatic repulsion between the cations (co-ions) and the positively-charged membrane (e.g., the rejection increased from 97% at pH 5 to 99% at pH 2).
The speciation of divalent sulfate to monovalent bisulfate at pH 3 and below accounted for the sharp fall in overall sulfate rejection. Notably, sulfate rejection fell from 99% at pH 4 to 84% at pH 2. The effect of sulfate speciation on rejection was more pronounced under conditions of a weaker membrane charge shielding at lower ionic strength.
In general, the rejection of ions in mixed salt solutions were lower compared to the rejection of single salt solutions mainly due to the effect of membrane charge shielding at increased ionic strength. For a sodium silicate solution, silicate rejection fell from 52% to 38% when magnesium sulfate was added to the feed solution. Donnan effects were more prominent at higher salt concentrations. Rejection of monovalent co-ion (chloride) decreased with increasing concentration of an accompanying divalent co-ion (sulfate).
For the model AMD solution, a minimal rejection was observed at pH 4. The shift in IEP from 4.5 to 4.0 was most probably due to divalent anion adsorption at the relatively higher ionic strength of the solution. Copper showed an interesting trend of increasing rejection with increasing pH most probably attributed to the formation of a negatively charged complex formation, while other metal cations displayed rejection values in the opposite direction.

Author Contributions

Conceptualization, K.L.Z. and S.V.; methodology, K.L.Z. and S.V.; validation, Y.W.S., K.L.Z. and S.V.; formal analysis, Y.W.S.; investigation, Y.W.S; resources, K.L.Z.; data curation, Y.W.S.; writing—original draft preparation, Y.W.S; writing—review and editing, S.V and K.L.Z.; visualization, Y.W.S.; supervision, K.L.Z. and S.V.; project administration, K.L.Z.; funding acquisition, K.L.Z. All authors have read and agreed to the published version of the manuscript.

Funding

The authors would like to thank LANXESS-IAB Ionenaustauscher GmbH (Bitterfeld, Germany) for financial support. Ye Wee Siew acknowledges his scholarship grant provided by the European Commission—Education, Audiovisual, and Culture Executive Agency (EACEA), under the program: Erasmus Mundus Master in Membrane Engineering–EM3E (FPA No 2011e0168, Ed. I, http://em3e-4sw.eu).

Conflicts of Interest

The authors declare no conflict of interest.

Appendix A. Supporting Information

Concentration Polarization

Concentration polarization was deliberately provoked in the coupon tester by lowering the cross flow rate from 4.0 L/min to 0.5 L/min at two different conditions (Table A1). Apparent rejection (Equation (5)) and salt passage were the membrane performance parameters evaluated in these experiments. Salt passage is defined as the ratio of the concentration of salt on the permeate relative to the feed side as:
S P = C p C f = 1 R .
Feed and permeate concentrations were determined using conductivity vs. concentration calibration curves.
For both experiments, the salt passage (Figure A1 and Figure A2) increased slightly when the cross flow rate was decreased from 2.0 L/min to 0.5 L/min. Above 2.0 L/min, salt passage remained relatively constant for both cases. This shows that concentration polarization occurs only at a low cross flow rate due to decreased tangential shear stress on the membrane surface. Thus, concentration polarization effects in the coupon tester for this study can be assumed to be negligible as they were all performed at cross flow rate of 4 L/min.
Table A1. Concentration polarization experiments operating conditions.
Temperature (°C)Feed Concentration (mg/L)Feed Pressure (Bar)
25 ± 0.52000 ± 100 of MgSO410 ± 0.1
8000 ± 200 of MgSO425 ± 0.1
Figure A1. (a) Graph of rejection as a function of the cross flow rate (Operating Conditions: 2000 mg/L MgSO4, pH 7, 25 °C, and 10 bar). (b) Graph of salt passage as a function of the cross flow rate (Operating Conditions: 2000 mg/L MgSO4, pH 7, 25 °C, and 10 bar).
Applsci 10 00400 g0a1aApplsci 10 00400 g0a1b
Figure A2. (a) Graph of rejection as a function of the cross flow rate (Operating Conditions: 8000 mg/L MgSO4, pH 7, 25 °C, and 25 bar). (b) Graph of salt passage as a function of cross flow rate (Operating Conditions: 8000 mg/L MgSO4, pH 7, 25 °C, and 25 bar).
Applsci 10 00400 g0a2

Appendix B. Symbols and Nomenclature

SymbolsParameterUnits
RappApparent rejection %
cpConcentration of solute on the permeate sidemg·L−1
cfConcentration of solute on the feed sidemg·L−1
ΠOsmotic pressure bar
iDimensionless van’t Hoff factor-
MMolaritymol·L−1
RIdeal gas constantL bar K−1 mol−1
TTemperatureK
tTimeh
ΔΠOsmotic pressure differencebar
ΠfFeed osmotic pressure bar
ΠpPermeate osmotic pressure bar
JvPermeate fluxL·m−2·h−1
AWater permeability coefficientL·m−2·h−1 bar−1
ΔPApplied pressurebar
VpPermeate volumem3
AmMembrane aream2

References

  1. Akcil, A.; Koldas, S. Acid Mine Drainage (AMD): Causes, treatment and case studies. J. Clean. Prod. 2006, 14, 1139–1145. [Google Scholar] [CrossRef]
  2. Simate, G.S.; Ndlovu, S. Acid mine drainage: Challenges and opportunities. J. Environ. Chem. Eng. 2014, 2, 1785–1803. [Google Scholar]
  3. Johnson, D.B.; Hallberg, K.B. Acid mine drainage remediation options: A review. Sci. Total Environ. 2005, 338, 3–14. [Google Scholar] [CrossRef]
  4. Gitari, M.W.; Petrik, L.F.; Etchebers, O.; Key, D.L.; Iwuoha, E.; Okujeni, C. Treatment of Acid Mine Drainage with Fly Ash: Removal of Major Contaminants and Trace Elements. J. Environ. Sci. Heal. Part A 2006, 41, 1729–1747. [Google Scholar] [CrossRef]
  5. Younger, P.L.; Banwart, S.A.; Hedin, R.S. Mine Water: Hydrology, Pollution, Remediation; Kluwer Academic Publishers: Dordrecht, The Netherlands, 2002; Volume 9. [Google Scholar]
  6. Al-Zoubi, H.; Rieger, A.; Steinberger, P.; Pelz, W.; Haseneder, R.; Härtel, G. Optimization Study for Treatment of Acid Mine Drainage Using Membrane Technology. Sep. Sci. Technol. 2010, 45, 2004–2016. [Google Scholar] [CrossRef]
  7. Watten, B.J.; Sibrell, P.L.; Schwartz, M.F. Acid neutralization within limestone sand reactors receiving coal mine drainage. Environ. Pollut. 2005, 137, 295–304. [Google Scholar] [CrossRef] [PubMed] [Green Version]
  8. Al-Zoubi, H.; Rieger, A.; Steinberger, P.; Pelz, W.; Haseneder, R.; Härtel, G. Nanofiltration of Acid Mine Drainage. Desalin. Water Treat. 2010, 21, 148–161. [Google Scholar] [CrossRef]
  9. Sheoran, A.; Sheoran, V.; Choudhary, R. Bioremediation of acid-rock drainage by sulphate-reducing prokaryotes: A review. Miner. Eng. 2010, 23, 1073–1100. [Google Scholar] [CrossRef]
  10. Da̧browski, A.; Hubicki, Z.; Podkościelny, P.; Robens, E. Selective removal of the heavy metal ions from waters and industrial wastewaters by ion-exchange method. Chemosphere 2004, 56, 91–106. [Google Scholar] [CrossRef]
  11. Nodwell, M.; Kratochvil, D. Sulphide Precipitation and Ion Exchange Technologies to Treat Acid Mine Drainage. In Proceedings of the 9th International Conference on Acid Rock Drainage, Ottawa, ON, Canada, 20–26 May 2012. [Google Scholar]
  12. López, J.; Reig, M.; Gibert, O.; Cortina, J. Integration of nanofiltration membranes in recovery options of rare earth elements from acidic mine waters. J. Clean. Prod. 2019, 210, 1249–1260. [Google Scholar] [CrossRef]
  13. Rieger, A.; Steinberger, P.; Pelz, W.; Haseneder, R.; Härtel, G. Mine water treatment by membrane filtration processes-Experimental investigations on applicability. Desalin. Water Treat. 2009, 6, 54–60. [Google Scholar] [CrossRef]
  14. Mullett, M.; Fornarelli, R.; Ralph, D. Nanofiltration of Mine Water: Impact of Feed pH and Membrane Charge on Resource Recovery and Water Discharge. Membranes 2014, 4, 163–180. [Google Scholar] [CrossRef] [PubMed]
  15. Hagmeyer, G.; Gimbel, R. Modelling the rejection of nanofiltration membranes using zeta potential measurements. Sep. Purif. Technol. 1999, 15, 19–30. [Google Scholar] [CrossRef]
  16. Ferreira Esmi, C.; Schrive, L.; Barre, Y.; Palmeri, J.; Deratani, A. Using nanofiltration in a zero-rejection process: The removal of Ni 2+ and Co 2+ from salty wastewater. Desalin. Water Treat. 2013, 51, 476–484. [Google Scholar] [CrossRef]
  17. Mänttäri, M.; Pihlajamäki, A.; Nyström, M. Effect of pH on hydrophilicity and charge and their effect on the filtration efficiency of NF membranes at different pH. J. Membr. Sci. 2006, 280, 311–320. [Google Scholar] [CrossRef]
  18. Tang, B.; Huo, Z.; Wu, P. Study on a novel polyester composite nanofiltration membrane by interfacial polymerization of triethanolamine (TEOA) and trimesoyl chloride (TMC). J. Membr. Sci. 2008, 320, 198–205. [Google Scholar] [CrossRef]
  19. Lianchao, L.; Baoguo, W.; Huimin, T.; Tianlu, C.; Jiping, X. A novel nanofiltration membrane prepared with PAMAM and TMC by in situ interfacial polymerization on PEK-C ultrafiltration membrane. J. Membr. Sci. 2006, 269, 84–93. [Google Scholar] [CrossRef]
  20. Werner, C.; Körber, H.; Zimmermann, R.; Dukhin, S.; Jacobasch, H.-J. Extended electrokinetic characterization of flat solid surfaces. J. Colloid Interface Sci. 1998, 208, 329–436. [Google Scholar] [CrossRef]
  21. Zimmermann, R.; Dukhin, S.; Werner, C. Electrokinetic measurements reveal interfacial charge at polymer films caused by simple electrolyte ions. J. Phys. Chem. B 2001, 105, 8544–8549. [Google Scholar] [CrossRef]
  22. Bellmann, C.; Klinger, C.; Opfermann, A.; Böhme, F.; Adler, H.-J.P. Evaluation of surface modification by electrokinetic measurements. Prog. Org. Coat. 2002, 44, 93–98. [Google Scholar] [CrossRef]
  23. Cadotte, J.; Forester, R.; Kim, M.; Peterson, R.; Stocker, T. Nanofiltration membranes broaden the use of membrane separation technology. Desalination 1988, 70, 77–88. [Google Scholar] [CrossRef]
  24. Childress, A.E.; Elimelech, M. Relating nanofiltration membrane performance to membrane charge (electrokinetik) characteristics. Environ. Sci. Technol. 2000, 34, 3710–3716. [Google Scholar] [CrossRef]
  25. Luo, J.; Wan, Y. Effects of pH and salt on nanofiltration—A critical review. J. Membr. Sci. 2013, 438, 18–28. [Google Scholar] [CrossRef]
  26. Childress, A.E.; Elimelech, M. Effect of solution chemistry on the surface charge of polymeric reverse osmosis and nanofiltration membranes. J. Membr. Sci. 1996, 119, 253–268. [Google Scholar] [CrossRef]
  27. Hoang, T.; Stevens, G.; Kentish, S. The effect of feed pH on the performance of a reverse osmosis membrane. Desalination 2010, 261, 99–103. [Google Scholar] [CrossRef]
  28. Szymczyk, A.; Fievet, P.; Bandini, S. On the amphoteric behavior of Desal DK nanofiltration membranes at low salt concentrations. J. Membr. Sci. 2010, 355, 60–68. [Google Scholar] [CrossRef]
  29. Lopez, J.; Reig, M.; Gibert, O.; Valderrama, C.; Cortina, J. Evaluation of NF membranes as treatment technology of acid mine drainage: Metals and sulfate removal. Desalination 2018, 440, 122–134. [Google Scholar] [CrossRef]
  30. Ku, Y.; Chen, S.; Wang, W. Effect of solution composition on the removal of copper ions by nanofiltration. Sep. Purif. Technol. 2005, 43, 135–142. [Google Scholar] [CrossRef]
  31. Al-Rashdi, B.; Johnson, D.; Hilal, N. Removal of heavy metal ions by nanofiltration. Desalination 2013, 315, 2–17. [Google Scholar] [CrossRef]
  32. Donnan, F.G. Theory of membrane equilibria and membrane potentials in the presence of non-dialysing electrolytes. A contribution to physical-chemical physiology. J. Membr. Sci. 1995, 100, 45–55. [Google Scholar] [CrossRef]
  33. Mazlan, J.; Myneni, S.C.B. Speciation of iron and sulfate in acid waters: Aqueous clusters to mineral precipitates. Environ. Sci. Technol. 2005, 39, 188–194. [Google Scholar] [CrossRef] [PubMed]
  34. Visser, T.; Modise, S.; Krieg, H.; Keizer, K. The removal of acid sulphate pollution by nanofiltration. Desalination 2001, 140, 79–86. [Google Scholar] [CrossRef]
Figure 1. Cross flow nanofiltration setup.
Applsci 10 00400 g001
Figure 2. Graph of zeta potential of Membrane A as a function of pH.
Applsci 10 00400 g002
Figure 3. (a) Effect of feed pH on magnesium rejection (open symbol) and permeate flux (closed symbol). (Experimental conditions: MgSO4 = 4000 mg/L, feed pressure = 10 bar, T = 25 °C). (b) Effect of feed pH on copper rejection (open symbol) and permeate flux (closed symbol) (Experimental conditions: CuSO4 = 100 mg/L, feed pressure = 10 bar, T = 25 °C). (c) Effect of feed pH on apparent manganese rejection (open symbol) and permeate flux (closed symbol). (Experimental conditions: Mn(NO3)2 = 165 mg/L, feed pressure = 10 bar, T = 25 °C). (d) Effect of feed pH on apparent sulfate rejection. Feed solution containing 4000 mg/L MgSO4 (full line) and 100 mg/L CuSO4 (dotted line). (Experimental conditions: feed pressure = 10 bar, T = 25 °C).
Applsci 10 00400 g003aApplsci 10 00400 g003b
Figure 4. Apparent sulfur rejection (dashed line) sodium rejection (full line) and chloride rejection (dotted line) as a function of pH for Na2SO4 and NaCl mixed salt solution. Experimental conditions: feed pressure = 10 bar, T = 25 °C. Concentrations of Na2SO4 and NaCl = 2000 mg/L and 700 mg/L, respectively.
Applsci 10 00400 g004
Figure 5. Permeate pH as a function of feed pH for Na2SO4 and NaCl mixed salt solution.
Applsci 10 00400 g005
Figure 6. Magnesium sulfate (grey) and sodium nitrate apparent rejection (white) in the single (S) and mixed (M) solutions. Experimental conditions: feed pressure = 10 bar, 25 °C.
Applsci 10 00400 g006
Figure 7. Effect of salt concentration on apparent sulfate and chloride rejection. Experimental conditions: feed pressure = 10 bar, 25 °C.
Applsci 10 00400 g007
Figure 8. Apparent metal species rejection as a function of feed pH.
Applsci 10 00400 g008
Figure 9. AMD permeate flux as a function of feed pH.
Applsci 10 00400 g009
Figure 10. Apparent species rejection as a function of feed pH.
Applsci 10 00400 g010
Table 1. Single salt solution feed compositions.
SaltConcentrationpH
MgSO44000 ± 100 mg/L MgSO42.0–7.0 ± 0.1
CuSO4100 ± 10 mg/L Cu2.0–5.4 ± 0.1
Mn(NO3)2165 ± 5 mg/L Mn2.0–5.1 ± 0.1
Table 2. Mixed salt solution feed compositions.
SaltConcentrationpH
NaSO4 and NaCl2000 ± 200 mg/L Na2SO4 and 700 ± 50 mg/L NaCl2.0–7.0 ± 0.1
NaSO4 and NaCl0.001 ± 0.0001 mol/L Na2SO4 and 0.001 ± 0.0005 mol/L NaCl7.0 ± 0.1
0.005 ± 0.0002 mol/L Na2SO4 and 0.005 ± 0.0017 mol/L NaCl
0.010 ± 0.0013 mol/L Na2SO4 and 0.010 ± 0.003 mol/L NaCl
0.015 ± 0.0004 mol/L Na2SO4 and 0.015 ± 0.0037 mol/L NaCl
Na2SiO3 and MgSO415 ± 1 mg/L Si and 2000 mg/L MgSO47.0 ± 0.1
Table 3. Composition of mine water (MW) samples from other works and target composition for model acid mine drainage (AMD).
CompoundMullett et al. [14]Al Zoubi et al. [8]Target
Australian MW (mg/L)MW B (mg/L)MW C (mg/L)MW D (mg/L)Chilean Copper MW (mg/L)Brazilian Uranium MW (mg/L)Model AMD (mg/L)
pH4.565.504.102.60<2.50NA2.0–5.0
Calcium, Ca2+480260280270325.989.9270
Copper, Cu4104106105902298NA390
Magnesium, Mg2+770870900900630.68.842300
Manganese, Mn440420530500224.5115500
Sodium, Na+20003000380036006.891.73600
Sulfate, SO42− 6900870010,50010,20014,337150810,327
Chloride, Cl2300230030002900NA0.215559
Nitrate, NO3NANANANANANA1129
NA—Not available.
Table 4. Model AMD solution feed composition used in the present study.
IonConcentration (mg/L)pH
Calcium, Ca2+250 ± 102.0–5.0 ± 0.1
Copper, Cu370 ± 10
Magnesium, Mg2+2400 ± 100
Manganese, Mn490 ± 10
Sodium, Na+3200 ± 100
Sulfate, SO42−8700 ± 200
Chloride, Cl5000 ± 200
Nitrate, NO3930 ± 50

