Performance Analysis of Maximal Risk Evaluation Formulas for Spectrum-Based Fault Localization

 , , ,
, , ,
Abstract
1. Introduction
- For any two maximal formulas from different maximal formula groups, which one can perform better than another one more frequently?
- Is there a maximal formula group that can always perform better than other maximal formula groups more frequently?
- (1)
- We performed an empirical study to compare between any two maximal risk evaluation formulas, each from a different maximal formula group.
- (2)
- We propose using a new condition to compare between two risk evaluation formulas. This condition is different from other similar empirical and theoretical studies. We use the expected location of the “faulty” statement to compare between the formulas, whereas previous studies used the exact location for comparison.
- (3)
- We present and discuss five different scenarios that could lead to the conclusion that one maximal formula can perform better than another maximal formula more frequently using our condition. However, when using the “exact location” condition as in the previous study, these scenarios could not be easily discovered or discussed.
2. Background
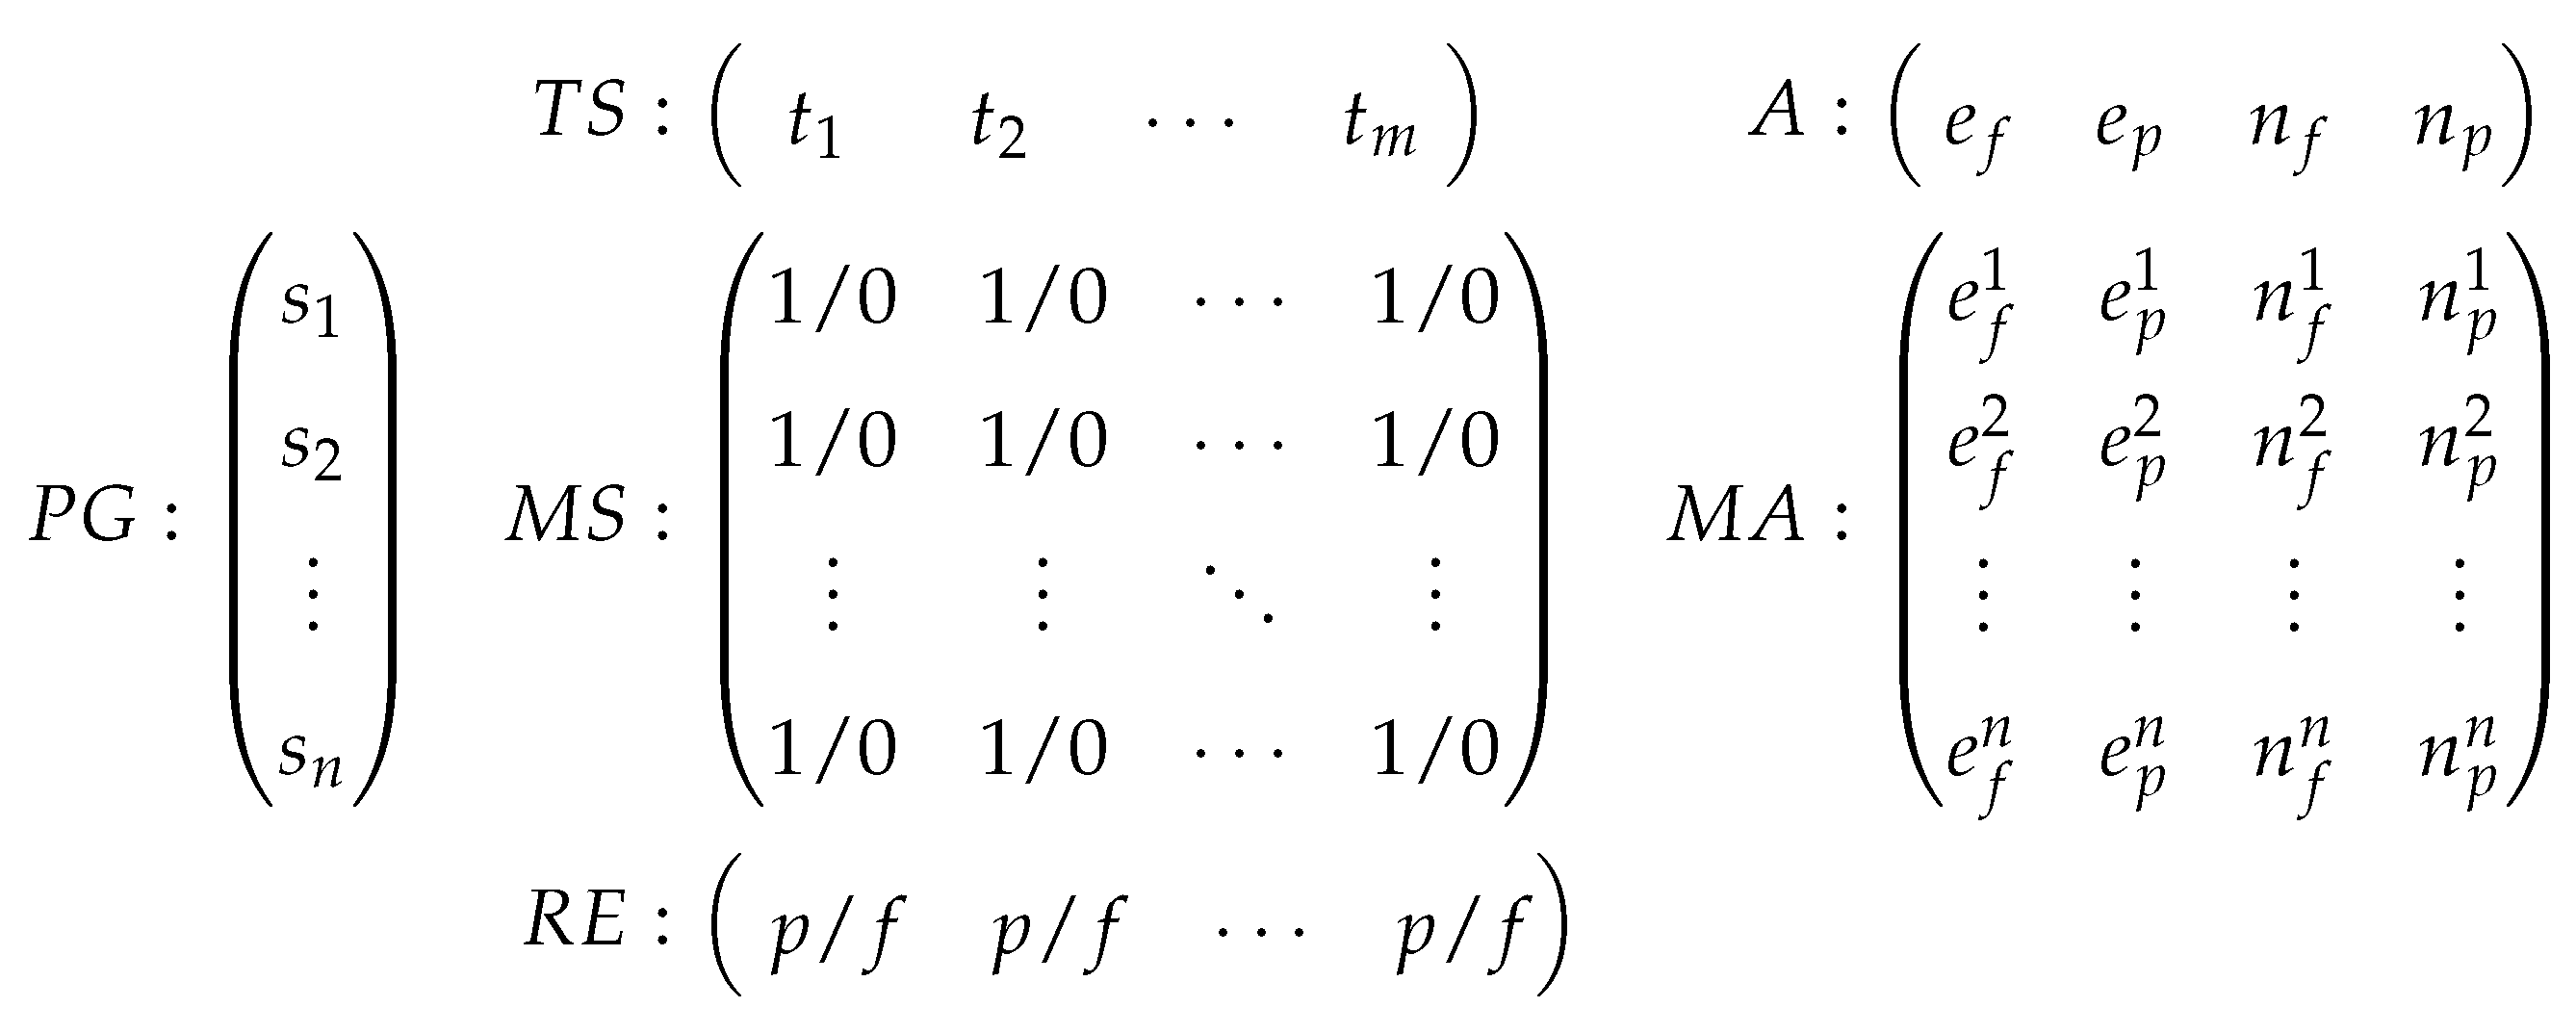
2.1. Spectrum-Based Fault Localization (SBFL)
2.2. Risk Evaluation Formulas
3. A Condition with Which to Compare Risk Evaluation Formulas
3.1. Comparing Two Risk Evaluation Formulas
3.2. Five Scenarios for One Formula Better Than Another
- : When and , we have .
- : When and , we have .
- : When , and , it is obvious that .
- : When and , we have .
- : When , and , it is obvious that .
4. Empirical Study
4.1. Subject Programs and Test Suite
- Flex is an UNIX utility to generate lexical analyzer by scanning a lex file with definitions, rules, and user code contained. The generated analyzer then transforms the input stream into a sequence of tokens.
- Grep is a pattern matching engine. Given one or more patterns and some input files for searching, it outputs the lines that match one or more of the patterns.
- Sed is a stream editor to perform operations on the input stream, such as replacement, deletion, and insertion on a specific line or the global text.
- Space is an interpreter for an array definition language (ADL) to check the ADL grammar and specific consistency rules. If the ADL file is correct, space outputs an array data file; otherwise, the program outputs error messages.
- Print_tokens and print_tokens2 are two lexical parsers used to group input strings into tokens and identify the token categories. The main difference between these two programs is that print_tokens uses a hard-coded DFA, while print_tokens2 does not.
- Replace is a program of regular expression matching and substitution. It replaces any substring matched by the input regular expression with a replacement string, and outputs a new file.
- Schedule and schedule2 are used to schedule the priority in three job lists. Schedule is non-preemptive and schedule2 is preemptive.
- Tcas is used to avoid air accident by detecting on-board conflict through radar system and providing a resolution advice, such as climb, descend, or remain on the current trajectory.
- Tot_info takes a set of tables as input and outputs the Kullbacks information measure, degrees of freedom, and possibility density of a distribution for each table and the summary of the entire set.
4.2. The Empirical Process
4.3. Experimental Results and Analysis
- (1)
- N1 has a higher chance to perform better than W1, GP02, GP03, and GP19.
- For CP1, we observe that N1 has a higher chance to perform better than W1 for all programs except grep, sed, and schedule2. The percentage values of range from 33.3% to 100% with an average of 74.6%, whereas those of range from 0% to 66.7% with an average of 24.3%. Hence, we can conclude that N1 performs more-frequently-better than W1.
- Similarly, for CP2, CP3 and CP4, we can also conclude that N1 has a higher chance to perform better than GP02, GP03, and GP19, respectively. However, we have to point out an interesting observation of the N1 and GP03 pair. For N1 and GP03, the percentages of range from 0% to 80% with an average of 16.0%, whereas those of range from 0% to 40% with an average of 8.1%. In fact, N1 and GP03 have the same performance with an average of 75.9%.
- (2)
- GP03 has a higher chance to perform better than W1, GP02 and GP19.
- For CP8, GP03 has a higher chance to perform better than GP02 for all programs except flex, replace, schedule, and tcas. In fact, for replace and schedule, the chances for and that of are the same; both are 0% for schedule and 33.3% for replace. The percentage values of range from 0% to 80% with an average of 44.9%, whereas those of range from 0% to 100% with an average of 27.1%. Hence, we can conclude that GP03 performs more-frequently-better than GP02.
- Similarly, for CP6 and CP10, we can also conclude that GP03 performs more-frequently-better than W1 and GP19 since the average percentage values of and are 64.0% and 63.9% respectively.
- (3)
- GP02 has a higher chance to perform better than W1 and GP19.
- For CP5, we observe that GP02 performs more-frequently-better than W1 for all programs except grep, sed and schedule2. The percentage values of range from 0% to 100% with an average of 66.8% whereas those of range from 0% to 100% with an average of 31.4%. Hence, we can conclude that GP02 performs more-frequently-better than W1.
- Similarly, for CP9, we can also conclude that GP02 performs more-frequently-better than GP19.
- (4)
- W1 has a higher chance to perform better than GP19.
- For CP7, W1 performs more-frequently-better than GP19 for all programs except flex, grep, sed and schedule2. In fact, for flex and grep, the chances for and that of are the same; both are 40% for flex and 40% for grep. The percentage values of range from 33.3% to 100% with an average of 66.1% whereas those of range from 0% to 66.7% with an average of 27.8%. Hence, we can conclude that W1 performs more-frequently-better than GP19.
- (1)
- For CP1–CP4, N1 has a higher chance to perform better than W1, GP02, GP03, and GP19.
- (2)
- For CP8, CP6, and CP10, GP03 has a higher chance to perform better than GP02, W1, and GP19.
- (3)
- For CP5 and CP9, GP02 has a higher chance to perform better than W1 and GP19.
- (4)
- For CP7, W1 has a higher chance to perform better than GP19.
4.4. Discussion
4.5. Threats to Validity
4.5.1. Test Suite
4.5.2. Fault Type
5. Related Work
6. Conclusions and Future Work
Author Contributions
Funding
Conflicts of Interest
References
- Harrold, M.J.; Rothermel, G.; Wu, R.; Yi, L. An empirical investigation of program spectra. In Acm Sigplan Notices; ACM: New York, NY, USA, 1998; Volume 33, pp. 83–90. [Google Scholar]
- Jones, J.A.; Harrold, M.J. Empirical evaluation of the tarantula automatic fault-localization technique. In Proceedings of the 20th IEEE/ACM international Conference on Automated Software Engineering, Long Beach, CA, USA, 7–11 November 2005; pp. 273–282. [Google Scholar]
- Wong, W.E.; Gao, R.; Li, Y.; Abreu, R.; Wotawa, F. A survey on software fault localization. IEEE Trans. Softw. Eng. 2016, 42, 707–740. [Google Scholar] [CrossRef]
- Abreu, R.; Zoeteweij, P.; Van Gemund, A.J. On the accuracy of spectrum-based fault localization. In Proceedings of the Testing: Academic and Industrial Conference Practice and Research Techniques- MUTATION (TAICPART-MUTATION 2007), Windsor, UK, 10–14 September 2007; pp. 89–98. [Google Scholar]
- Chen, Y.; Probert, R.L.; Sims, D.P. Specification-based regression test selection with risk analysis. In Proceedings of the 2002 Conference of the Centre for Advanced Studies on Collaborative Research, Toronto, ON, Canada, 30 September–3 October 2002; p. 1. [Google Scholar]
- Jones, J.A.; Harrold, M.J.; Stasko, J.T. Visualization for fault localization. In Proceedings of the ICSE 2001 Workshop on Software Visualization, Toronto, ON, Canada, 13–14 May 2001. [Google Scholar]
- Abreu, R.; Zoeteweij, P.; Van Gemund, A.J. An evaluation of similarity coefficients for software fault localization. In Proceedings of the 2006 12th Pacific Rim International Symposium on Dependable Computing (PRDC’06), Riverside, CA, USA, 18–20 December 2006; pp. 39–46. [Google Scholar]
- Abreu, R.; Zoeteweij, P.; Golsteijn, R.; Van Gemund, A.J. A practical evaluation of spectrum-based fault localization. J. Syst. Softw. 2009, 82, 1780–1792. [Google Scholar] [CrossRef]
- Wong, W.E.; Qi, Y.; Zhao, L.; Cai, K.Y. Effective fault localization using code coverage. In Proceedings of the 31st Annual International Computer Software and Applications Conference (COMPSAC 2007), Beijing, China, 24–27 July 2007; Volume 1, pp. 449–456. [Google Scholar]
- Pearson, S.; Campos, J.; Just, R.; Fraser, G.; Abreu, R.; Ernst, M.D.; Pang, D.; Keller, B. Evaluating and improving fault localization. In Proceedings of the 39th International Conference on Software Engineering, Buenos Aires, Argentina, 20–28 May 2017; pp. 609–620. [Google Scholar]
- Xie, X. On the Analysis of Spectrum-Based Fault Localization. Ph.D. Thesis, Swinburne University of Technology, Melbourne, Australia, 2012. [Google Scholar]
- Lee, H.J.; Naish, L.; Ramamohanarao, K. Study of the relationship of bug consistency with respect to performance of spectra metrics. In Proceedings of the 2009 2nd IEEE International Conference on Computer Science and Information Technology, Beijing, China, 8–11 August 2009; pp. 501–508. [Google Scholar]
- Naish, L.; Lee, H.J.; Ramamohanarao, K. A model for spectra-based software diagnosis. ACM Trans. Softw. Eng. Methodol. (TOSEM) 2011, 20, 11. [Google Scholar] [CrossRef]
- Xie, X.; Chen, T.Y.; Kuo, F.C.; Xu, B. A theoretical analysis of the risk evaluation formulas for spectrum-based fault localization. ACM Trans. Softw. Eng. Methodol. (TOSEM) 2013, 22, 31. [Google Scholar] [CrossRef]
- Chen, T.Y.; Xie, X.; Kuo, F.C.; Xu, B. A revisit of a theoretical analysis on spectrum-based fault localization. In Proceedings of the 2015 IEEE 39th Annual Computer Software and Applications Conference, Taichung, Taiwan, 1–5 July 2015; Volume 1, pp. 17–22. [Google Scholar]
- Xie, X.; Kuo, F.C.; Chen, T.Y.; Yoo, S.; Harman, M. Provably optimal and human-competitive results in sbse for spectrum based fault localisation. In International Symposium on Search Based Software Engineering; Springer: Berlin, Germany, 2013; pp. 224–238. [Google Scholar]
- Yoo, S.; Xie, X.; Kuo, F.C.; Chen, T.Y.; Harman, M. Human competitiveness of genetic programming in spectrum-based fault localisation: Theoretical and empirical analysis. ACM Trans. Softw. Eng. Methodol. (TOSEM) 2017, 26, 4. [Google Scholar] [CrossRef]
- Yoo, S.; Xie, X.; Kuo, F.C.; Chen, T.Y.; Harman, M. No pot of gold at the end of program spectrum rainbow: Greatest risk evaluation formula does not exist. RN 2014, 14, 14. [Google Scholar]
- Wong, W.E.; Sugeta, T.; Qi, Y.; Maldonado, J.C. Smart debugging software architectural design in SDL. J. Syst. Softw. 2005, 76, 15–28. [Google Scholar] [CrossRef]
- Harrold, M.J.; Rothermel, G.; Sayre, K.; Wu, R.; Yi, L. An empirical investigation of the relationship between spectra differences and regression faults. Softw. Test. Verif. Reliab. 2000, 10, 171–194. [Google Scholar] [CrossRef]
- Agrawal, H.; Horgan, J.R.; London, S.; Wong, W.E. Fault localization using execution slices and dataflow tests. In Proceedings of the Sixth International Symposium on Software Reliability Engineering, ISSRE’95, Toulouse, France, 24–27 October 1995; pp. 143–151. [Google Scholar]
- Wong, W.E.; Qi, Y. Effective program debugging based on execution slices and inter-block data dependency. J. Syst. Softw. 2006, 79, 891–903. [Google Scholar] [CrossRef]
- Jones, J.A.; Harrold, M.J.; Stasko, J. Visualization of test information to assist fault localization. In Proceedings of the 24th International Conference on Software Engineering, ICSE 2002, Orlando, FL, USA, 25 May 2002; pp. 467–477. [Google Scholar]
- Chen, M.Y.; Kiciman, E.; Fratkin, E.; Fox, A.; Brewer, E. Pinpoint: Problem determination in large, dynamic internet services. In Proceedings of the International Conference on Dependable Systems and Networks, Washington, DC, USA, 23–26 June 2002; pp. 595–604. [Google Scholar]
- Wong, W.E.; Debroy, V.; Choi, B. A family of code coverage-based heuristics for effective fault localization. J. Syst. Softw. 2010, 83, 188–208. [Google Scholar] [CrossRef]
- Wong, E.; Wei, T.; Qi, Y.; Zhao, L. A crosstab-based statistical method for effective fault localization. In Proceedings of the 2008 1st International Conference on Software Testing, Verification, and Validation, Lillehammer, Norway, 9–11 April 2008; pp. 42–51. [Google Scholar]
- Yoo, S. Evolving human competitive spectra-based fault localisation techniques. In International Symposium on Search Based Software Engineering; Springer: Berlin, Germany, 2012; pp. 244–258. [Google Scholar]
- Russell, P.F.; Rao, T.R. On habitat and association of species of anopheline larvae in south-eastern Madras. J. Malar. Inst. India 1940, 3, 153–178. [Google Scholar]
- SLOCCOUNT. Available online: http://www.dwheeler.com/sloccount/sloccount.html (accessed on 15 April 2019).
- Mao, X.; Lei, Y.; Dai, Z.; Qi, Y.; Wang, C. Slice-based statistical fault localization. J. Syst. Softw. 2014, 89, 51–62. [Google Scholar] [CrossRef]
- Zhang, X.Y.; Zheng, Z.; Cai, K.Y. Exploring the usefulness of unlabelled test cases in software fault localization. J. Syst. Softw. 2018, 136, 278–290. [Google Scholar] [CrossRef]
- Xu, Y.; Yin, B.; Zheng, Z.; Zhang, X.; Li, C.; Yang, S. Robustness of spectrum-based fault localisation in environments with labelling perturbations. J. Syst. Softw. 2019, 147, 172–214. [Google Scholar] [CrossRef]
- SIR. Available online: https://sir.csc.ncsu.edu/portal/index.ph (accessed on 15 April 2019).
- Xie, X.; Wong, W.E.; Chen, T.Y.; Xu, B. Spectrum-based fault localization: Testing oracles are no longer mandatory. In Proceedings of the 2011 11th International Conference on Quality Software, Madrid, Spain, 13–14 July 2011; pp. 1–10. [Google Scholar]
- Xie, X.; Wong, W.E.; Chen, T.Y.; Xu, B. Metamorphic slice: An application in spectrum-based fault localization. Inf. Softw. Technol. 2013, 55, 866–879. [Google Scholar] [CrossRef]
- Jiang, B.; Zhang, Z.; Tse, T.; Chen, T.Y. How well do test case prioritization techniques support statistical fault localization. In Proceedings of the 2009 33rd Annual IEEE International Computer Software and Applications Conference, Seattle, WA, USA, 20–24 July 2009; Volume 1, pp. 99–106. [Google Scholar]
- Jiang, B.; Chan, W. On the integration of test adequacy, test case prioritization, and statistical fault localization. In Proceedings of the 2010 10th International Conference on Quality Software, Zhangjiajie, China, 14–15 July 2010; pp. 377–384. [Google Scholar]
- Jiang, B.; Chan, W.; Tse, T. On practical adequate test suites for integrated test case prioritization and fault localization. In Proceedings of the 2011 11th International Conference on Quality Software, Madrid, Spain, 13–14 July 2011; pp. 21–30. [Google Scholar]
- Yoo, S.; Harman, M.; Clark, D. Fault localization prioritization: Comparing information-theoretic and coverage-based approaches. ACM Trans. Softw. Eng. Methodol. (TOSEM) 2013, 22, 19. [Google Scholar] [CrossRef]
- Yu, Y.; Jones, J.; Harrold, M.J. An empirical study of the effects of test-suite reduction on fault localization. In Proceedings of the 2008 ACM/IEEE 30th International Conference on Software Engineering, Leipzig, Germany, 10–18 May 2008; pp. 201–210. [Google Scholar]


| Group | Risk Evaluation Formula | Expression |
|---|---|---|
| Naish1 (abbr. N1) | ||
| Naish2 | ||
| GP13 | ||
| Wong1 (abbr. W1) | ||
| Russel & Rao | ||
| Binary | ||
| GP02 | ||
| GP03 | ||
| GP19 |
| Program | eLOC | Faulty Versions Selected for Empirical Study | (Number/Total) | Test Suite Size | Description |
|---|---|---|---|---|---|
| flex 1.1 | 9932 | m1, m2, m3, m4, m5 | (5 / 5) | 670 | lexical scanner |
| grep 1.2 | 7306 | m1, m2, m3, m4, m5 | (5 / 5) | 806 | pattern match |
| sed 2.0 | 9205 | m1, m2, m3, m4, m5 | (5 / 7) | 441 | stream editor |
| Space 2.0 | 5902 | v14, v15, v18, v20, v23, v26, v33 | (7 / 38) | 13,550 | ADL interpreter |
| print_tokens 2.0 | 342 | v5, v7 | (2 / 7) | 4130 | lexical analyzer |
| print_tokens2 2.0 | 355 | v4, v5, v6, v7, v8, v9, v10 | (7 / 10) | 4115 | lexical analyzer |
| replace 2.1 | 512 | v1, v15, v30 | (3 / 32) | 5542 | pattern match |
| schedule 2.0 | 292 | v3, v4 | (2 / 9) | 2650 | priority scheduler |
| schedule2 2.0 | 262 | v6, v7, v10 | (3 / 10) | 2710 | priority scheduler |
| tcas 2.0 | 135 | v1 | (1 / 41) | 1608 | altitude separation |
| tot_info 2.0 | 273 | v5, v7, v8, v15, v16, v17, v20, v23 | (8 / 23) | 1052 | information measure |
| Subject Program | CP1 | CP2 | CP3 | CP4 | CP5 | CP6 | CP7 | CP8 | CP9 | CP10 |
|---|---|---|---|---|---|---|---|---|---|---|
| N1,W1 | N1,GP02 | N1,GP03 | N1,GP19 | W1,GP02 | W1,GP03 | W1,GP19 | GP02,GP03 | GP02,GP19 | GP03,GP19 | |
| flex m1 | N1 | N1 | N1 | N1 | W1 | W1 | W1 | GP02 | GP02 | same |
| flex m2 | W1 | N1 | N1 | GP19 | W1 | W1 | GP19 | GP03 | GP19 | GP19 |
| flex m3 | N1 | GP02 | N1 | N1 | GP02 | W1 | same | GP02 | GP02 | GP19 |
| flex m4 | N1 | same | N1 | N1 | GP02 | W1 | W1 | GP02 | GP02 | GP19 |
| flex m5 | N1 | same | same | same | GP02 | GP03 | GP19 | same | same | same |
| grep m1 | N1 | N1 | N1 | N1 | GP02 | GP03 | W1 | GP03 | GP02 | GP03 |
| grep m2 | W1 | N1 | same | GP19 | W1 | W1 | GP19 | GP03 | GP19 | GP19 |
| grep m3 | N1 | N1 | same | N1 | W1 | GP03 | W1 | GP03 | GP19 | GP03 |
| grep m4 | W1 | GP02 | GP03 | GP19 | same | same | same | same | same | same |
| grep m5 | W1 | GP02 | GP03 | GP19 | W1 | GP03 | GP19 | GP03 | GP19 | GP03 |
| sed m1 | W1 | GP02 | GP03 | GP19 | W1 | W1 | GP19 | GP03 | GP19 | GP19 |
| sed m2 | N1 | same | same | N1 | GP02 | GP03 | W1 | same | GP02 | GP03 |
| sed m3 | N1 | N1 | same | N1 | GP02 | GP03 | W1 | GP03 | GP02 | GP03 |
| sed m4 | W1 | N1 | same | GP19 | W1 | W1 | GP19 | GP03 | GP19 | GP19 |
| sed m5 | W1 | N1 | same | GP19 | W1 | W1 | GP19 | GP03 | GP19 | GP19 |
| space v14 | N1 | N1 | N1 | N1 | W1 | same | W1 | GP03 | GP02 | GP03 |
| space v15 | N1 | same | N1 | N1 | GP02 | same | W1 | GP02 | GP02 | GP03 |
| space v18 | N1 | N1 | same | N1 | GP02 | GP03 | W1 | GP03 | GP02 | GP03 |
| space v20 | N1 | N1 | GP03 | N1 | GP02 | GP03 | W1 | GP03 | GP02 | GP03 |
| space v23 | N1 | N1 | N1 | N1 | GP02 | W1 | W1 | GP02 | GP02 | GP03 |
| space v26 | W1 | GP02 | GP03 | GP19 | GP02 | same | same | GP02 | GP02 | same |
| space v33 | N1 | N1 | same | N1 | GP02 | GP03 | W1 | GP03 | GP02 | GP03 |
| print_tokens v5 | N1 | same | same | N1 | GP02 | GP03 | W1 | same | GP02 | GP03 |
| print_tokens v7 | N1 | N1 | same | N1 | GP02 | GP03 | W1 | GP03 | GP02 | GP03 |
| print_tokens2 v4 | N1 | N1 | same | N1 | GP02 | GP03 | W1 | GP03 | GP02 | GP03 |
| print_tokens2 v5 | N1 | N1 | same | same | GP02 | GP03 | GP19 | GP03 | GP19 | same |
| print_tokens2 v6 | N1 | N1 | same | same | GP02 | GP03 | GP19 | GP03 | GP19 | same |
| print_tokens2 v7 | N1 | GP02 | same | N1 | GP02 | GP03 | W1 | GP02 | GP02 | GP03 |
| print_tokens2 v8 | N1 | N1 | same | N1 | GP02 | GP03 | W1 | GP03 | GP02 | GP03 |
| print_tokens2 v9 | N1 | same | same | N1 | GP02 | GP03 | W1 | same | GP02 | GP03 |
| print_tokens2 v10 | N1 | GP02 | same | N1 | GP02 | GP03 | W1 | GP02 | GP02 | GP03 |
| replace v1 | N1 | same | same | N1 | GP02 | GP03 | W1 | same | GP02 | GP03 |
| replace v15 | W1 | N1 | same | GP19 | W1 | W1 | GP19 | GP03 | GP19 | GP19 |
| replace v30 | N1 | GP02 | same | N1 | GP02 | GP03 | W1 | GP02 | GP02 | GP03 |
| schedule v3 | N1 | same | same | N1 | GP02 | GP03 | W1 | same | GP02 | GP03 |
| schedule v4 | N1 | same | same | N1 | GP02 | GP03 | W1 | same | GP02 | GP03 |
| schedule2 v6 | N1 | N1 | N1 | N1 | W1 | W1 | W1 | GP02 | GP19 | GP19 |
| schedule2 v7 | W1 | N1 | same | GP19 | W1 | W1 | GP19 | GP03 | GP19 | GP19 |
| schedule2 v10 | W1 | N1 | same | GP19 | W1 | W1 | GP19 | GP03 | GP19 | GP19 |
| tcas v1 | N1 | GP02 | same | N1 | GP02 | GP03 | W1 | GP02 | GP02 | GP03 |
| tot_info v5 | N1 | N1 | same | N1 | W1 | GP03 | W1 | GP03 | GP02 | GP03 |
| tot_info v7 | N1 | same | same | N1 | GP02 | GP03 | W1 | same | GP02 | GP03 |
| tot_info v8 | N1 | N1 | same | same | GP02 | GP03 | GP19 | GP03 | GP19 | same |
| tot_info v15 | N1 | N1 | same | same | GP02 | GP03 | GP19 | GP03 | GP19 | same |
| tot_info v16 | W1 | same | same | GP19 | W1 | W1 | GP19 | same | GP19 | GP19 |
| tot_info v17 | N1 | same | same | N1 | GP02 | GP03 | W1 | same | GP02 | GP03 |
| tot_info v20 | same | N1 | same | same | W1 | same | same | GP03 | GP19 | same |
| tot_info v23 | N1 | same | same | N1 | GP02 | GP03 | W1 | same | GP02 | GP03 |
| Comparison Pair | Flex | Grep | Sed | Space | print_tokens | print_tokens2 | Replace | Schedule | schedule2 | tcas | tot_info | Average | |
|---|---|---|---|---|---|---|---|---|---|---|---|---|---|
| CP1 | N1 better | 80 | 40 | 40 | 85.7 | 100 | 100 | 66.7 | 100 | 33.3 | 100 | 75 | 74.6 |
| same | 0 | 0 | 0 | 0 | 0 | 0 | 0 | 0 | 0 | 0 | 12.5 | 1.1 | |
| W1 better | 20 | 60 | 60 | 14.3 | 0 | 0 | 33.3 | 0 | 66.7 | 0 | 12.5 | 24.3 | |
| CP2 | N1 better | 40 | 60 | 60 | 71.4 | 50 | 57.1 | 33.3 | 0 | 100 | 0 | 50 | 47.4 |
| same | 40 | 0 | 20 | 14.3 | 50 | 14.3 | 33.3 | 100 | 0 | 0 | 50 | 29.3 | |
| GP02 better | 20 | 40 | 20 | 14.3 | 0 | 28.6 | 33.3 | 0 | 0 | 100 | 0 | 23.3 | |
| CP3 | N1 better | 80 | 20 | 0 | 42.9 | 0 | 0 | 0 | 0 | 33.3 | 0 | 0 | 16.0 |
| same | 20 | 40 | 80 | 28.6 | 100 | 100 | 100 | 100 | 66.7 | 100 | 100 | 75.9 | |
| GP03 better | 0 | 40 | 20 | 28.6 | 0 | 0 | 0 | 0 | 0 | 0 | 0 | 8.1 | |
| CP4 | N1 better | 60 | 40 | 40 | 85.7 | 100 | 71.4 | 66.7 | 100 | 33.3 | 100 | 50 | 67.9 |
| same | 20 | 0 | 0 | 0 | 0 | 28.6 | 0 | 0 | 0 | 0 | 37.5 | 7.8 | |
| GP19 better | 20 | 60 | 60 | 14.3 | 0 | 0 | 33.3 | 0 | 66.7 | 0 | 12.5 | 24.3 | |
| CP5 | W1 better | 40 | 60 | 60 | 14.3 | 0 | 0 | 33.3 | 0 | 100 | 0 | 37.5 | 31.4 |
| same | 0 | 20 | 0 | 0 | 0 | 0 | 0 | 0 | 0 | 0 | 0 | 1.8 | |
| GP02 better | 60 | 20 | 40 | 85.7 | 100 | 100 | 66.7 | 100 | 0 | 100 | 62.5 | 66.8 | |
| CP6 | W1 better | 80 | 20 | 60 | 14.3 | 0 | 0 | 33.3 | 0 | 100 | 0 | 12.5 | 29.1 |
| same | 0 | 20 | 0 | 42.9 | 0 | 0 | 0 | 0 | 0 | 0 | 12.5 | 6.9 | |
| GP03 better | 20 | 60 | 40 | 42.9 | 100 | 100 | 66.7 | 100 | 0 | 100 | 75 | 64.0 | |
| CP7 | W1 better | 40 | 40 | 40 | 85.7 | 100 | 71.4 | 66.7 | 100 | 33.3 | 100 | 50 | 66.1 |
| same | 20 | 20 | 0 | 14.3 | 0 | 0 | 0 | 0 | 0 | 0 | 12.5 | 6.1 | |
| GP19 better | 40 | 40 | 60 | 0 | 0 | 28.6 | 33.3 | 0 | 66.7 | 0 | 37.5 | 27.8 | |
| CP8 | GP02 better | 60 | 0 | 0 | 42.9 | 0 | 28.6 | 33.3 | 0 | 33.3 | 100 | 0 | 27.1 |
| same | 20 | 20 | 20 | 0 | 50 | 14.3 | 33.3 | 100 | 0 | 0 | 50 | 28.0 | |
| GP03 better | 20 | 80 | 80 | 57.1 | 50 | 57.1 | 33.3 | 0 | 66.7 | 0 | 50 | 44.9 | |
| CP9 | GP02 better | 60 | 20 | 40 | 100 | 100 | 71.4 | 66.7 | 100 | 0 | 100 | 50 | 64.4 |
| same | 20 | 20 | 0 | 0 | 0 | 0 | 0 | 0 | 0 | 0 | 0 | 3.6 | |
| GP19 better | 20 | 60 | 60 | 0 | 0 | 28.6 | 33.3 | 0 | 100 | 0 | 50 | 32.0 | |
| CP10 | GP03 better | 0 | 60 | 40 | 85.7 | 100 | 71.4 | 66.7 | 100 | 0 | 100 | 50 | 63.9 |
| same | 40 | 20 | 0 | 14.3 | 0 | 28.6 | 0 | 0 | 0 | 0 | 37.5 | 10.2 | |
| GP19 better | 60 | 20 | 60 | 0 | 0 | 0 | 33.3 | 0 | 100 | 0 | 12.5 | 26.0 | |
| Comparison Pair ( vs. ) | Better | Better | Same as |
|---|---|---|---|
| CP1 (N1 vs. W1) | 35 | 12 | 1 |
| CP2 (N1 vs. GP02) | 26 | 9 | 13 |
| CP3 (N1 vs. GP03) | 9 | 5 | 34 |
| CP4 (N1 vs. GP19) | 30 | 12 | 6 |
| CP5 (W1 vs. GP02) | 16 | 31 | 1 |
| CP6 (W1 vs. GP03) | 14 | 29 | 5 |
| CP7 (W1 vs. GP19) | 29 | 15 | 4 |
| CP8 (GP02 vs. GP03) | 11 | 25 | 12 |
| CP9 (GP02 vs. GP19) | 29 | 17 | 2 |
| CP10 (GP03 vs. GP19) | 27 | 12 | 9 |
| Scenarios | Flex | Grep | Sed | Space | print_tokens | print_tokens2 | Replace | Schedule | schedule2 | tcas | tot_info | Total |
|---|---|---|---|---|---|---|---|---|---|---|---|---|
| 22 | 18 | 23 | 27 | 9 | 28 | 14 | 8 | 20 | 5 | 29 | 203 | |
| 6 | 2 | 2 | 3 | 0 | 2 | 0 | 0 | 0 | 0 | 0 | 15 | |
| 5 | 5 | 6 | 10 | 1 | 2 | 4 | 0 | 5 | 1 | 6 | 45 | |
| 6 | 7 | 6 | 2 | 5 | 9 | 4 | 3 | 0 | 1 | 12 | 55 | |
| 2 | 10 | 7 | 20 | 1 | 16 | 3 | 3 | 3 | 2 | 8 | 75 | |
| 9 | 8 | 6 | 8 | 4 | 13 | 5 | 6 | 2 | 1 | 25 | 87 | |
| total | 50 | 50 | 50 | 70 | 20 | 70 | 30 | 20 | 30 | 10 | 80 | 480 |
© 2020 by the authors. Licensee MDPI, Basel, Switzerland. This article is an open access article distributed under the terms and conditions of the Creative Commons Attribution (CC BY) license (http://creativecommons.org/licenses/by/4.0/).
Share and Cite
Wu, T.; Dong, Y.; Lau, M.F.; Ng, S.; Chen, T.Y.; Jiang, M. Performance Analysis of Maximal Risk Evaluation Formulas for Spectrum-Based Fault Localization. Appl. Sci. 2020, 10, 398. https://doi.org/10.3390/app10010398
Wu T, Dong Y, Lau MF, Ng S, Chen TY, Jiang M. Performance Analysis of Maximal Risk Evaluation Formulas for Spectrum-Based Fault Localization. Applied Sciences. 2020; 10(1):398. https://doi.org/10.3390/app10010398
Chicago/Turabian StyleWu, Tingting, Yunwei Dong, Man Fai Lau, Sebastian Ng, Tsong Yueh Chen, and Mingyue Jiang. 2020. "Performance Analysis of Maximal Risk Evaluation Formulas for Spectrum-Based Fault Localization" Applied Sciences 10, no. 1: 398. https://doi.org/10.3390/app10010398
APA StyleWu, T., Dong, Y., Lau, M. F., Ng, S., Chen, T. Y., & Jiang, M. (2020). Performance Analysis of Maximal Risk Evaluation Formulas for Spectrum-Based Fault Localization. Applied Sciences, 10(1), 398. https://doi.org/10.3390/app10010398