Biomechanical Characteristics of Single Leg Jump in Collegiate Basketball Players Based on Approach Technique

 ,
, 
Abstract
1. Introduction
2. Methods
2.1. Participants
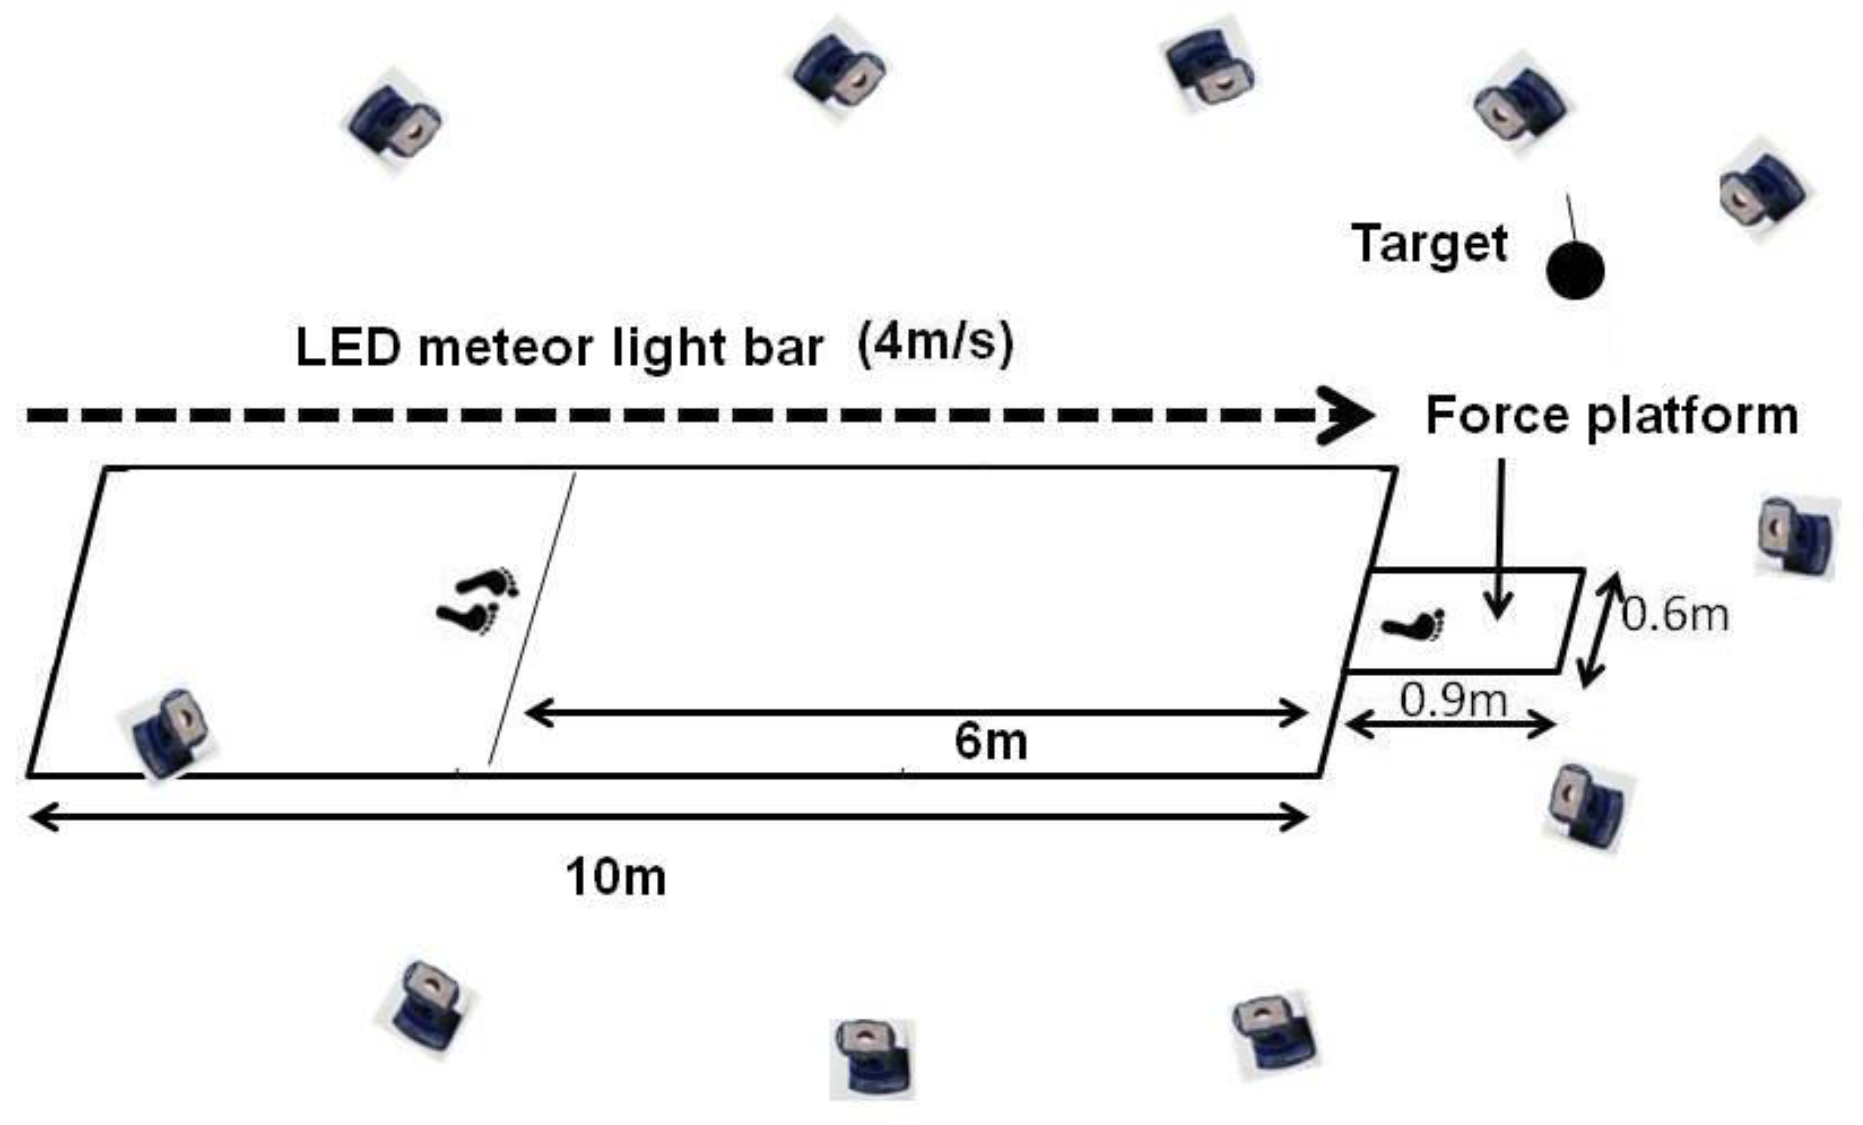
2.2. Procedures
2.3. Data Collection
2.4. Data Analysis
2.5. Statistical Analysis
3. Results
4. Discussion
Author Contributions
Funding
Acknowledgments
Conflicts of Interest
References
- Alemdaroglu, U. The relationship between muscle strength, anaerobic performance, agility, sprint ability and vertical jump performance in professional basketball players. J. Hum. Kinet. 2012, 31, 149–158. [Google Scholar] [CrossRef]
- Sugiyama, T.; Kameda, M.; Kageyama, M.; Kiba, K.; Kanehisa, H.; Maeda, A. Asymmetry between the dominant and non-dominant legs in the kinematics of the lower extremities during a running single leg jump in collegiate basketball players. J. Sports Sci. Med. 2014, 13, 951–957. [Google Scholar]
- Schiltz, M.; Lehance, C.; Maquet, D.; Bury, T.; Crielaard, J.M.; Croisier, J.L. Explosive strength imbalances in professional basketball players. J. Athl. Train. 2009, 44, 39–47. [Google Scholar] [CrossRef] [PubMed]
- Wilson, C.; King, M.A.; Yeadon, M.R. The effects of initial conditions and takeoff technique on running jumps for height and distance. J. Biomech. 2011, 44, 2207–2212. [Google Scholar] [CrossRef] [PubMed]
- Laffaye, G.; Bardy, B.G.; Durey, A. Leg stiffness and expertise in men jumping. Med. Sci. Sports Exerc. 2005, 37, 536–543. [Google Scholar] [CrossRef] [PubMed]
- Sado, N.; Yoshioka, S.; Fukashiro, S. Hip Abductors and Lumbar Lateral Flexors act as Energy Generators in Running Single-leg Jumps. Int. J. Sports Med. 2018, 39, 1001–1008. [Google Scholar] [CrossRef] [PubMed]
- Stefanyshyn, D.J.; Nigg, B.M. Contribution of the lower extremity joints to mechanical energy in running vertical jumps and running long jumps. J. Sports Sci. 1998, 16, 177–186. [Google Scholar] [CrossRef]
- Lees, A.; Graham-Smith, P.; Fowler, N. A biomechanical analysis of the last stride, touchdown, and takeoff characteristics of the men’s long jump. J. Appl. Biomech. 1994, 10, 61–78. [Google Scholar] [CrossRef]
- Muraki, Y.; Ae, M.; Koyama, H.; Yokozawa, T. Joint torque and power of the takeoff leg in the long jump. Int. J. Sport Health. Sci. 2008, 6, 21–32. [Google Scholar] [CrossRef]
- Ruan, M.; Li, L. Influence of a horizontal approach on the mechanical output during drop jumps. Res. Q. Exerc. Sport 2008, 77, 1–9. [Google Scholar] [CrossRef]
- Greig, M.P.; Yeadon, M.R. The influence of touchdown parameters on the performance of a high jumper. J. Appl. Biomech. 2000, 16, 367–378. [Google Scholar] [CrossRef]
- Ritzdorf, W. Approaches to technique and technical training in the high jump. New Stud. Athl. 2009, 3, 31–34. [Google Scholar]
- Ruan, M.; Li, L. Approach run increases preactivation and eccentric phases muscle activity during drop jumps from different drop heights. J. Electromyogr. Kines. 2010, 20, 932–938. [Google Scholar] [CrossRef] [PubMed]
- Kelso, J.A.S. Dynamic Patterns: The Self-Organization of Brain and Behavior; MIT Press: Cambridge, London, UK; Boston, MA, USA, 1995; ISBN 978-0262611312. [Google Scholar]
- Tai, W.H.; Wang, L.I.; Peng, H.T. Biomechanical Comparisons of One-Legged and Two-Legged Running Vertical Jumps. J. Hum. Kinet. 2018, 64, 71–76. [Google Scholar] [CrossRef] [PubMed]
- Laffaye, G.; Wagner, P.P.; Tombleson, T.I. Countermovement jump height: Gender and sport-specific differences in the force-time variables. J. Strength Cond. Res. 2014, 28, 1096–1105. [Google Scholar] [CrossRef] [PubMed]
- Winter, D.A. Biomechanics and Motor Control of Human Movement, 4th ed.; Wiley: New York, NY, USA, 2009; pp. 107–138. ISBN 978-0-470-39818-0. [Google Scholar]
- Peng, H.T. Changes in biomechanical properties during drop jumps of incremental height. J. Strength Cond. Res. 2011, 25, 2510–2518. [Google Scholar] [CrossRef]
- Un, C.P.; Lin, K.H.; Shiang, T.Y.; Chang, E.C.; Su, S.C.; Wang, H.K. Comparative and reliability studies of neuromechanical leg muscle performances of volleyball athletes in different divisions. Eur. J. Appl. Physyol. 2013, 113, 457–466. [Google Scholar] [CrossRef]
- Isolehto, J.; Virmavirta, M.; Kyröläinen, H.; Komi, P. Biomechanical analysis of the high jump at the 2005 IAAF World Championships in Athletics. New Stud. Athl. 2007, 22, 17–27. [Google Scholar]
- Van Ingen Schenau, G.J.; Bobbert, M.F.; de Haan, A. Does elastic energy enhance work and efficiency in the stretch-shortening cycle? J. Appl. Biomech. 1997, 13, 389–415. [Google Scholar] [CrossRef]
- Earp, J.E.; Kraemer, W.J.; Cormie, P.; Volek, J.S.; Maresh, C.M.; Joseph, M.; Newton, R.U. Influence of muscle-tendon unit structure on rate of force development during the squat, countermovement, and drop jumps. J. Strength Cond. Res. 2011, 25, 340–347. [Google Scholar] [CrossRef]
- Komi, P.V.; Gollhofer, A. Stretch reflexes can have an important role in force enhancement during SSC exercise. J. Appl. Biomech. 1997, 14, 451–460. [Google Scholar] [CrossRef]
- Kyrolainen, H.; Avela, J.; Komi, P.V. Changes in muscle activity with increasing running speed. J. Sport Sci. 2005, 23, 1101–1109. [Google Scholar] [CrossRef] [PubMed]
- Wang, L.I. The lower extremity biomechanics of single- and double-leg stop-jump tasks. J. Sport Sci. Med. 2011, 10, 151–156. [Google Scholar]
- Yu, B.; Lin, C.F.; Garrett, W.E. Lower extremity biomechanics during the landing of a stop-jump task. Clin. Biomech. 2006, 21, 297–305. [Google Scholar] [CrossRef] [PubMed]
- Kariyama, Y.; Hobara, H.; Zushi, K. Differences in take-off leg kinetics between horizontal and vertical single-leg rebound jumps. Sports Biomech. 2017, 16, 187–200. [Google Scholar] [CrossRef]
- Xiao, S.; Liu, S.; Song, M.; Ang, N.; Zhang, H. Coupling rub-impact dynamics of double translational joints with subsidence for time-varying load in a planar mechanical system. Multibody Syst Dyn. 2019. [Google Scholar] [CrossRef]


| Fast Approach | Prefer Approach | t | p | r | r2 | Cohen’s d | |||
|---|---|---|---|---|---|---|---|---|---|
| M | SD | M | SD | ||||||
| Jump height (m) | 0.78 | 0.08 | 0.77 | 0.09 | 0.57 | 0.583 | 0.74 | 0.55 | 0.161 |
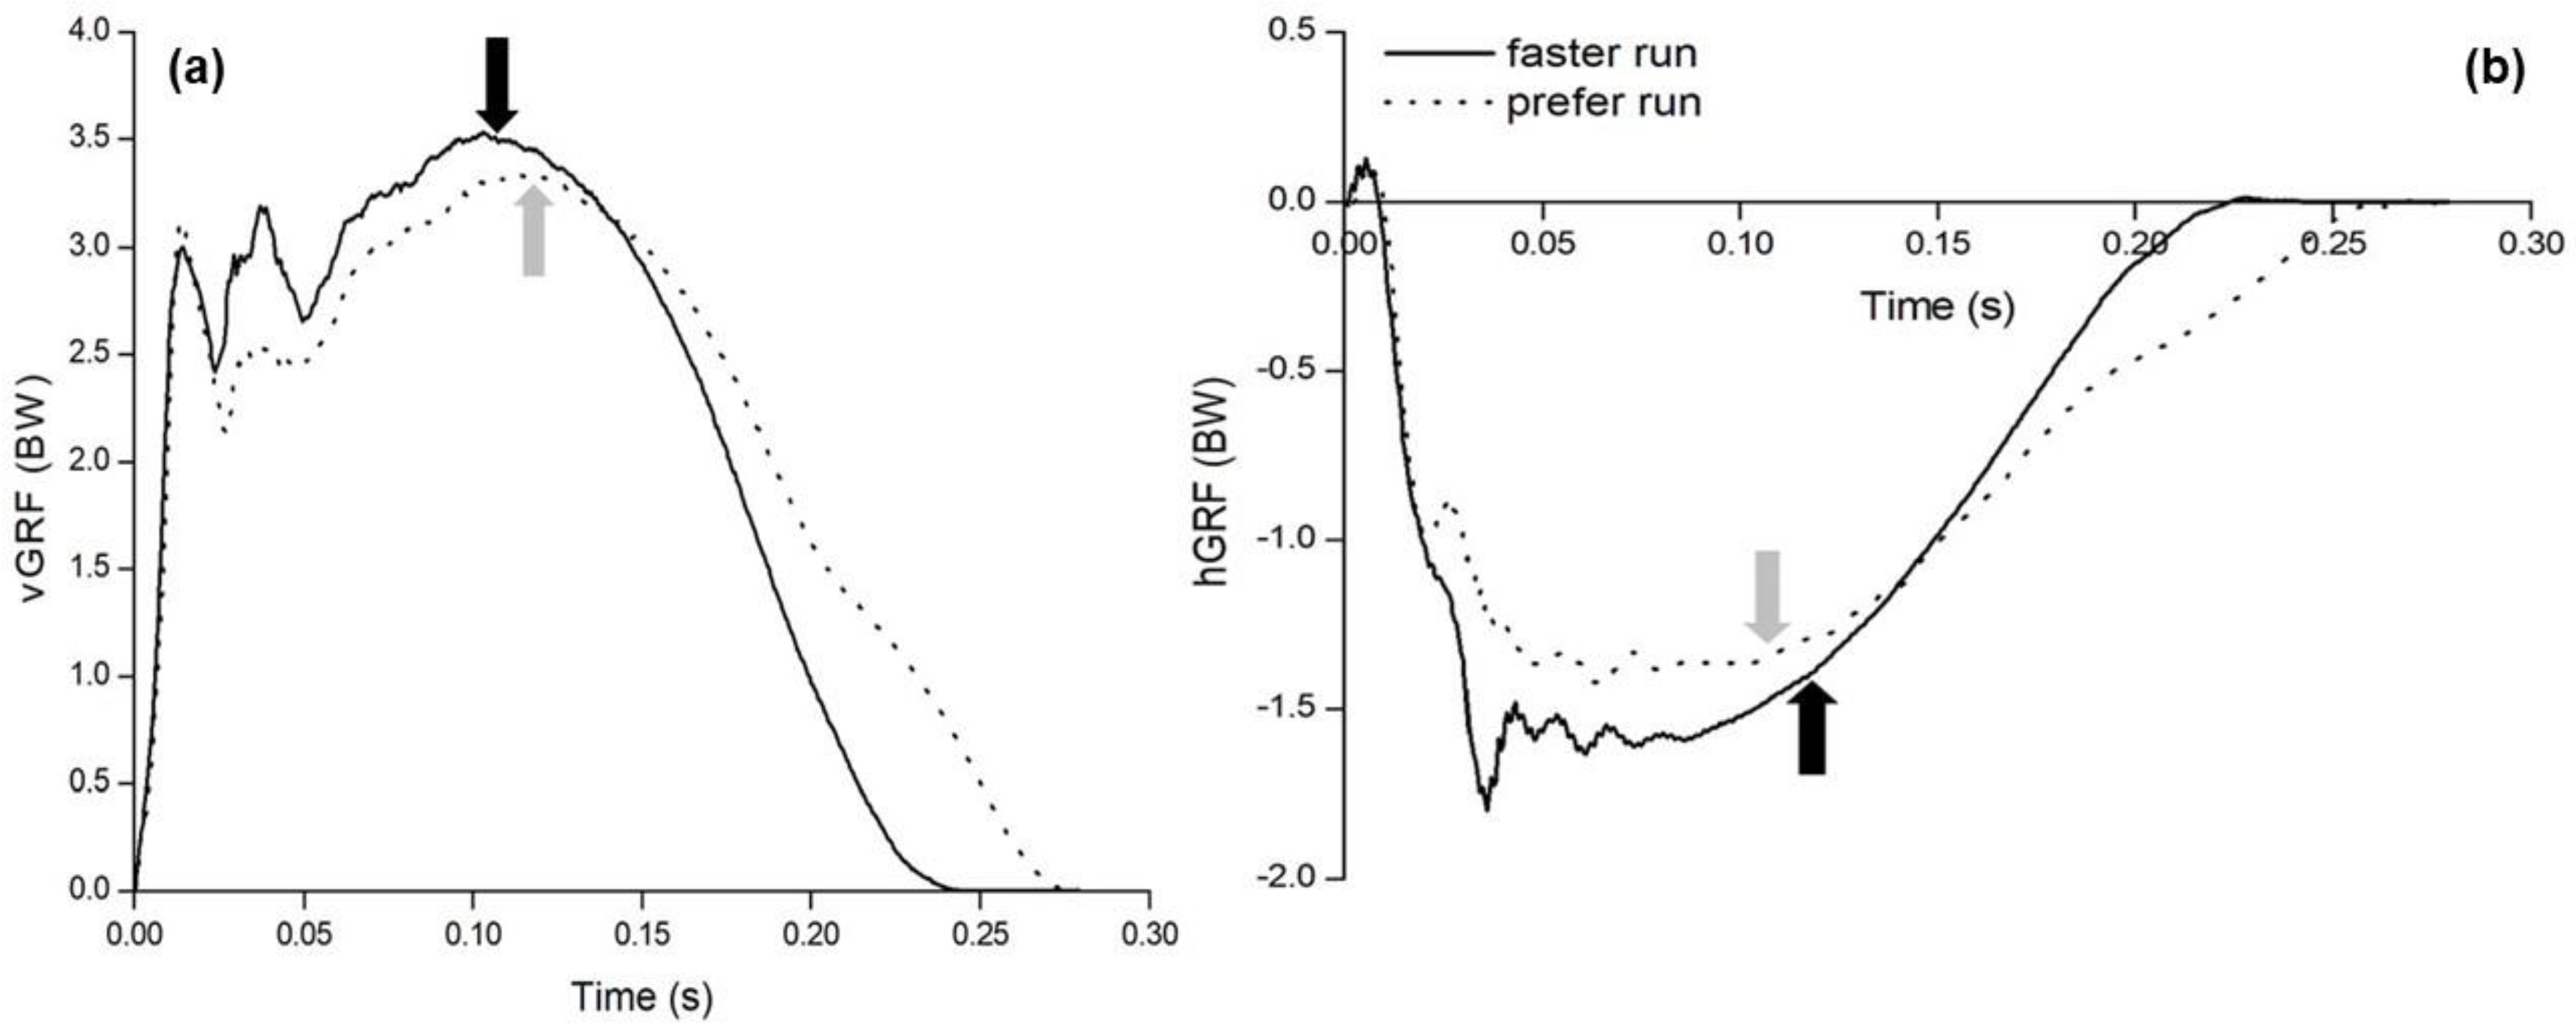
| Horizontal GRF (BW) * | 1.58 | 0.24 | 1.36 | 0.24 | −7.11 | <0.000 | 0.91 | 0.82 | 2.139 |
| Vertical GRF (BW) | 3.46 | 0.31 | 3.27 | 0.34 | 2.40 | 0.035 | 0.65 | 0.42 | 0.695 |
| Horizontal touchdown velocity (m/s) | 4.31 | 0.17 | 3.96 | 0.28 | −2.91 | 0.059 | 0.61 | 0.37 | 1.577 |
| Vertical touchdown velocity (m/s) | 0.32 | 0.17 | 0.30 | 0.17 | −0.42 | 0.682 | 0.60 | 0.36 | 0.132 |
| Concentric time (ms) | 115 | 16 | 124 | 13 | −3.25 | 0.008 | 0.82 | 0.67 | 0.983 |
| Eccentric time (ms) | 127 | 16 | 144 | 22 | −3.15 | 0.009 | 0.56 | 0.32 | 0.914 |
| Variables | Fast Approach | Prefer Approach | ||
|---|---|---|---|---|
| r | p | r | p | |
| Horizontal GRF (BW) | 0.082 | 0.801 | 0.480 | 0.114 |
| Vertical GRF (BW) | 0.229 | 0.474 | 0.200 | 0.533 |
| Horizontal touchdown velocity (m/s) | 0.358 | 0.253 | 0.223 | 0.486 |
| Vertical touchdown velocity (m/s) | 0.215 | 0.502 | 0.315 | 0.319 |
| Concentric time (ms) | 0.366 | 0.242 | 0.340 | 0.280 |
| Eccentric time (ms) | 0.574 | 0.051 | 0.221 | 0.490 |
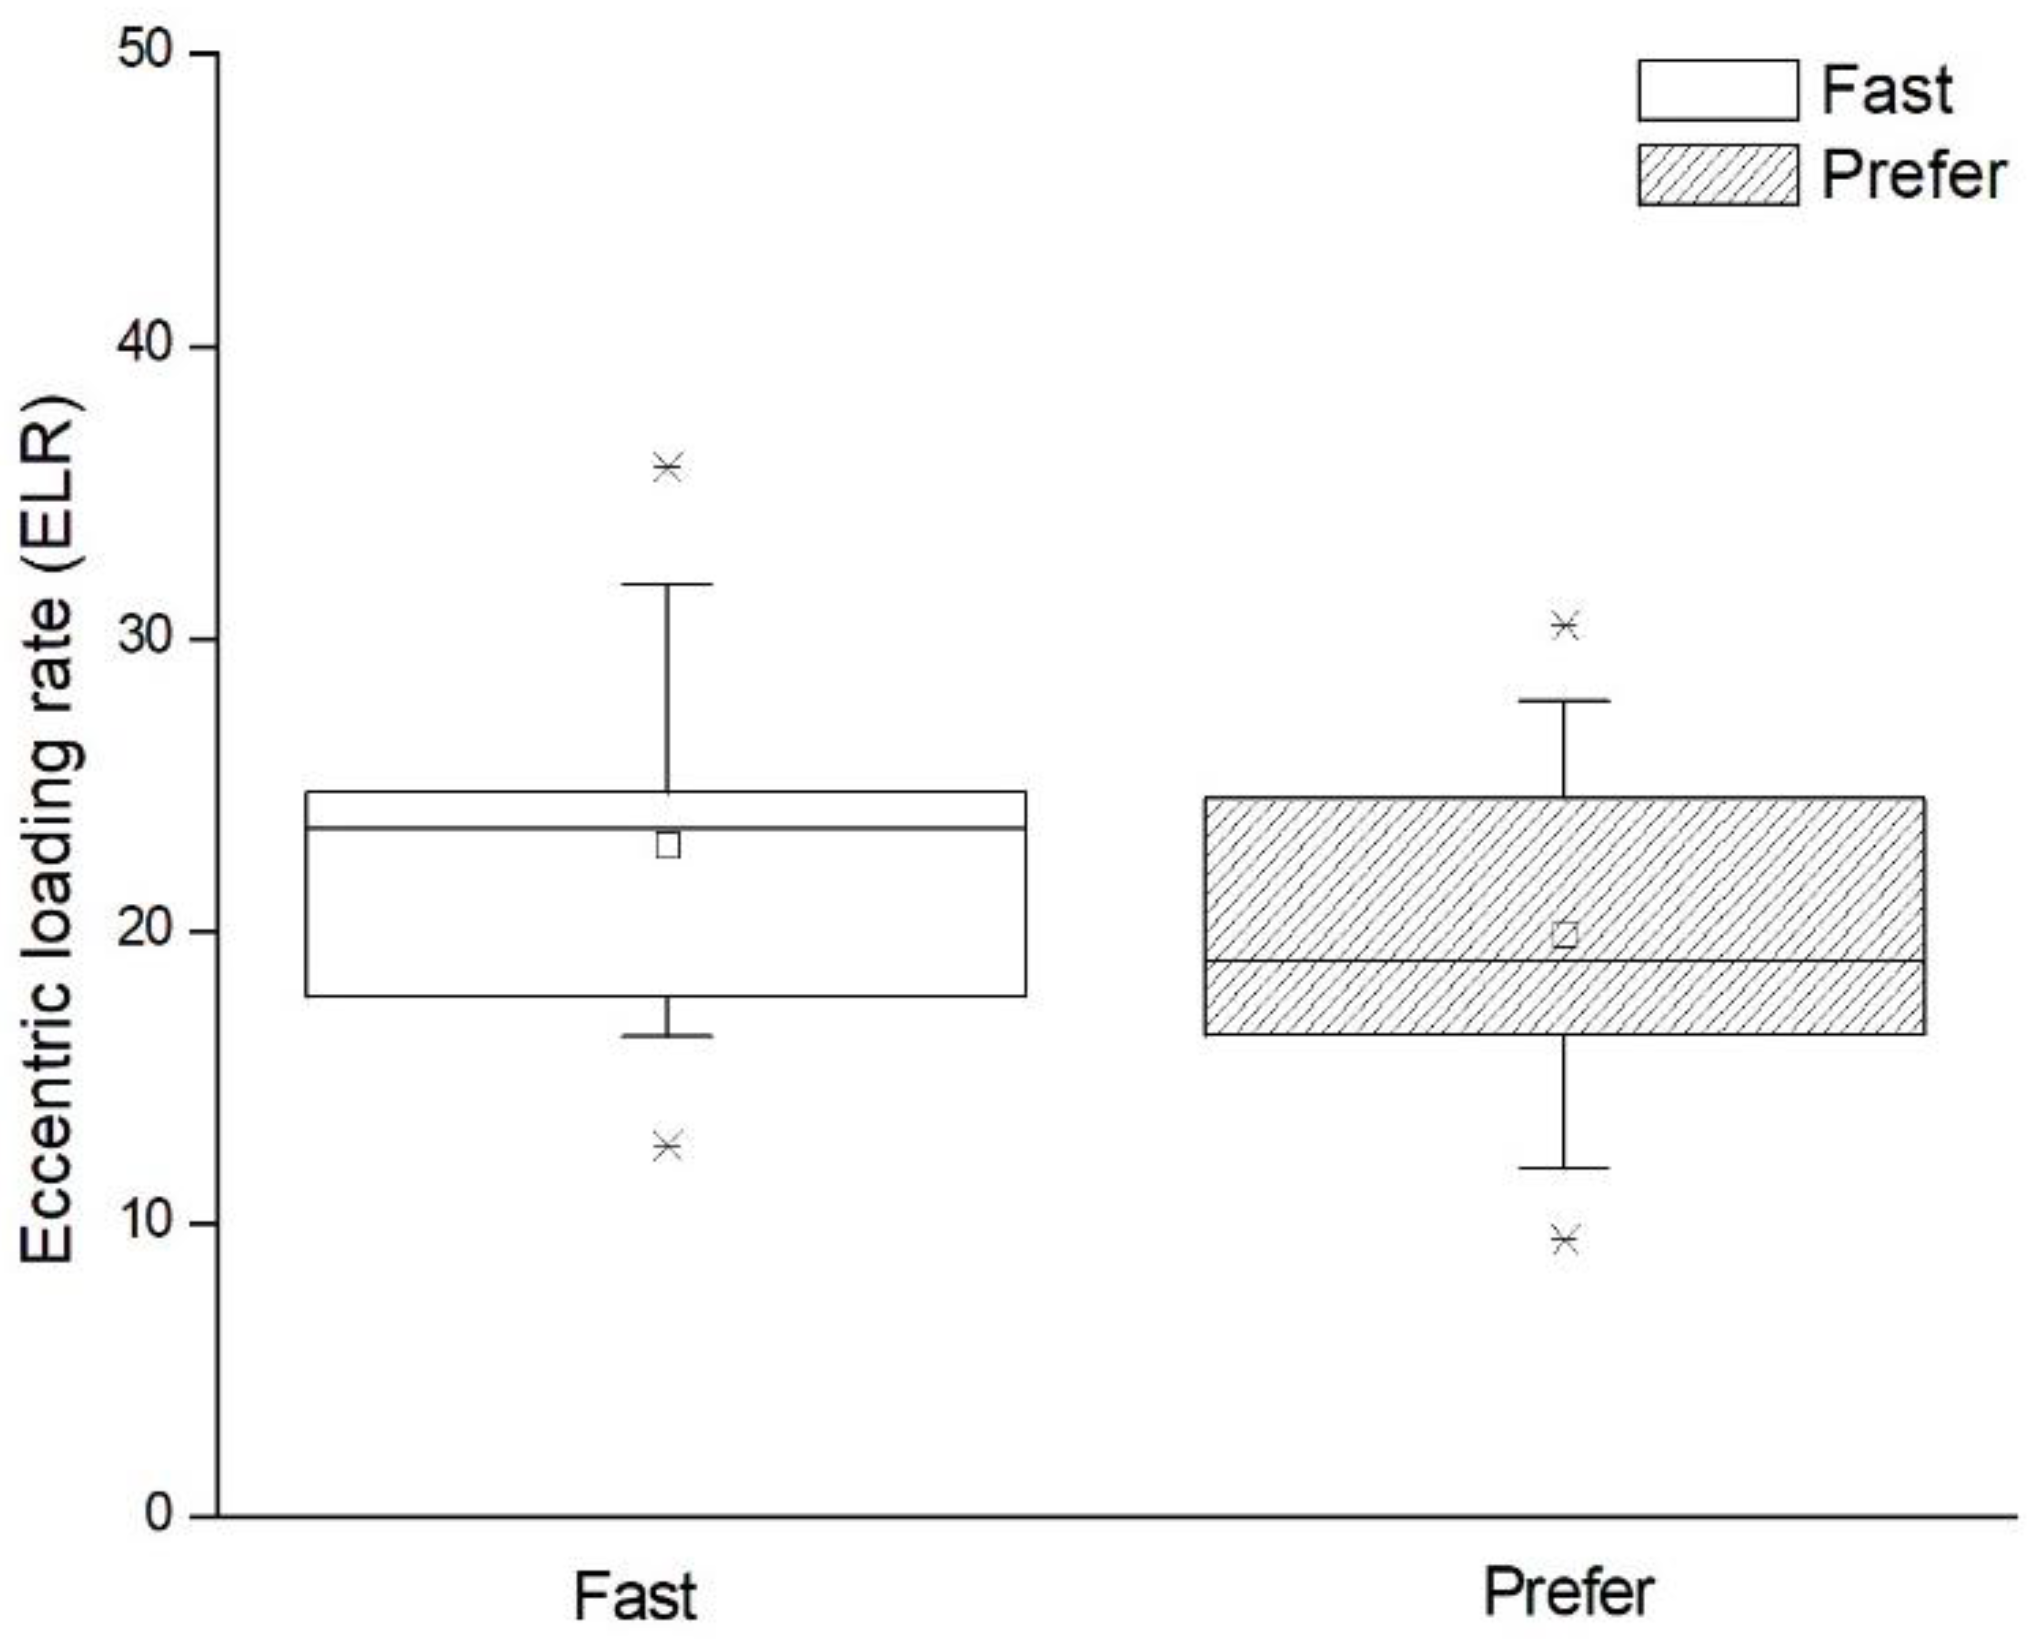
| ELR | 0.188 | 0.558 | 0.167 | 0.604 |
| GA%RVC in pre-activation (%) | 0.278 | 0.382 | 0.125 | 0.699 |
| TA%RVC in push-off (%) | 0.213 | 0.506 | 0.255 | 0.424 |
© 2019 by the authors. Licensee MDPI, Basel, Switzerland. This article is an open access article distributed under the terms and conditions of the Creative Commons Attribution (CC BY) license (http://creativecommons.org/licenses/by/4.0/).
Share and Cite
Tai, W.; Peng, H.; Lin, J.; Lo, S.; Yu, H.; Huang, J. Biomechanical Characteristics of Single Leg Jump in Collegiate Basketball Players Based on Approach Technique. Appl. Sci. 2020, 10, 309. https://doi.org/10.3390/app10010309
Tai W, Peng H, Lin J, Lo S, Yu H, Huang J. Biomechanical Characteristics of Single Leg Jump in Collegiate Basketball Players Based on Approach Technique. Applied Sciences. 2020; 10(1):309. https://doi.org/10.3390/app10010309
Chicago/Turabian StyleTai, Weihsun, Hsiente Peng, Jianzhi Lin, Shinliang Lo, Haibin Yu, and Jianlong Huang. 2020. "Biomechanical Characteristics of Single Leg Jump in Collegiate Basketball Players Based on Approach Technique" Applied Sciences 10, no. 1: 309. https://doi.org/10.3390/app10010309
APA StyleTai, W., Peng, H., Lin, J., Lo, S., Yu, H., & Huang, J. (2020). Biomechanical Characteristics of Single Leg Jump in Collegiate Basketball Players Based on Approach Technique. Applied Sciences, 10(1), 309. https://doi.org/10.3390/app10010309