Shock Reduction through Opposing Jets—Aerodynamic Performance and Flight Stability Perspectives

Abstract
1. Introduction
2. Problem Formulation
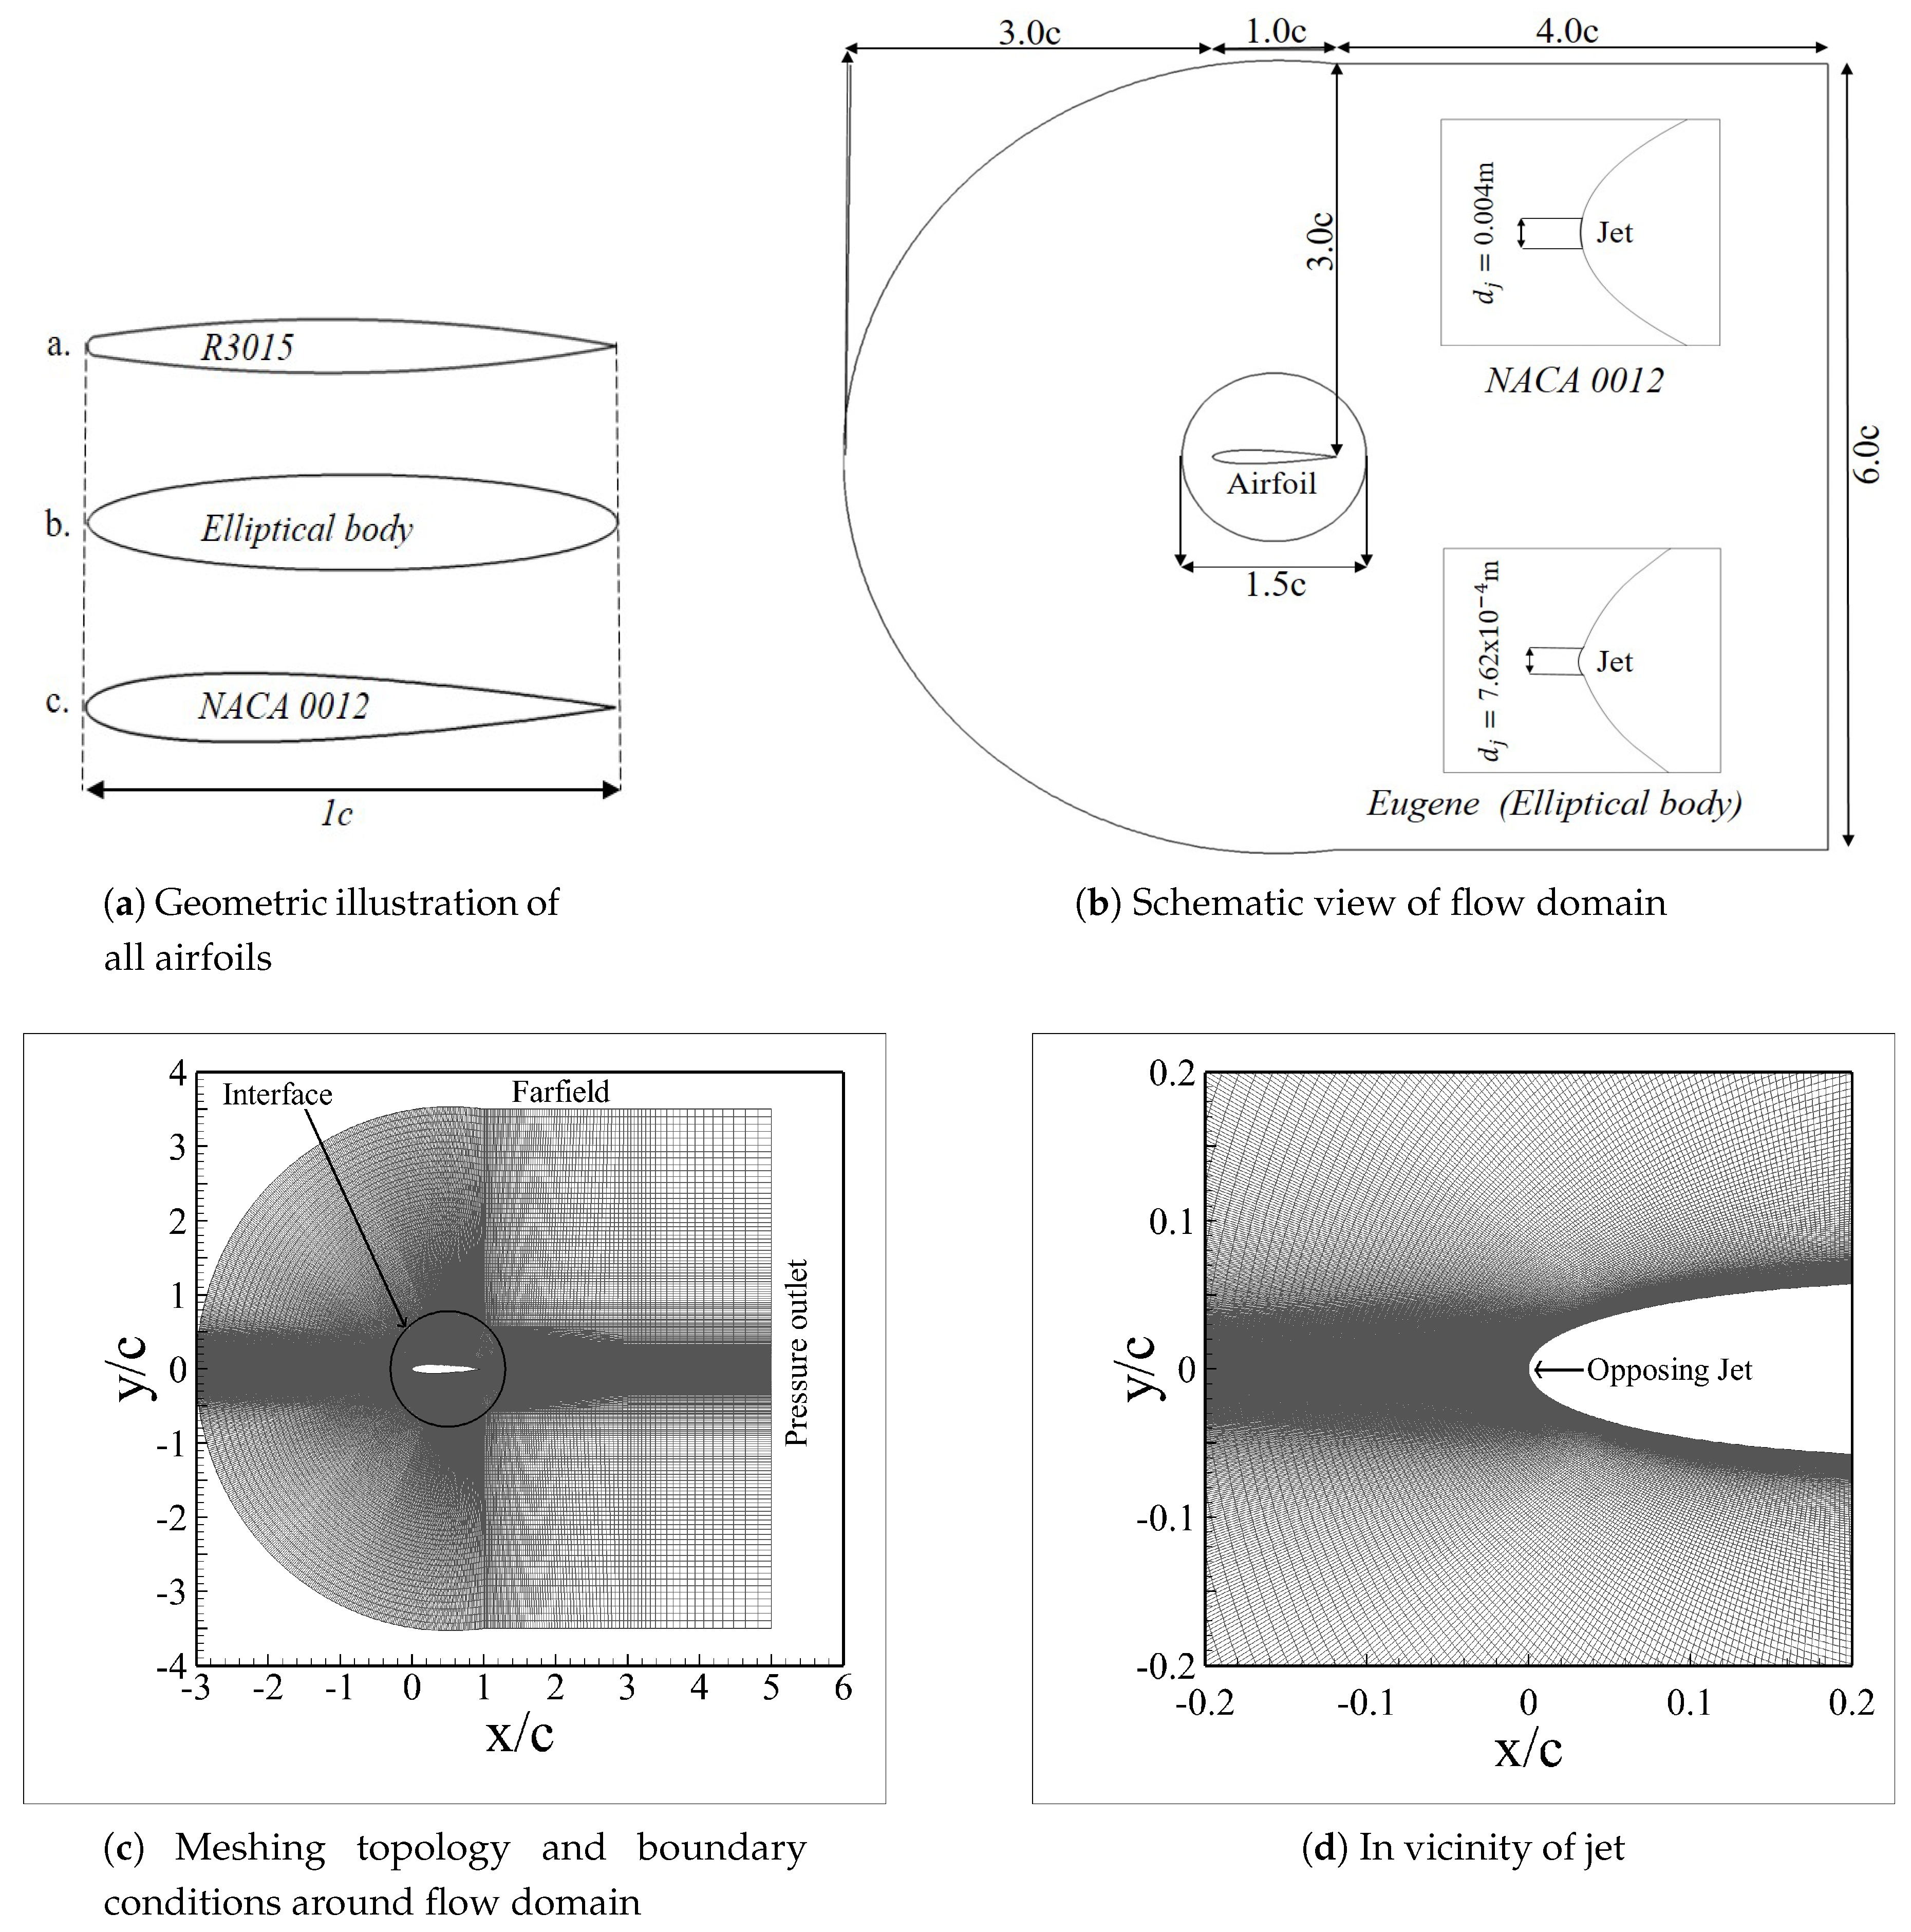
2.1. Computational Setup
2.2. Validation of Computational Setup
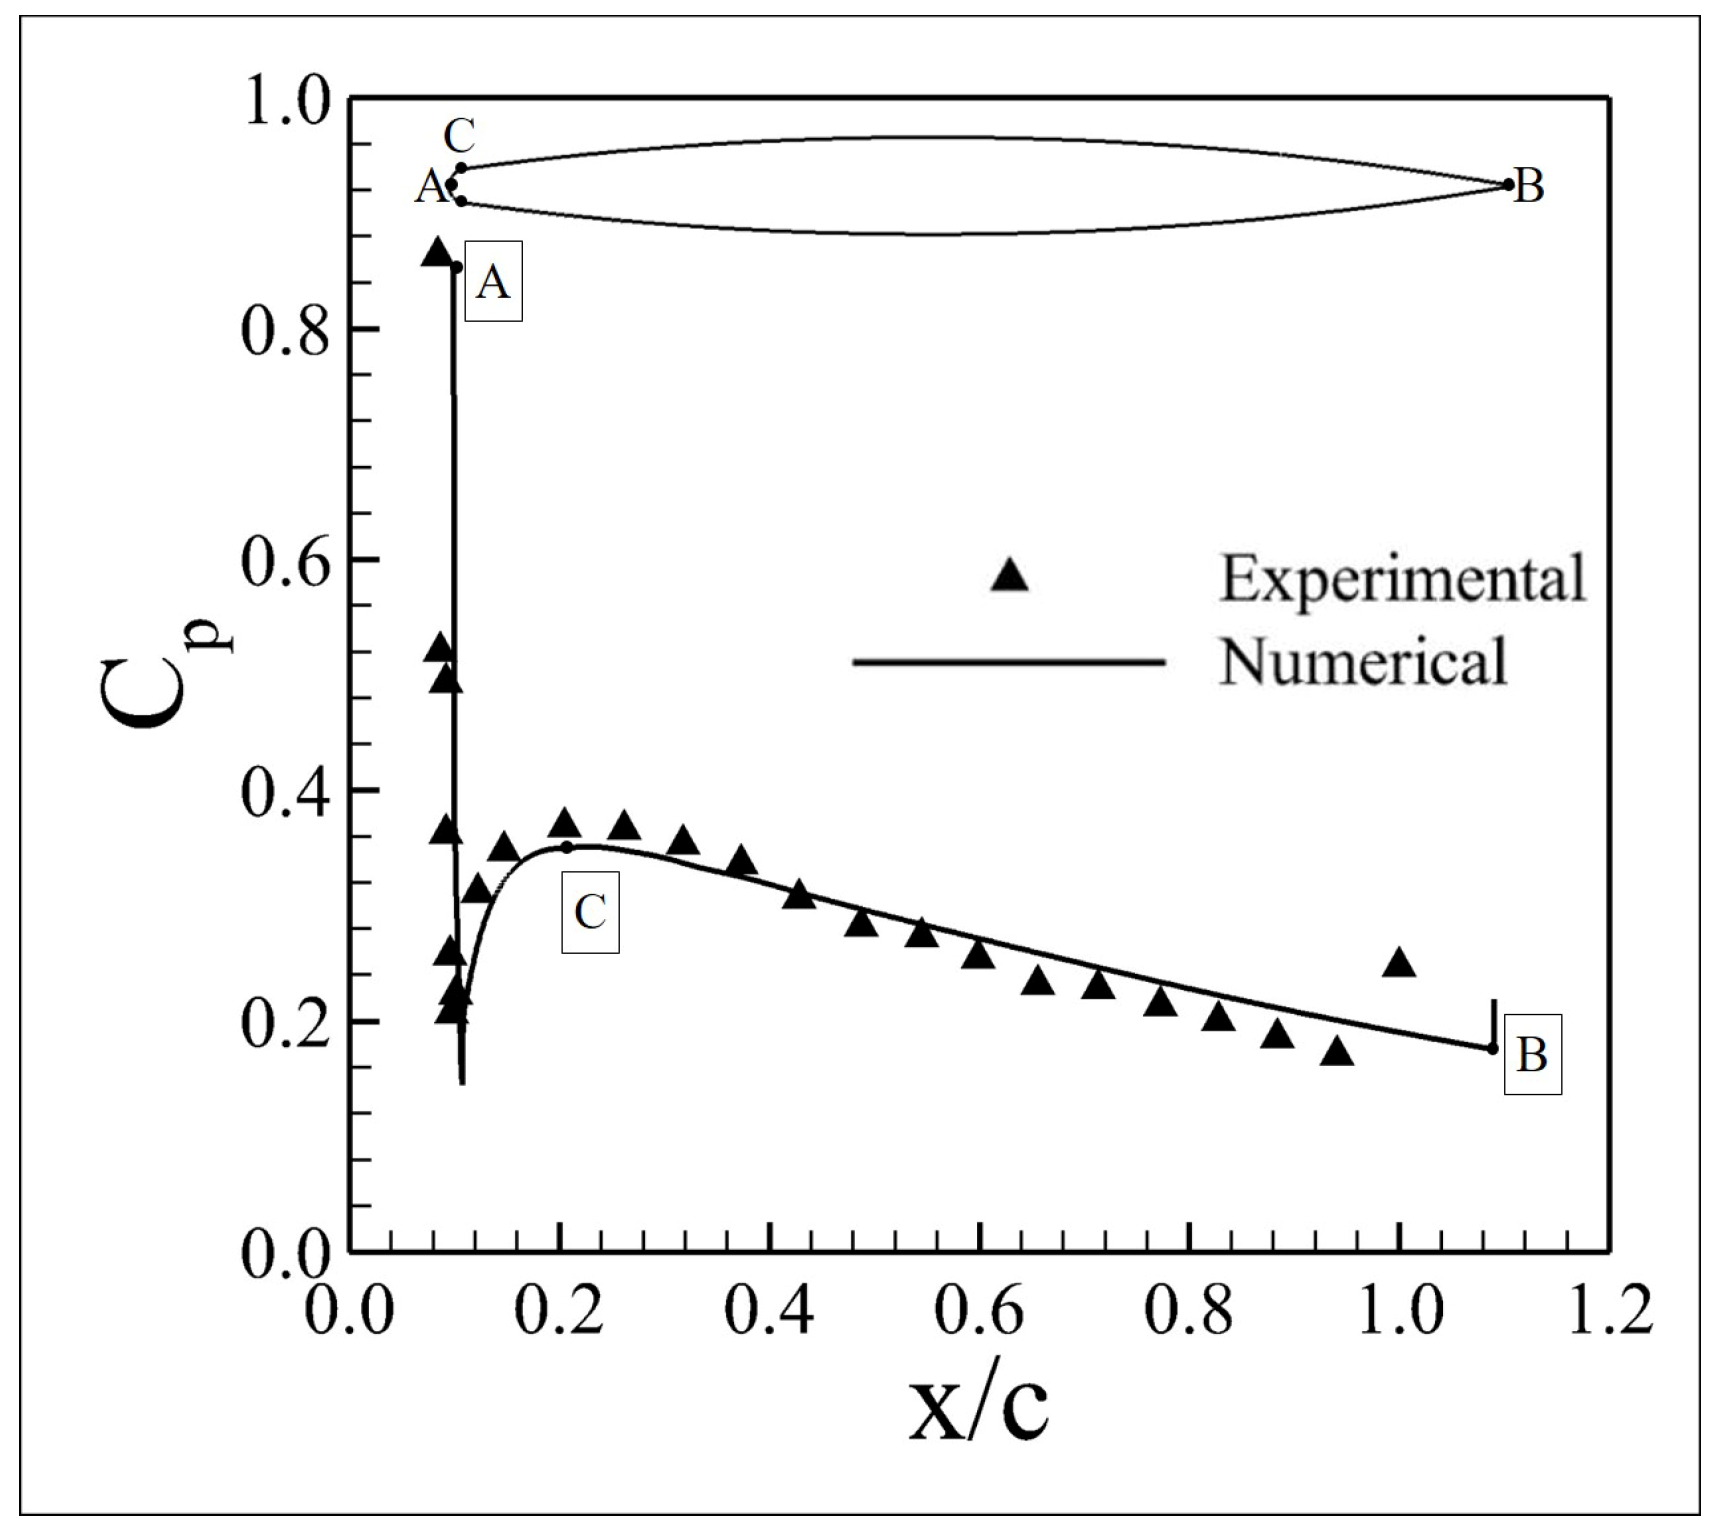
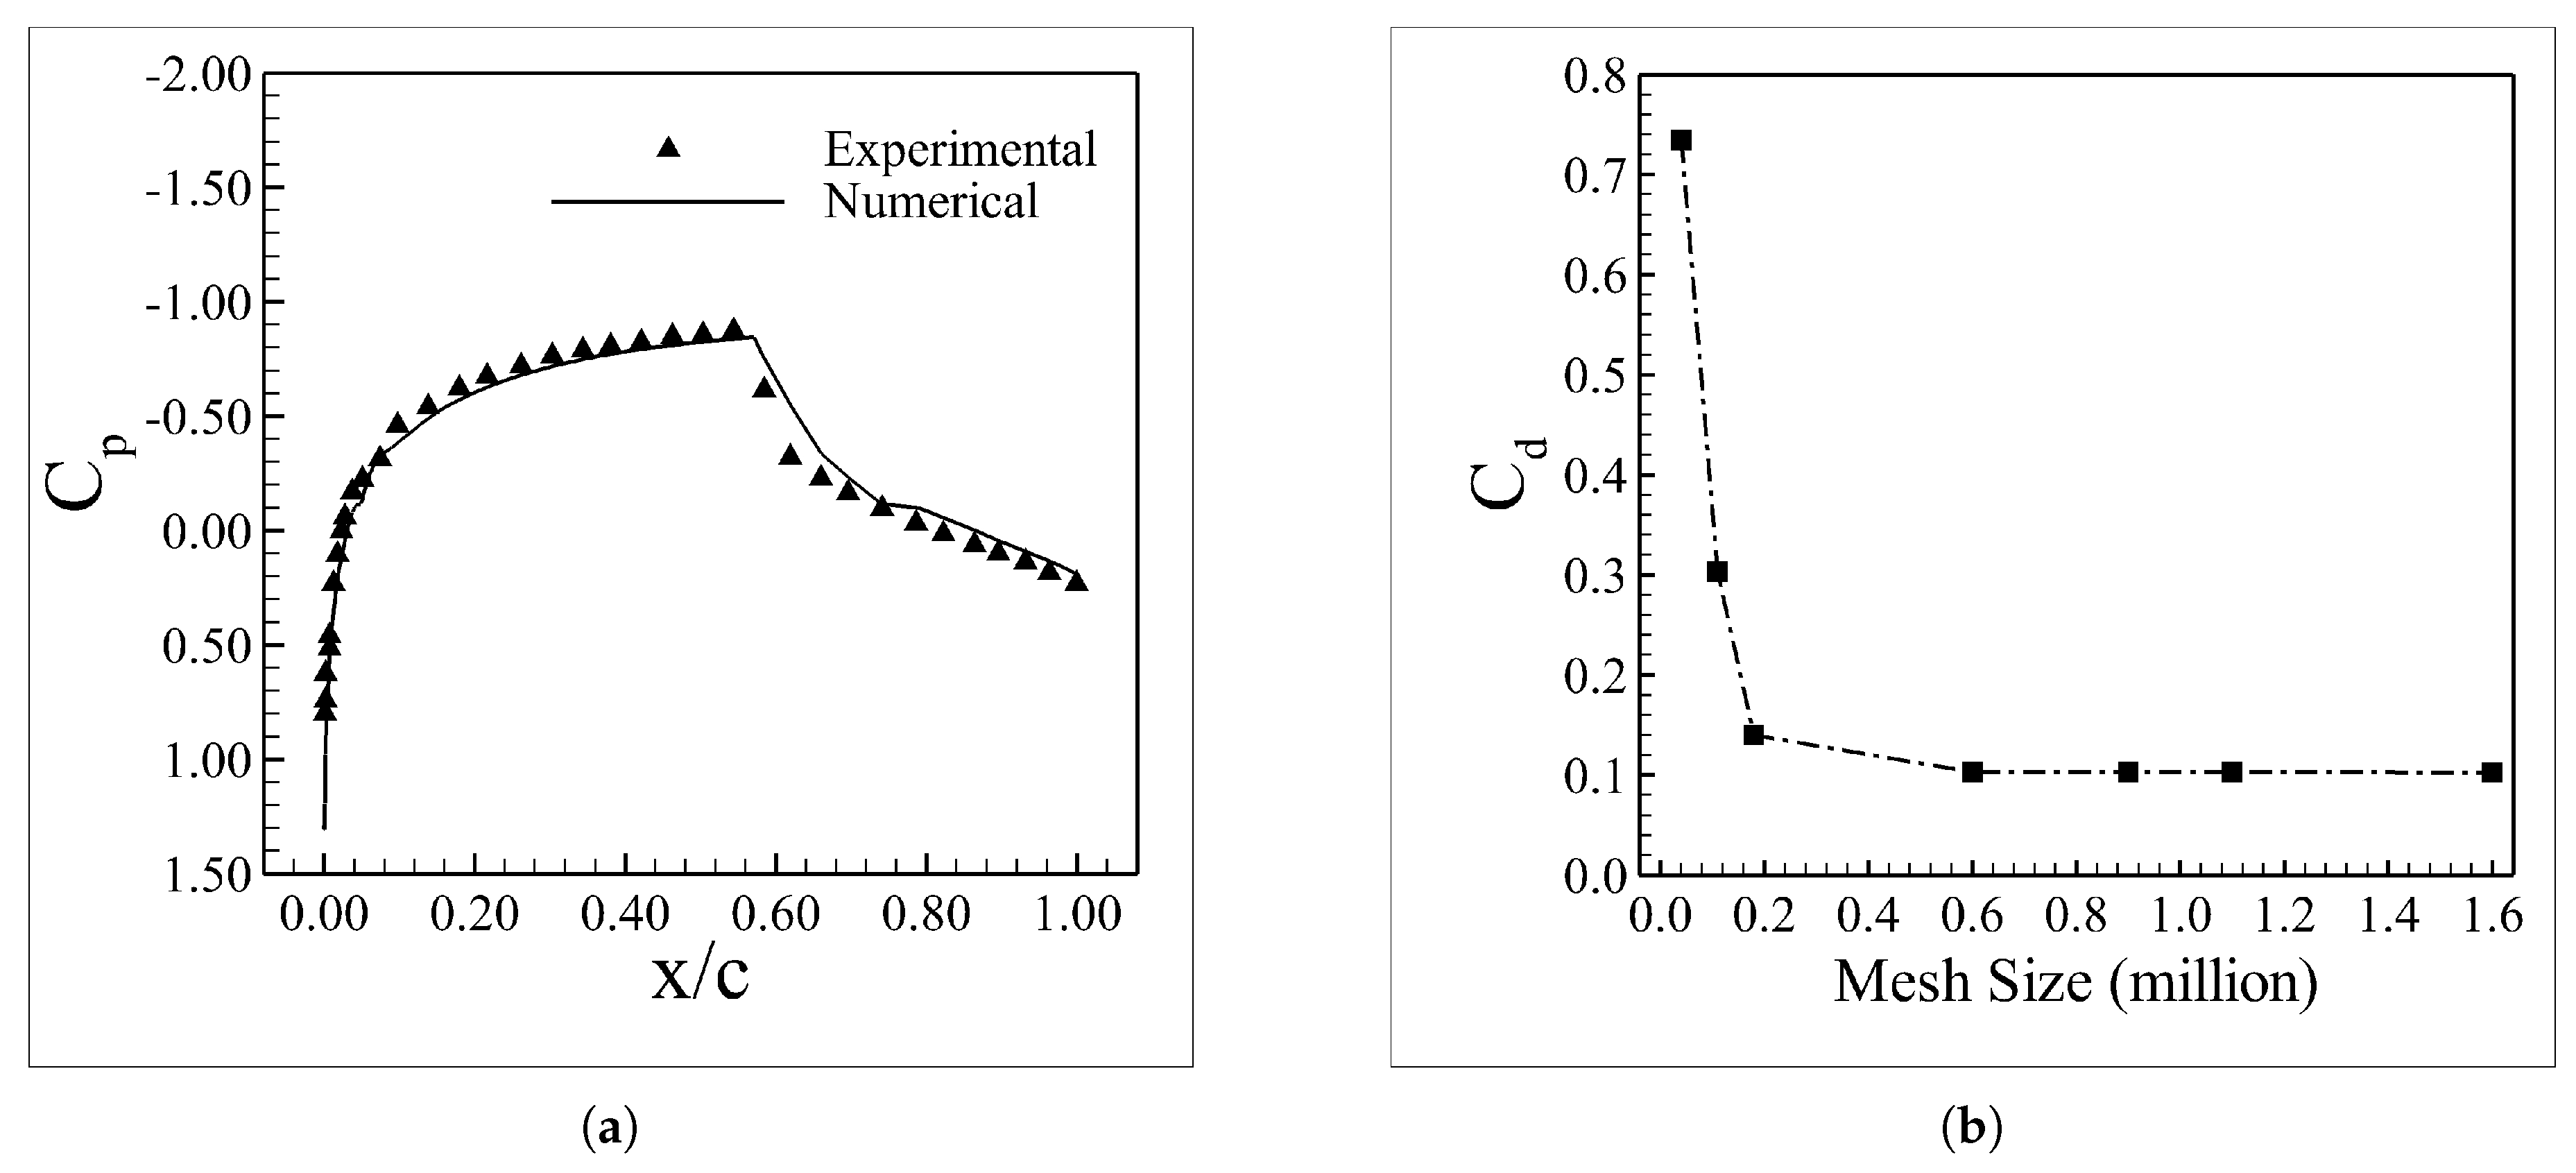
2.2.1. Validation of Supersonic Airfoil with Blunt Leading-Edge
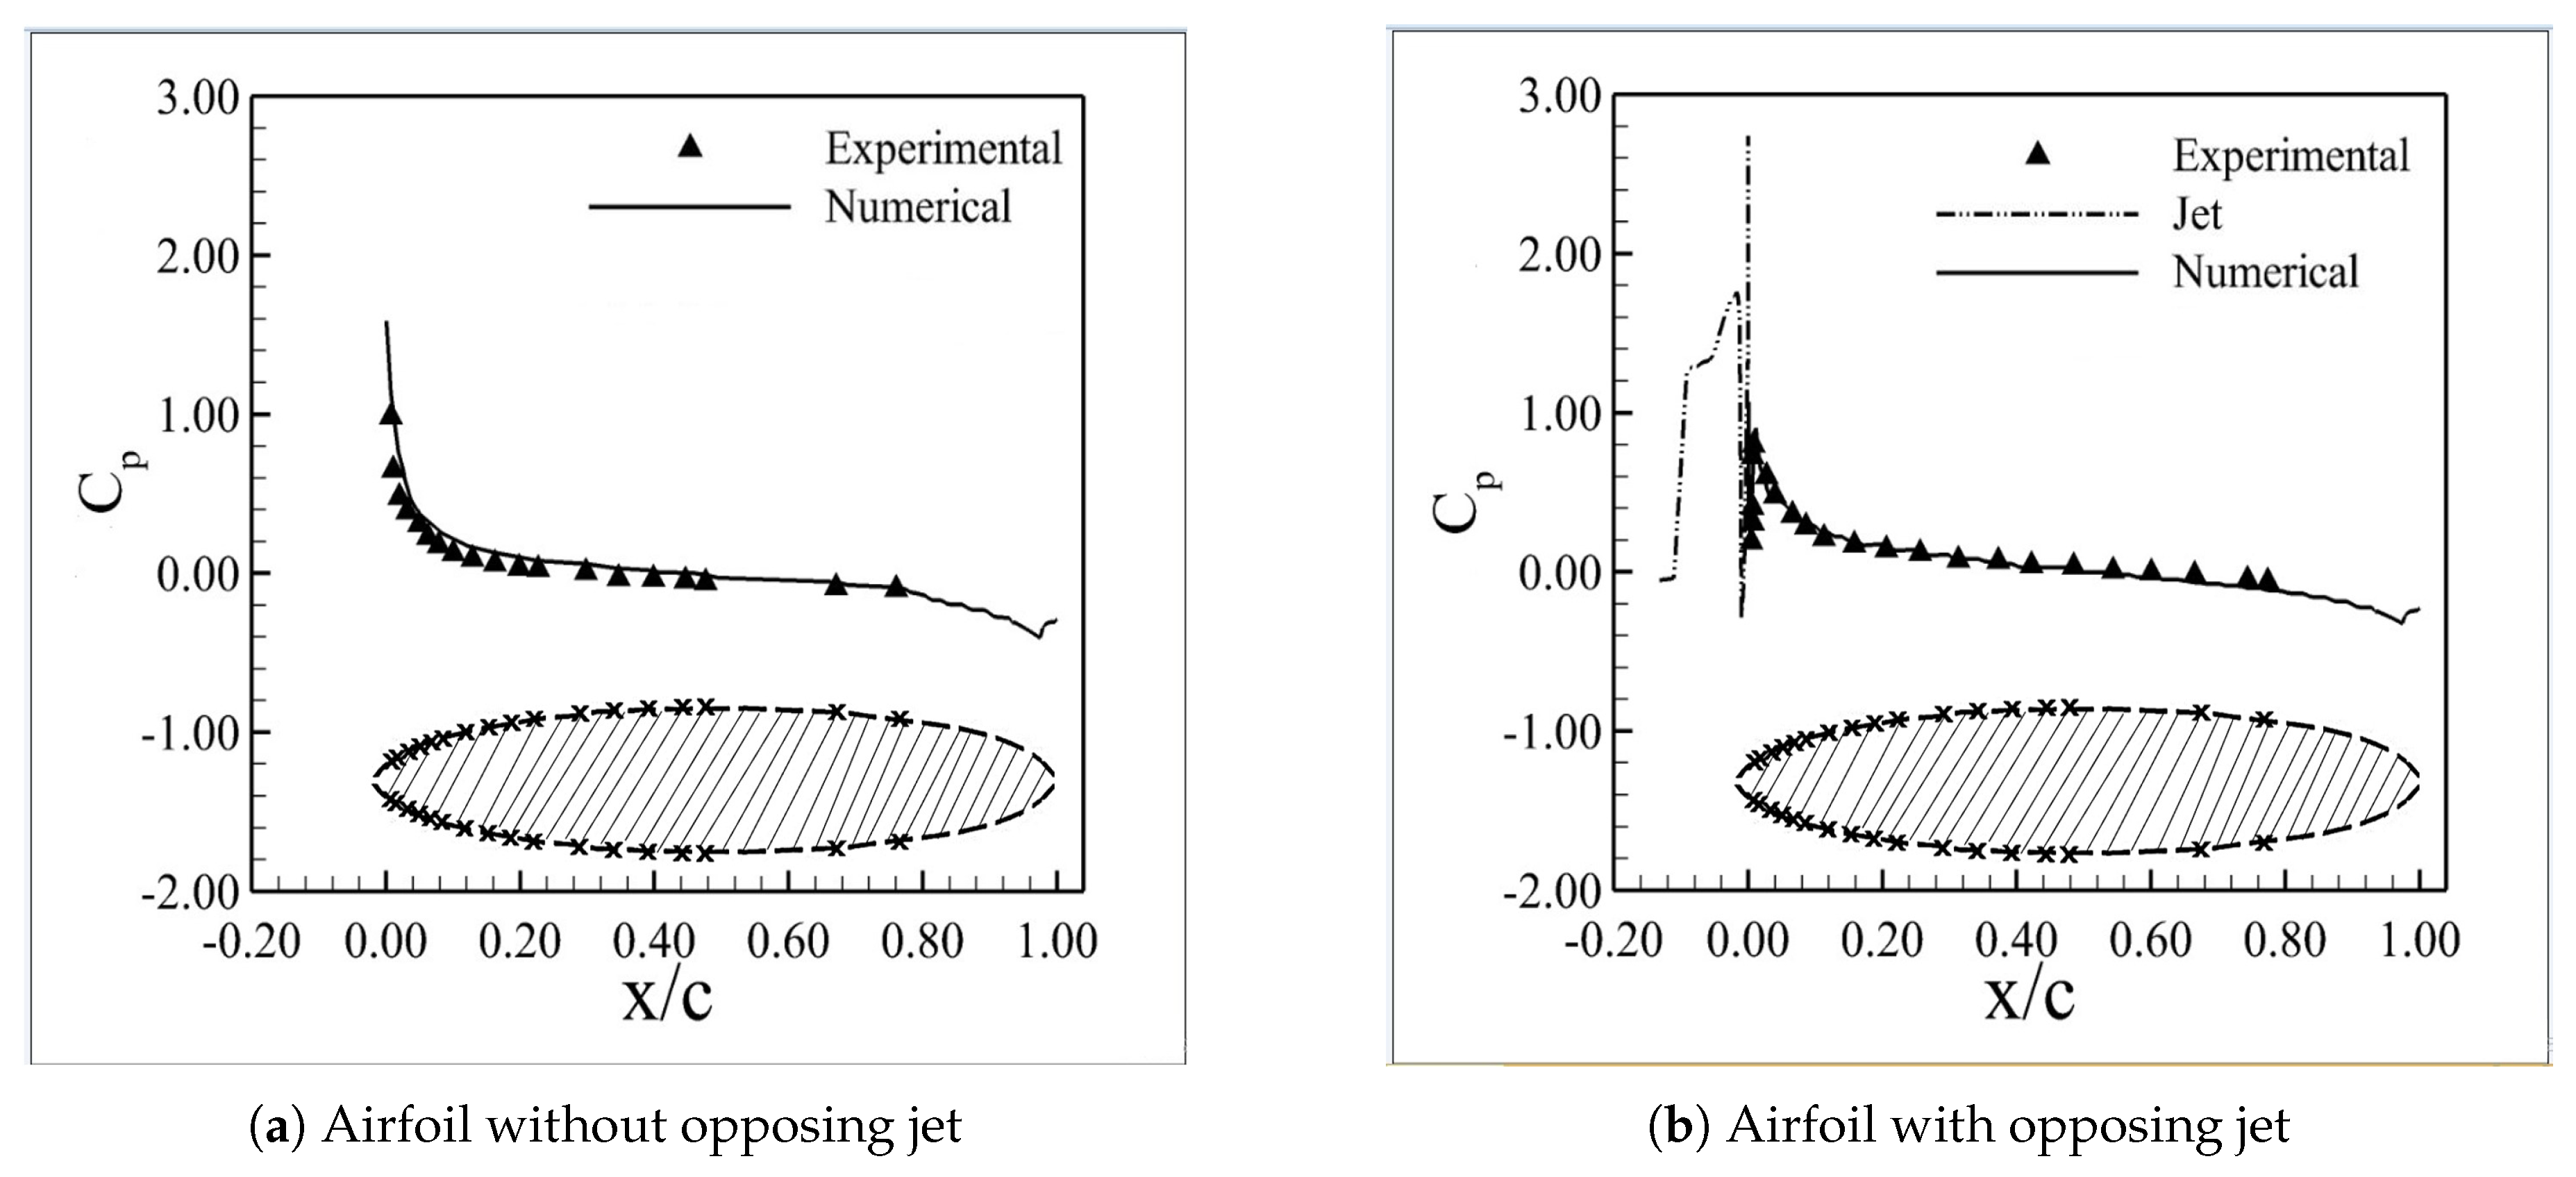
2.2.2. Modeling of Opposing Jet Flows
2.2.3. Problem Setup for NACA 0012
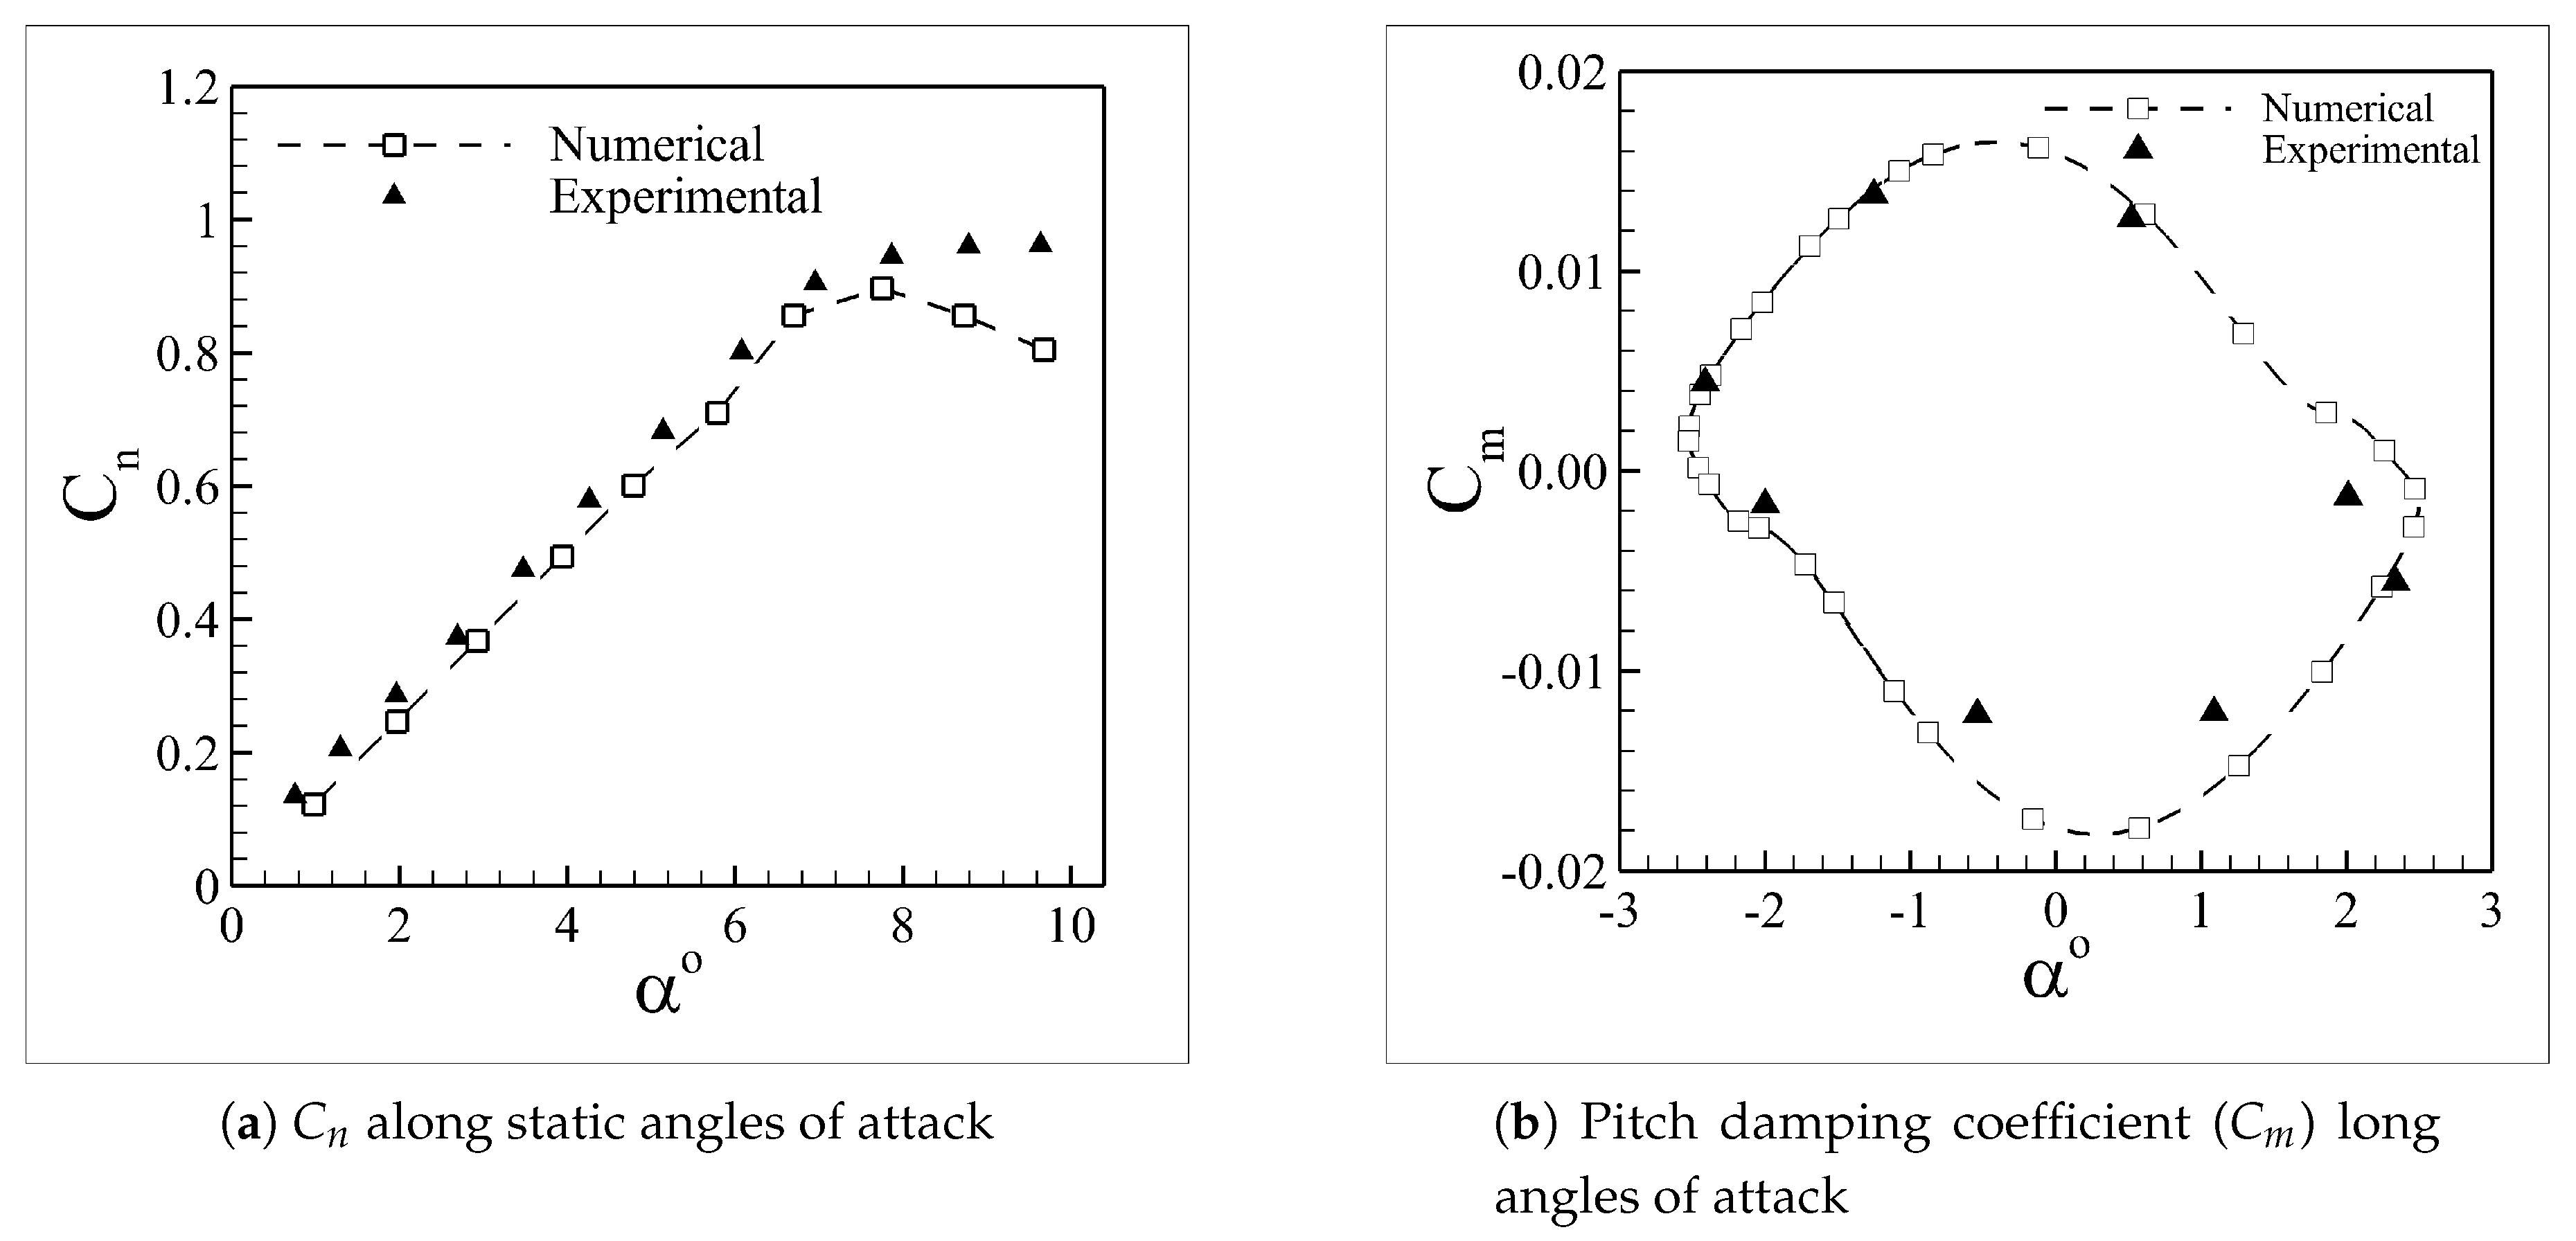
2.2.4. Validation of Stability Cases
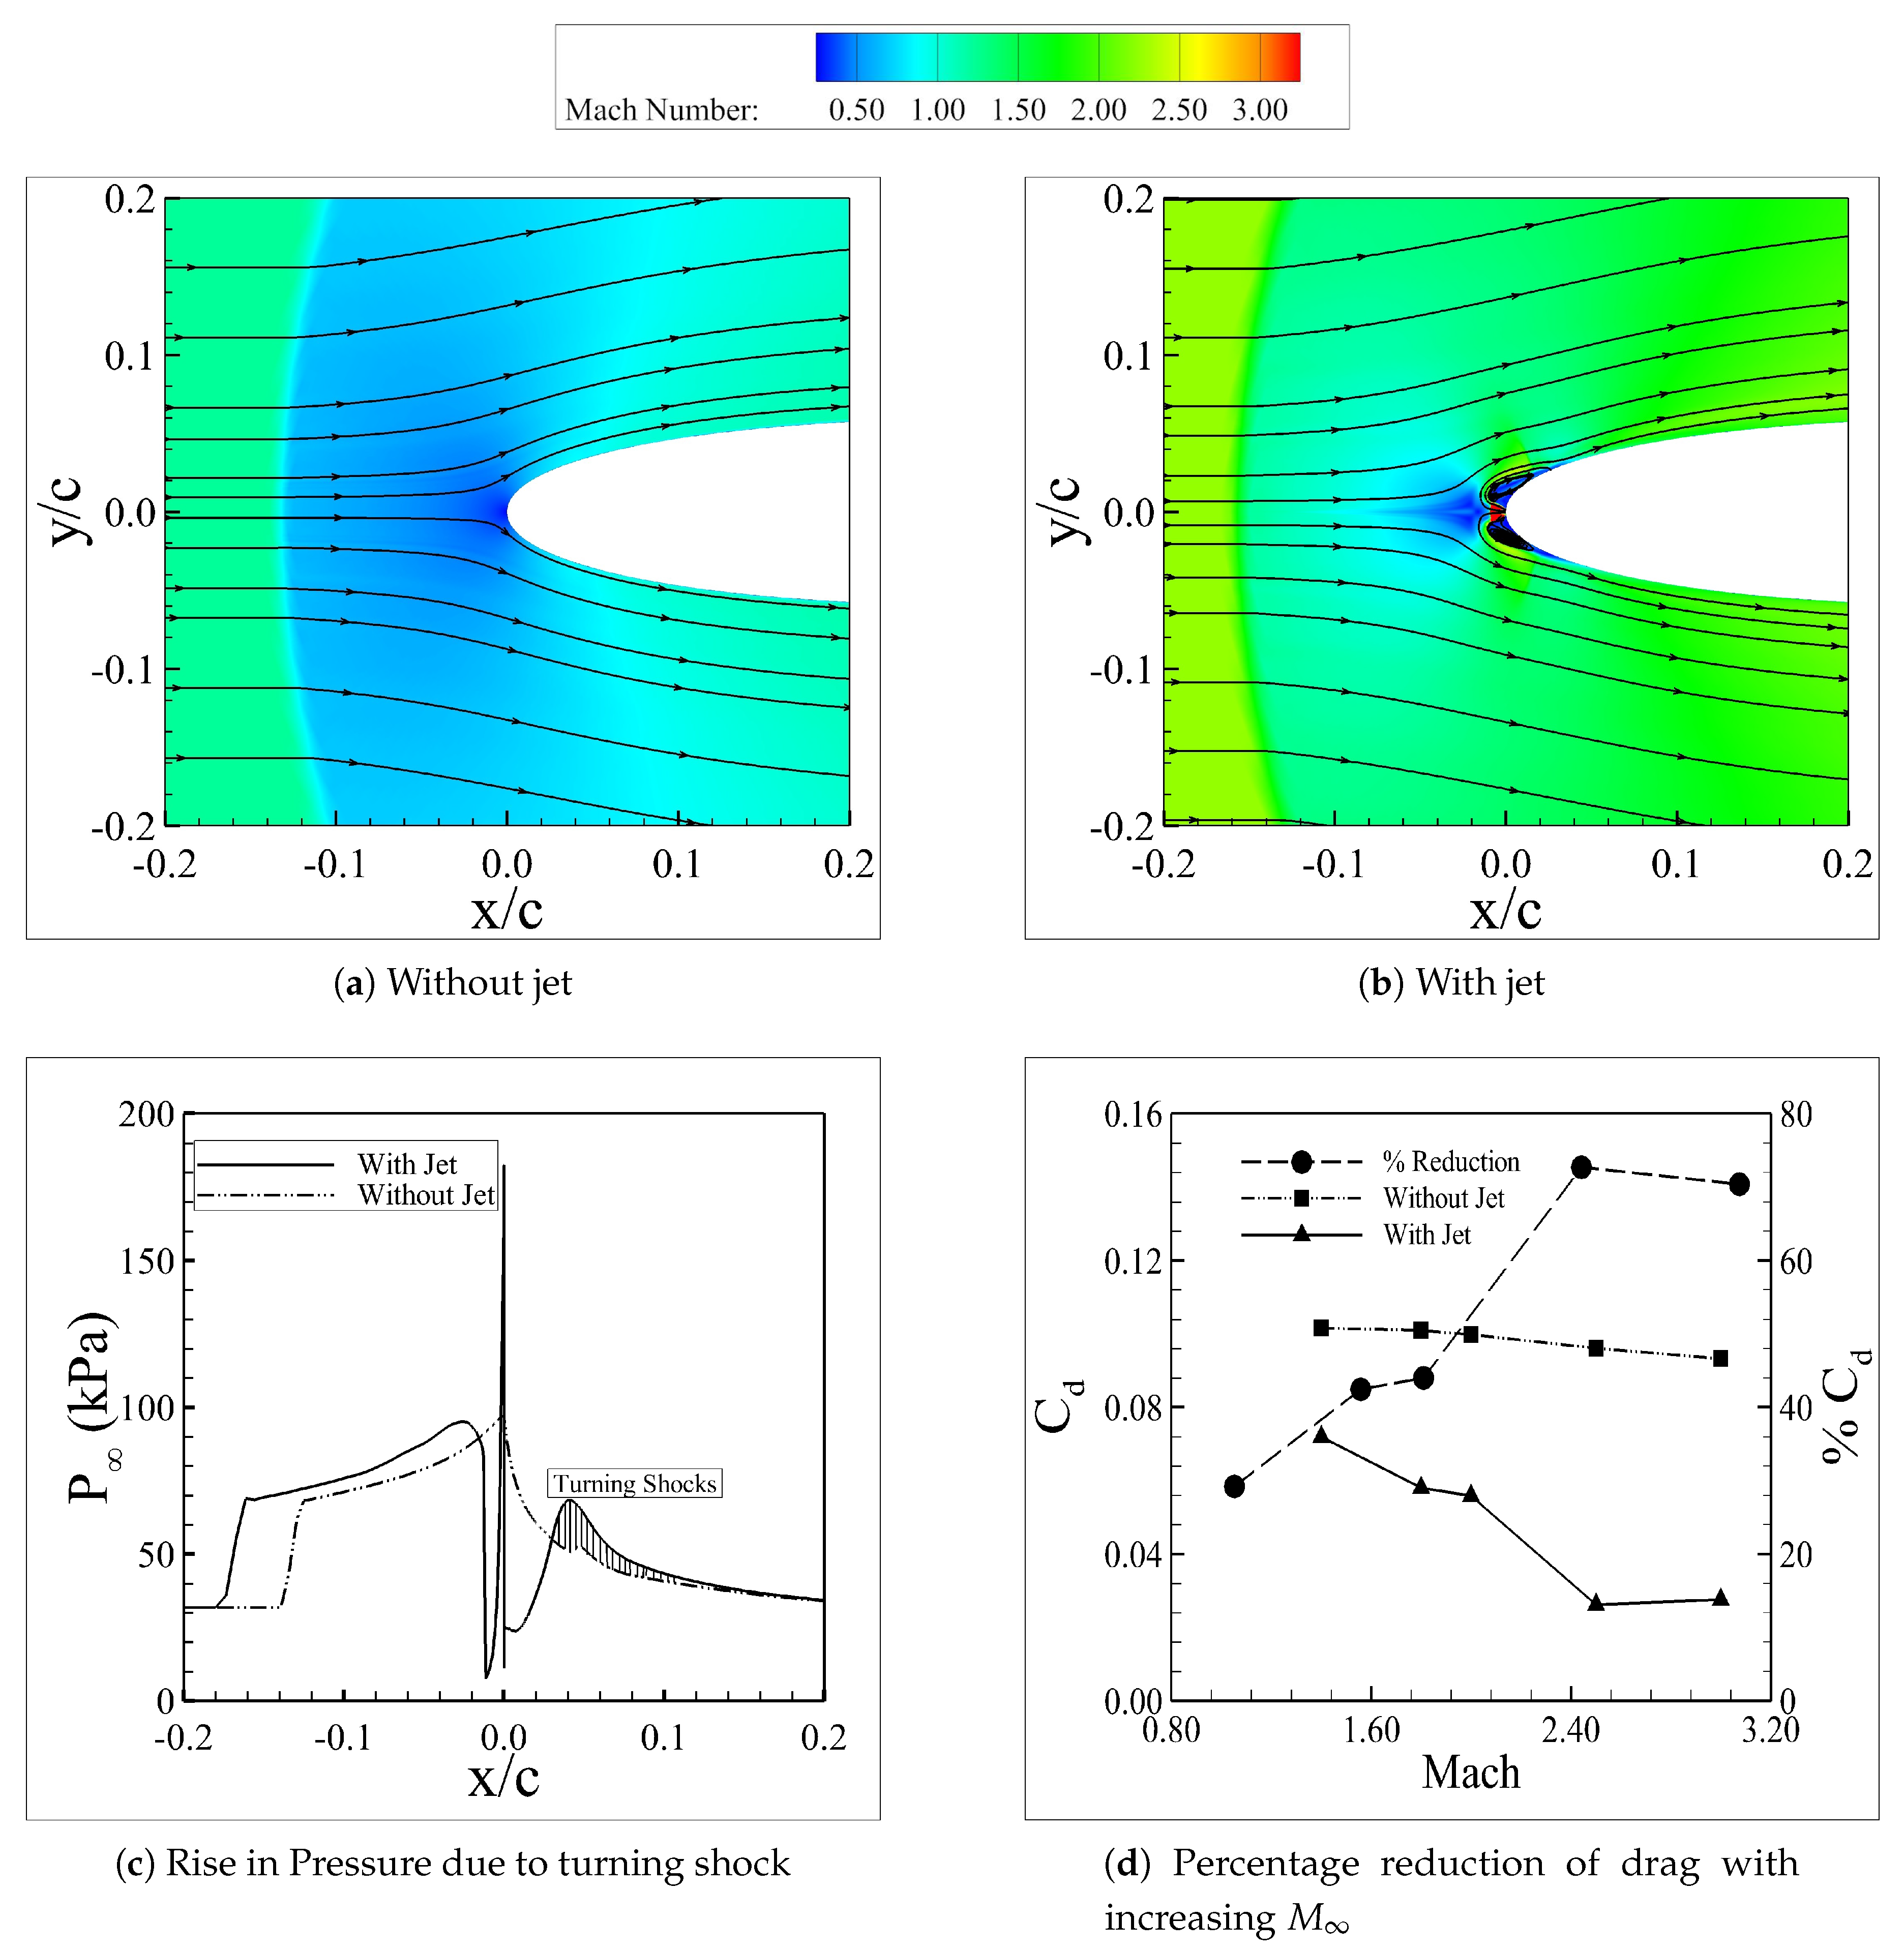
3. Flow Physics of Opposing Jet
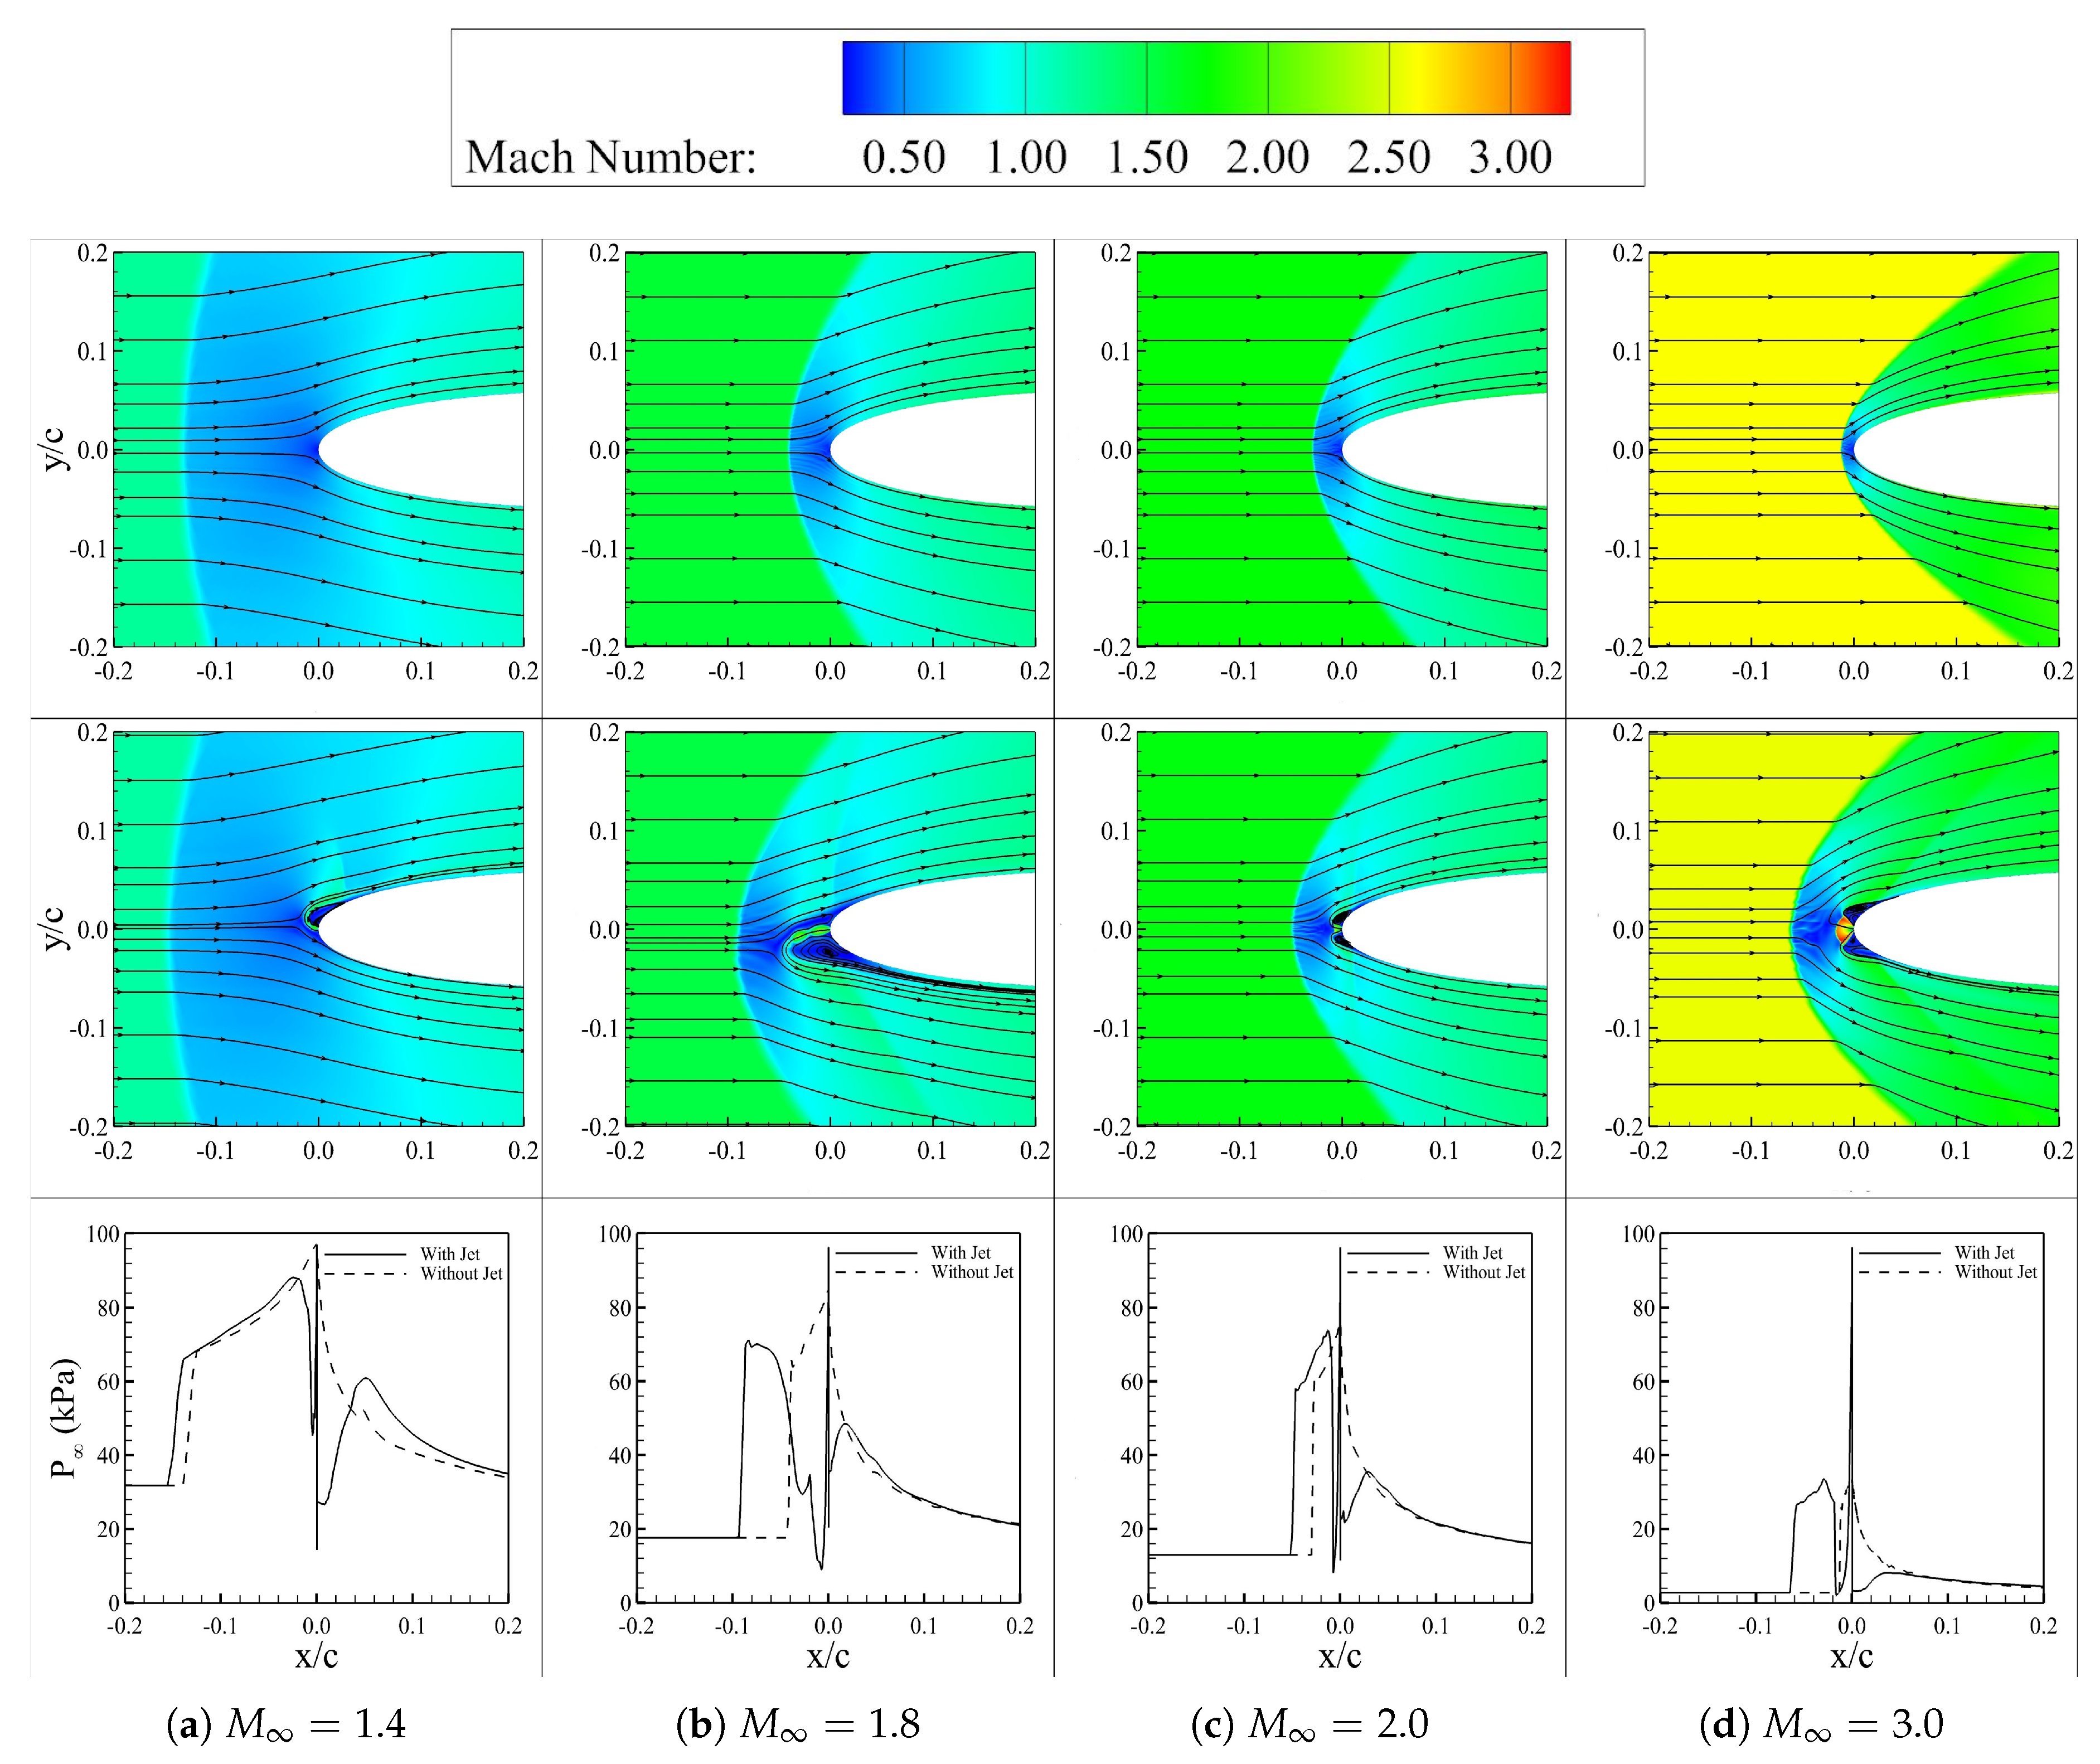
3.1. Influence of Mach Number
3.2. Pressure Ratio Effects
3.3. Angle of Attack
4. Aerodynamic Performance and Stability Analysis
5. Conclusions
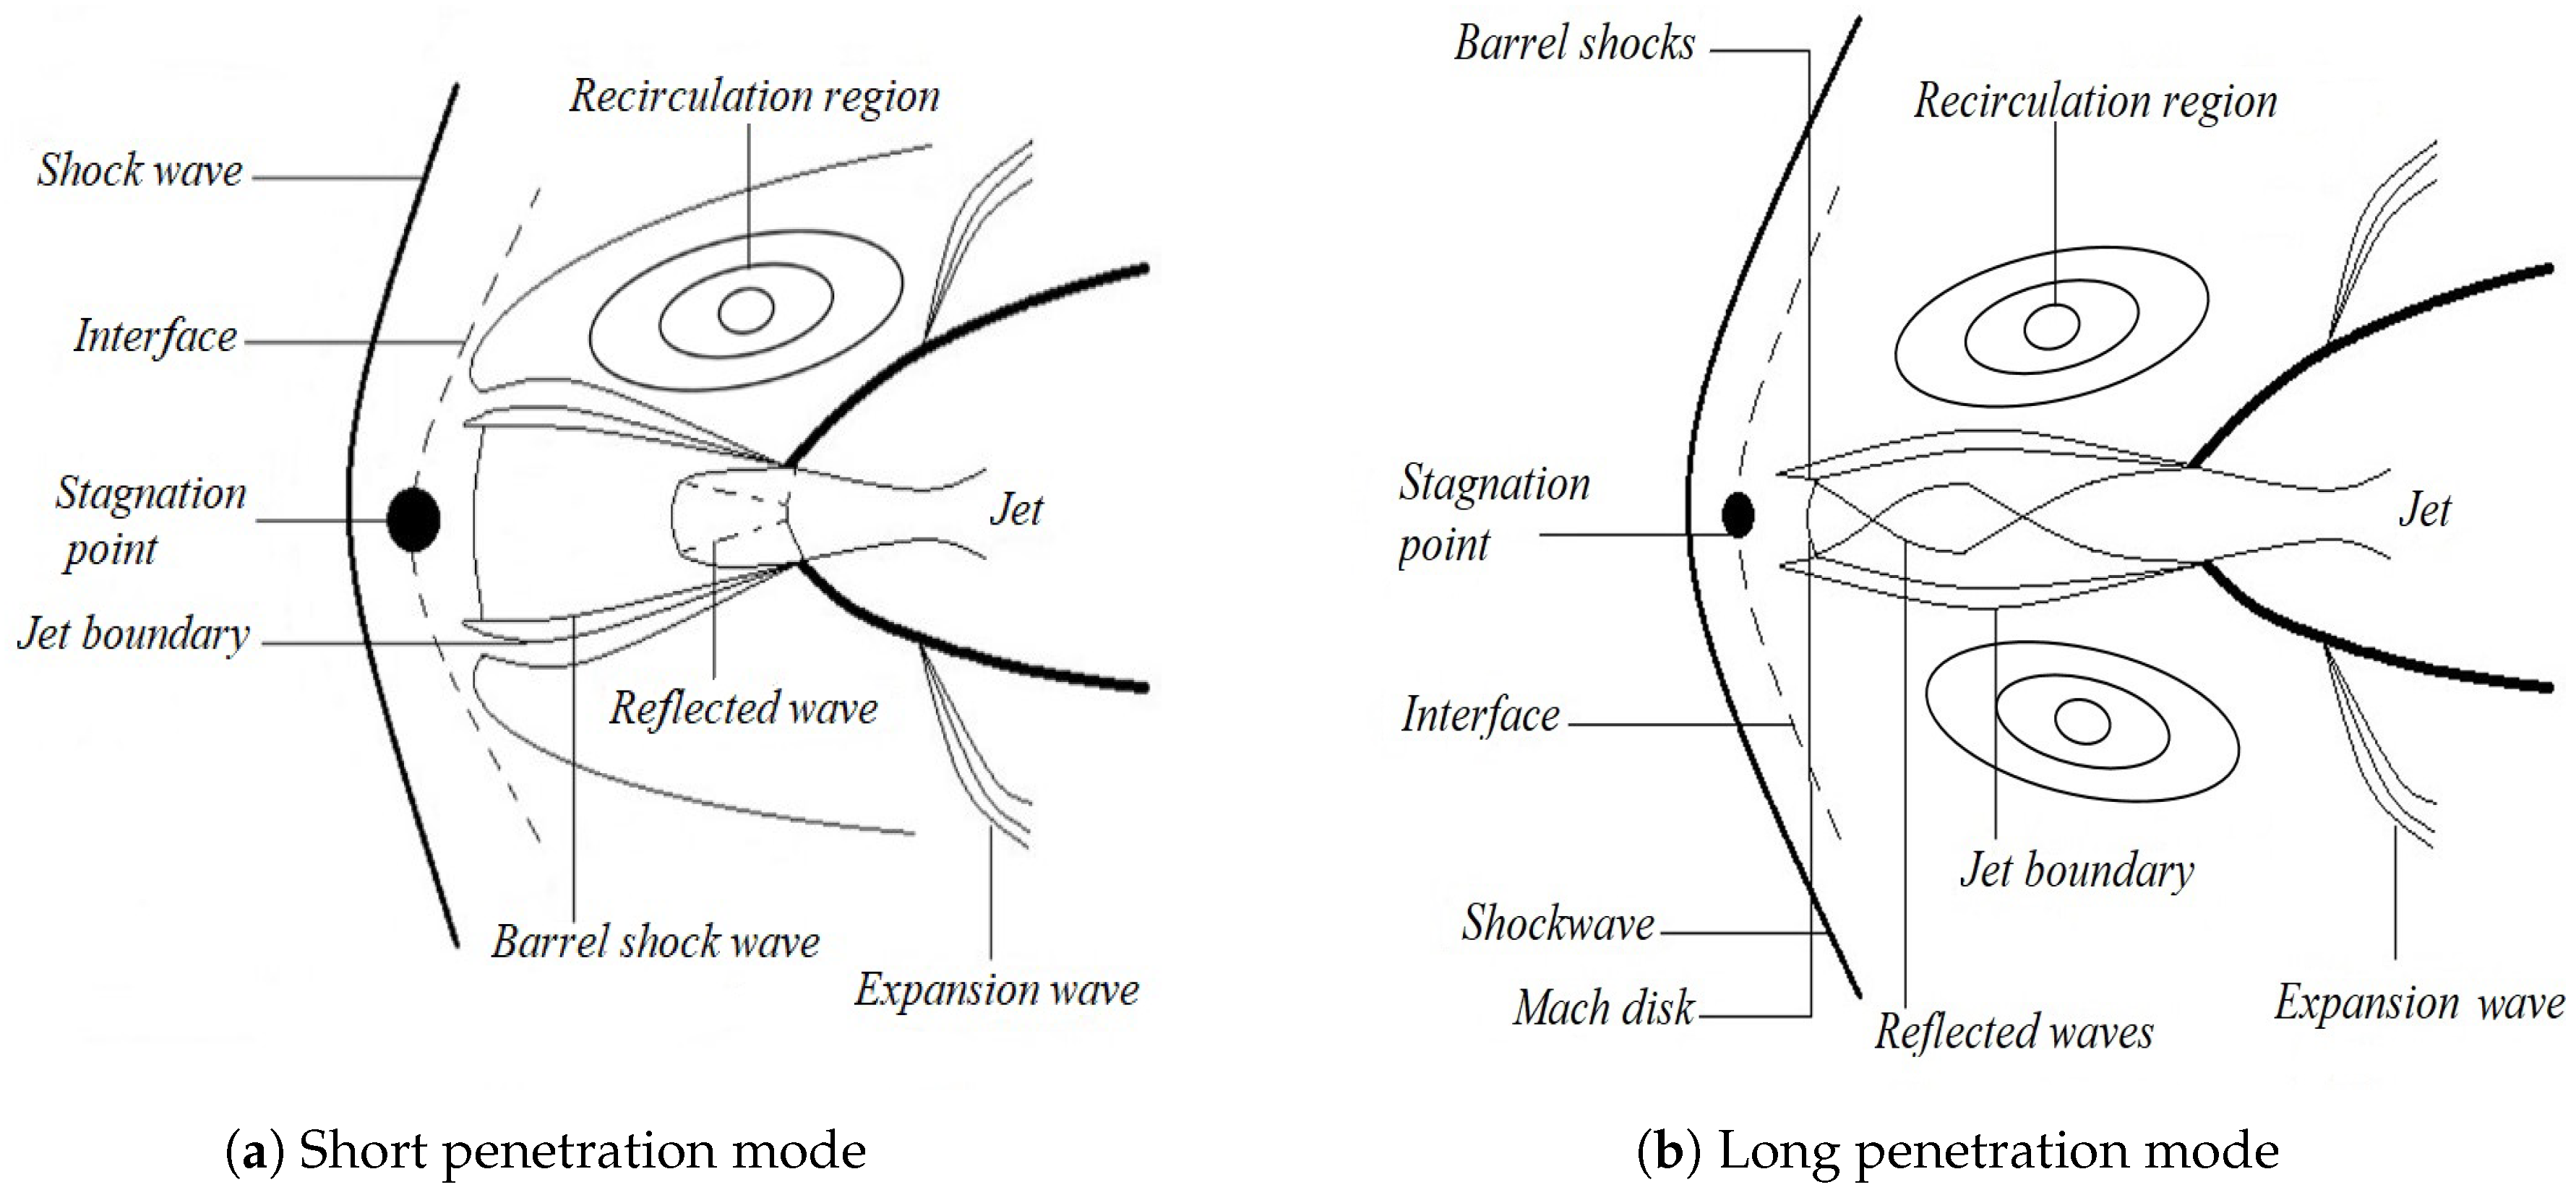
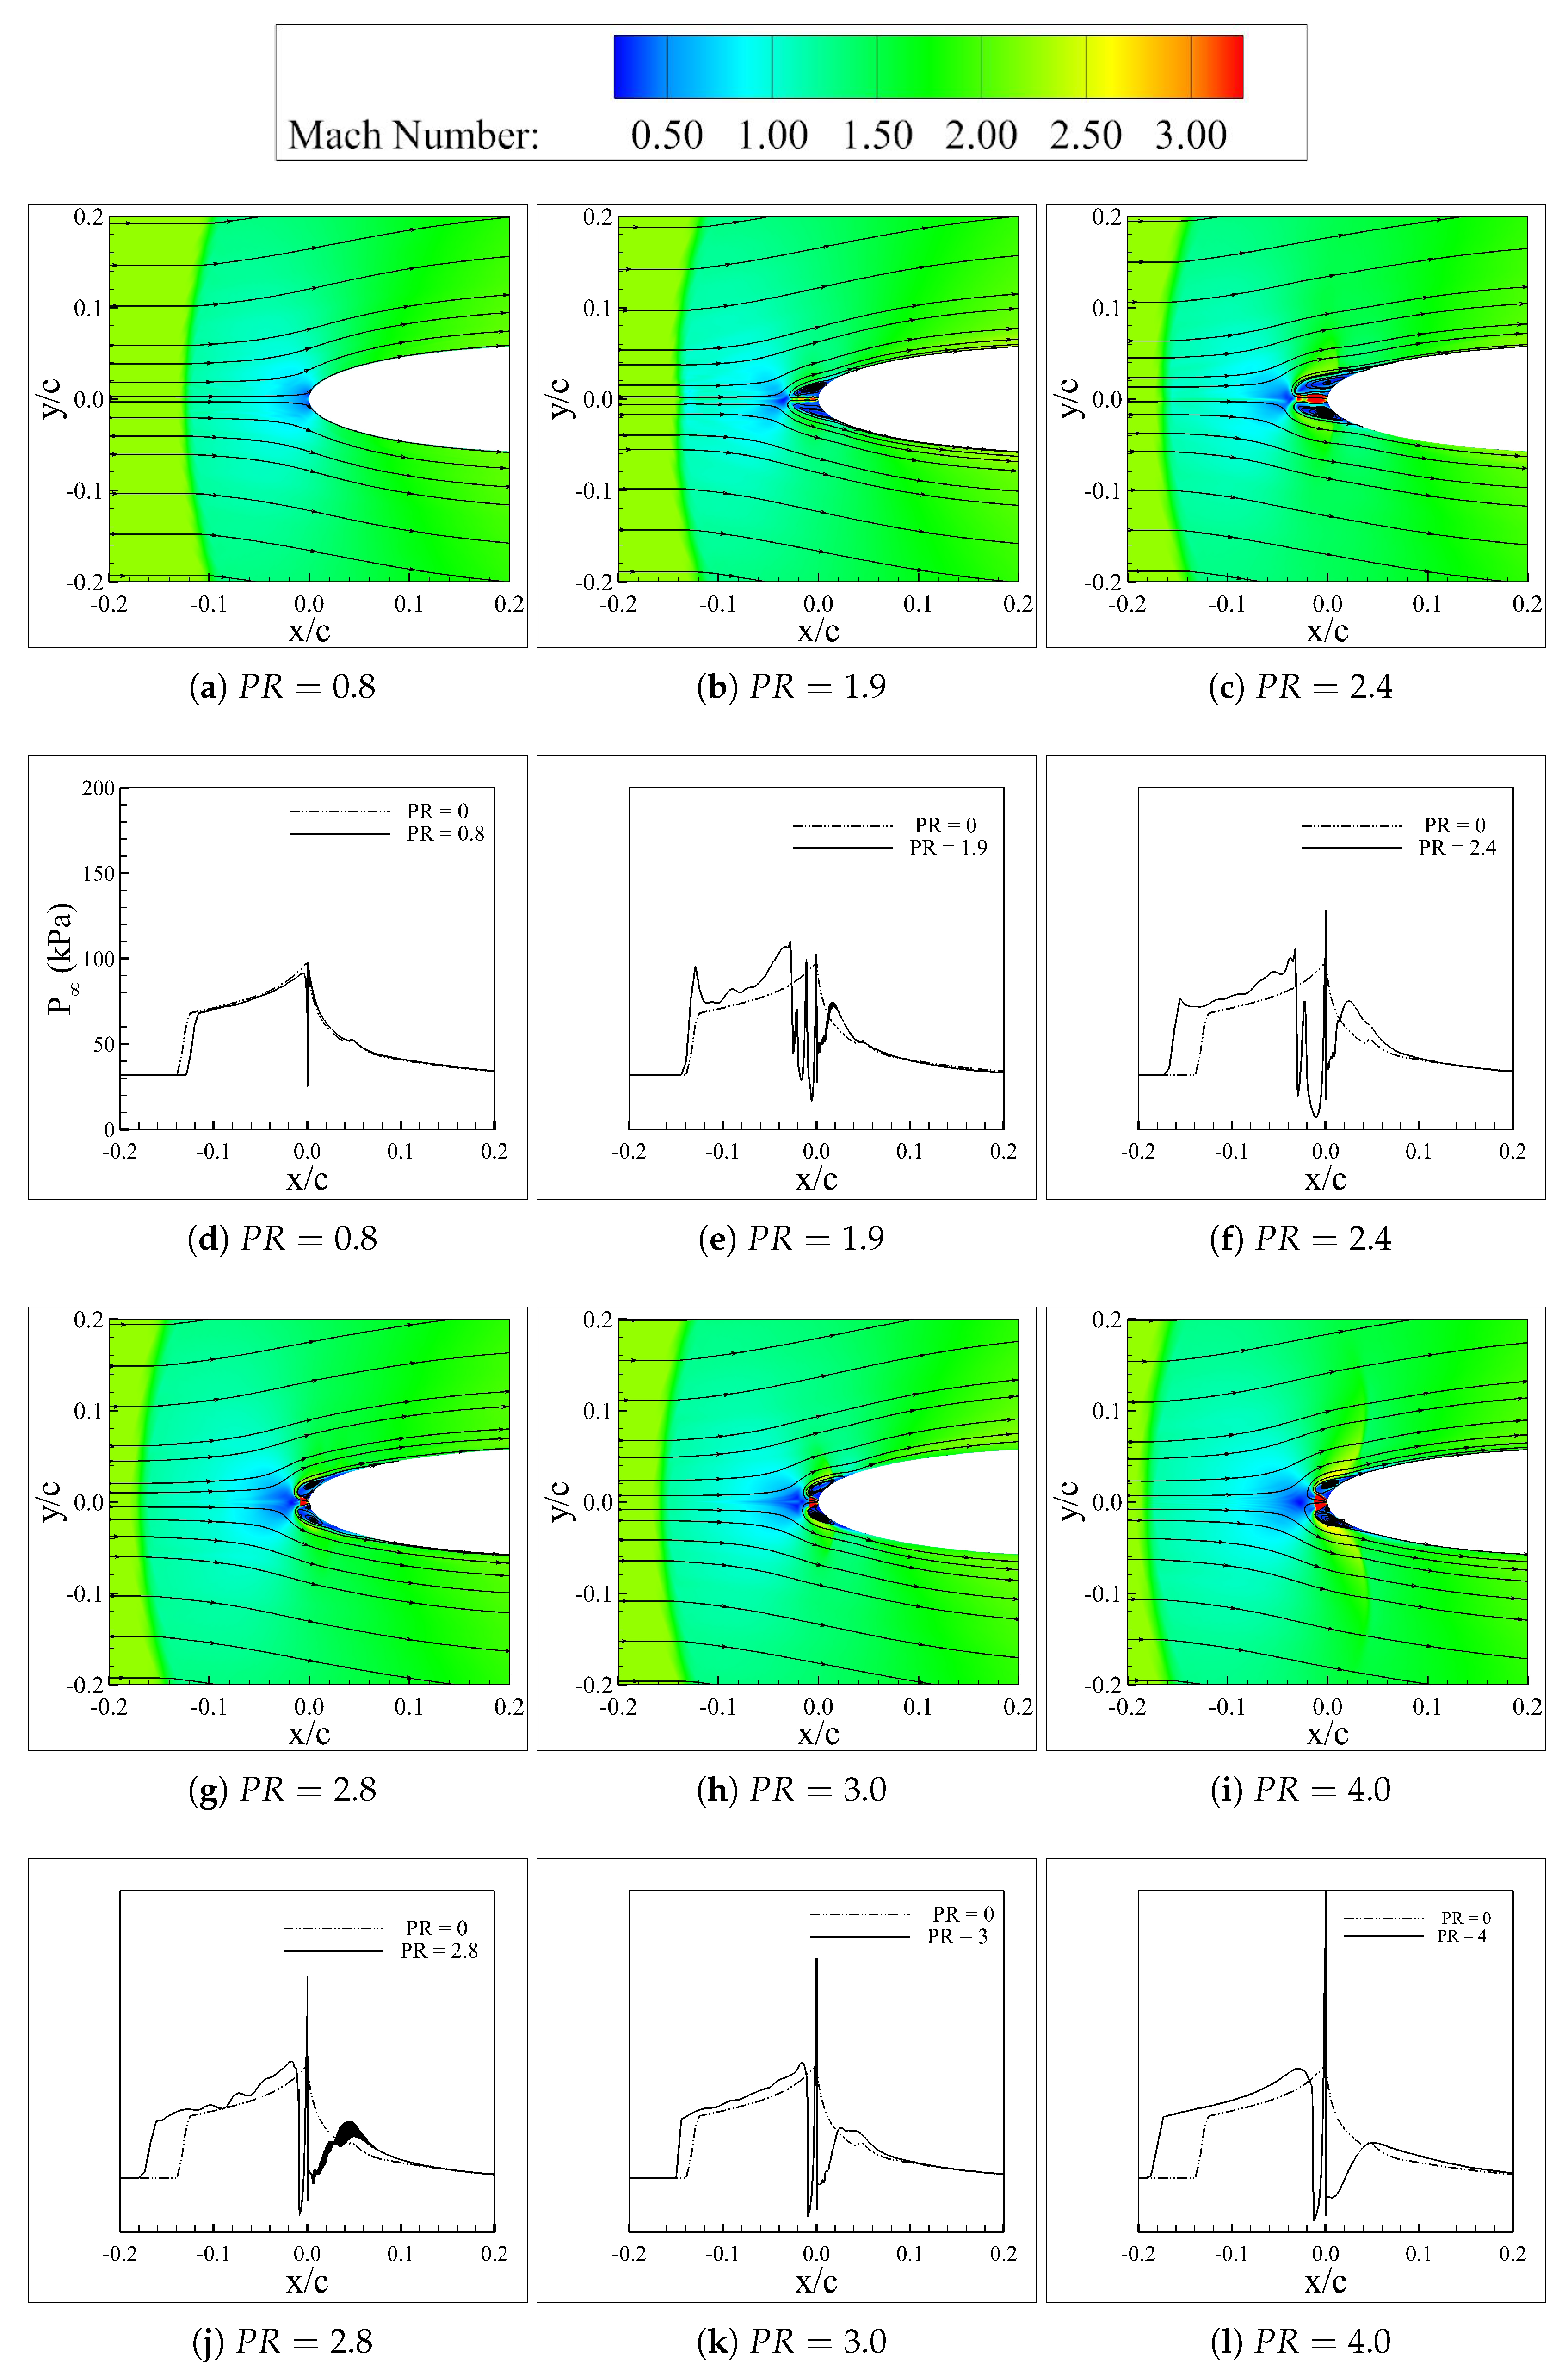
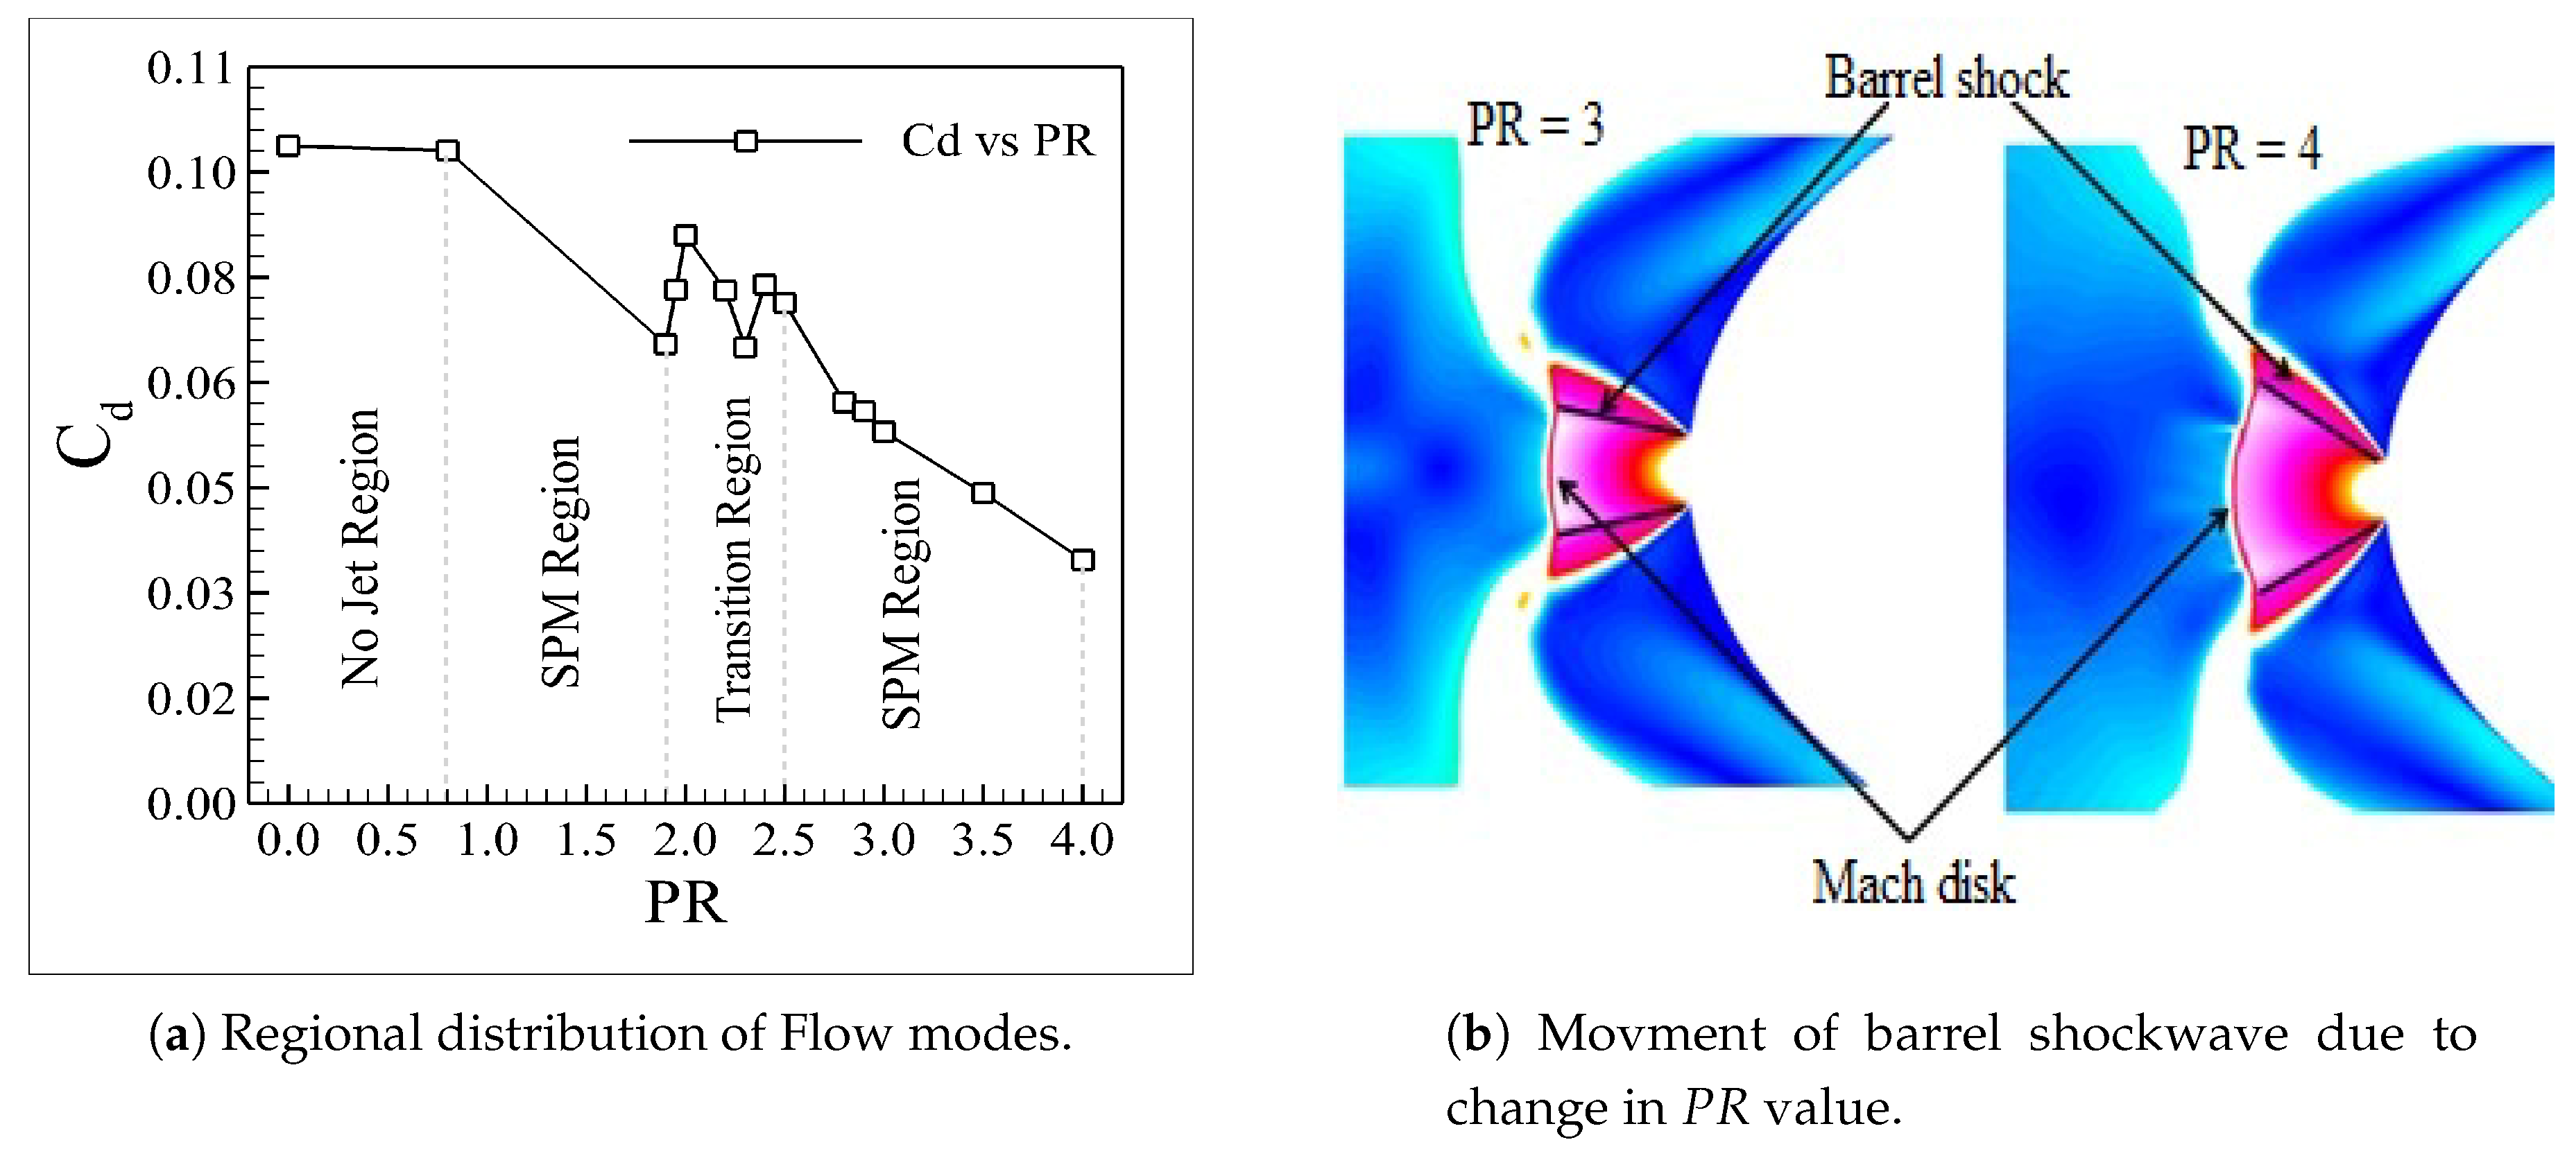
- The pressure ratio () is the key parameter that affects the counter flow jet. The LPM exists in a smaller range of pressure ratios (2.4); it produces a long shock standoff distance. As the pressure ratio is beyond the threshold value, the counter flow jet transmits its flow variation from LPM to SPM ( = 3).
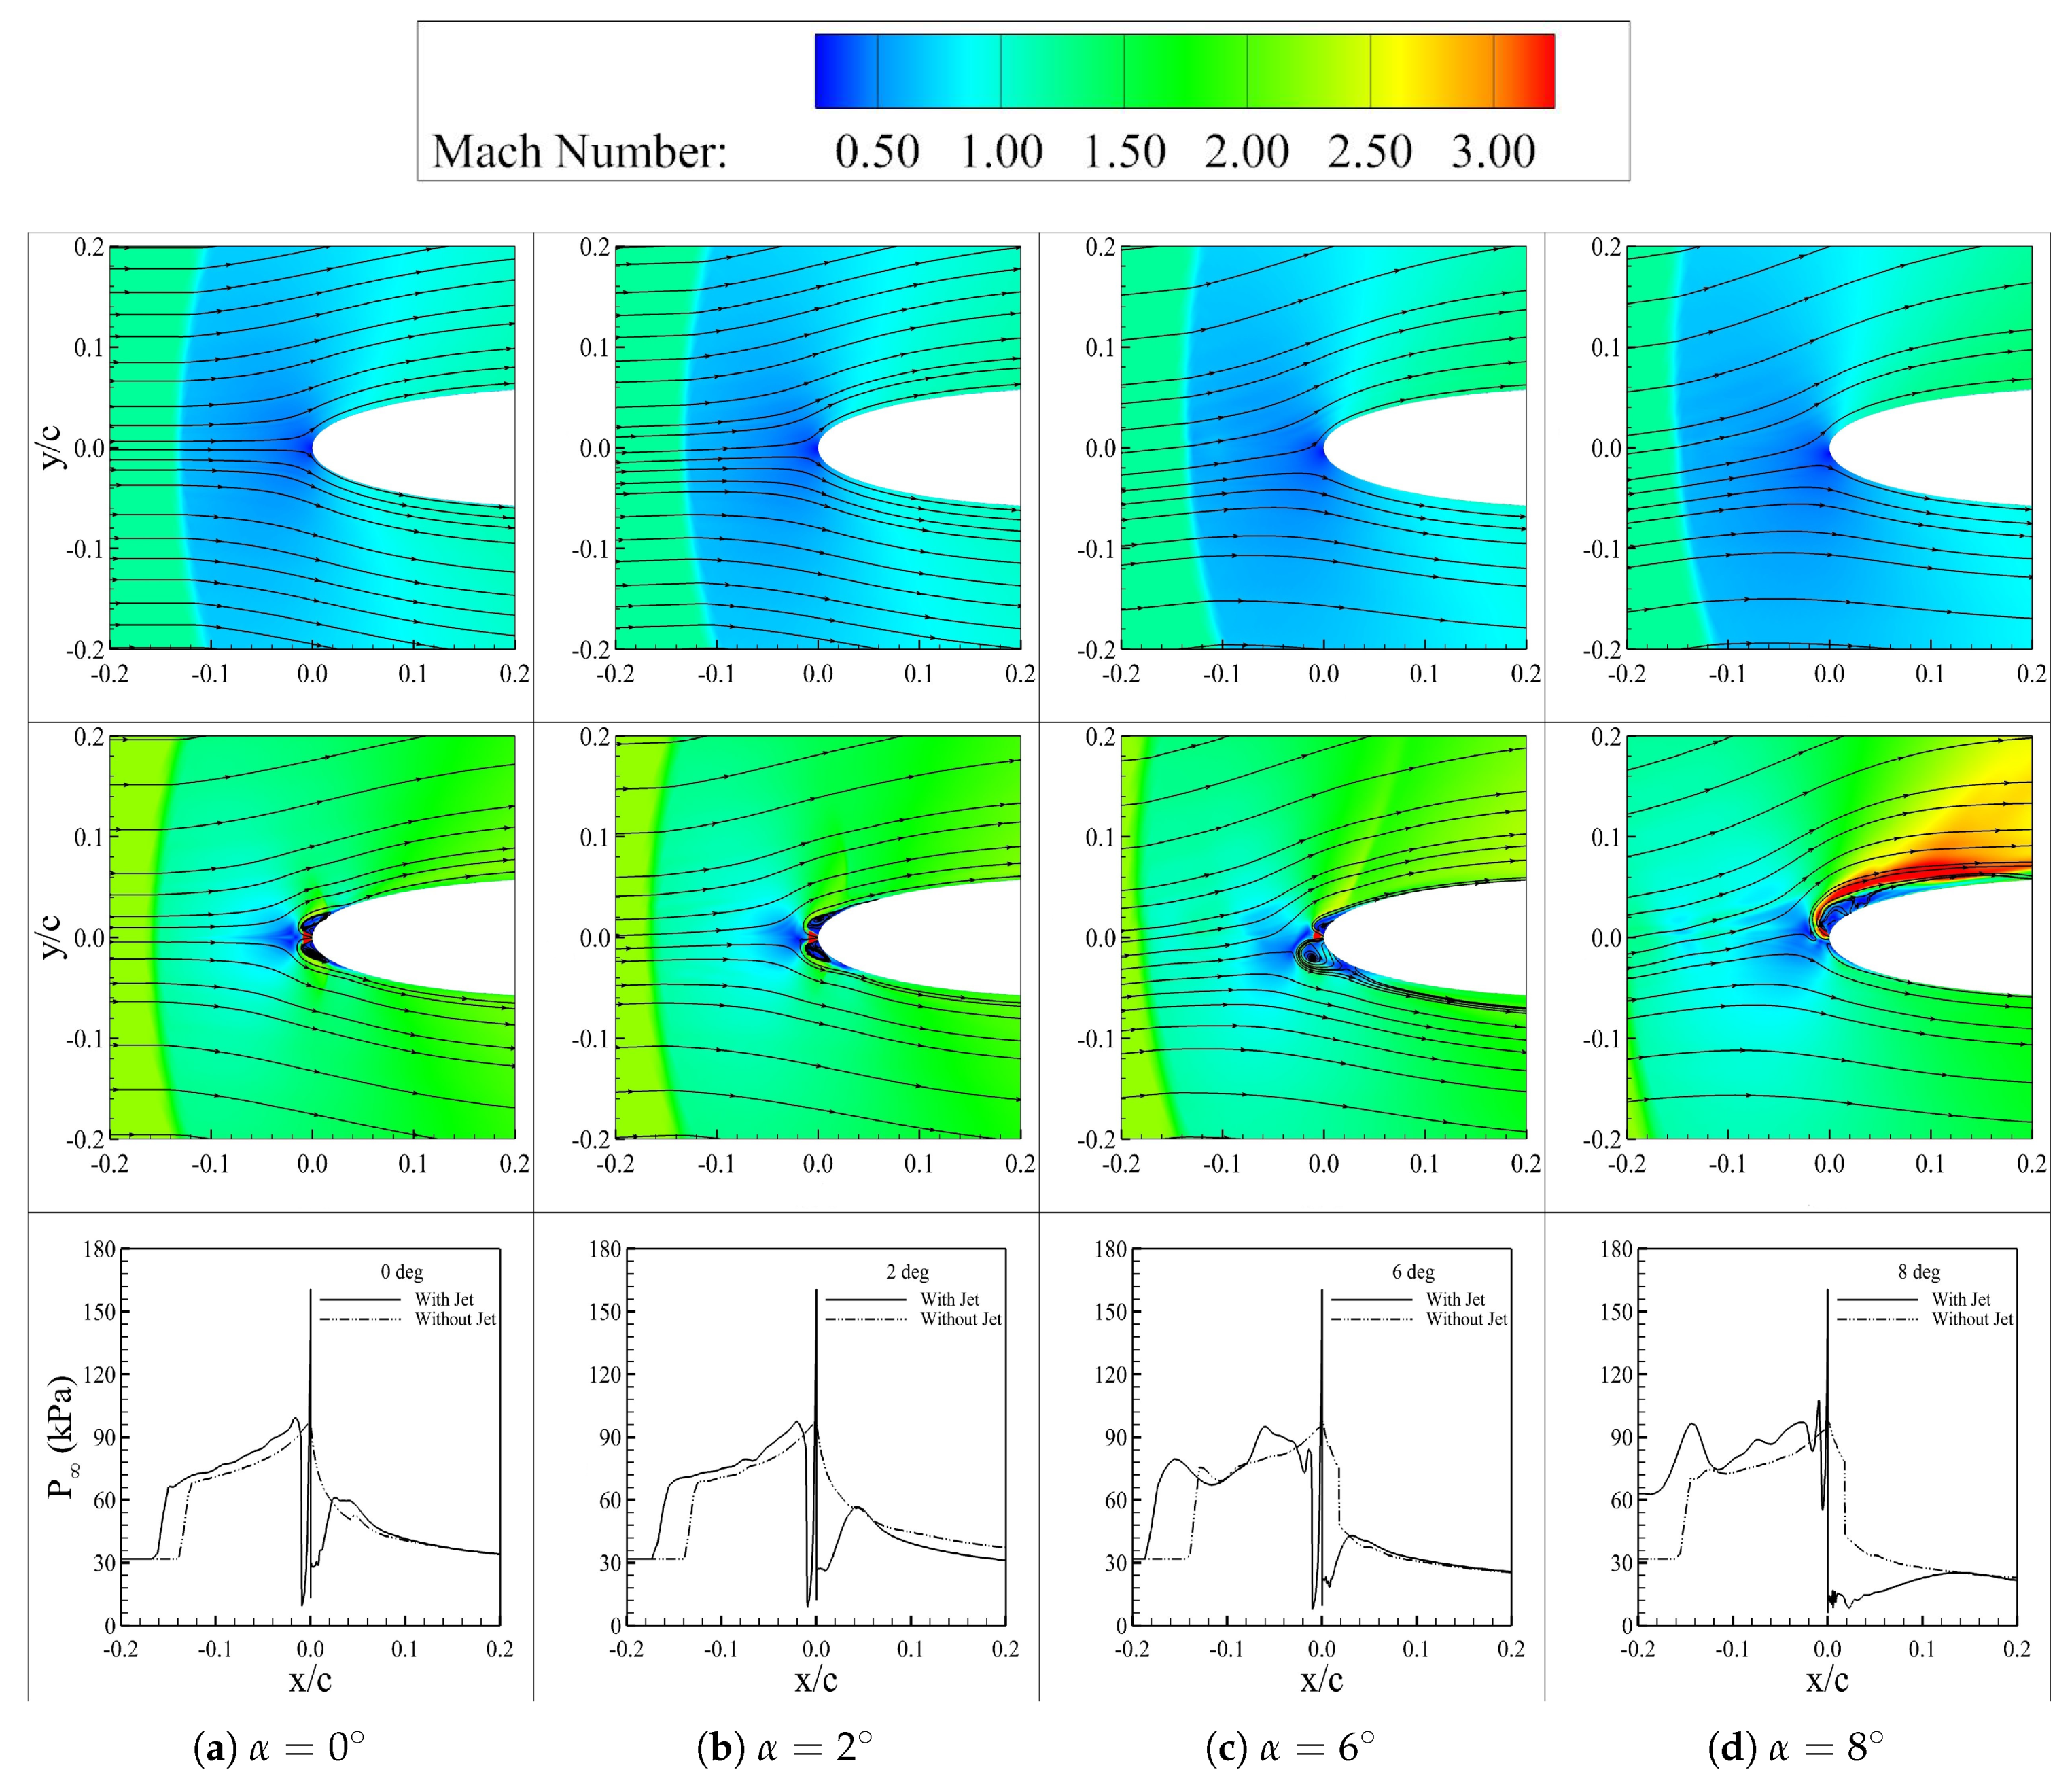
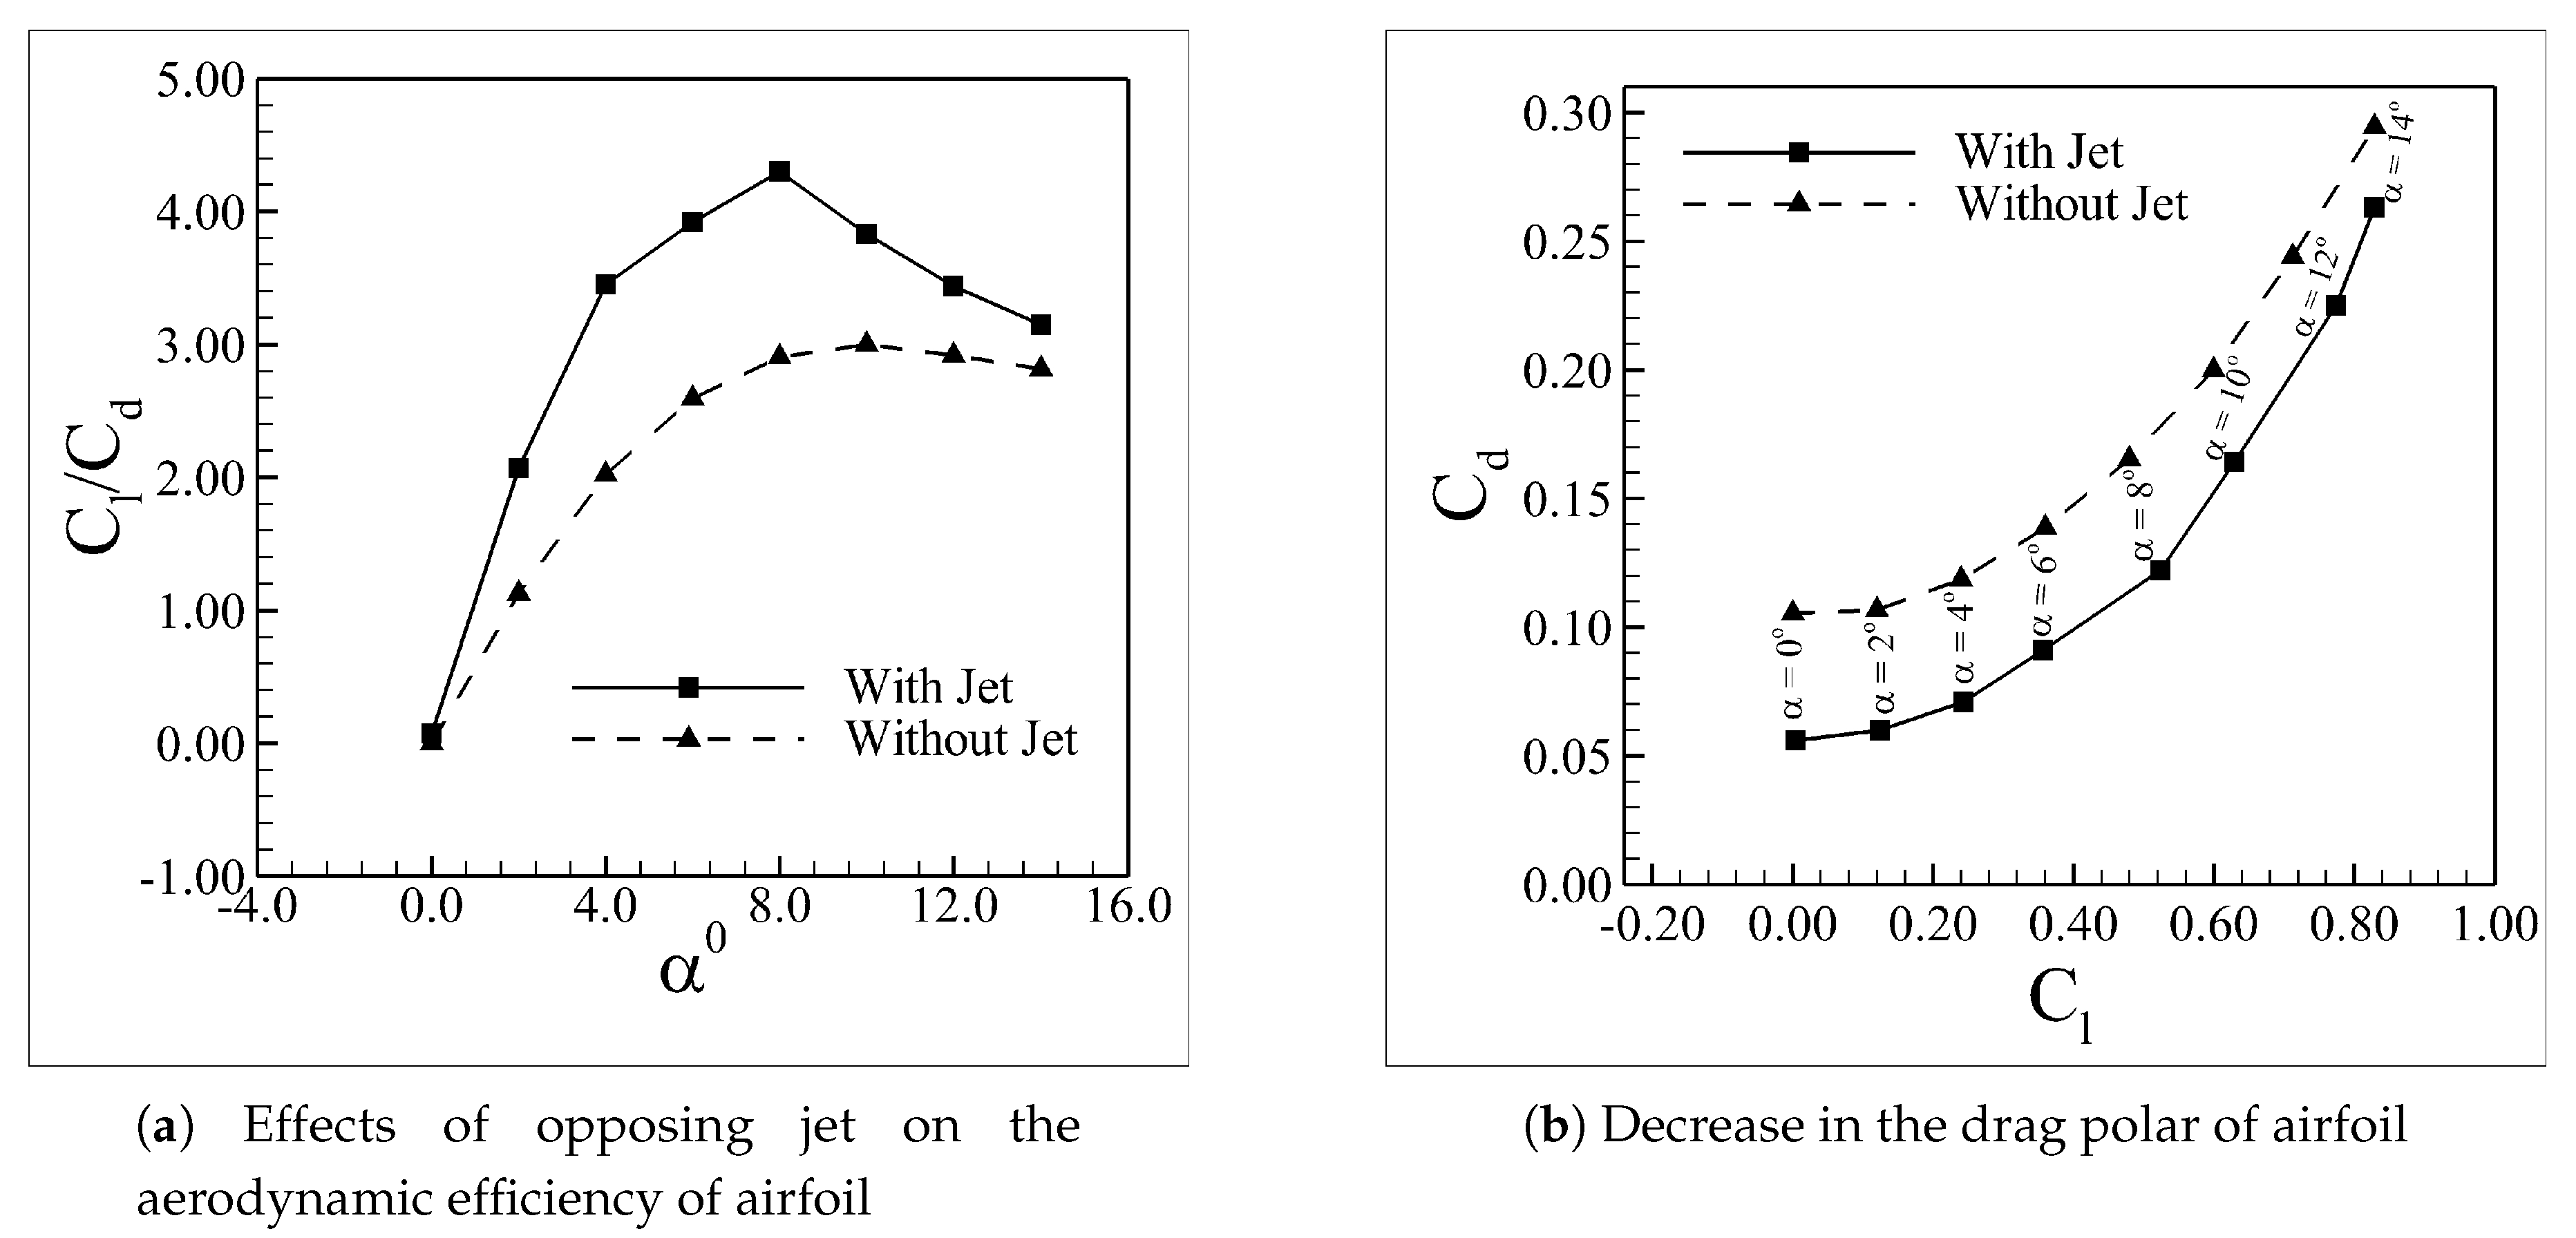
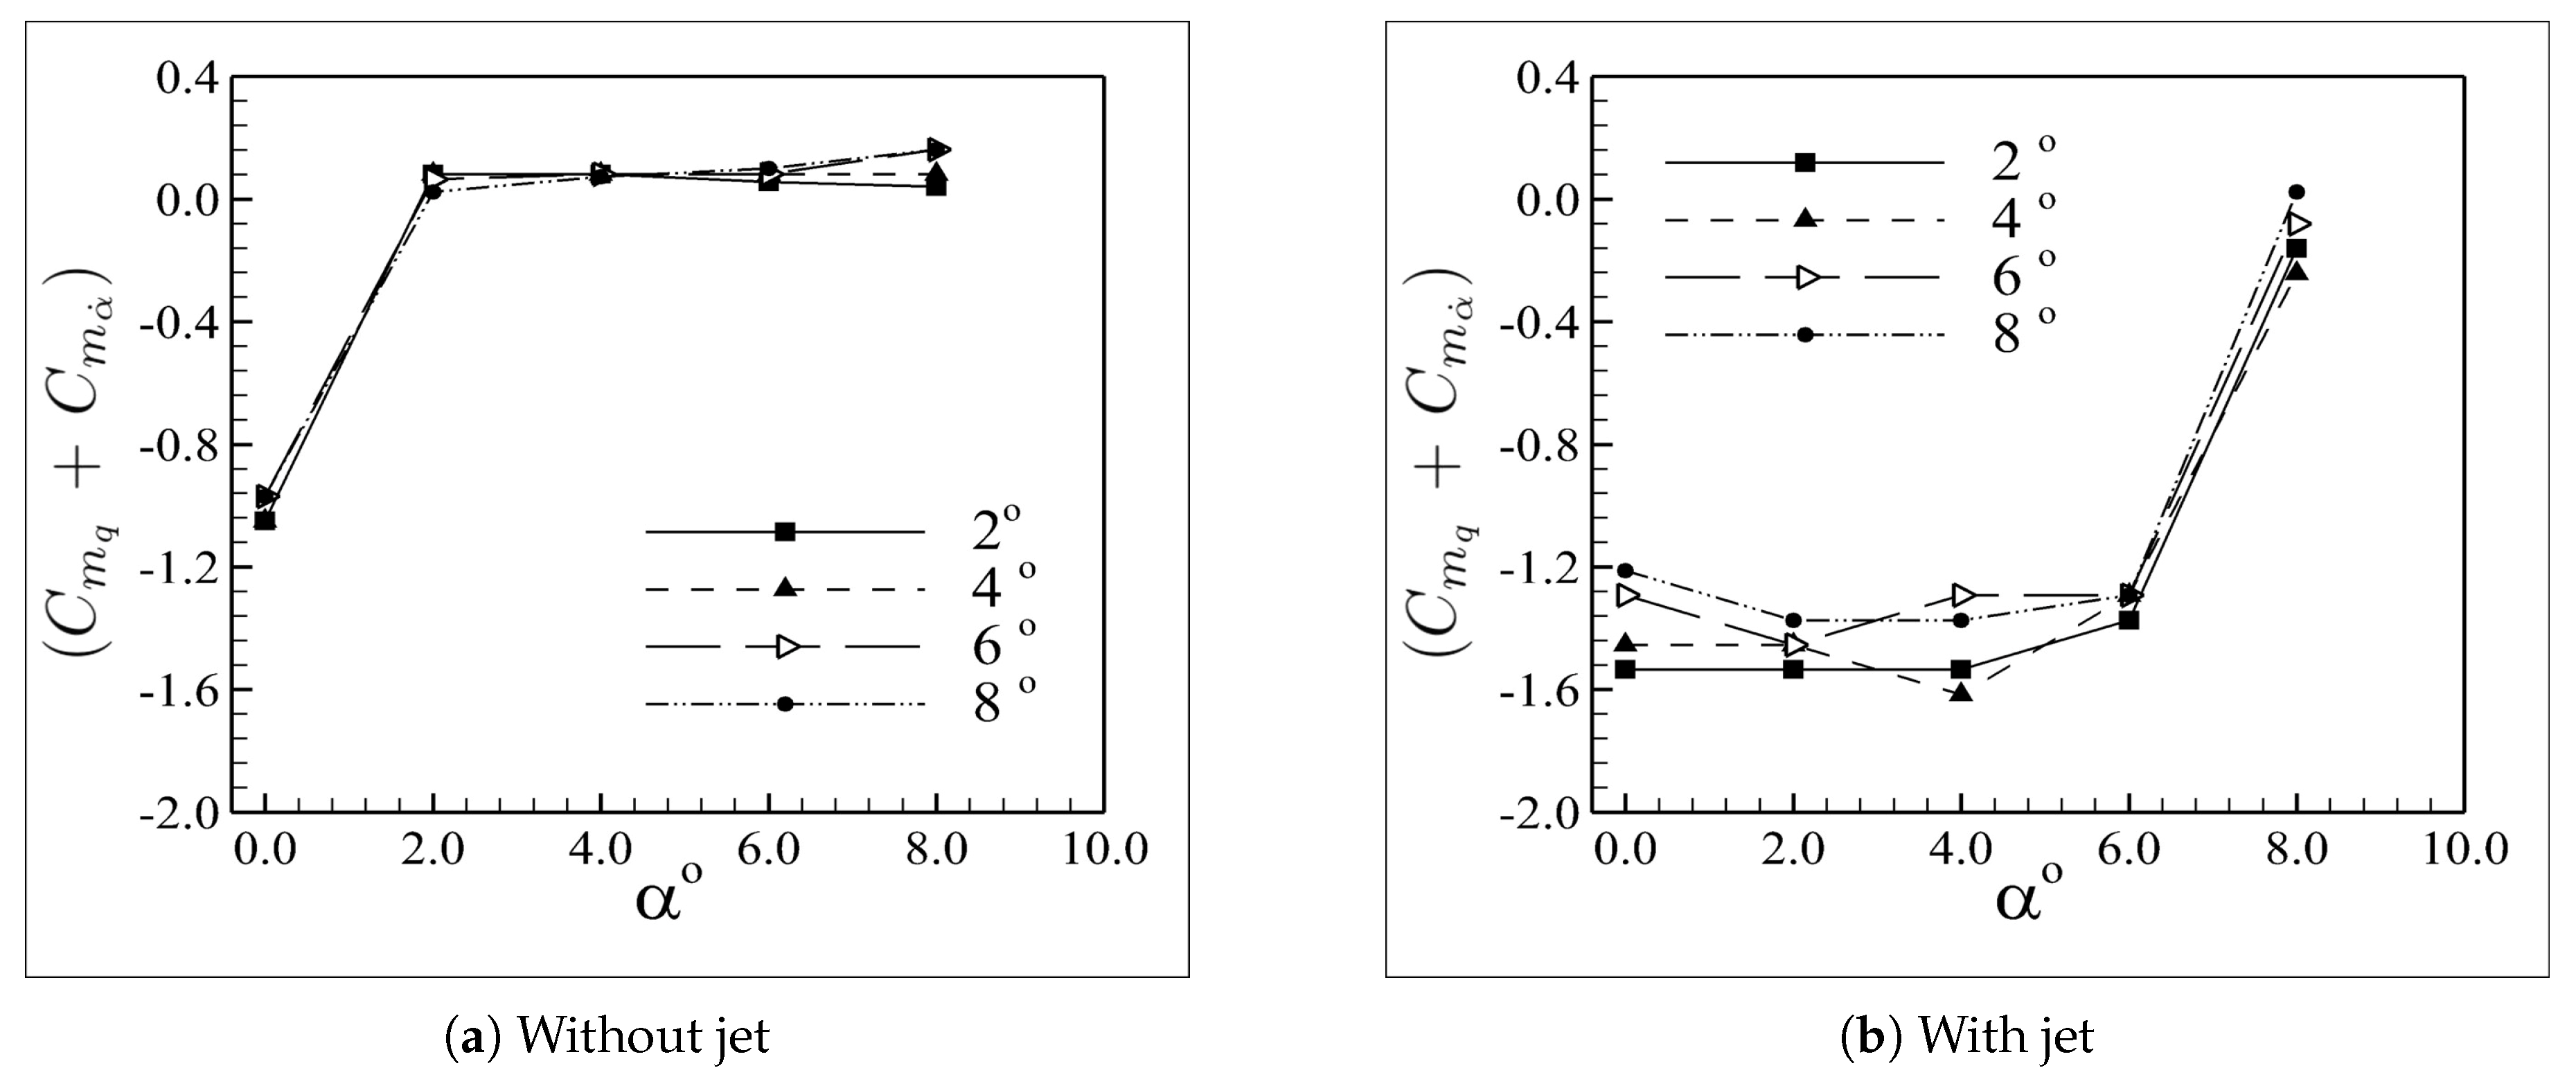
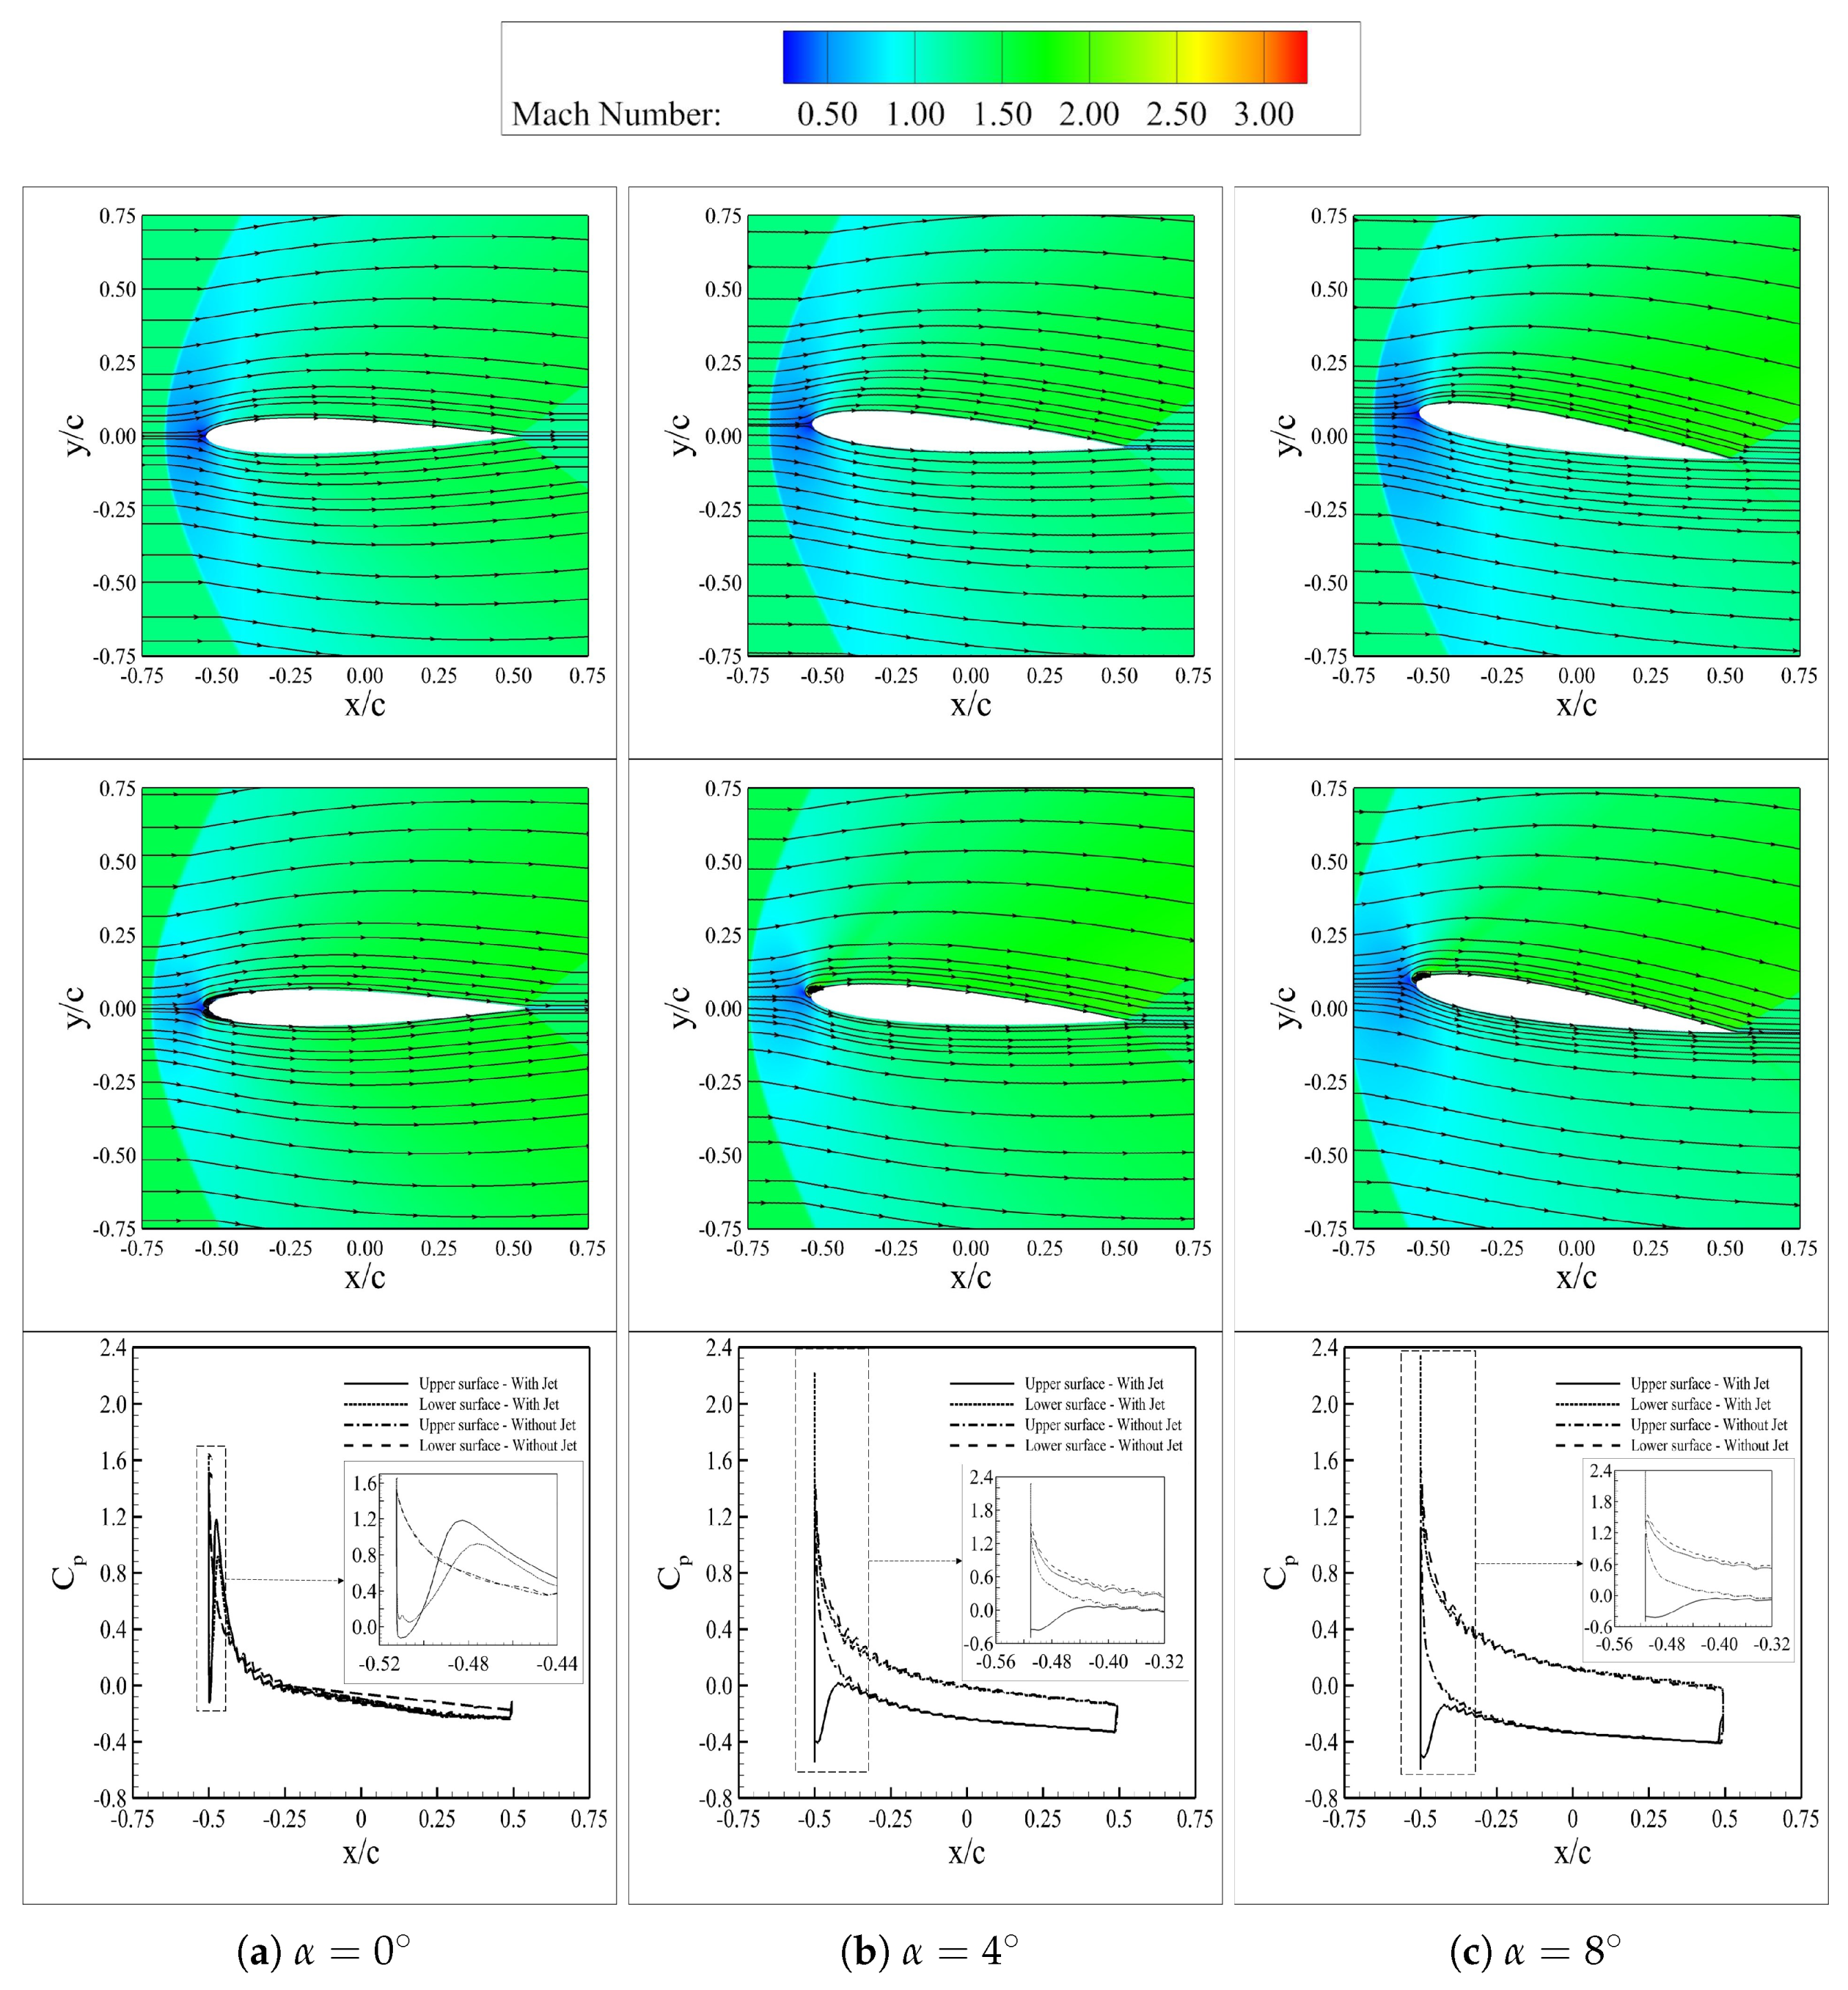
- Increased in angles of attack influenced the opposing jet efficiency. Beyond = 6, the jet destroyed and the drag at the leading edge starts increasing again.
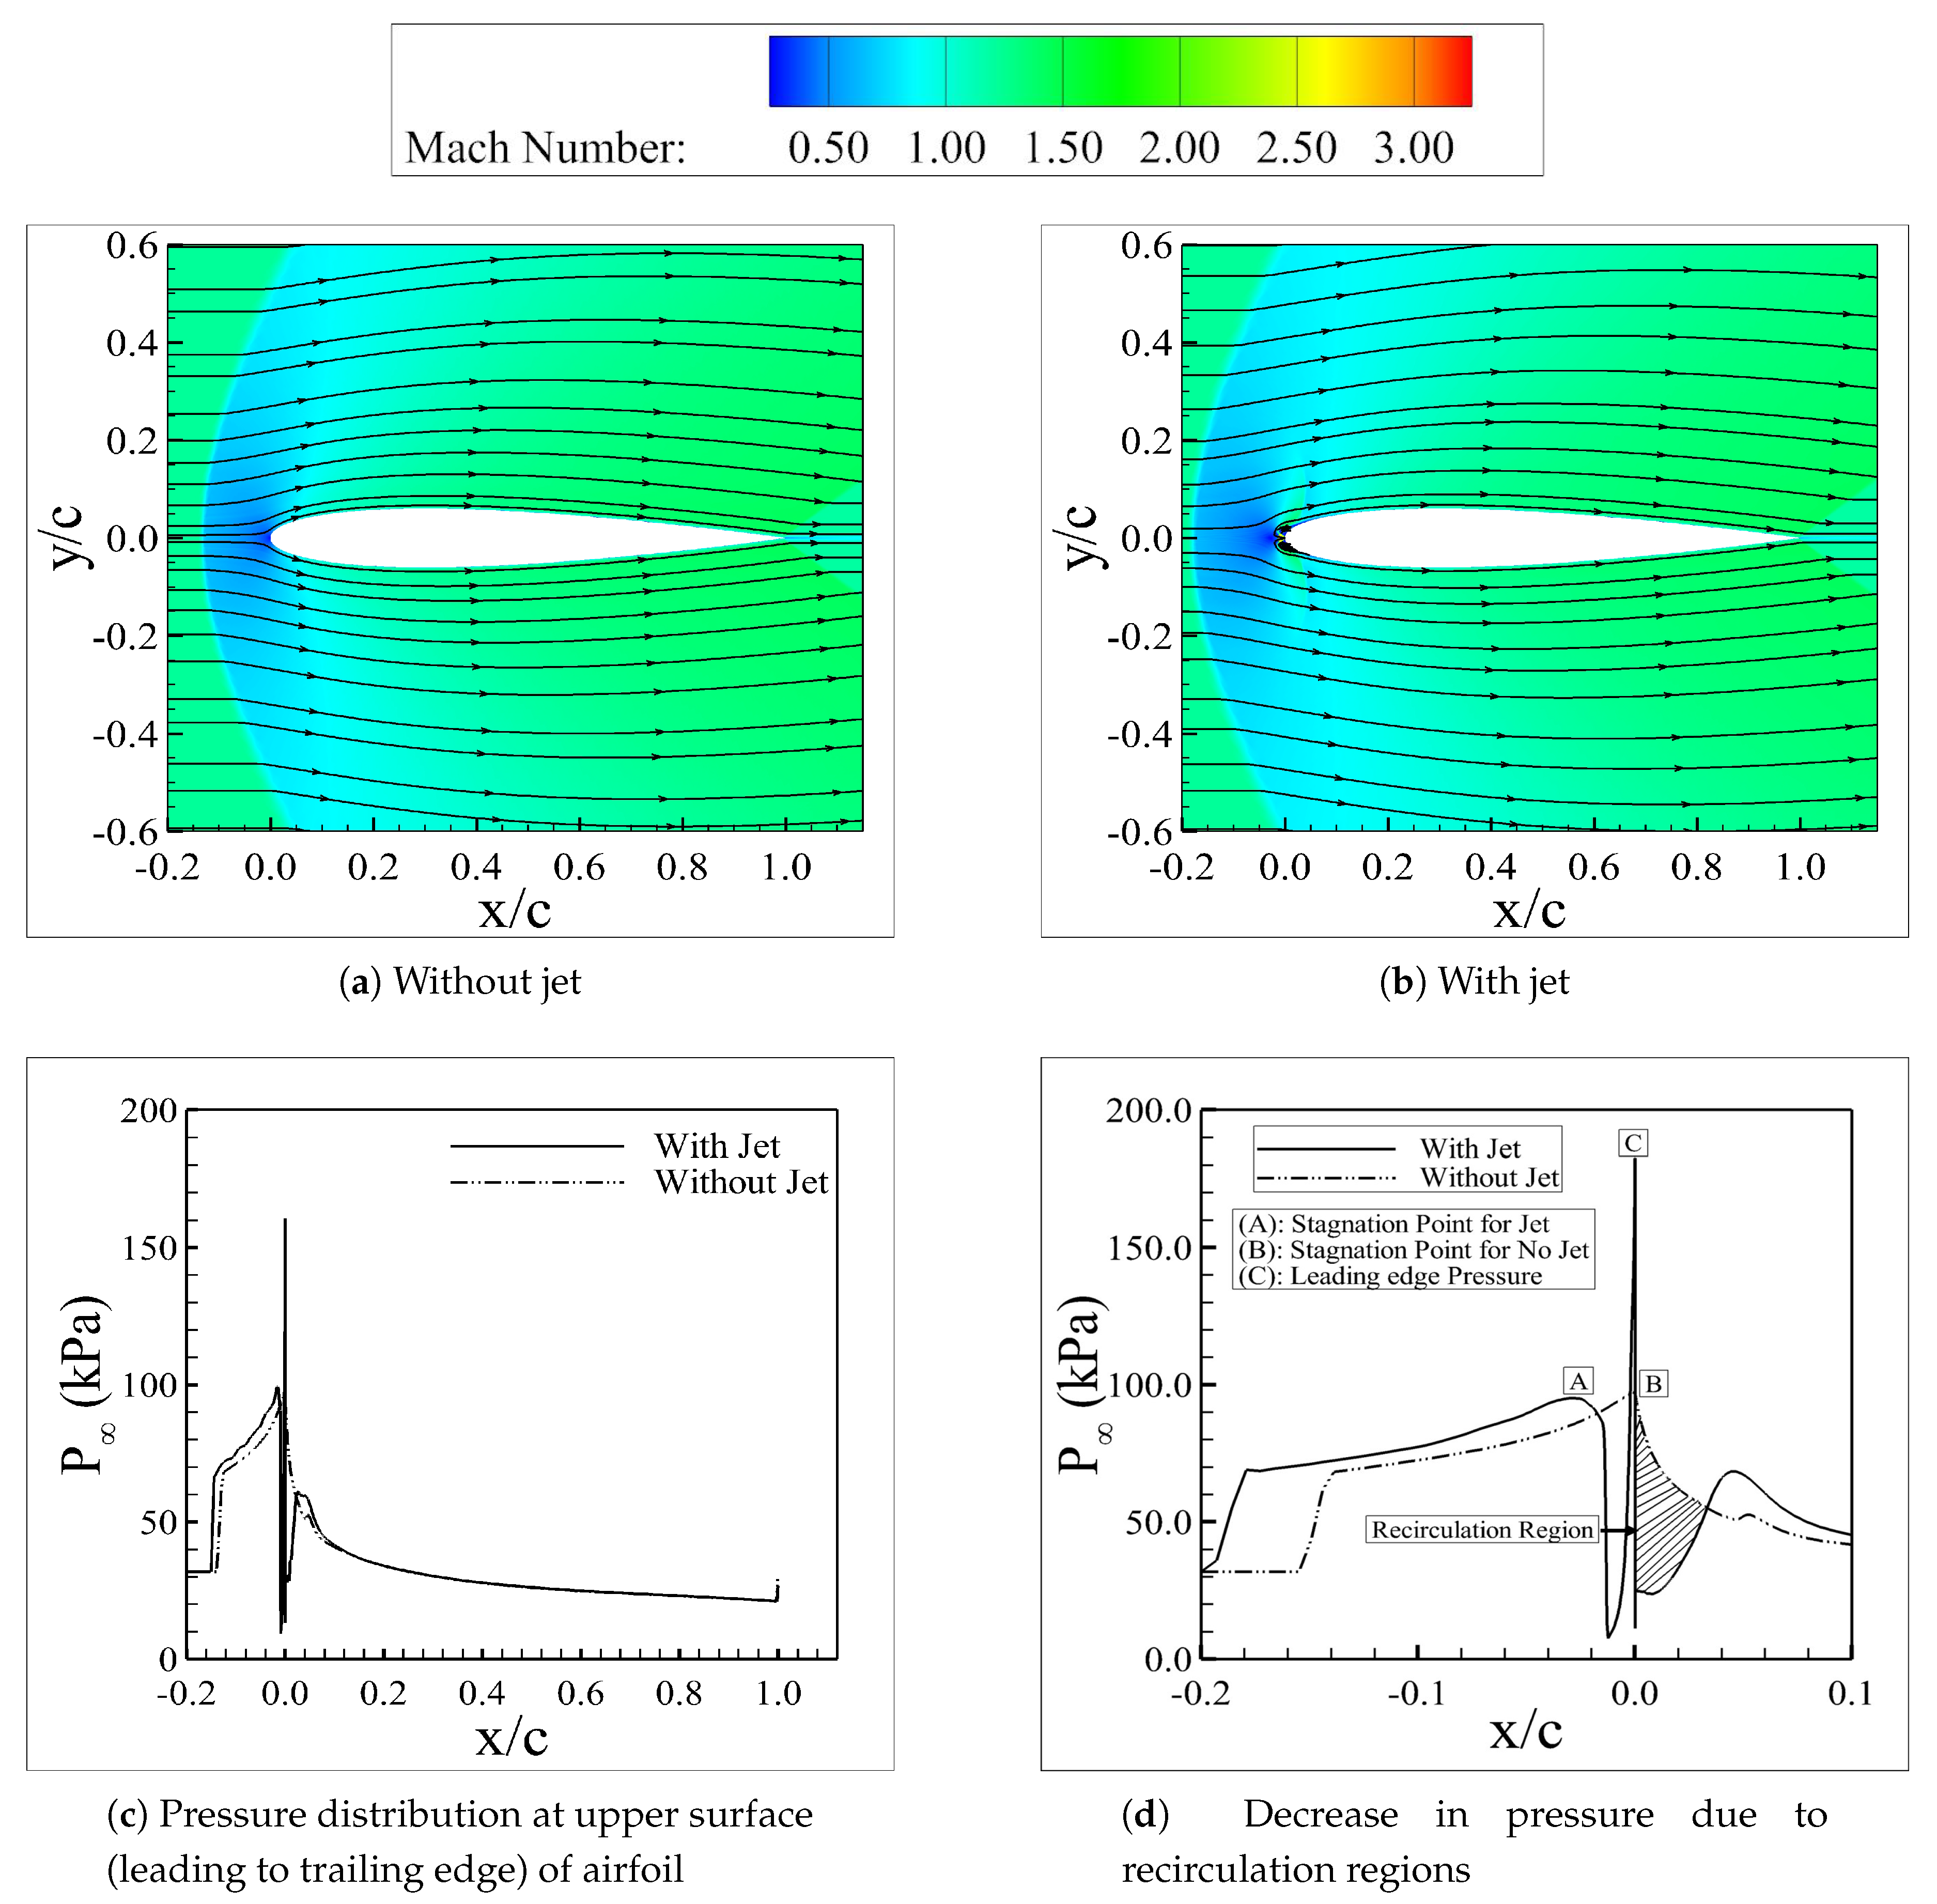
- Free stream Mach is the major influencing parameter. The SPM mode is achieved at M = 2. With further increase in Mach (M = 3) the jet becomes highly under expanded and the shape of the Mach disc changes into a convex form.
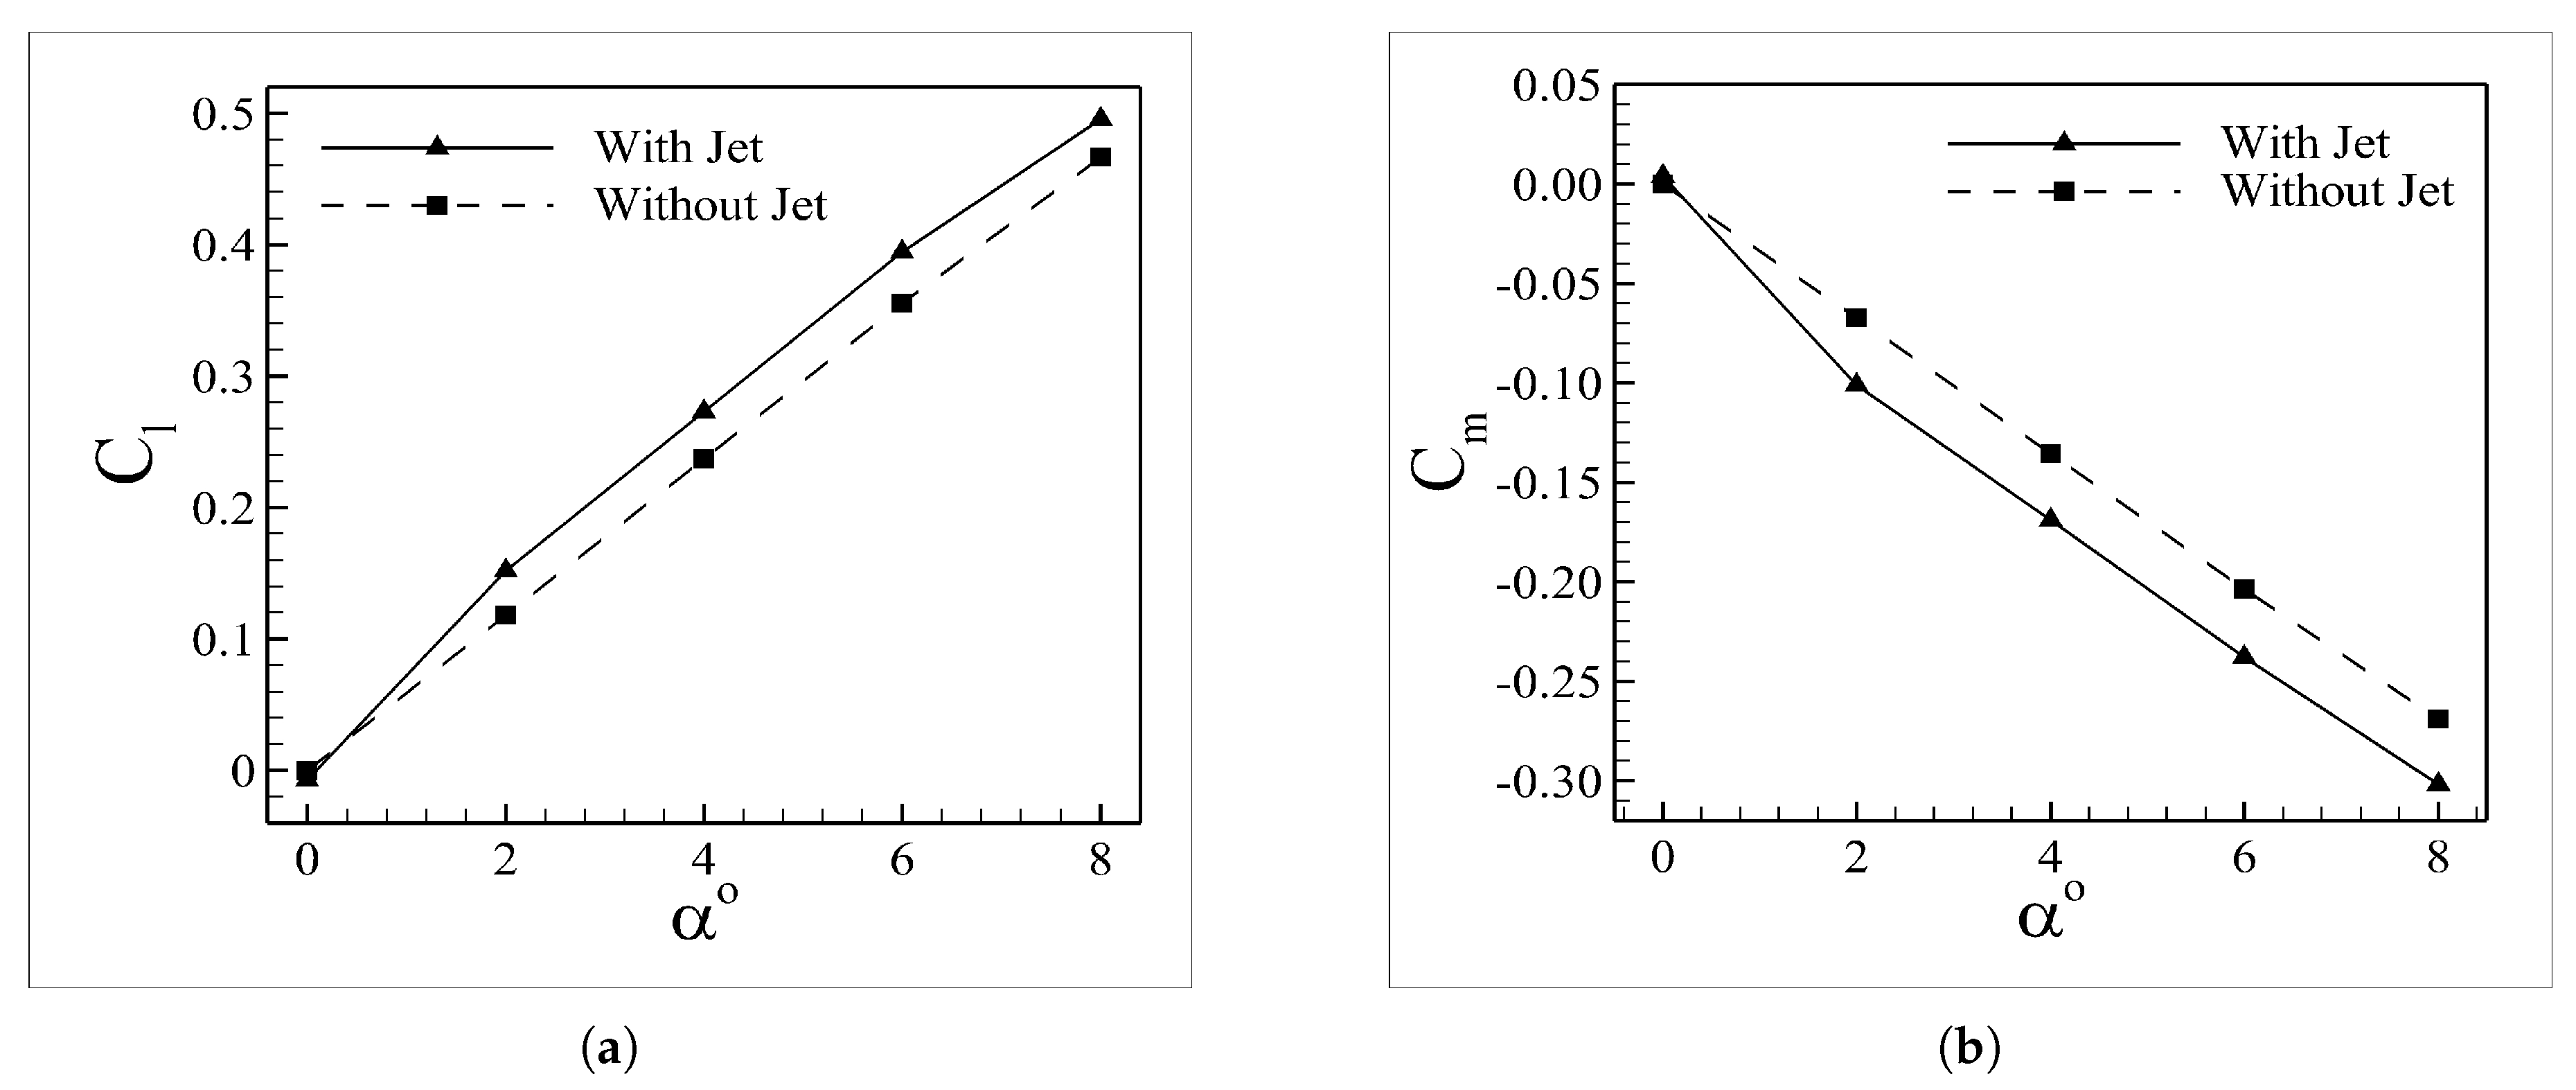
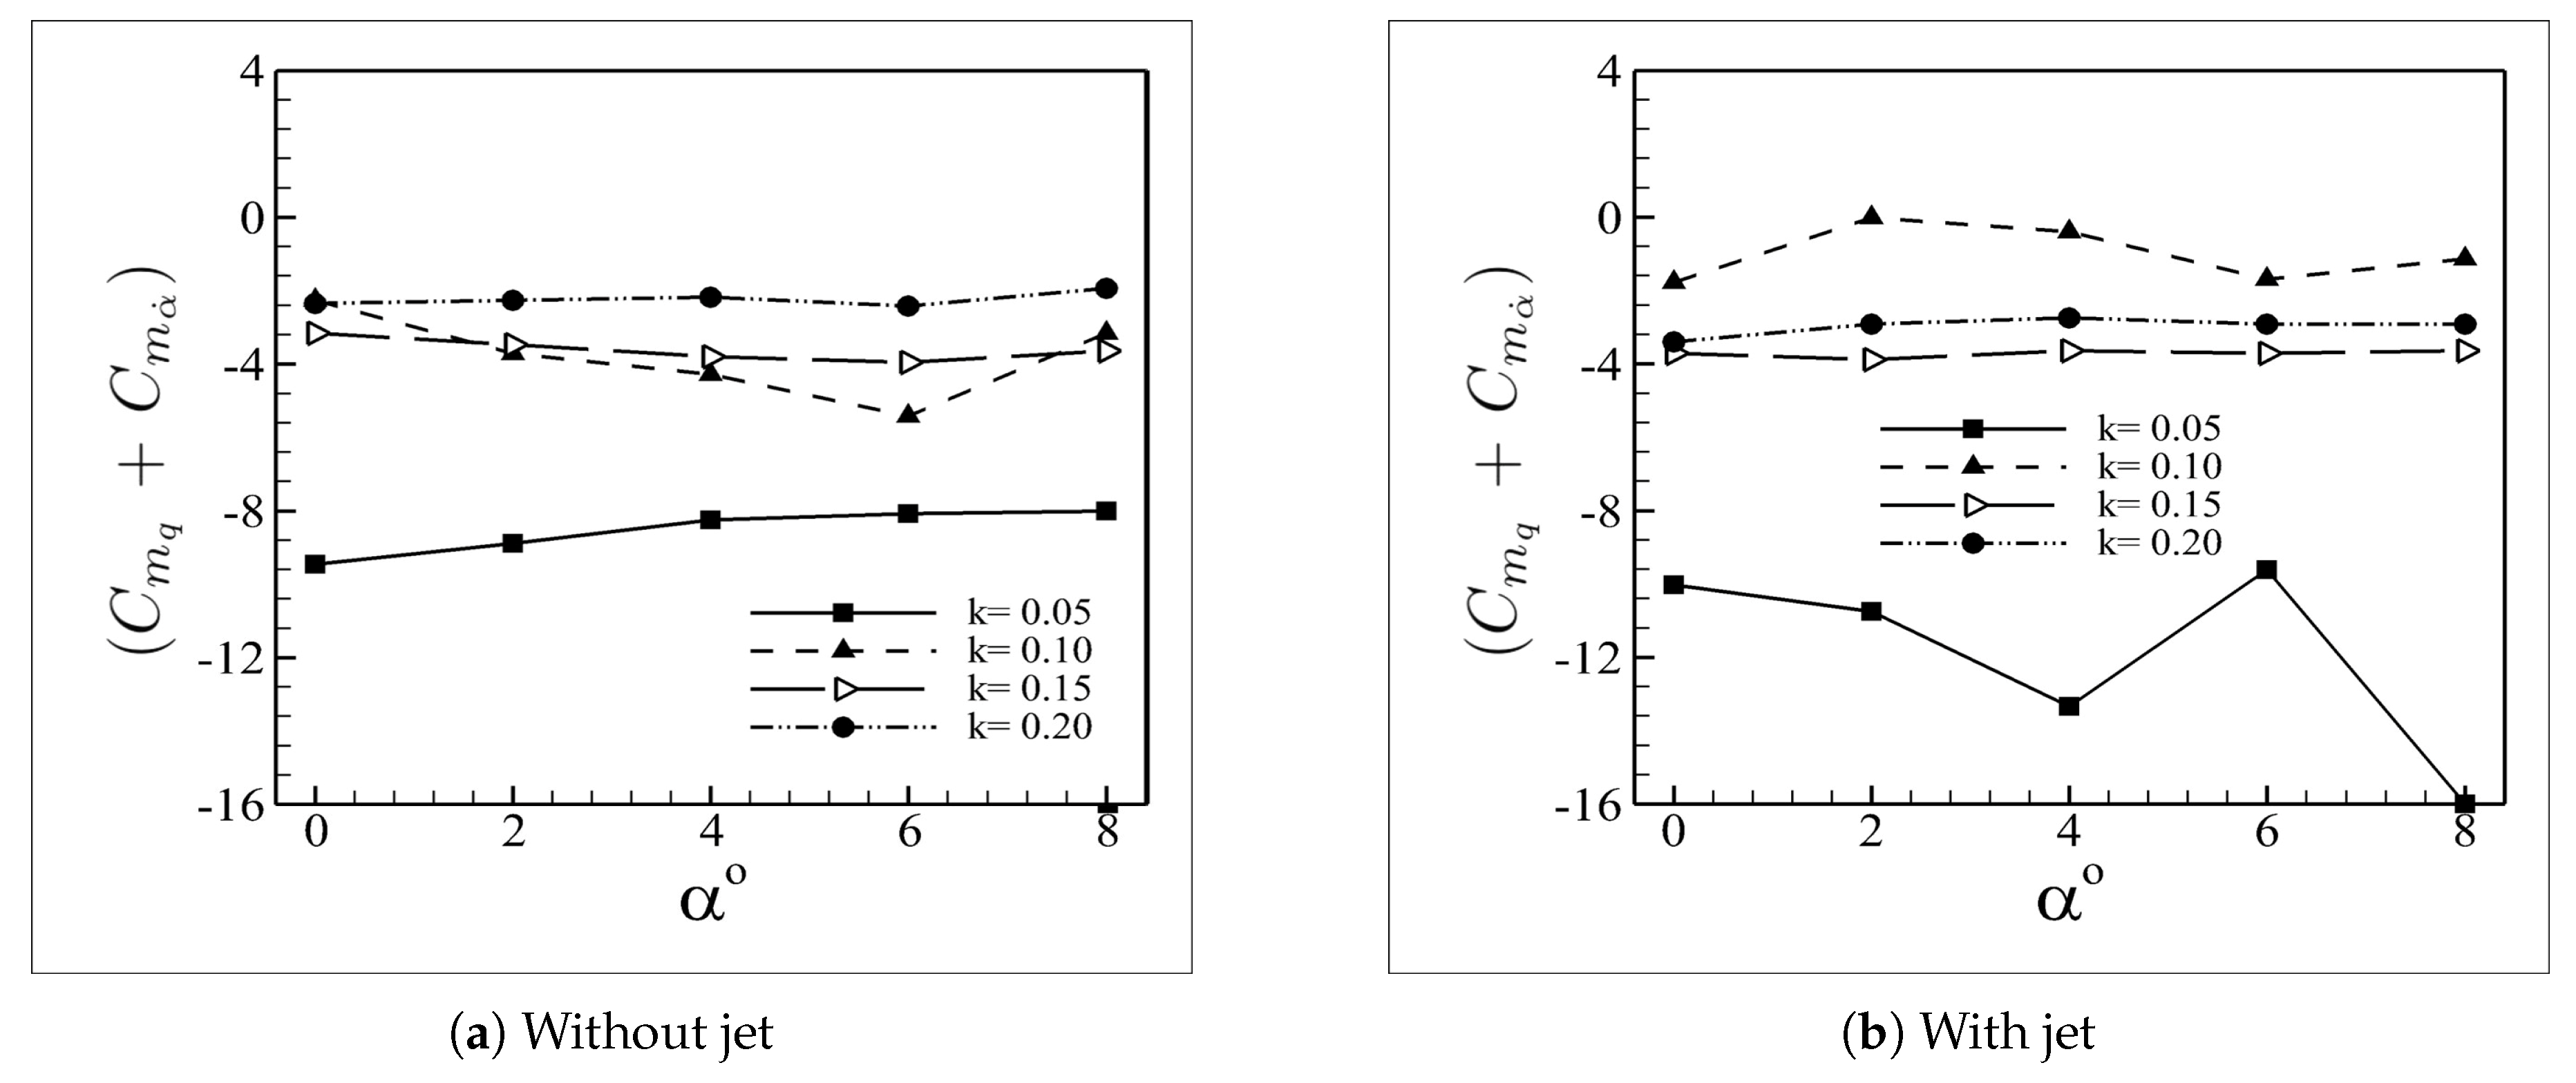
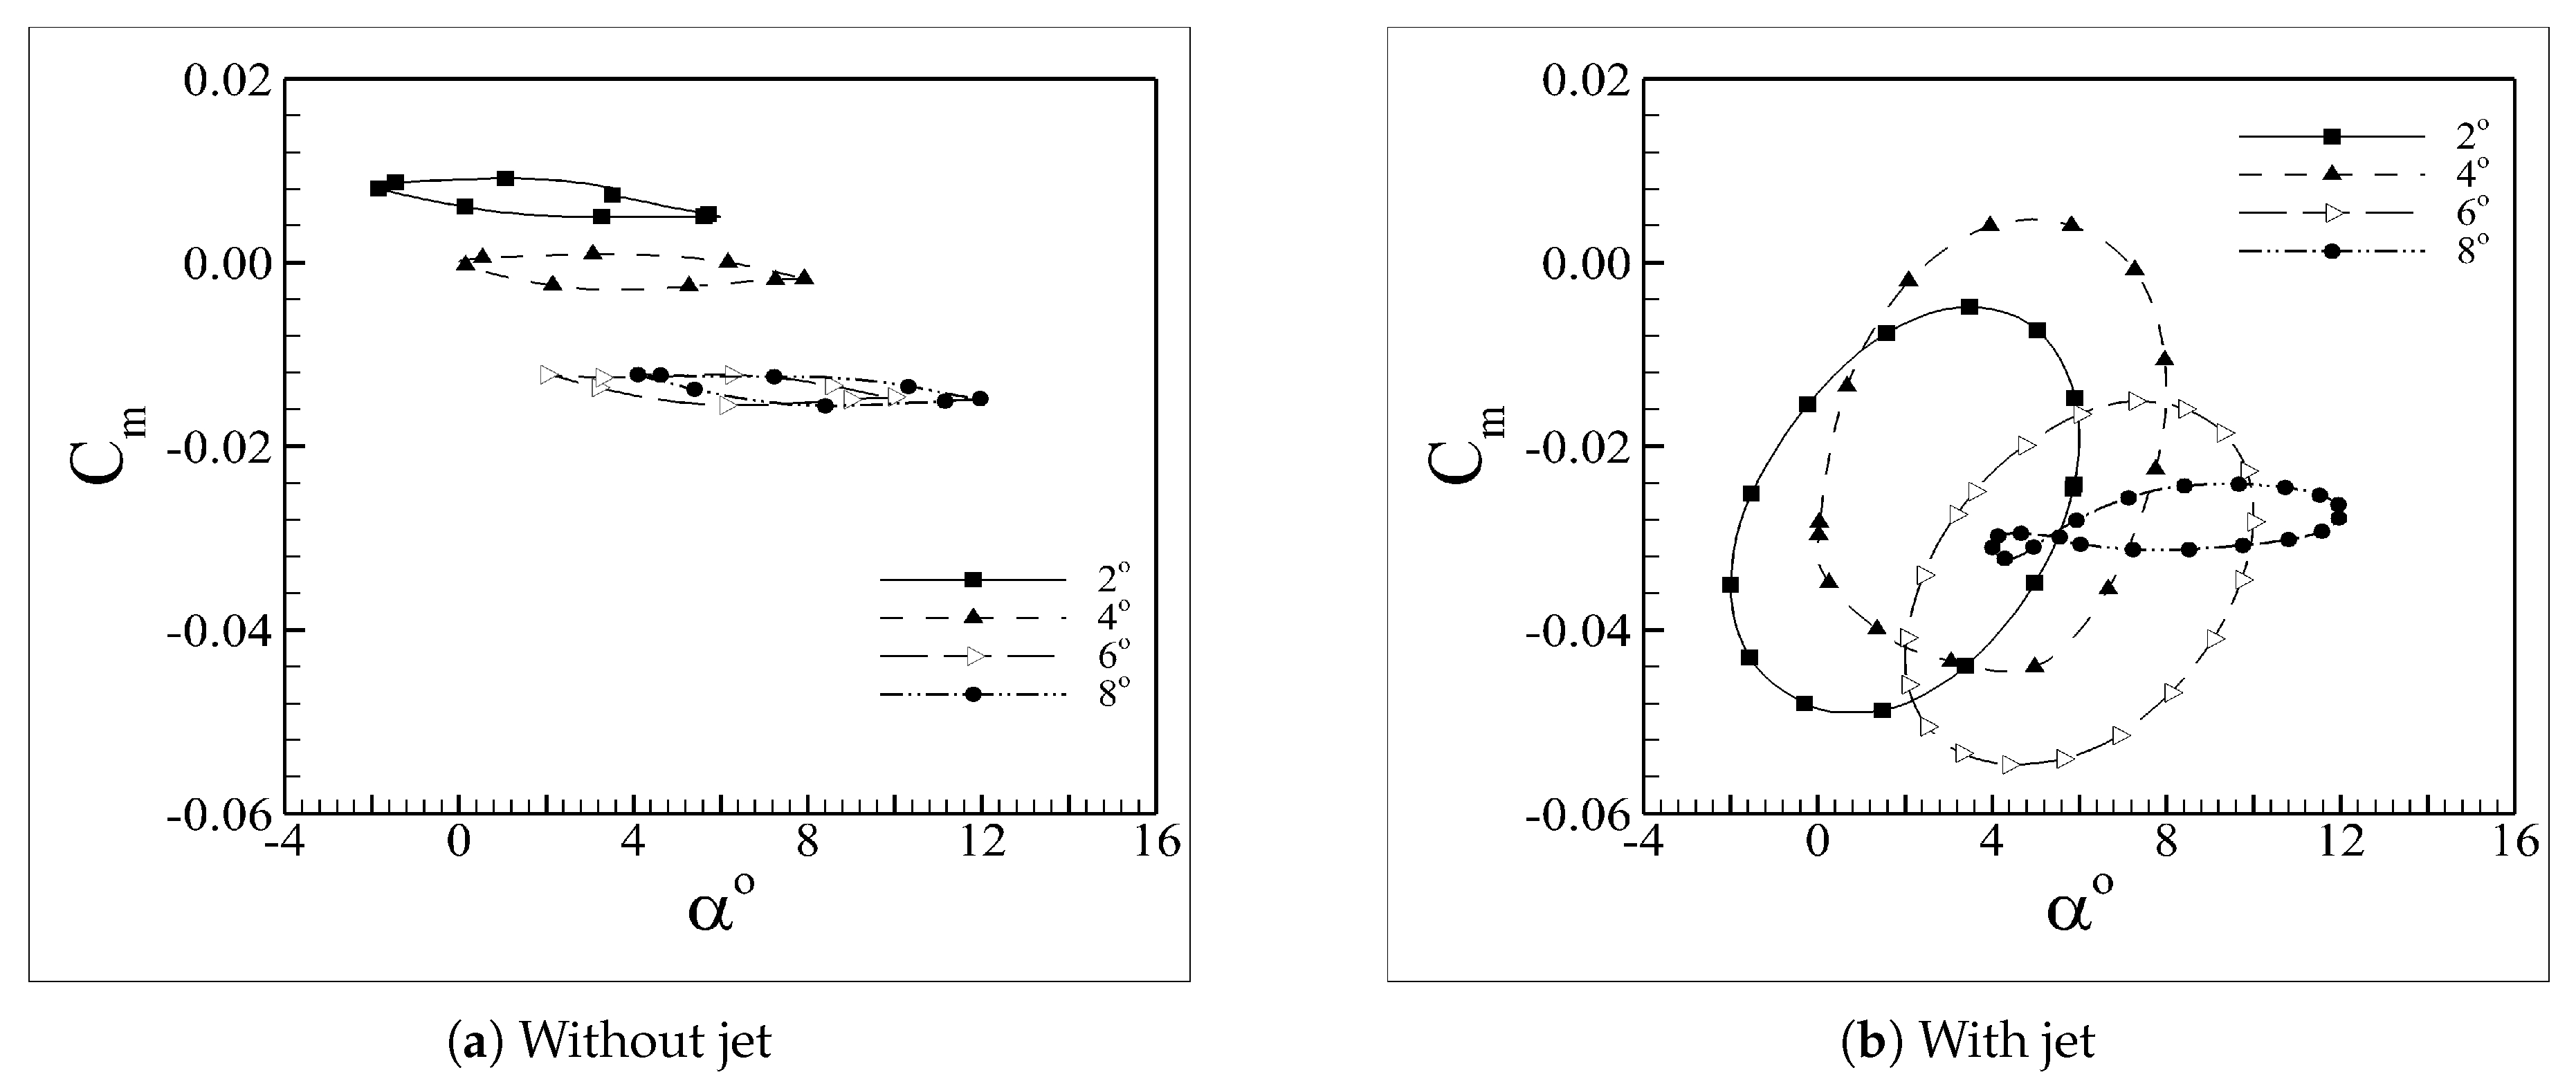
- The static and dynamic stability of airfoil in supersonic flow enhances by the implementation of jet. At higher free stream flow angles ( = 6) the jet does not work properly as it tilts in the free stream flow direction. So, the stability of an airfoil reduced.
Author Contributions
Funding
Acknowledgments
Conflicts of Interest
References
- Talay, T.A. Introduction to the Aerodynamics of Flight; Scientific and Technical Information Office, National Aeronautics and Space: Washington, DC, USA, 1975; Volume 367.
- McLean, F.E. Supersonic Cruise Technology; NASA SP-472; NASA Special Publication: Washington, DC, USA, 1985; pp. 472–473.
- Bushnell, D.M. Shock wave drag reduction. Annu. Rev. Fluid Mech. 2004, 36, 81–96. [Google Scholar] [CrossRef]
- Watts, G.A. An Experimental Investigation of a Sonic Jet Directed Upstream against a Uniform Supersonic Flow; Institute of Aerophysics, University of Toronto TN7: Toronto, ON, Canada, 1956. [Google Scholar]
- Love, E.S. The Effects of a Small Jet of Air Exhausting from the Nose of a Body of Revolution in Supersonic Flow; NACA RM L52119a; NACA: Boston, MA, USA, 1952. [Google Scholar]
- Qu, F.; Sun, D.; Bai, J.; Zuo, G.; Yan, C. Numerical investigation of blunt body’s heating load reduction with combination of spike and opposing jet. Int. J. Heat Mass Transf. 2018, 127, 7–15. [Google Scholar] [CrossRef]
- Huang, W.; Yan, L. Progress in research on mixing techniques for transverse injection flow fields in supersonic crossflows. J. Zhejiang Univ. Sci. A 2013, 14, 554–564. [Google Scholar] [CrossRef]
- Shen, B.; Liu, W.; Yin, L. Drag and heat reduction efficiency research on opposing jet in supersonic flows. Aerosp. Sci. Technol. 2018, 77, 696–703. [Google Scholar] [CrossRef]
- Baron, J.R.; Alzner, E. An experimental investigation of a two-layer inviscid shock cap due to blunt-body nose injection. J. Fluid Mech. 1963, 15, 442–448. [Google Scholar] [CrossRef]
- Warren, C.; Hugh, E. An experimental investigation of the effect of ejecting a coolant gas at the nose of a bluff body. J. Fluid Mech. 1960, 8, 400–417. [Google Scholar] [CrossRef]
- Gerdroodbary, M.B.; Bishehsari, S.; Hosseinalipour, S.M.; Sedighi, K. Transient analysis of counterflowing jet over highly blunt cone in hypersonic flow. Acta Astronaut. 2012, 73, 38–48. [Google Scholar] [CrossRef]
- Daso, E.O.; Pritchett, V.E.; Wang, T.-S.; Ota, D.K.; Blankson, I.M.; Auslender, A.H. Dynamics of shock dispersion and interactions in supersonic freestreams with counterflowing jets. AIAA J. 2009, 47, 1313–1346. [Google Scholar] [CrossRef]
- Romeo, D.J.; Sterrett, J.R. Flow field for sonic jet exhausting counter to a hypersonic mainstream. AIAA J. 1965, 3, 544–546. [Google Scholar] [CrossRef]
- Jarvinen, P.O.; Adams, R.H. The Effects of Retrorockets on the Aerodynamic Characteristics of Conical Aeroshell Planetary Entry Vehicles; AIAA Paper 70-219; AIAA: Reston, VA, USA, 1970. [Google Scholar]
- Deng, F.; Xie, F.; Qin, N.; Huang, W.; Wang, L.; Chu, H. Drag reduction investigation for hypersonic lifting-body vehicles with aerospike and long penetration mode counterflowing jet. Aerosp. Sci. Technol. 2018, 76, 361–373. [Google Scholar] [CrossRef]
- Hayashi, K.; Aso, S.; Tani, Y. Numerical study on aerodynamic heating reduction by opposing jet. AIAA J. 2006, 1, 66. [Google Scholar]
- Bibi, A.; Maqsood, A.; Sherbaz, S.; Dala, L. Drag reduction of supersonic blunt bodies using opposing jet and nozzle geometric variations. Aerosp. Sci. Technol. 2017, 69, 244–256. [Google Scholar] [CrossRef]
- Li, S.; Wang, Z.; Huang, W.; Liu, J. Effect of the injector configuration for opposing jet on the drag and heat reduction. Aerosp. Sci. Technol. 2016, 51, 78–86. [Google Scholar] [CrossRef]
- Yisheng, R. Drag reduction research in supersonic flow with opposing jet. Acta Astronaut. 2013, 91, 1–7. [Google Scholar] [CrossRef]
- Finley, P.J. The flow of a jet from a body opposing a supersonic free stream. J. Fluid Mech. 1966, 26, 337–368. [Google Scholar] [CrossRef]
- Woods, W.C.; Jones, K.M.; Genzel, N.N. Preliminary Investigation of Stagnation Point Liquid Injection Influence on Blunt Body Aerodynamics; AIAA: Reston, VA, USA, 2002. [Google Scholar]
- Barber, E.A. An experimental investigation of stagnation-point injection. J. Spacecr. Rocket. 1965, 2, 770–774. [Google Scholar] [CrossRef]
- Pish, F.; Moradi, R.; Edalatpour, A.; Gerdroodbary, M.B. The effect of coolant injection from the tip of spike on aerodynamic heating of nose cone at supersonic flow. Acta Astronaut. 2019, 154, 52–60. [Google Scholar] [CrossRef]
- Gerdroodbary, M.B.; Imani, M.; Ganji, D.D. Heat reduction using conterflowing jet for a nose cone with aerodisk in hypersonic flow. Aerosp. Sci. Technol. 2014, 39, 652–665. [Google Scholar] [CrossRef]
- Fomin, V.M.; Maslov, A.A.; Shashkin, A.P.; Korotaeva, T.A.; Malmuth, N.D. Flow regimes formed by a counterflow jet in a supersonic flow. J. Appl. Mech. Tech. Phys. 2001, 42, 757–764. [Google Scholar] [CrossRef]
- Ou, M.; Yan, L.; Huang, W.; Li, S.; Li, L. Detailed parametric investigations on drag and heat flux reduction induced by a combinational spike and opposing jet concept in hypersonic flows. Int. J. Heat Mass Transf. 2018, 126, 10–31. [Google Scholar] [CrossRef]
- Lu, H.; Liu, W. Investigation of thermal protection system by forward-facing cavity and opposing jet combinatorial configuration. Chin. J. Aeronaut. 2013, 26, 287–293. [Google Scholar] [CrossRef]
- Huang, W.; Yan, L.; Liu, J.; Jin, L.; Tan, J. Drag and heat reduction mechanism in the combinational opposing jet and acoustic cavity concept for hypersonic vehicles. Chin. J. Aeronaut. 2015, 42, 407–414. [Google Scholar] [CrossRef]
- Ou, M.; Yan, L.; Huang, W.; Zhang, T. Design exploration of combinational spike and opposing jet concept in hypersonic flows based on CFD calculation and surrogate model. Acta Astronaut. 2019, 155, 287–301. [Google Scholar] [CrossRef]
- Shantz, I.; Groves, R.T. Dynamic and Static Stability Measurements of the Basic Finner at Supersonic Speeds; Tech. rep.; Naval Ordnance Lab: White Oak, MD, USA, 1960. [Google Scholar]
- MacAllister, L.C. The Aerodynamic Properties of a Simple Non Rolling Finned Cone-Cylinder Configuration Between Mach Numbers 1.0 and 2.5; Tech. rep.; Army Ballistic Research Lab: Aberdeen Proving Ground, MD, USA, 1955. [Google Scholar]
- Winchenbach, G.L.; Uselton, R.L.; Hathaway, W.H.; Chelekis, R.M. Free-flight and wind-tunnel data for a generic fighter configuration. J. Aircr. 1984, 21, 5–13. [Google Scholar] [CrossRef]
- Uselton, B.L. A Description of the Standard Dynamic Model (SDM); Technical Report, 56th STA Meeting; MIT: Cambridge, MA, USA, 1981. [Google Scholar]
- Alemdaroglu, N.; Iyigun, I.; Altun, M.; Uysal, H.; Quagliotti, F.; Guglieri, G. Determination of dynamic stability derivatives using forced oscillation technique. In Proceedings of the 40th AIAA Aerospace Sciences Meeting & Exhibit, Reno, Nevada, 14–17 January 2002; p. 528. [Google Scholar]
- Davari, A.R.; Soltani, M.R. Effects of plunging motion on unsteady aerodynamic behavior of an aircraft model in compressible flow. Iranian J. Sci. Technol. 2007, 31, 49. [Google Scholar]
- Schmidt, E. Standard Dynamics Model Experiments with the DFVLR/AVA Transonic Derivative Balance. In Proceedings of the AGARD CP-386 Unsteady Aerodynamic-Fundamentals and Applications to Aircraft Dynamics, Gottingen, Germany, 6–9 May 1985. [Google Scholar]
- Hall, R.; Biedron, R.; Ball, D.; Bogue, D.; Chung, J.; Green, B.; Grismer, M.; Brooks, G.; Chambers, J. Computational methods for stability and control (COMSAC): The time has come. In Proceedings of the AIAA Atmospheric Flight Mechanics Conference and Exhibit, San Francisco, California, 15–18 August 2005; p. 6121. [Google Scholar]
- Murman, S.M. Reduced-frequency approach for calculating dynamic derivatives. AIAA J. 2007, 45, 1161–1168. [Google Scholar] [CrossRef]
- Da Ronch, A.; Ghoreyshi, M.; Badcock, K.; Vallespin, D. Computation and evaluation of dynamic derivatives using CFD. In Proceedings of the 28th AIAA Applied Aerodynamics Conference, Chicago, IL, USA, 28 June–1 July 2010; p. 4817. [Google Scholar]
- Itsariyapinyo, P.; Sharma, R.N. Large Eddy simulation of a NACA0015 circulation control airfoil using synthetic jets. Aerosp. Sci. Technol. 2018, 82, 545–556. [Google Scholar] [CrossRef]
- Graham, W.J. The Pressure-Drag due to Blunt Leading Edges on Two-Dimensional Aerofoils, at Transonic and Low-Supersonic Speeds; Aero Report 1151—A.R.C. 26 955; Her Majesty’s Stationery Office: London, UK, 1965. [Google Scholar]
- Landon, R.H.; Davis, S.S. Compendium of Unsteady Aerodynamic Measurements; Agard Rep No.702; AGARD: Paris, France, 1982. [Google Scholar]
- Menter, F.R.; Menter, F.R. Two-equation eddy-viscosity turbulence models for engineering applications. AIAA J. 1994, 32, 1598–1605. [Google Scholar] [CrossRef]
- Harris, C.D. Two-Dimensional Aerodynamic Characteristics of the NACA 0012 Airfoil in the Langley 8 Foot Transonic Pressure Tunnel; NASA TM 81927; NASA: Washington, DC, USA, 1981.
- Tobak, M.; Schiff, L.B. Aerodynamic Mathematical Modeling-Basic Concepts; AGARD Lect. Ser. 114; AGARD: Paris, France, 1 March 1981. [Google Scholar]
- Fujita, M. Axisymmetric oscillations of an opposing jet from a hemispherical nose. AIAA J. 1995, 33, 1850–1856. [Google Scholar] [CrossRef]
- Huang, J.; Yao, W.; Jiang, Z. Penetration mode effect on thermal protection system by opposing jet. Acta Astronaut. 2019, 160, 206–215. [Google Scholar] [CrossRef]
- Farr, R.; Chang, C.-L.; Jones, J.H.; Dougherty, N.S. On the comparison of the long penetration mode (LPM) supersonic counterflowing jet to the supersonic screech jet. In Proceedings of the 21st AIAA/CEAS Aeroacoustics Conference, Dallas, TX, USA, 22–26 June 2015; p. 3126. [Google Scholar]
- Tamada, I.; Aso, S.; Tani, Y. Numerical study of the effect of the opposing jet on reduction of aerodynamic heating with different nose configurations. In Proceedings of the 26th International Congress of the Aeronautical Sciences, Anchorage, AL, USA, 14–19 September 2008; pp. 14–19. [Google Scholar]


© 2019 by the authors. Licensee MDPI, Basel, Switzerland. This article is an open access article distributed under the terms and conditions of the Creative Commons Attribution (CC BY) license (http://creativecommons.org/licenses/by/4.0/).
Share and Cite
Rashid, S.; Nawaz, F.; Maqsood, A.; Riaz, R.; Salamat, S. Shock Reduction through Opposing Jets—Aerodynamic Performance and Flight Stability Perspectives. Appl. Sci. 2020, 10, 180. https://doi.org/10.3390/app10010180
Rashid S, Nawaz F, Maqsood A, Riaz R, Salamat S. Shock Reduction through Opposing Jets—Aerodynamic Performance and Flight Stability Perspectives. Applied Sciences. 2020; 10(1):180. https://doi.org/10.3390/app10010180
Chicago/Turabian StyleRashid, Shagufta, Fahad Nawaz, Adnan Maqsood, Rizwan Riaz, and Shuaib Salamat. 2020. "Shock Reduction through Opposing Jets—Aerodynamic Performance and Flight Stability Perspectives" Applied Sciences 10, no. 1: 180. https://doi.org/10.3390/app10010180
APA StyleRashid, S., Nawaz, F., Maqsood, A., Riaz, R., & Salamat, S. (2020). Shock Reduction through Opposing Jets—Aerodynamic Performance and Flight Stability Perspectives. Applied Sciences, 10(1), 180. https://doi.org/10.3390/app10010180