Article

A Non-Contact Photoplethysmography Technique for the Estimation of Heart Rate via Smartphone

1
Departamento de Ingeniería Biomédica, Universidad Politécnica de Sinaloa, Sinaloa 82199, Mexico
2
Universidad Politécnica de Madrid, 28040 Madrid, Spain
3
BIOMEDIXT S. de R.L. de C.V., Mazatlán 82010, Mexico
4
Universidad de las Fuerzas Armadas ESPE de Ecuador, Sangolquí 050102, Ecuador
5
Networking Center for Biomedical Research on Bioengineering, Biomaterials and Nanomedicine (CIBER-BBN), Instituto de Salud Carlos III, 28029 Madrid, Spain
*
Author to whom correspondence should be addressed.
Appl. Sci. 2020, 10(1), 154; https://doi.org/10.3390/app10010154
Submission received: 7 October 2019 / Revised: 8 December 2019 / Accepted: 16 December 2019 / Published: 23 December 2019
(This article belongs to the Special Issue Signal Processing and Machine Learning for Biomedical Data)

Abstract

:
This paper describes the development of an application for mobile devices under the iOS platform which has the objective of monitoring patients with alterations or affections from cardiac pathologies. The software tool developed for mobile devices provides a patient and a specialist doctor the ability to handle and treat disease remotely while monitoring through the technique of non-contact photoplethysmography (PPG). The mobile application works by processing red, green, and blue (RGB) color video images on a specific region of the face, thus obtaining the intensity of the pixels in the green channel. The results are then processed using mathematical algorithms and Fourier transform, moving from the time domain to the frequency domain to ensure proper interpretation and to obtain the pulses per minute (PPM). The results are favorable because a comparison of the results was made with respect to the application of a medical-grade pulse-oximeter, where an error rate of 3% was obtained, indicating the acceptable performance of our application. The present technological development provides an application tool with significant potential in the area of health.

1. Introduction

Cardiovascular diseases are the leading cause of death worldwide. According to the World Health Organization in 2012, 17.5 million people died because of such diseases, representing 31% of all deaths in the world [1]. In order to reduce these statistics, it is important to promote prevention and maintain continuous monitoring of the heart rate to prevent future health risks. The presented development provides the option to monitor a patient through a remote contactless solution, which will allow users to have better control of their health.
In the biomedical area, only basic techniques for cardiac pulse measurements are available. These techniques require the use of contact sensors, electrodes, or patches, which can cause poor readings or discomfort and skin irritation. For example, McCann et al. [2] showed that misplaced electrocardiography (ECG) electrodes can cause changes in ECG recordings, which could have an impact on clinical decisions, directly affecting the patient’s treatment. Also, Baek et al. [3] designed a special electrode material that does not cause the skin irritations or allergic reactions known to be caused by commercial electrodes made from Ag/AgCl after long-term tests.
The existence of a range of sensors that allows the interconnection of the human body with intelligent mobile devices and the fact that, at the same time, these devices can communicate with different devices to carry out remote monitoring, reveals the enormous potential of information technology in the area of health. A study performed by Bates et al. in 2001 [4] revealed that the increase of the use of information technology in medical care has reduced the frequency and consequences of errors in this area, which has led to substantial improvements in patient safety.
In this work, the photoplethysmography technique (PPG) is put into practice. This technique consists of an optical system capable of measuring changes in the volume on the surface of the human body, at the top part of the forehead (which is a product of the body’s blood supply), thereby providing valuable information about the cardiovascular and respiratory systems. Some researchers have used this technique alongside the application of optical devices in contact with the skin to observe these changes. The use of optics sensors in PPG always requires the patient to maintain body contact (for example, using a finger) with the devices to acquire the heart rate signal, which makes this process sensitive to motion artifacts and misplacements of the study region, but, for precise heart rate estimation, the technique described in this article uses a mobile app that obtains the pulses per minute (PPM), with high precision and without direct contact with the patient, by using the camera of the mobile device. Selvaraj et al. [5] performed a study to compare the results of the heart rate variability (HRV) obtained from a finger-tip PPG and a standard lead ECG, showing a resemblance between both measures. In the same way, Lin et al. [6] developed a pulse rate detection method for a computer mouse with the use of PPG sensors, proving that the heart rate signal can also be extracted from the palms with satisfactory results. On the other hand, Gambi et al. in 2017 [7], described the use of a Microsoft Kinect to validate contactless heart rate estimation through the camera of the device and the analysis of the acquired data using different algorithms. Also, a method for measuring multiple physiological parameters using a webcam was introduced by Poh et al. in 2010, who achieved high degrees of agreement between the measurements across all physiological parameters (heart rate, HRV, and respiratory rate) using video recordings and signal processing methods [8]. There is also an application from the company Philips (a vital signs camera) that uses an iPad2 to measure the heart and breathing rates, as well as an application based on the MIT technology developed by Cardiio Inc., which measures the heart rate from a distance using a mobile device camera to measure the heart rate on the iOS platform. Based on these technological acquisition principles, we created our mathematical method and procedure to acquire PPM using a mobile device.
The technique presented here contributes to new advances in technology and health because it is a non-invasive technique that allows one to estimate the heart rate through the use of common mobile devices, which, through cameras and algorithms, are able to easily determine real-time variations in skin color that are imperceptible to the eye. This method provides a new application for the conventional mobile devices that we have today within our reach, allowing us to monitor the vital signs of users and, in turn, facilitating the prevention of diseases. This non-invasive contactless application allows users to determine their health condition without the need for medical equipment. In addition, this tool is able to be used on patients without limbs, since it does not require direct contact.
This paper presents a methodology, using a mobile application, for using images obtained by a video camera on a mobile device in the real-time estimation of heart rate based on the changes of tonality that occur on the skin. These readings are performed without the necessity for physical contact with the patient.

2. Materials and Methods

2.1. Characteristics of Equipment Used

The application was developed under the iOS operating system on iPhone mobile devices and has the ability to migrate to other mobile platforms, such as Android, Windows Phone, etc. This portability is possible with the use of libraries provided by the manufacturer (Accelerate Framework) and the OpenCV library [9] for image processing. In the process of acquisition, the 7-megapixel front camera integrated into the phone was used; this camera has the ability to produce images with a resolution up to 1280 pixels × 720 pixels.
In the developed algorithm, under the difficulties of outdoor lighting and to improve the accuracy of the received readings, it was necessary to implement external lighting in the application by providing maximum illumination on the phone’s screen. To compare the robustness of our application, generic heart rate and oximetry measurement equipment was used as a reference measure during the performed tests.

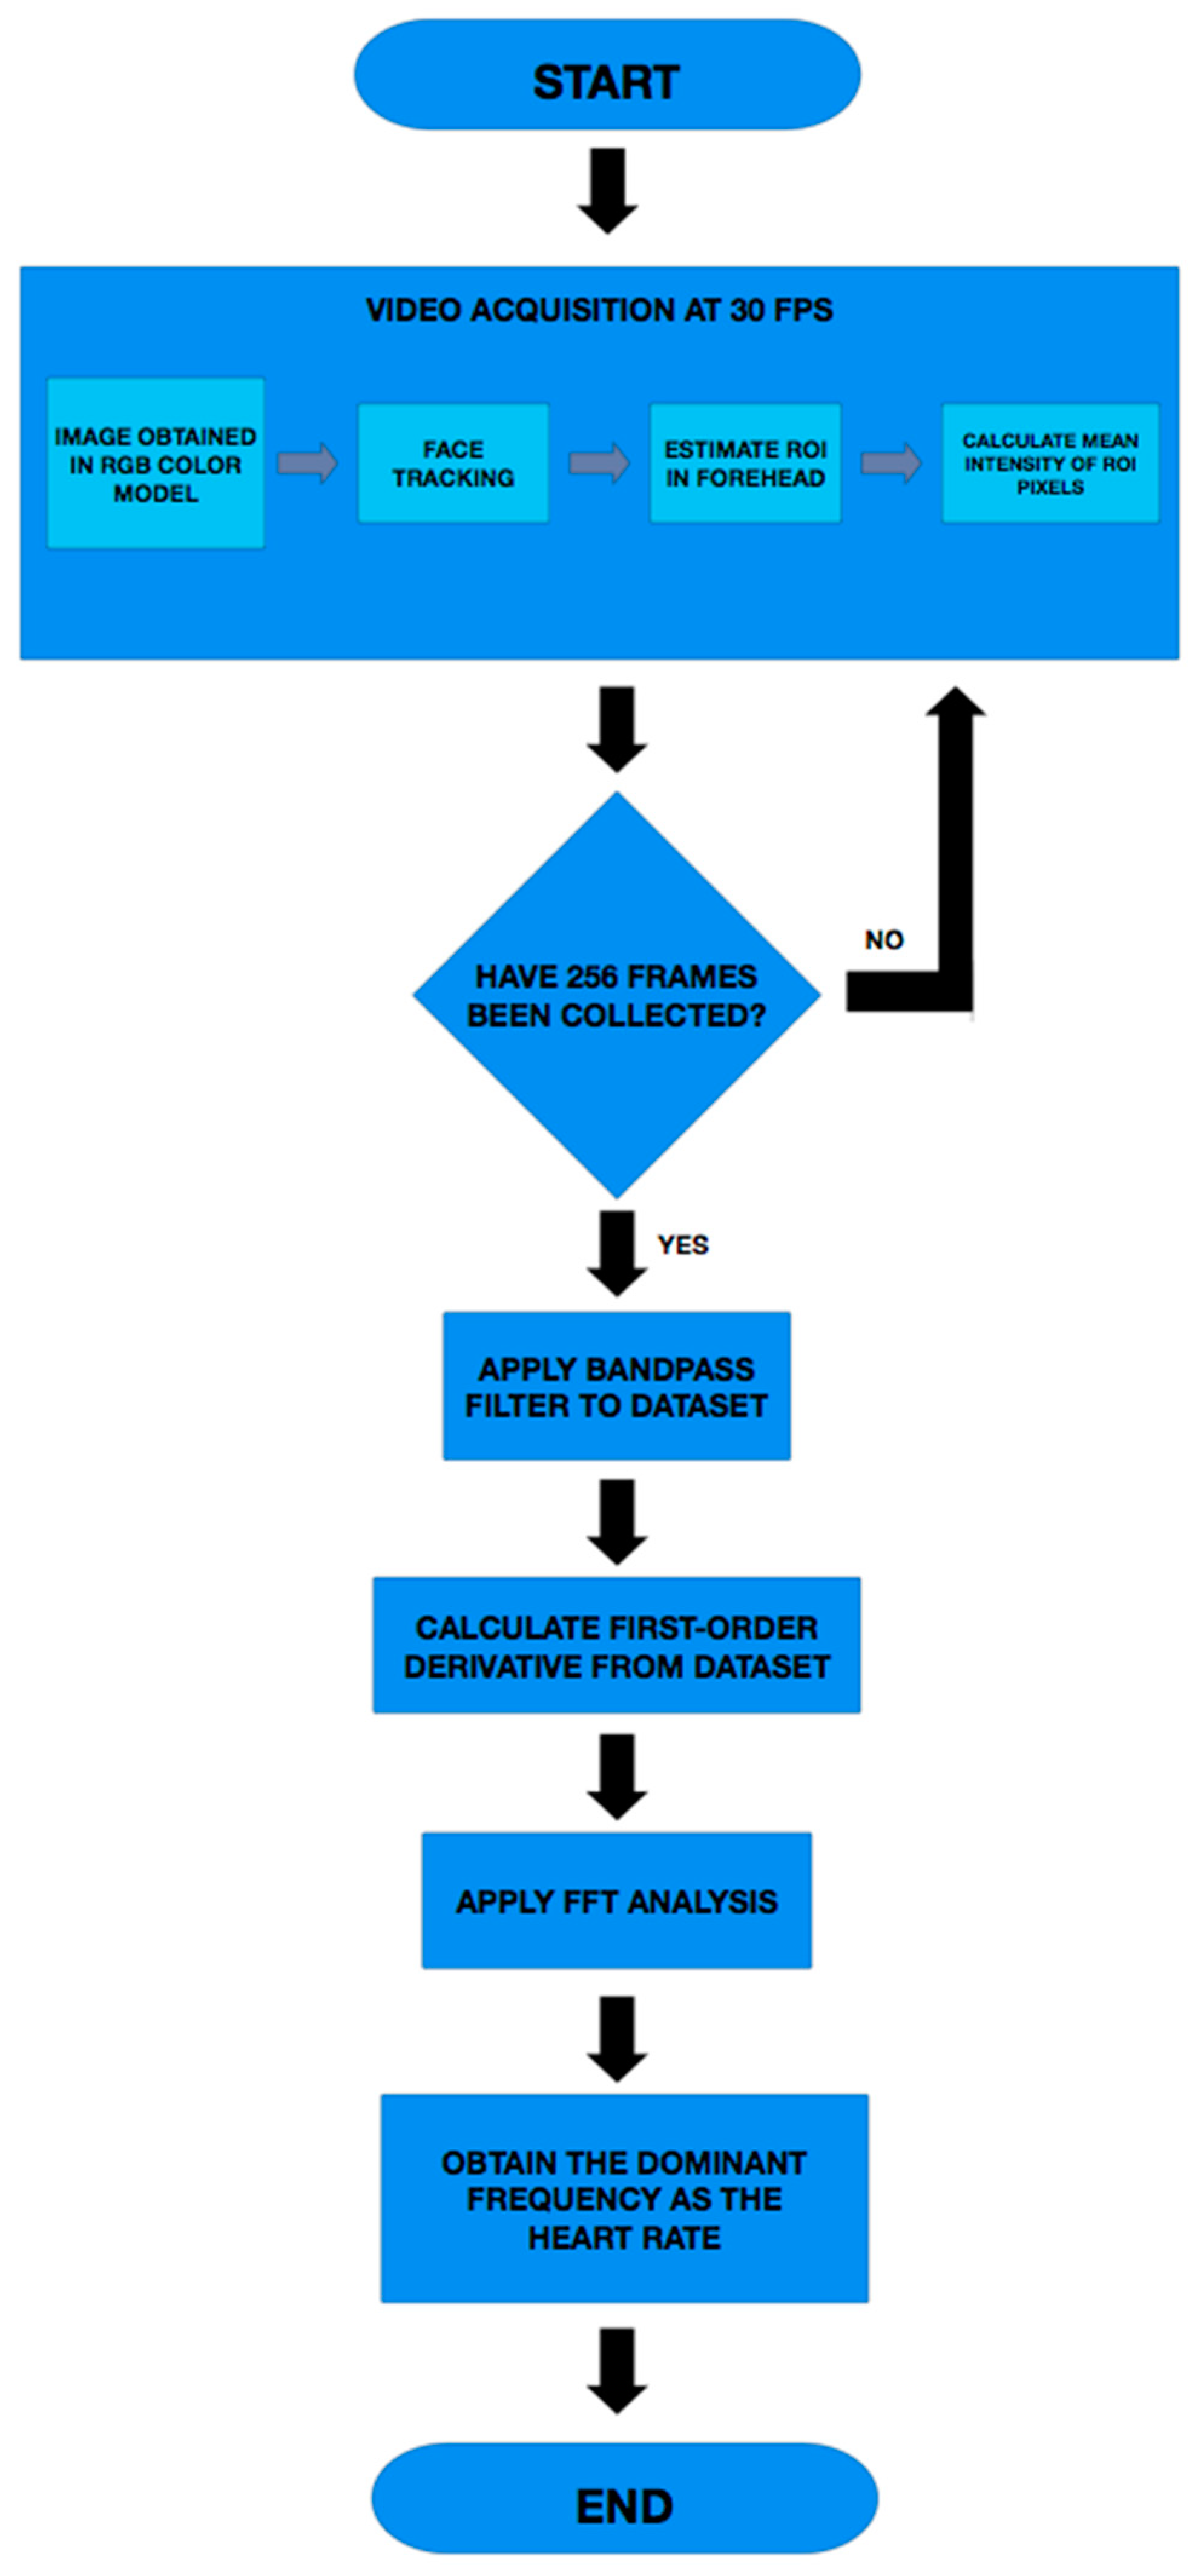
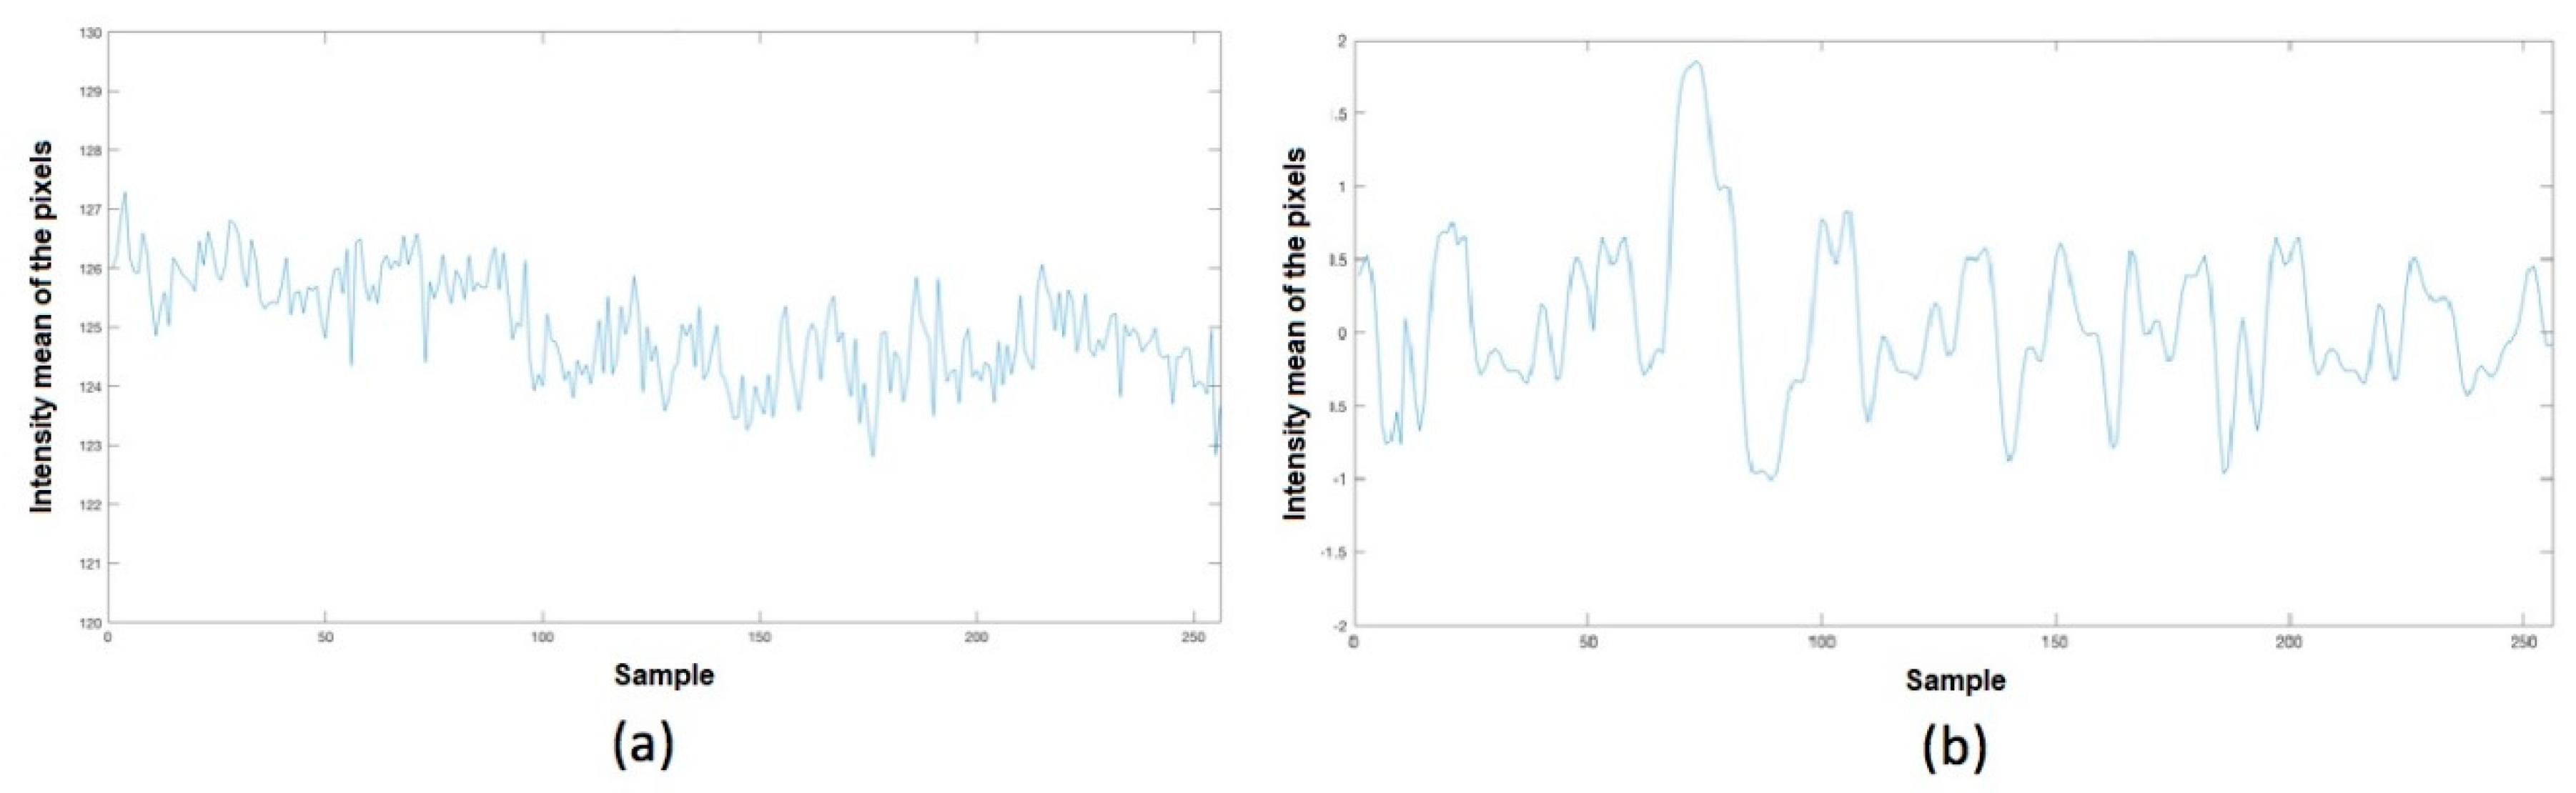
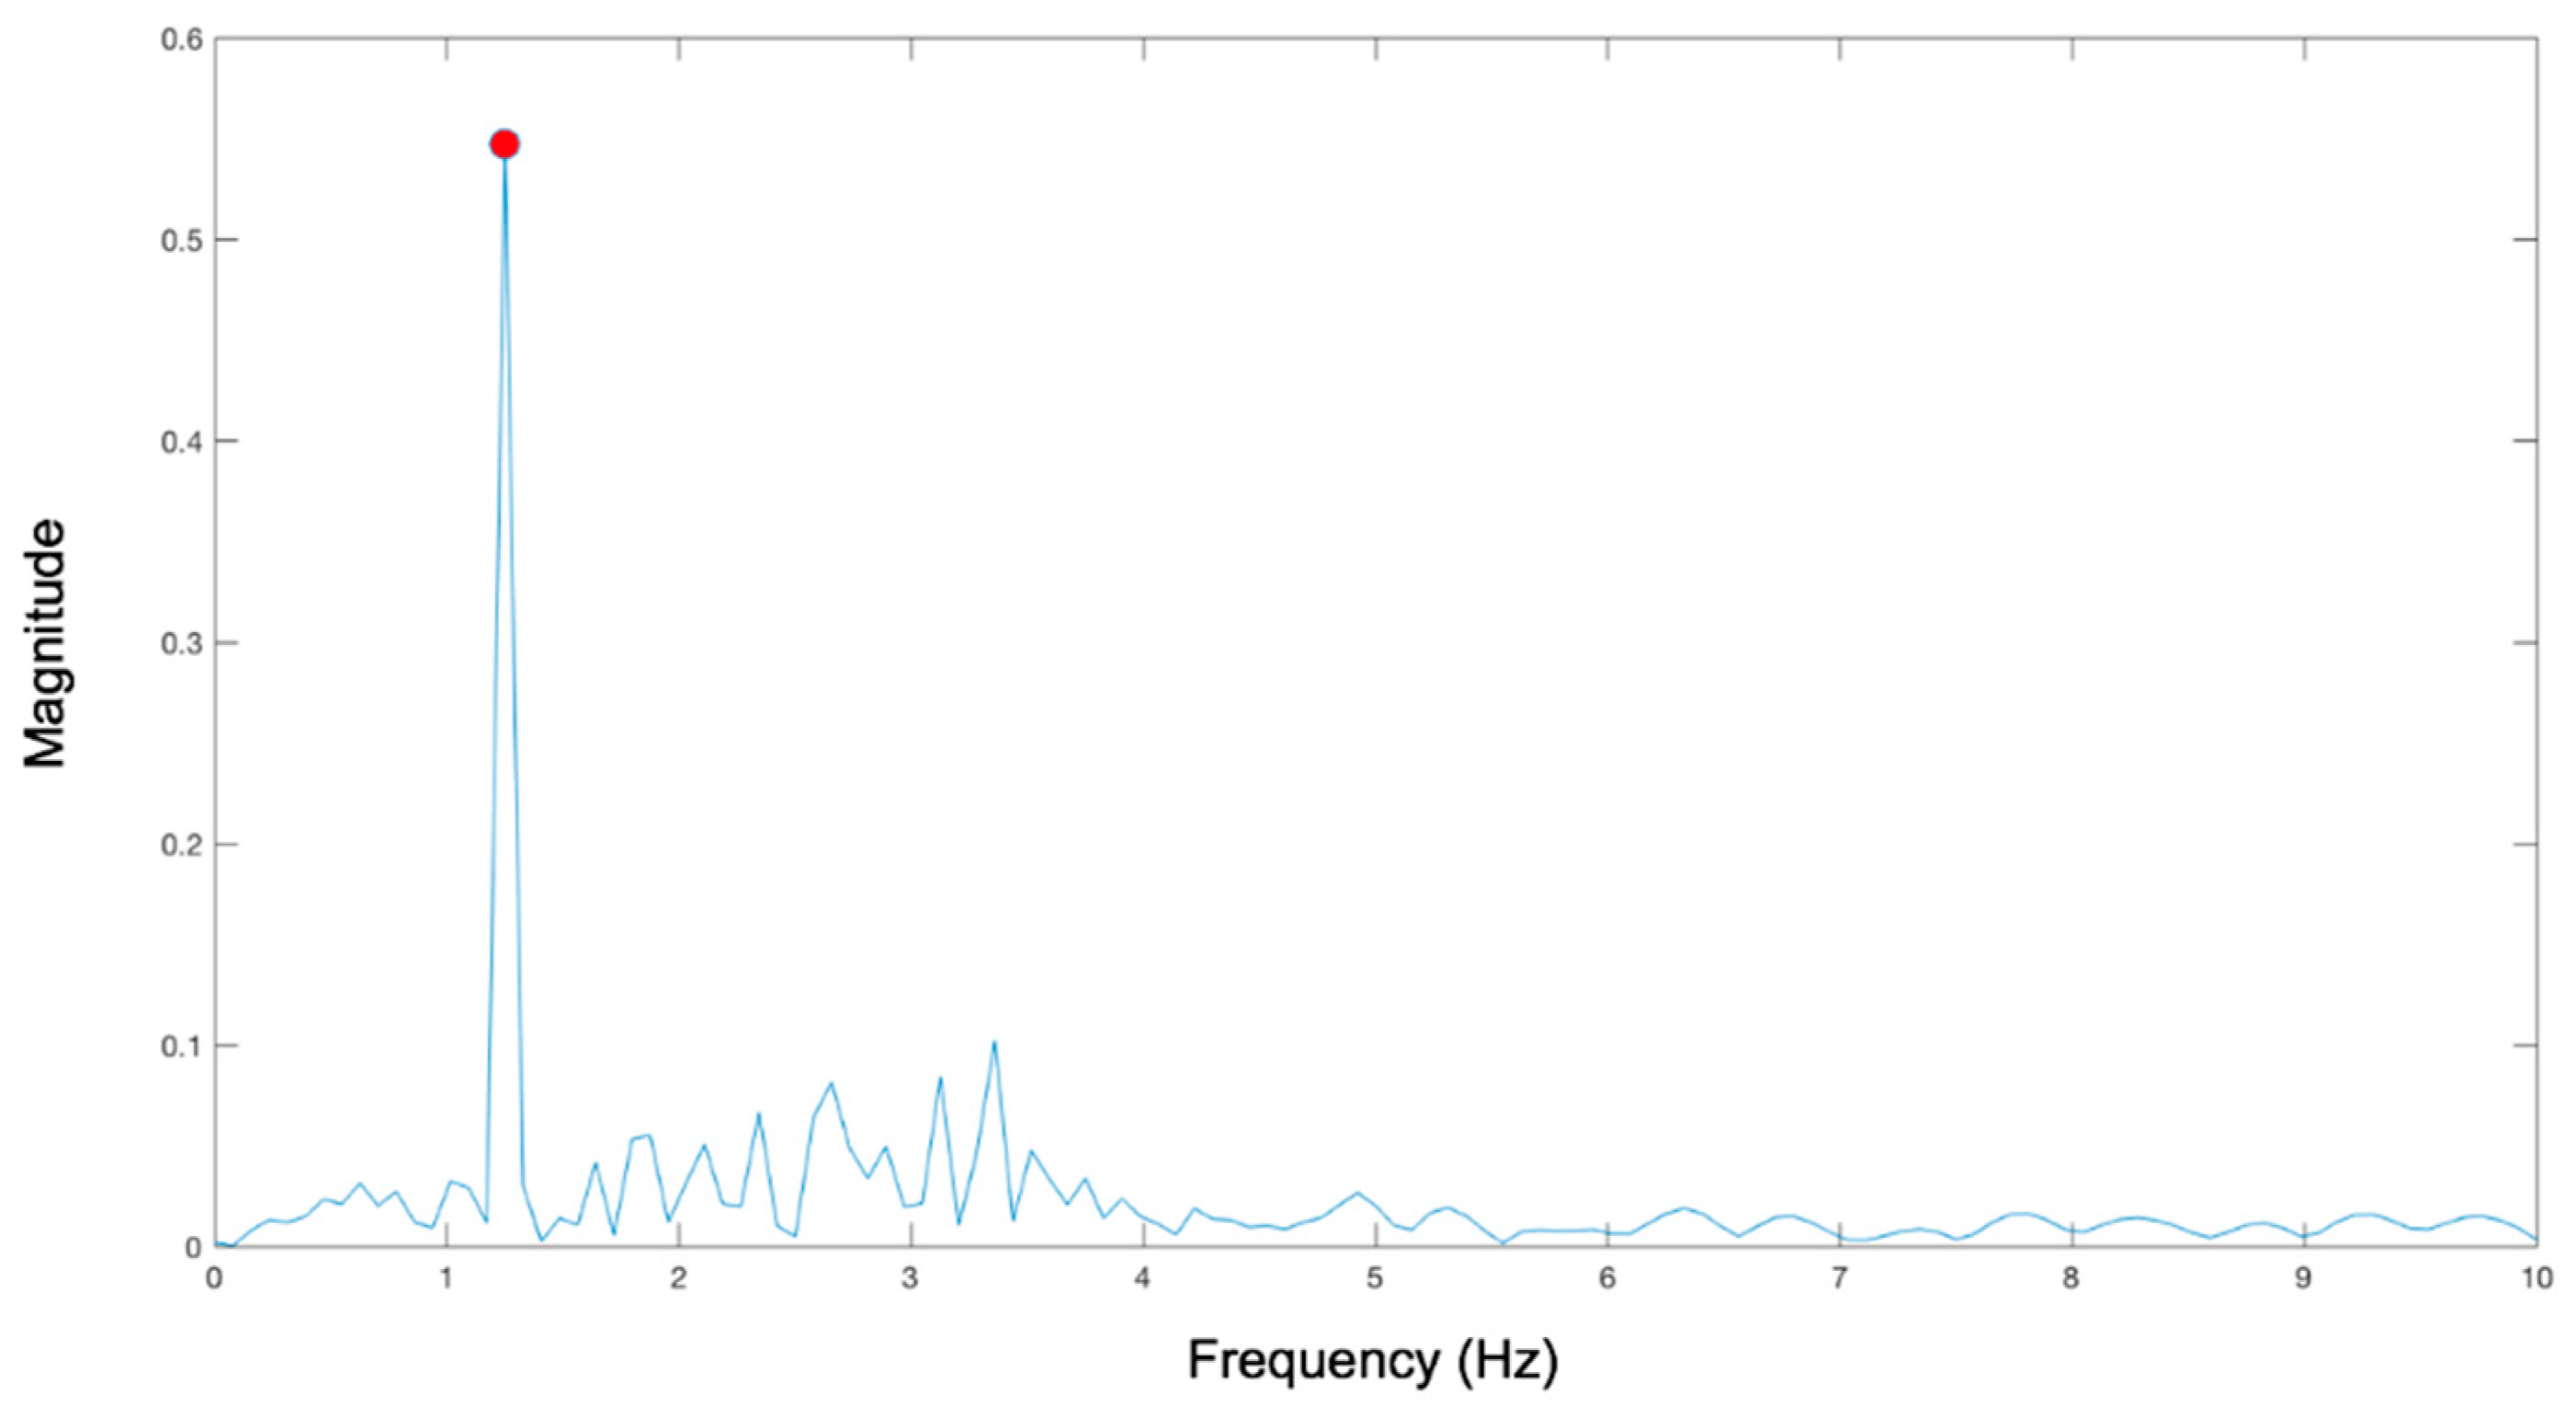
2.2. Implemented Technique
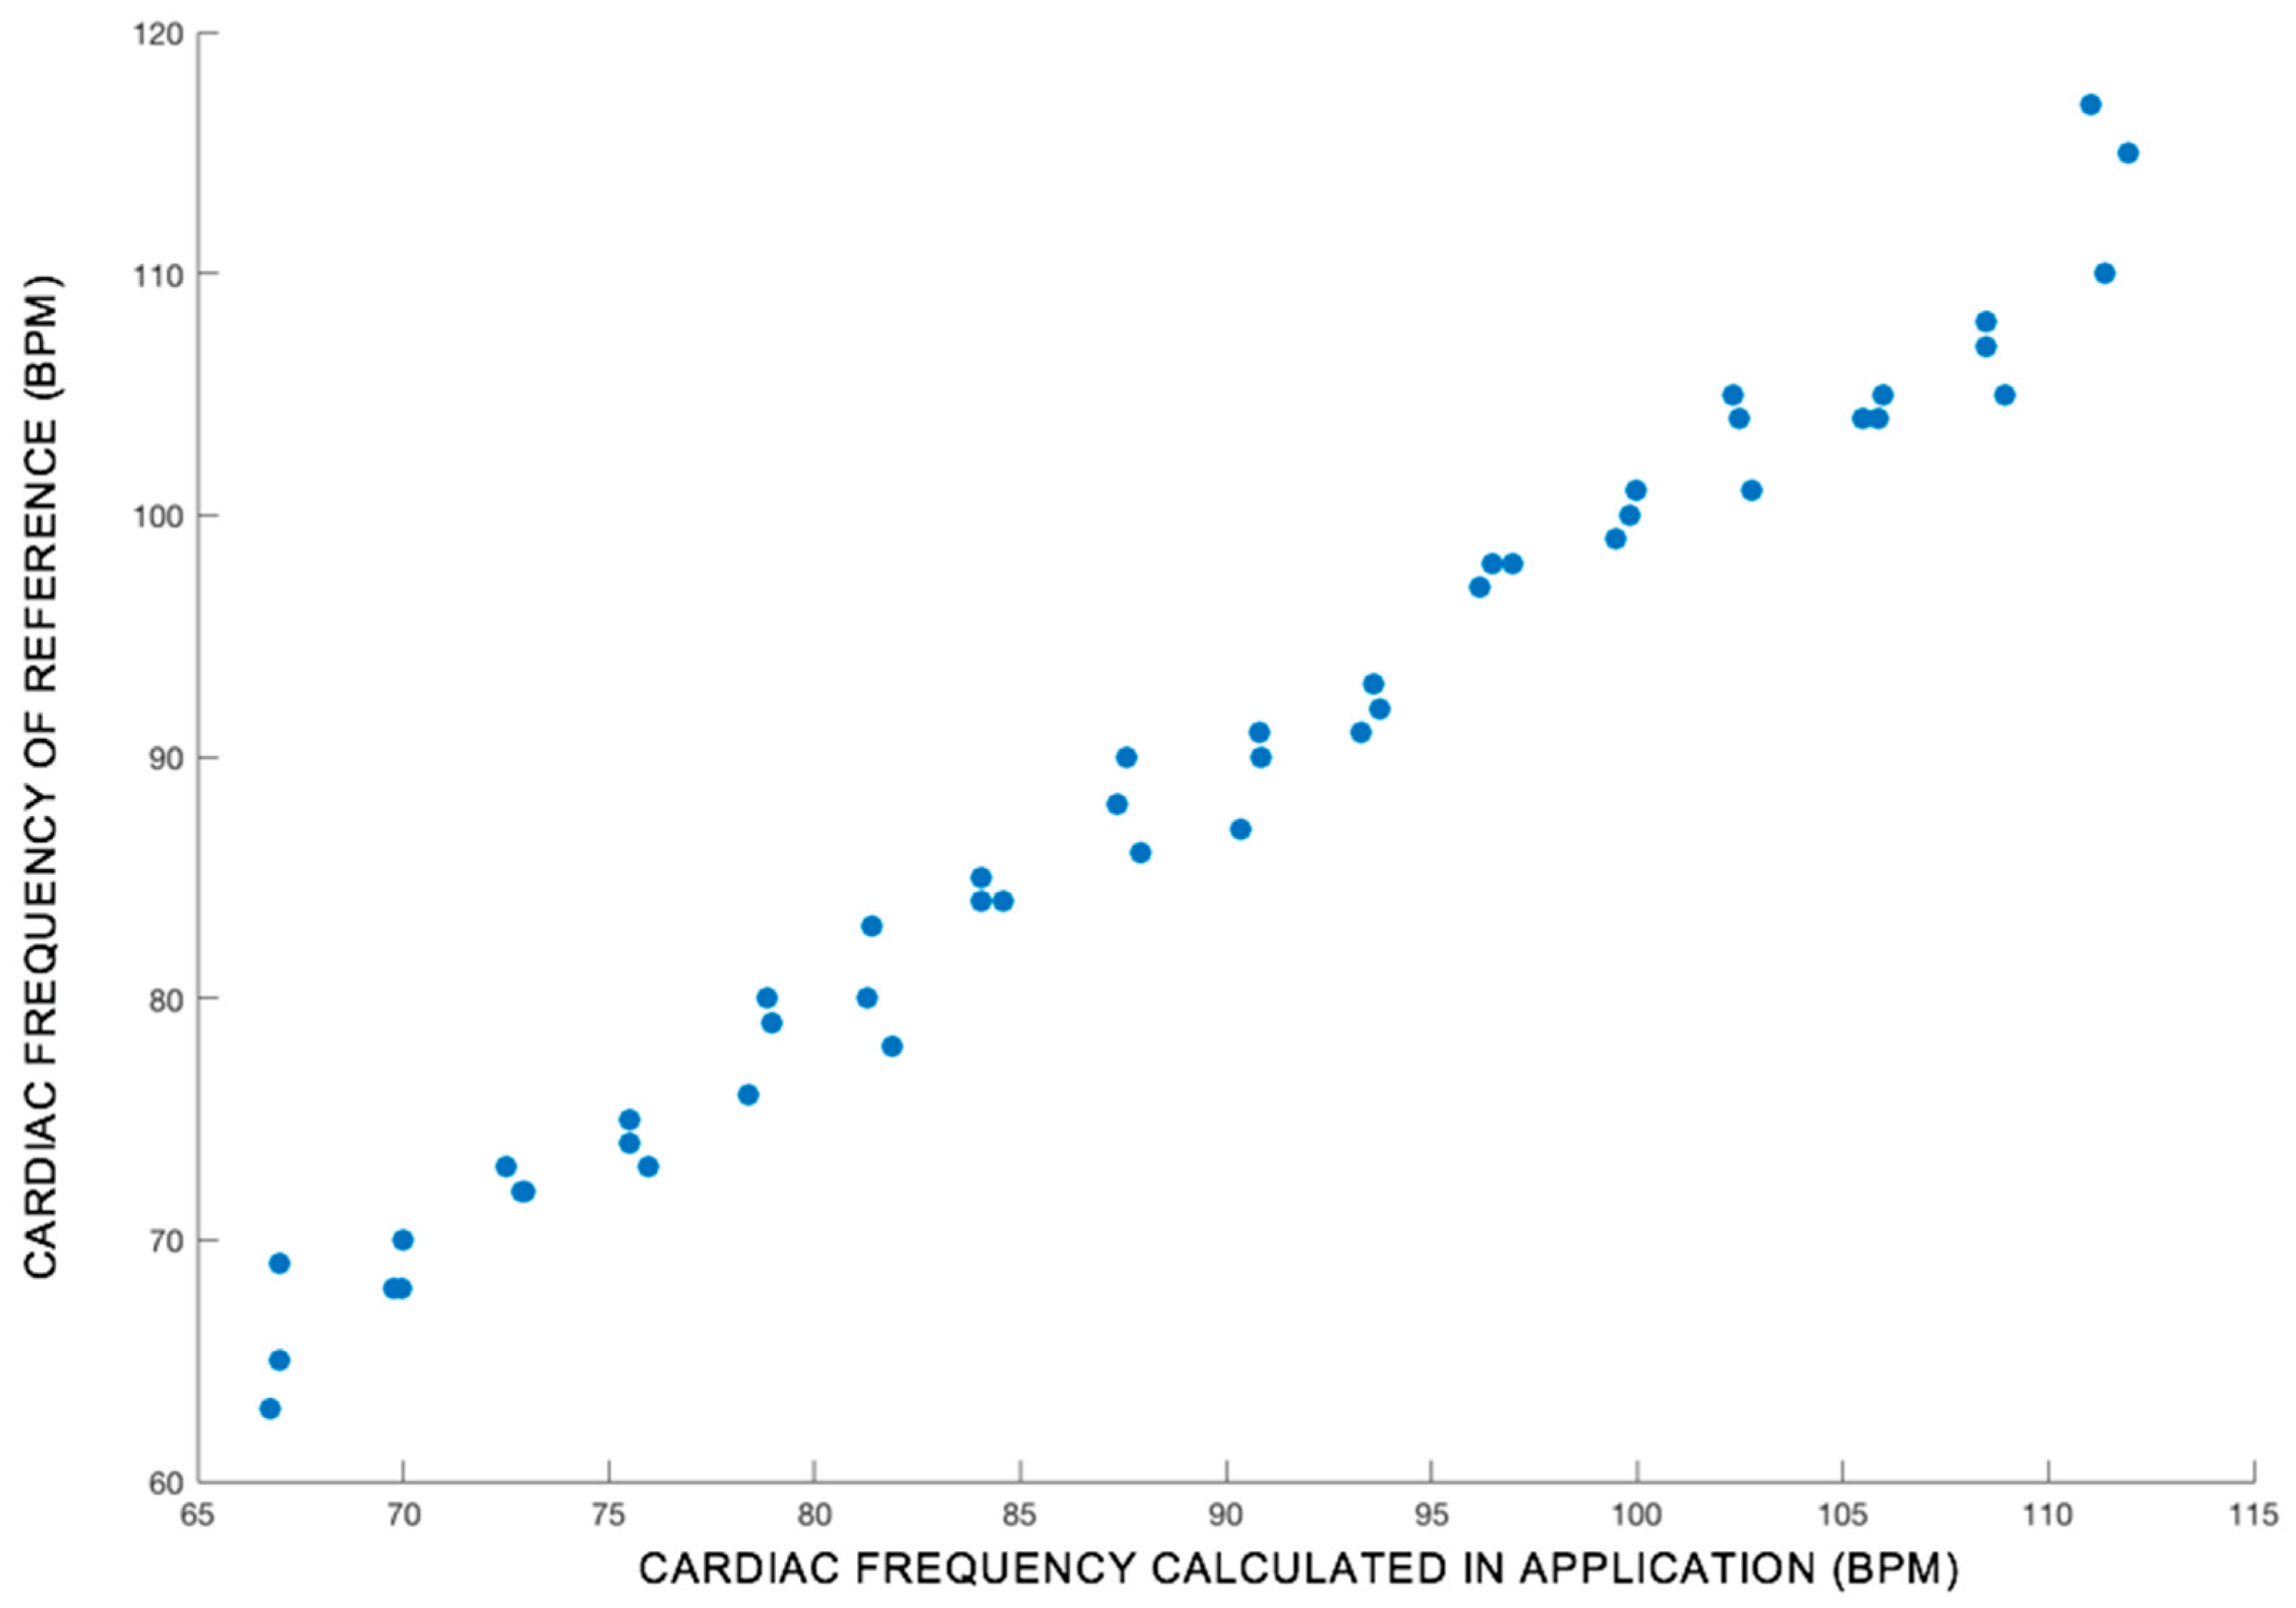
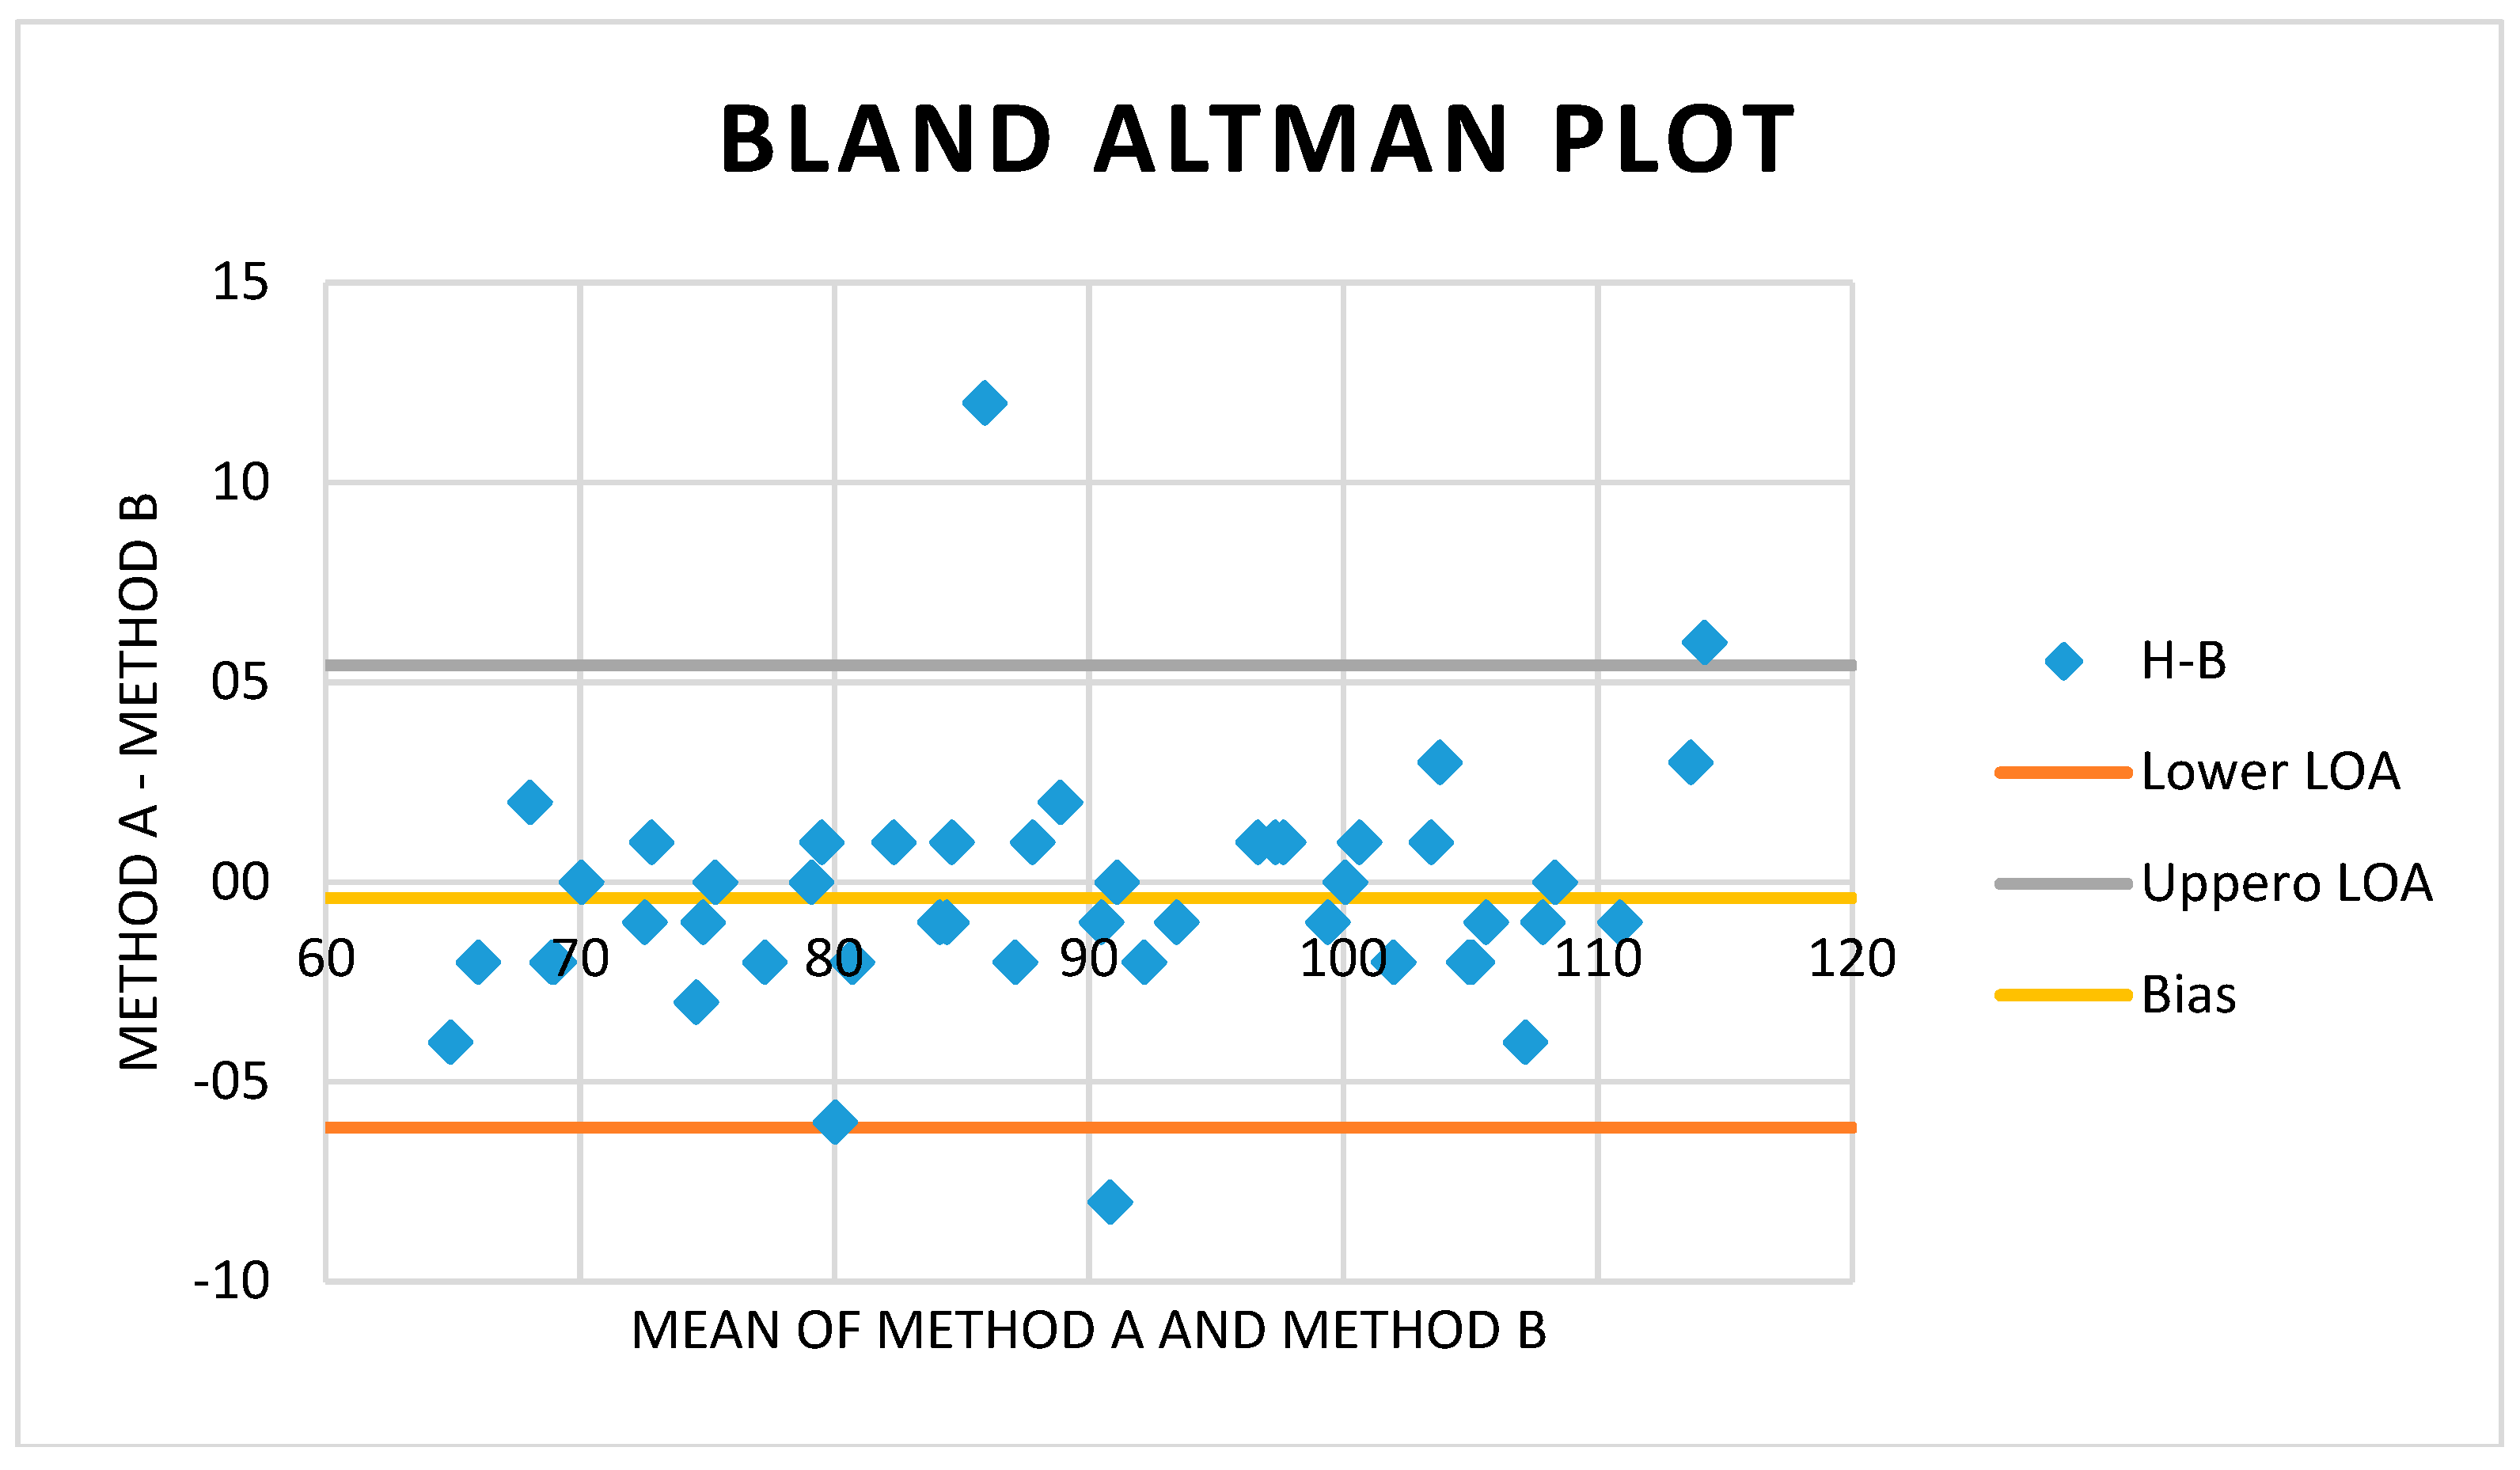
For the development of the application, it was necessary to declare the permissions and the corresponding validations to make use of the camera of the phone. These permissions must be executed at the beginning of the application. The first step is to obtain a video of 30 frames per second (FPS) with a resolution of 640 pixels × 480 pixels with a Red, Green, and Blue Channels (RGB) color model for the formation of real color images. We positioned an image acquisition box in the central part of the forehead, because this is a region of the human body that has a wide and uniform area, from where the necessary information to process can be acquired. The methodology involved in the estimation of the heart rate, through our application, is displayed in Figure 1.
For accurate identification of the section of the face from which the information was acquired, it was necessary to use the Haar cascade classifier according to the following equation:
H ( x ) = s i g n i = 1 τ a i h i ( x ) .
Once the signal is obtained, the normalized images are applied by the variance process, according to the following expression:
I G ( x , y ) = I G ( x , y ) μ ( I ) σ ( I ) .
Then, it is necessary to apply normalization preprocessing based on Haar features to the video, which includes a set of images according to the following equation:
F H a a r = ( x , y ) N I ( x , y ) ( x , y ) B I ( x , y ) σ ( I ) .
The flowchart of the process implemented in this application is shown in the Figure 2.
For each frame that is obtained during video processing, a tracing of a region of the face is performed using a Haar cascade classifier based on the location of reference points, such as eyes, nose, mouth, and face contour. The cascade classifier used in the face tracking step has shown great performance and stability in object detection when a correct configuration is made [10]. Once the box on the top part of the forehead is obtained, as shown in Figure 3 (left side), the average intensity of the pixels analyzed in the green channel of the RGB model over the specific region or area is obtained, as shown in Figure 3 (right side).
This theory describes the red channel to be the most suitable for detecting the blood supply, but based on our experimentation, we determined that the green channel provides more accurate information with less susceptibility to the outdoor environment; green light has a higher frequency compared to the red channel because it is more easily refracted, thereby generating better acquisition results.
The previous process is repeated continuously until it samples 256 frames in approximately 8.5 s, which allows an analysis of the information signal from the selected frame to be performed during the time chosen for processing. This signal has a low SNR because the acquisition of information is not by direct contact; rather, it is done from a distance. However, the values obtained have an accurate magnitude, and it is possible to differentiate between the signal and the noise.
The important information of the signal includes the harmonics obtained from the images, specifically the base or predominant harmonics of the frames, through which the PPM will be obtained by mathematical processing.
Once the values associated with the intensity are acquired, they are stored in an information vector for further processing. The next step is to apply a 5th order bandpass Butterworth filter with a frequency range of 0.5 Hz to 3.1 Hz to eliminate any other unwanted signal that could affect the correct interpretation of the information associated with the cardiac pulse. Figure 4 describes the relationship between the obtained signal (a) and the filtered signal (b).
Once the information signal from the frame of the image of interest is acquired and processed, we proceed to obtain the derivative (rate of change) of the signal obtained so that the slope can be more strongly illustrated. This slope is the exchange ratio that occurs during the cardiovascular irrigation process, which will provide us with a more accurate heart rate estimate in the next process. The signal with the derivative process applied can be observed in Figure 5b. The derivative of the signal is used to detect the exchange ratio of the information signal—data that are associated with the heart rate.
The following procedure is used to apply the fast Fourier transform algorithm to convert a signal in the time domain and transfer it to the frequency domain to find the central frequency and carrier of the information signal and, with this, to obtain the number of estimated heartbeats per minute. The frequency with the highest magnitude of Fast Fourier Transform (FFT) data will be related to the cardiac frequency of the user, as clearly observed in Figure 6.
X N ( k ) = X ( N ) ( K ) = n = 0 N 1 x ( n ) e j 2 π k n / N
The final result is displayed as an integer, represented by the pulsations per minute. In the graphical interface of the application, some indicators were placed in the lower part based on the colors that determine the following states: green for an acceptable value, red for a critical value, and yellow for an incorrect reading.
The developed application has an optimized algorithm, which improves the processing of the information by programming its functions in parallel. The libraries provided by the manufacturer are used to request the resources required for image capture and face tracking, as well to execute and process the analysis to obtain the average intensity of the volume of data in the green channel in conjunction with the derivative and the fast Fourier transform, thereby obtaining results instantly to provide the user with effective results in real time.
Thanks to the technical and technological features found in today’s smartphones, the processes developed here can be performed efficiently and in real time, providing equivalent or superior performance to a conventional computer, without the problematic lack of computational resources that can compromise a device’s operation. The methodology presented has been developed for the iOS platform, but, thanks to the portability of the used libraries, this application can be developed with the same structure and functionality for Android or Windows Phone devices.

3. Results

To verify the results of the algorithm implemented in the application, a generic medical-grade pulse meter was used to obtain the reference readings, which will serve as a comparison with our results. In this study, two measurements were made on each of the 47 subjects. Some of the values of the test blocks made and obtained using our application and using the medical pulse-oximeter are shown in Table 1.
Through an ongoing process of acquisition and comparison—with respect to the medical pulse-oximeter (reference device)—our application showed an error rate of approximately 3% to 5%, as shown in Table 2. Error calculation was performed by obtaining the absolute error and the relative error. The population investigated included 47 healthy volunteer subjects, with an age range between 18 and 22 years, in an environment with artificial lighting, at rest in a chair.
Figure 7 shows a graphical representation of the relationship between the two methods, between the readings of our application and the readings of the pulse-oximeter. This figure shows the heart rate accuracy of our application and where the margin of error is acceptable.
The Bland–Altman method was used as a graphic method to compare the two measurement techniques acquired from the same quantitative variable (in the present investigation, this variable is heart rate). This method measures the difference between the acquisition method of a medical pulse-oximeter compared to our application. Figure 8 shows the graph with the Bland–Altman method to quantify the average between both methods, obtaining more than 95% reliability in the data obtained, thereby verifying the variability and precision of the techniques.
The average of the two measurements is plotted along the horizontal axis, and the difference between the two methods is plotted along the vertical axis.
We can observe in Figure 8, through a visual impression of the Bland–Altman graph, that the data obtained by our application, in comparison to the reference device, have high precision. Most of the data are within the agreed limits, thus validating the certainty and precision of the technique used.
Table 2 describes the statistical study made between the two methods and shows a report of the basic descriptive statistics and confidence intervals for the two variables and their differences.
As seen in Table 2, the correlation coefficient is 0.97, which illustrates that our application has a perfect positive linear association with the comparison device. Based on this index, our application has an error rate of approximately 3 to 5%, as described in the results section.

4. Discussion

At present, there are some applications that obtain heart rate per minute in real time using the face (the Cardiio: Heart Rate Monitor and Philips Vital signs camera), but the technique we present uses mathematical and filtering methods as an innovative process. The current contactless technologies, which are scarce, perform processing through acquisition, storage, and subsequent processing to obtain the results, which include the heart rate, without performing real-time estimation and analysis [11,12,13,14]. There were several stages of development before reaching the final product presented in this paper. For example, other platforms were used to test different algorithms, such as Raspbian (Raspberry Pi), a computer and webcam, etc. The evolution of the techniques developed using these other technologies provided us with the necessary experience to develop the present application for a mobile device.
The sampling of 30 images per second was done to obtain the greatest amount of information from the video. In theory, with a sampling of seven images per second, one could acquire a heart rate signal because the Nyquist–Shannon sampling theorem mentions that in order to achieve an exact reconstruction of a periodic signal, the sampling rate must be more than twice the frequency of the signal to be found [15]. According to Ori et al. [16], in their research on the analysis of the components in the frequency domain of the HRV measures, heart rate values can be found in the frequencies between 0.7 Hertz and 3.4 Hertz.
A comparison was made between the different data provided by the information channels of the RGB color model and the hue, saturation, and the value channels of the HSV model with the purpose of obtaining a signal from the data that is more suitable for correctly obtaining a cardiac pulse. The red and green channel of the RGB format gives us the most suitable values for estimating heart rate, without having to perform a conversion to other models of image representation. This criterion reduces the computational time of the system by not performing a format conversion.
The data obtained after applying the filtering step and the algorithm of the fast Fourier transform gave us inconsistent frequency values, which did not correspond to the heart rate frequency. Therefore, we decided to apply an additional process in the development of the application—a mathematical module that performs the first-order derivative of the signal acquired from the filtering process, in order to obtain the rate of change prior to the application of FFT (fast Fourier transform). The mentioned implementation gave us a more accurate, consistent, and reliable estimate throughout the sampling. Also, the Apple Accelerate framework provides exceptional performance in handling computational resources and has a better processing time compared to other libraries.

5. Conclusions

This study describes, implements, and evaluates a method of measuring and estimating heart rate from video recordings of a specific area of the face through a mobile device, using the front camera of the element, thereby allowing portability via the use of a cellphone to obtain different physiological measures.
Based on the analysis of Bland and Altman, it is possible to graphically describe the feasibility and accuracy of the experiment, as well as the validation of the experimental data, and quickly observe if these data are within an acceptable range compared to the reference device.
The correlation coefficient obtained is high in comparison to the reference device, which demonstrates that the technique used in our application offers technical feasibility and a reliable acquisition process for heart rate readings.
The conventional methods for acquiring signals use elements that require contact with the patient or only acquire information for immediate state changes in a specific region of the body, without applying mathematical and statistical processing of the information. Some methods use invasive methods that compromise patient comfort and reliability in the readings via unwanted evoked potentials. The method presented here provides a solution for obtaining physiological measurements in a simple, portable, and robust approach, with mathematical processing through a non-contact method, thus allowing continuous scanning via a mobile application.
The developed application has a friendly, intuitive, and simple interface that preserves the history of the readings acquired for later consultation. This application is a viable alternative for obtaining cardiac pulses without the necessity of using medical physiological monitors, thus providing a solution for any user. This application shows robustness in its processing of images, granting a degree of reliability in the readings and the result granted (PPM).
The results were obtained in an environment with artificial lighting, with a population of 47 healthy subjects (both sexes) and an age range of 18 to 22 years, with the subjects at rest. According to the procedure and acquisition method applied, the experiment and application are favorable, with a high accuracy rate and a margin of error between 3% and 5%.
One of the problems or limitations in the acquisition of signals through the image acquisition method arose when the experiments were carried out under dark scenarios or in an environment with fluorescent lamps; this type of lamp generated interference and added noise to the acquisition signal, thereby producing unfavorable interference in the information and generating an inadequate PPM reading for the user.
Future work will be to extract other physiological parameters via the same method, such as blood pressure and oximetry, and to develop an application with more complete medical information and a more precise definition of the health status of the user.

Author Contributions

J.R.M.-R. designed the video acquisition system and proposed the algorithm for processing the acquired data; T.A.R.-R. conceived and developed the application for mobile devices; A.A.F.-J. guided the development of the application with support in signal processing and designed the experiments; N.E.G.P. performed the experiments and wrote the paper; J.J.S.O. analyzed and discussed the obtained results. All authors have read and agreed to the published version of the manuscript.

Funding

This research received no external funding.

Acknowledgments

The authors thank the Universidad Politécnica de Sinaloa (UPSIN) and the Universidad Politécnica de Madrid (UPM) and BIOMEDIXT S. de R.L. de C.V. for research support.

Conflicts of Interest

The authors declare no conflict of interest.

Ethical Statements

All subjects gave their informed consent for inclusion before they participated in the study. The study was conducted in accordance with the Declaration of Helsinki, and the protocol was approved.

Abbreviations

The following abbreviations are used in this manuscript:
PPGPhotoplethysmography
HRHeart Rate
FFTFast Fourier Transform
ROIRegion of Interest
FPSFrames Per Second
ECGElectrocardiography
HRVHeart Rate Variability
PPMPulses Per Minute
RGBRed, Green, and Blue Channels
PPMPulses Per Minute

References

  1. World Health Organization. Cardiovascular Diseases (CVDS): Fact Sheet No. 317. 2011; World Health Organization Google Scholar: Geneva, Switzerland, 2011. [Google Scholar]
  2. McCann, K.; Holdgate, A.; Mahammad, R.; Waddington, A. Accuracy of ECG electrode placement by emergency department clinicians. Emerg. Med. Australas. 2007, 19, 442–448. [Google Scholar] [CrossRef] [PubMed]
  3. Baek, J.-Y.; An, J.-H.; Choi, J.-M.; Park, K.-S.; Lee, S.-H. Flexible polymeric dry electrodes for the long-term monitoring of ecg. Sens. Actuators A Phys. 2008, 143, 423–429. [Google Scholar] [CrossRef]
  4. Bates, D.W.; Cohen, M.; Leape, L.L.; Overhage, J.M.; Shabot, M.M.; Sheridan, T. Reducing the frequency of errors in medicine using information technology. J. Am. Med. Inform. Assoc. 2001, 8, 299–308. [Google Scholar] [CrossRef] [PubMed] [Green Version]
  5. Selvaraj, N.; Jaryal, A.; Santhosh, J.; Deepak, K.K.; Anand, S. Assessment of heart rate variability derived from finger-tip photoplethysmography as compared to electrocardiography. J. Med. Eng. Technol. 2008, 32, 479–484. [Google Scholar] [CrossRef] [PubMed]
  6. Lin, S.-T.; Chen, W.-H.; Lin, Y.-H. A pulse rate detection method for mouse application based on multi-PPG sensors. Sensors 2017, 17, 1628. [Google Scholar]
  7. Gambi, E.; Agostinelli, A.; Belli, A.; Burattini, L.; Cippitelli, E.; Fioretti, S.; Pierleoni, P.; Ricciuti, M.; Sbrollini, A.; Spinsante, S. Heart rate detection using microsoft kinect: Validation and comparison to wearable devices. Sensors 2017, 17, 1776. [Google Scholar] [CrossRef] [PubMed]
  8. Poh, M.-Z.; McDuff, D.J.; Picard, R.W. Advancements in noncontact, multiparameter physiological measurements using a webcam. IEEE Trans. Biomed. Eng. 2011, 58, 7–11. [Google Scholar] [CrossRef] [PubMed] [Green Version]
  9. Bradski, G. OpenCV library. Dr. Dobbs J. 2000, 25, 120–126. [Google Scholar]
  10. Viola, P.; Jones, M. In Rapid object detection using a boosted cascade of simple features. In Proceedings of the 2001 IEEE Computer Society Conference on Computer Vision and Pattern Recognition, CVPR 2001, Kauai, HI, USA, 8–14 December 2001; IEEE: Piscataway, NJ, USA, 2001; p. 1. [Google Scholar]
  11. Bal, U. Non-contact estimation of heart rate and oxygen saturation using ambient light. Biomed. Opt. Express 2015, 6, 86–97. [Google Scholar] [CrossRef] [PubMed] [Green Version]
  12. Humphreys, K.; Ward, T.; Markham, C. Noncontact simultaneous dual wavelength photoplethysmography: A further step toward noncontact pulse oximetry. Rev. Sci. Instrum. 2007, 78, 044304. [Google Scholar] [CrossRef] [PubMed]
  13. Takano, C.; Ohta, Y. Heart rate measurement based on a time-lapse image. Med. Eng. Phys. 2007, 29, 853–857. [Google Scholar] [CrossRef] [PubMed]
  14. Tarassenko, L.; Villarroel, M.; Guazzi, A.; Jorge, J.; Clifton, D.; Pugh, C. Non-contact video-based vital sign monitoring using ambient light and auto-regressive models. Physiol. Meas. 2014, 35, 807. [Google Scholar] [CrossRef] [PubMed]
  15. Jerri, A.J. The shannon sampling theorem—Its various extensions and applications: A tutorial review. Proc. IEEE 1977, 65, 1565–1596. [Google Scholar] [CrossRef]
  16. Ori, Z.; Monir, G.; Weiss, J.; Sayhouni, X.; Singer, D. Heart rate variability. Frequency domain analysis. Cardiol. Clin. 1992, 10, 499–537. [Google Scholar] [CrossRef]
Figure 1. Methodology of the estimated hearth rate solution.
Applsci 10 00154 g001
Figure 2. Flowchart of the process implemented in the application.
Applsci 10 00154 g002
Figure 3. Mean intensity obtained from the pixels in the study area over time.
Applsci 10 00154 g003
Figure 4. Comparison of the signals: (a) signal acquired in the first step of the algorithm; (b) signal with a passband filter of 0.5 Hz to 3.1 Hz applied.
Applsci 10 00154 g004
Figure 5. Comparison of the signals: (a) signal with a passband filter of 0.5 Hz to 3.1 Hz applied; (b) signal processed with the derivative module of our application.
Applsci 10 00154 g005
Figure 6. Result obtained from the analysis of the data with the fast Fourier transform (FFT) process.
Applsci 10 00154 g006
Figure 7. Relationship between the two methods, the reference values, and the values obtained by our application.
Applsci 10 00154 g007
Figure 8. Bland–Altman plot between the reference values and the values obtained by our application.
Applsci 10 00154 g008
Table 1. Pulses per minute (PPM) values obtained (less 20%) in different subjects during the validation process.
Reference PPMApplication Estimated PPM
6765
7070
8283
8485
8788
8890
10099
106104
108107
111110
Table 2. Descriptive statistics between the two methods and their correlation coefficients.
Descriptive Statistics
VariableCountMeanStandard Deviation95% LCL of Mean95% UCL of Mean
POX reference device4789.4013.985.493.38
App PPM4789.0414.484.993.2
Correlation Coefficient 0.97898971

