
How Well Does the CWEQ II Measure Structural Empowerment? Findings from Applying Item Response Theory


Abstract
:1. Introduction
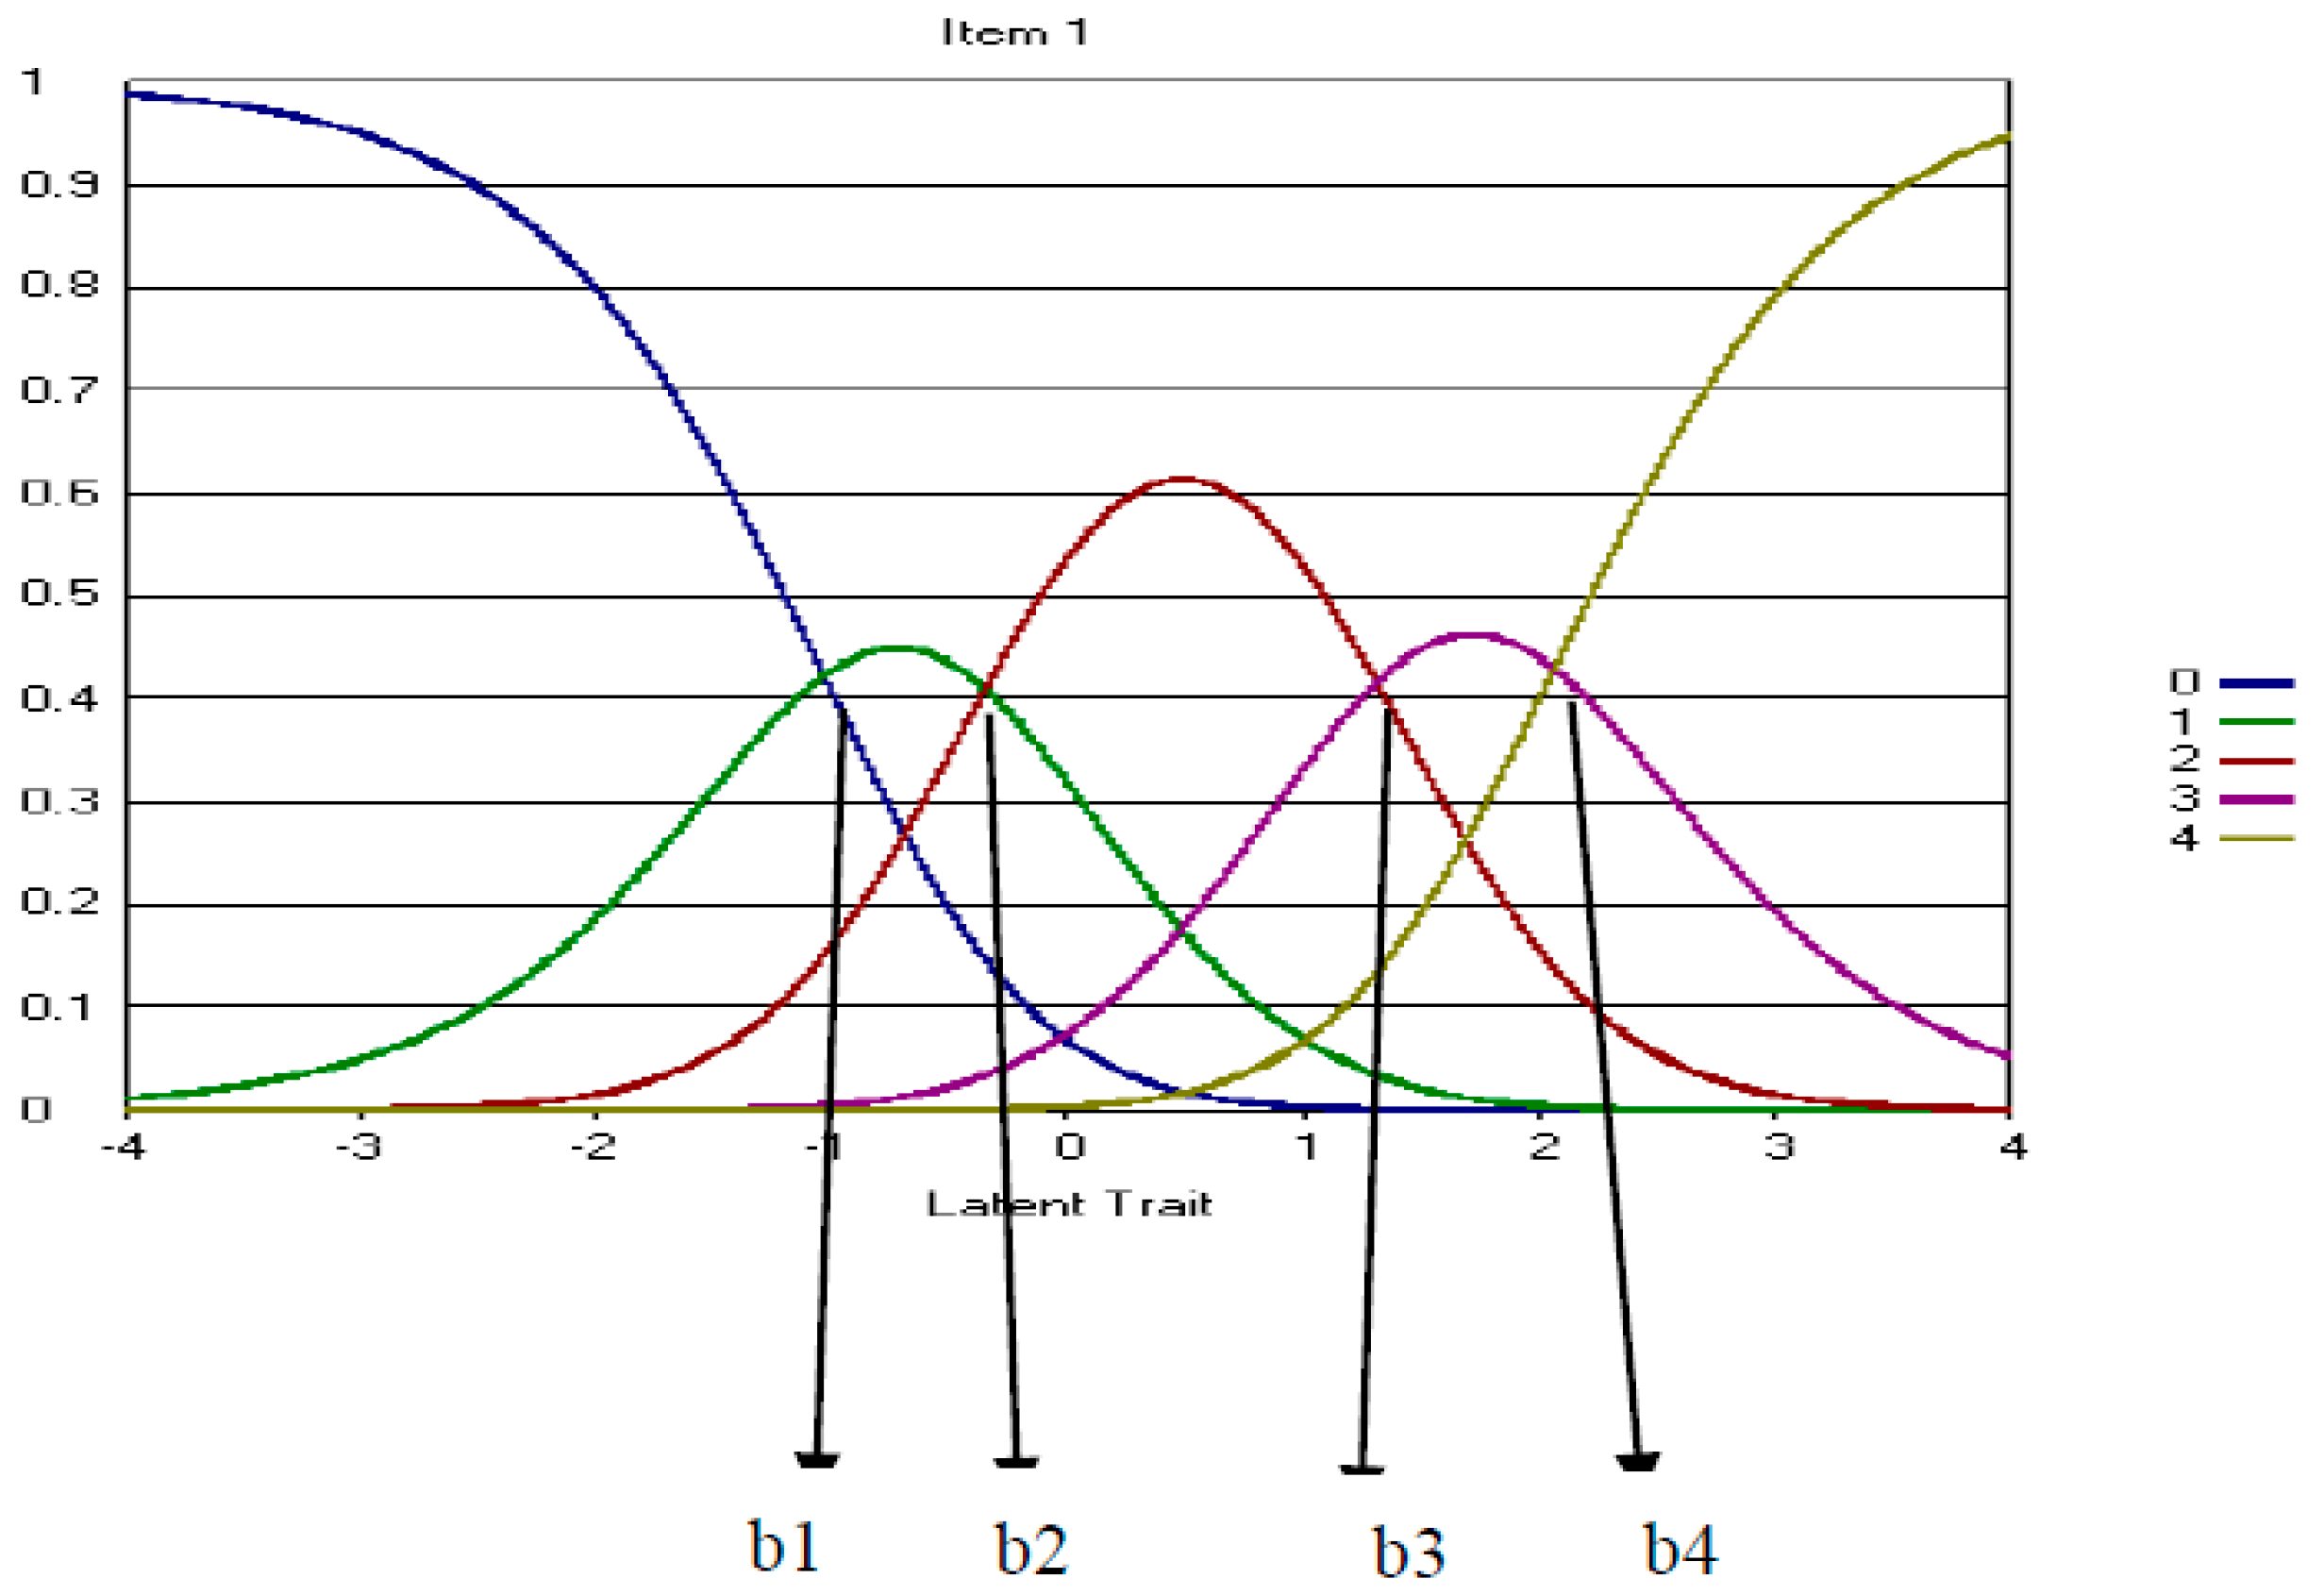
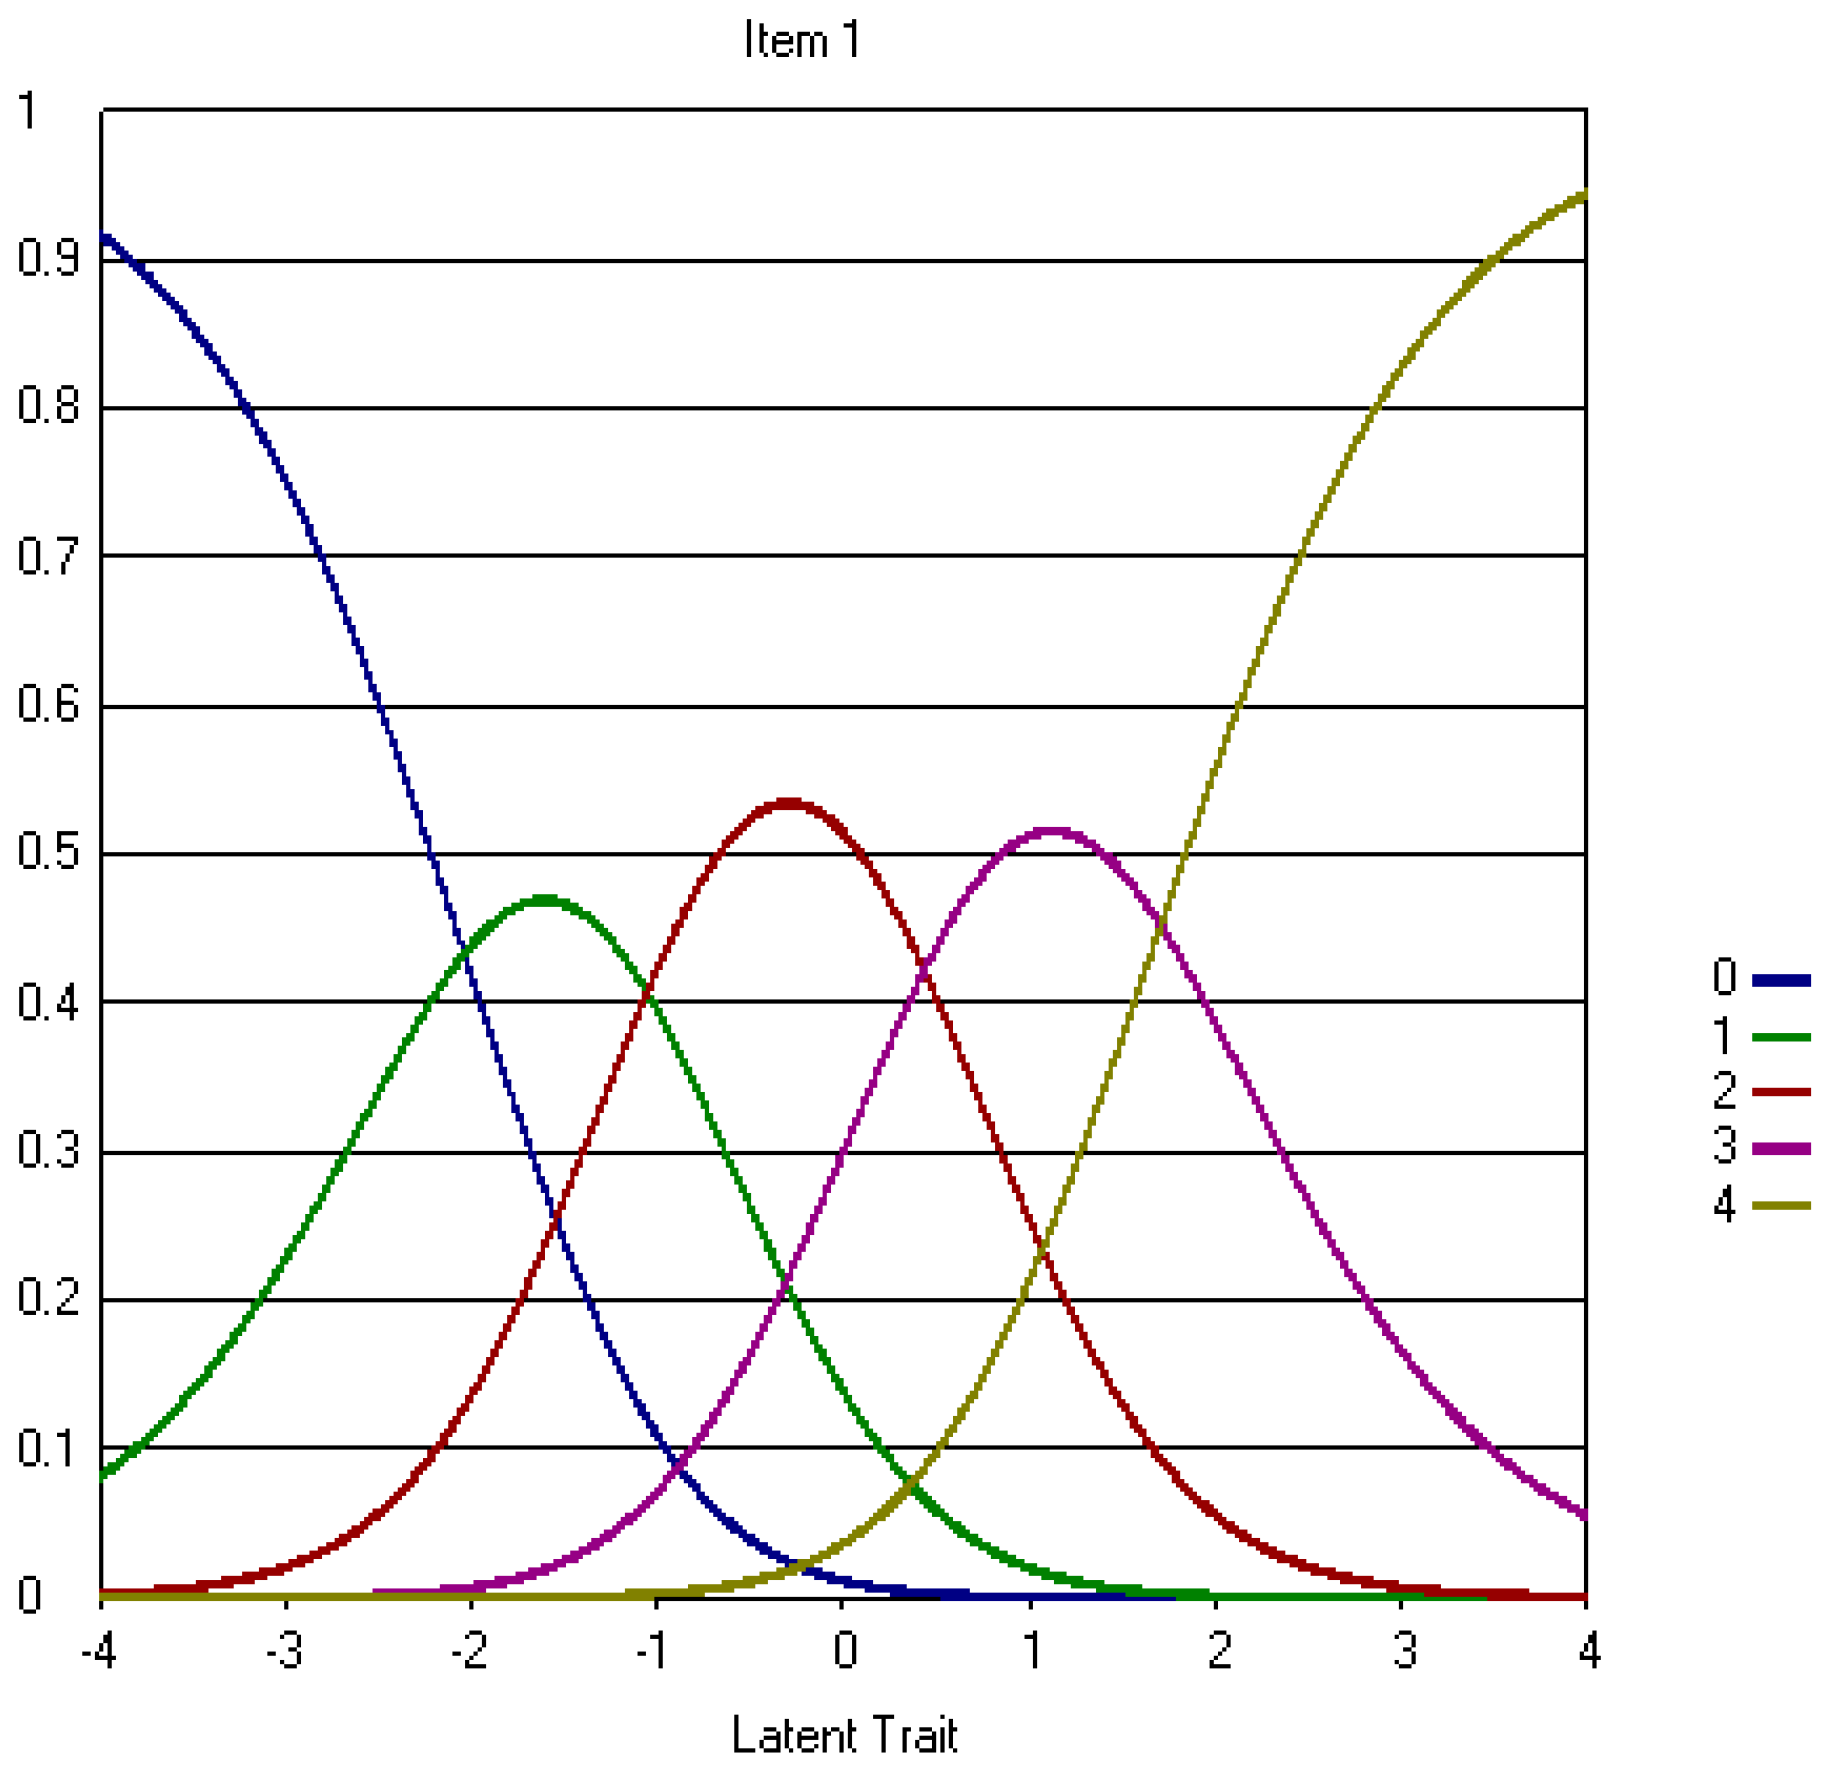
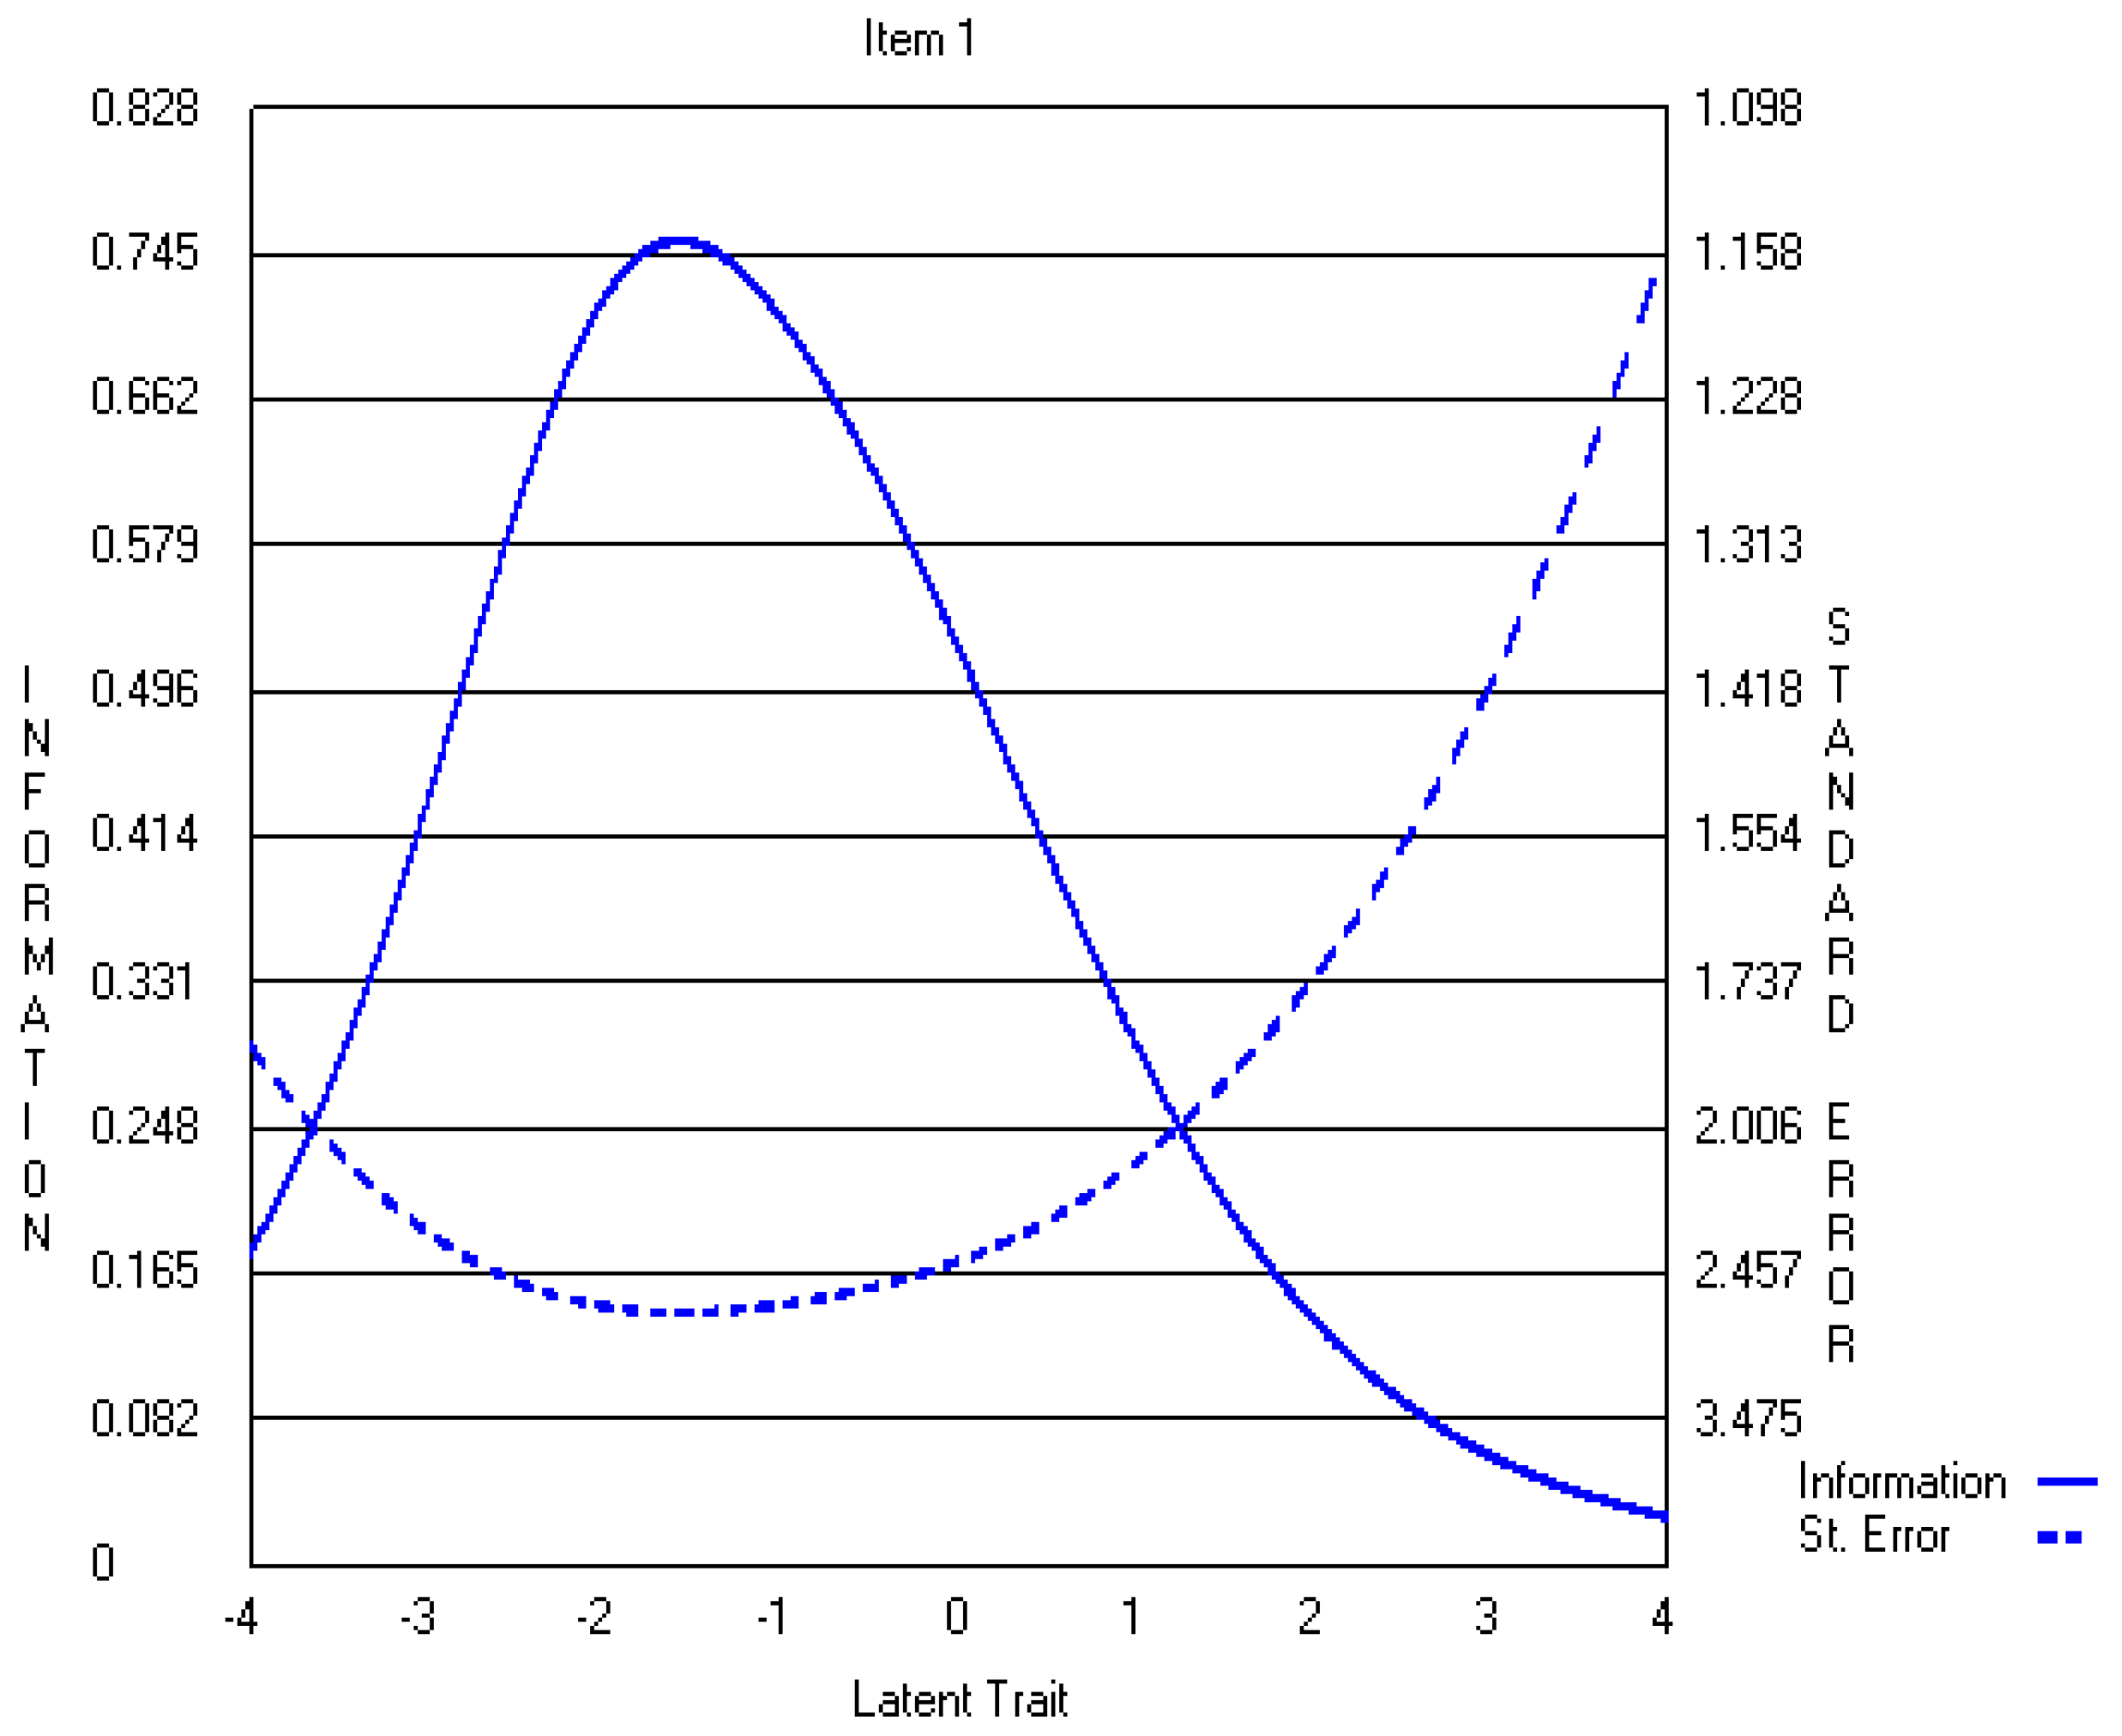
2. An Overview of IRT
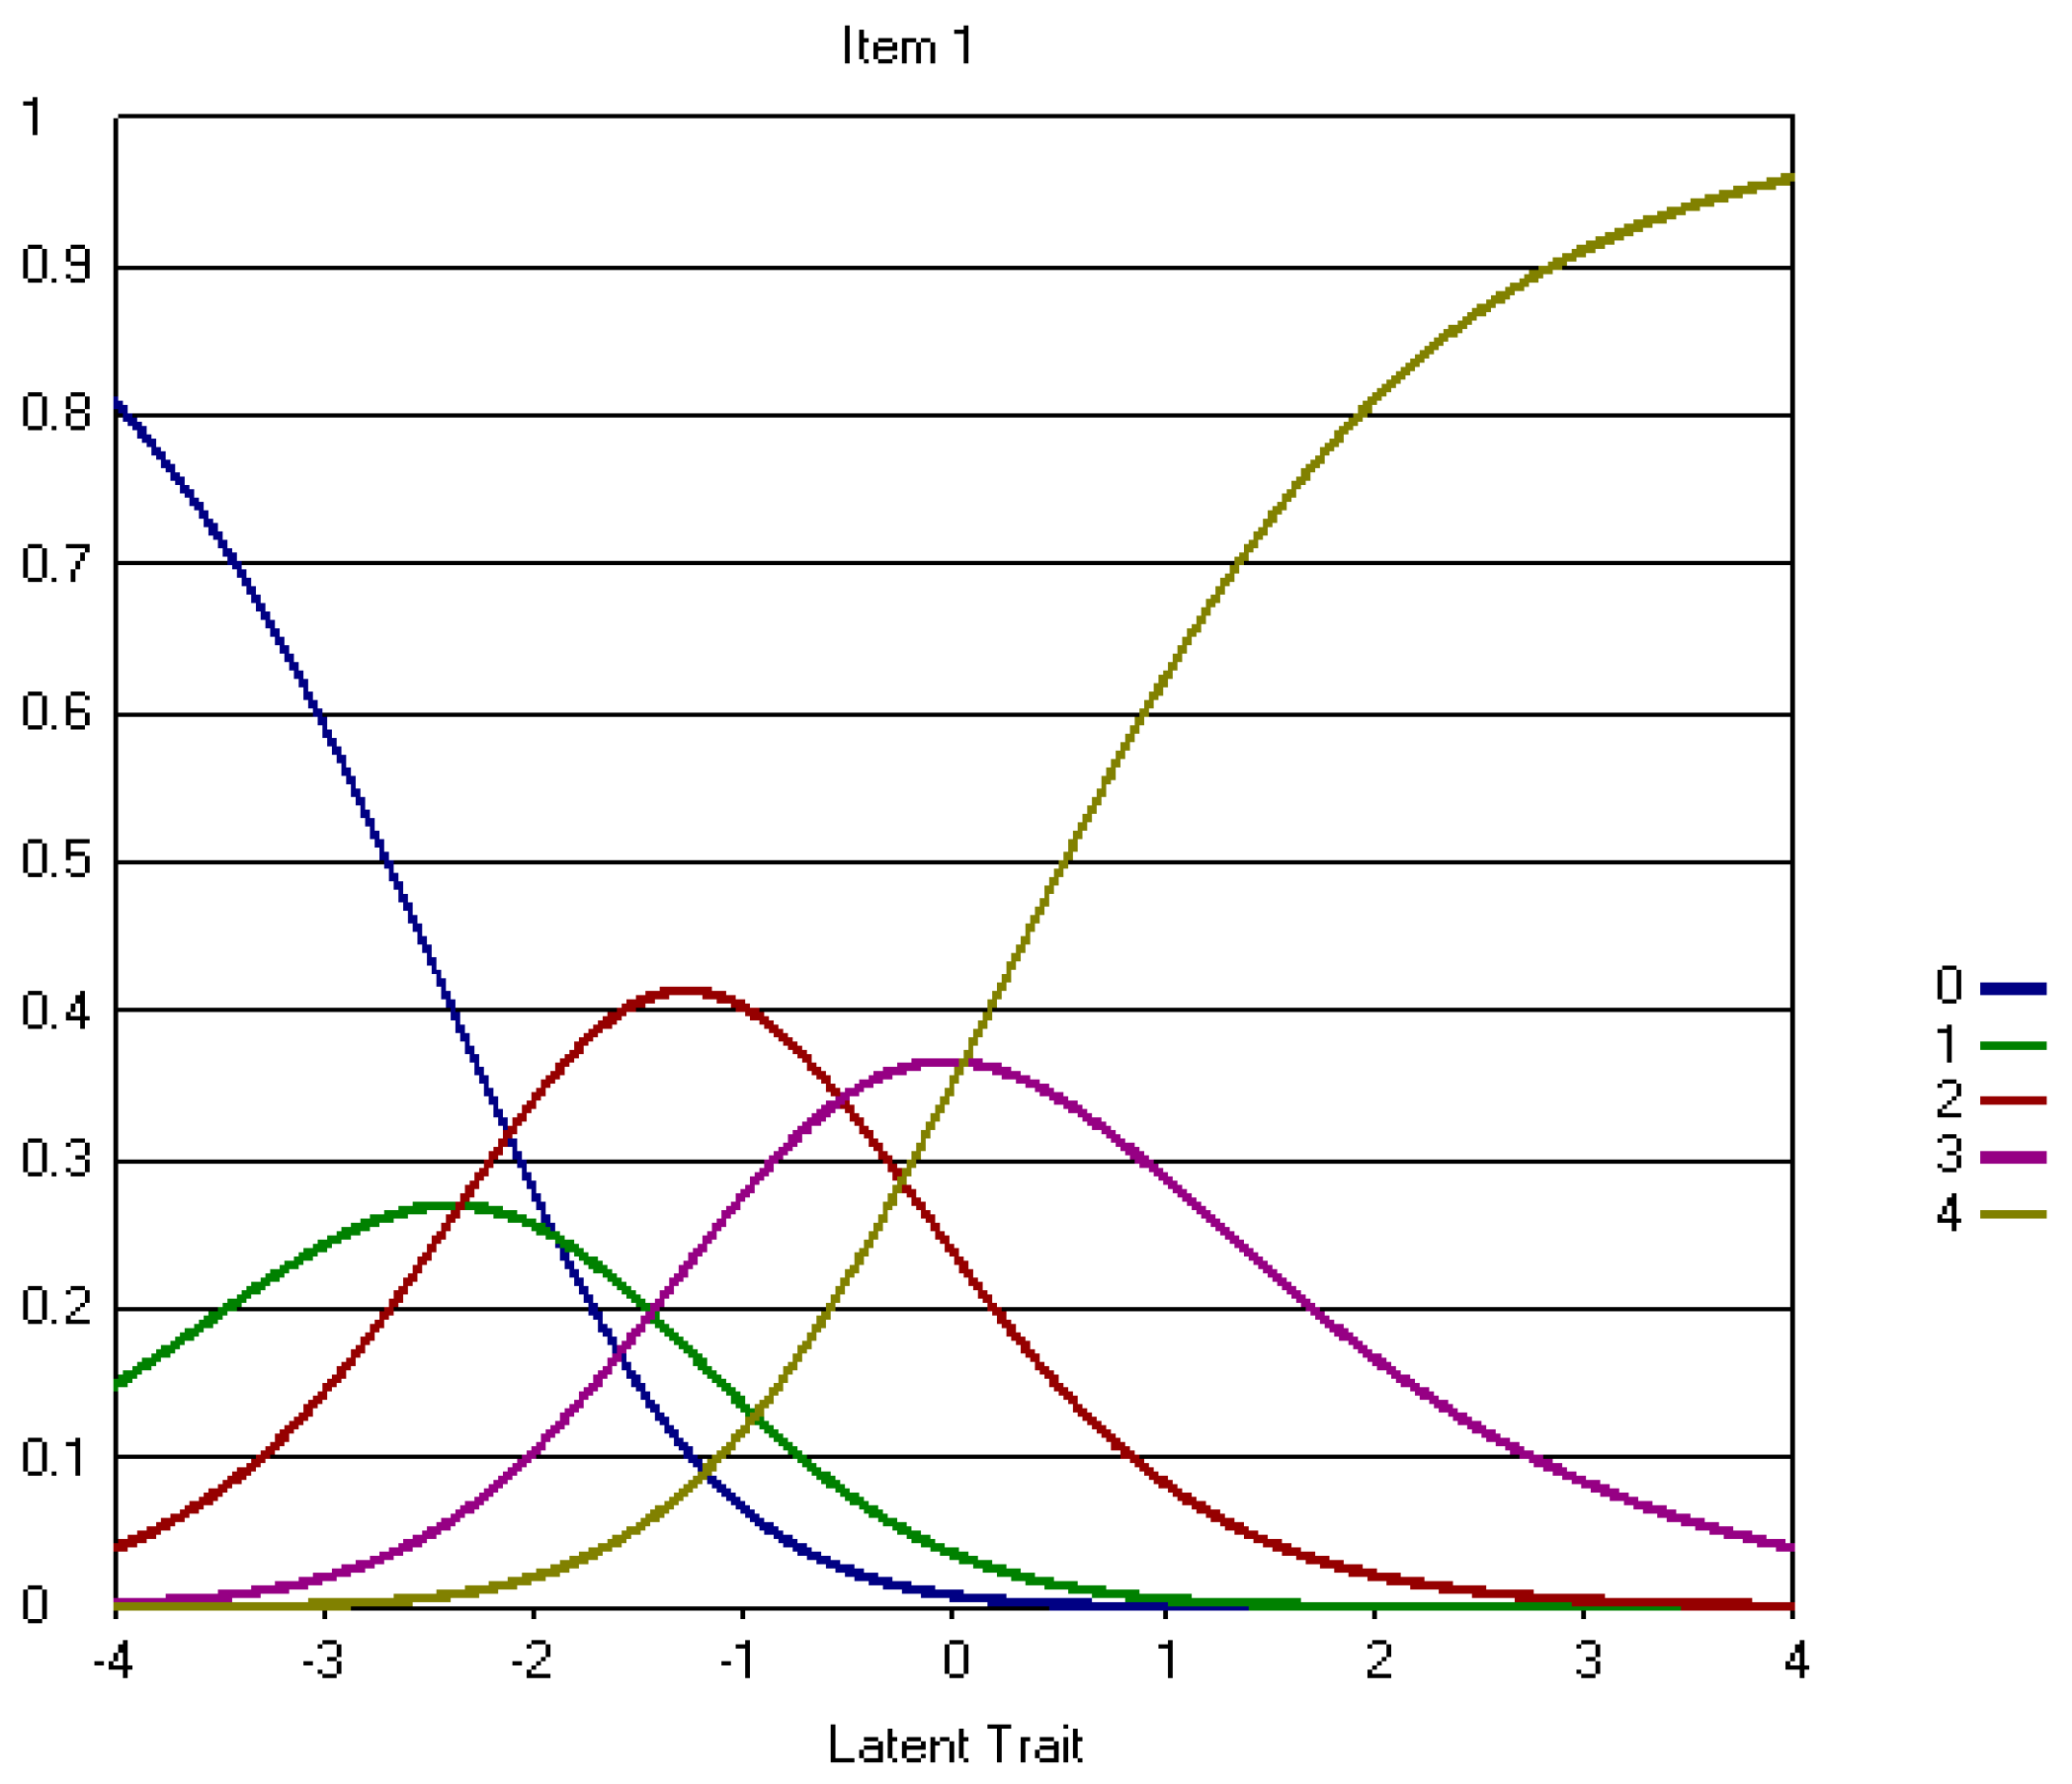
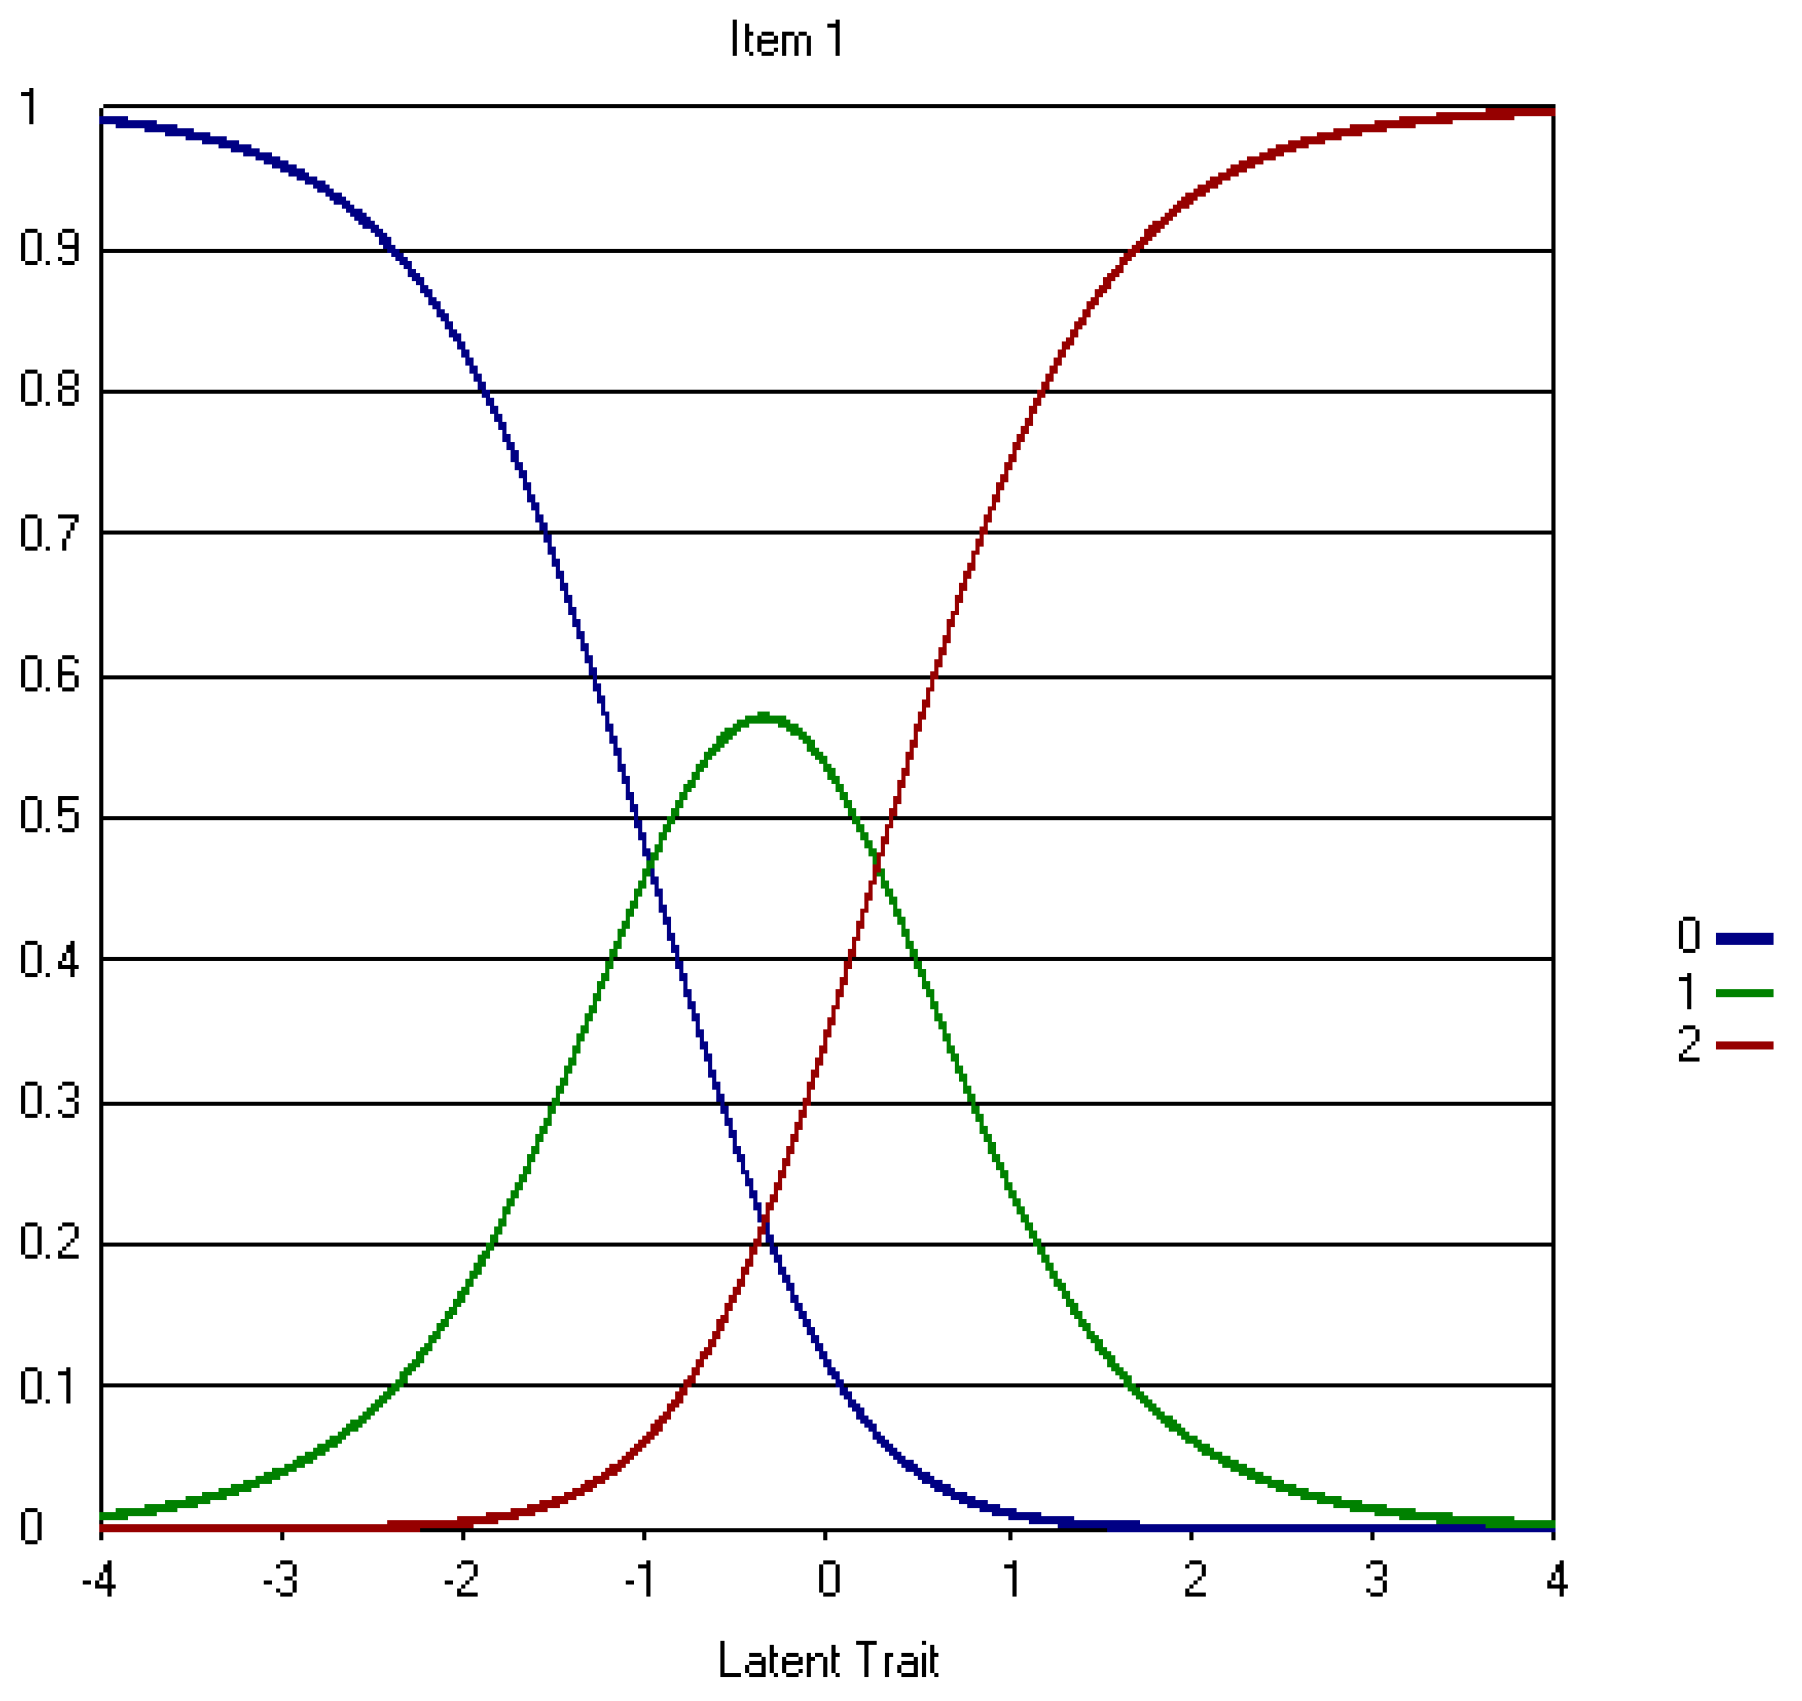
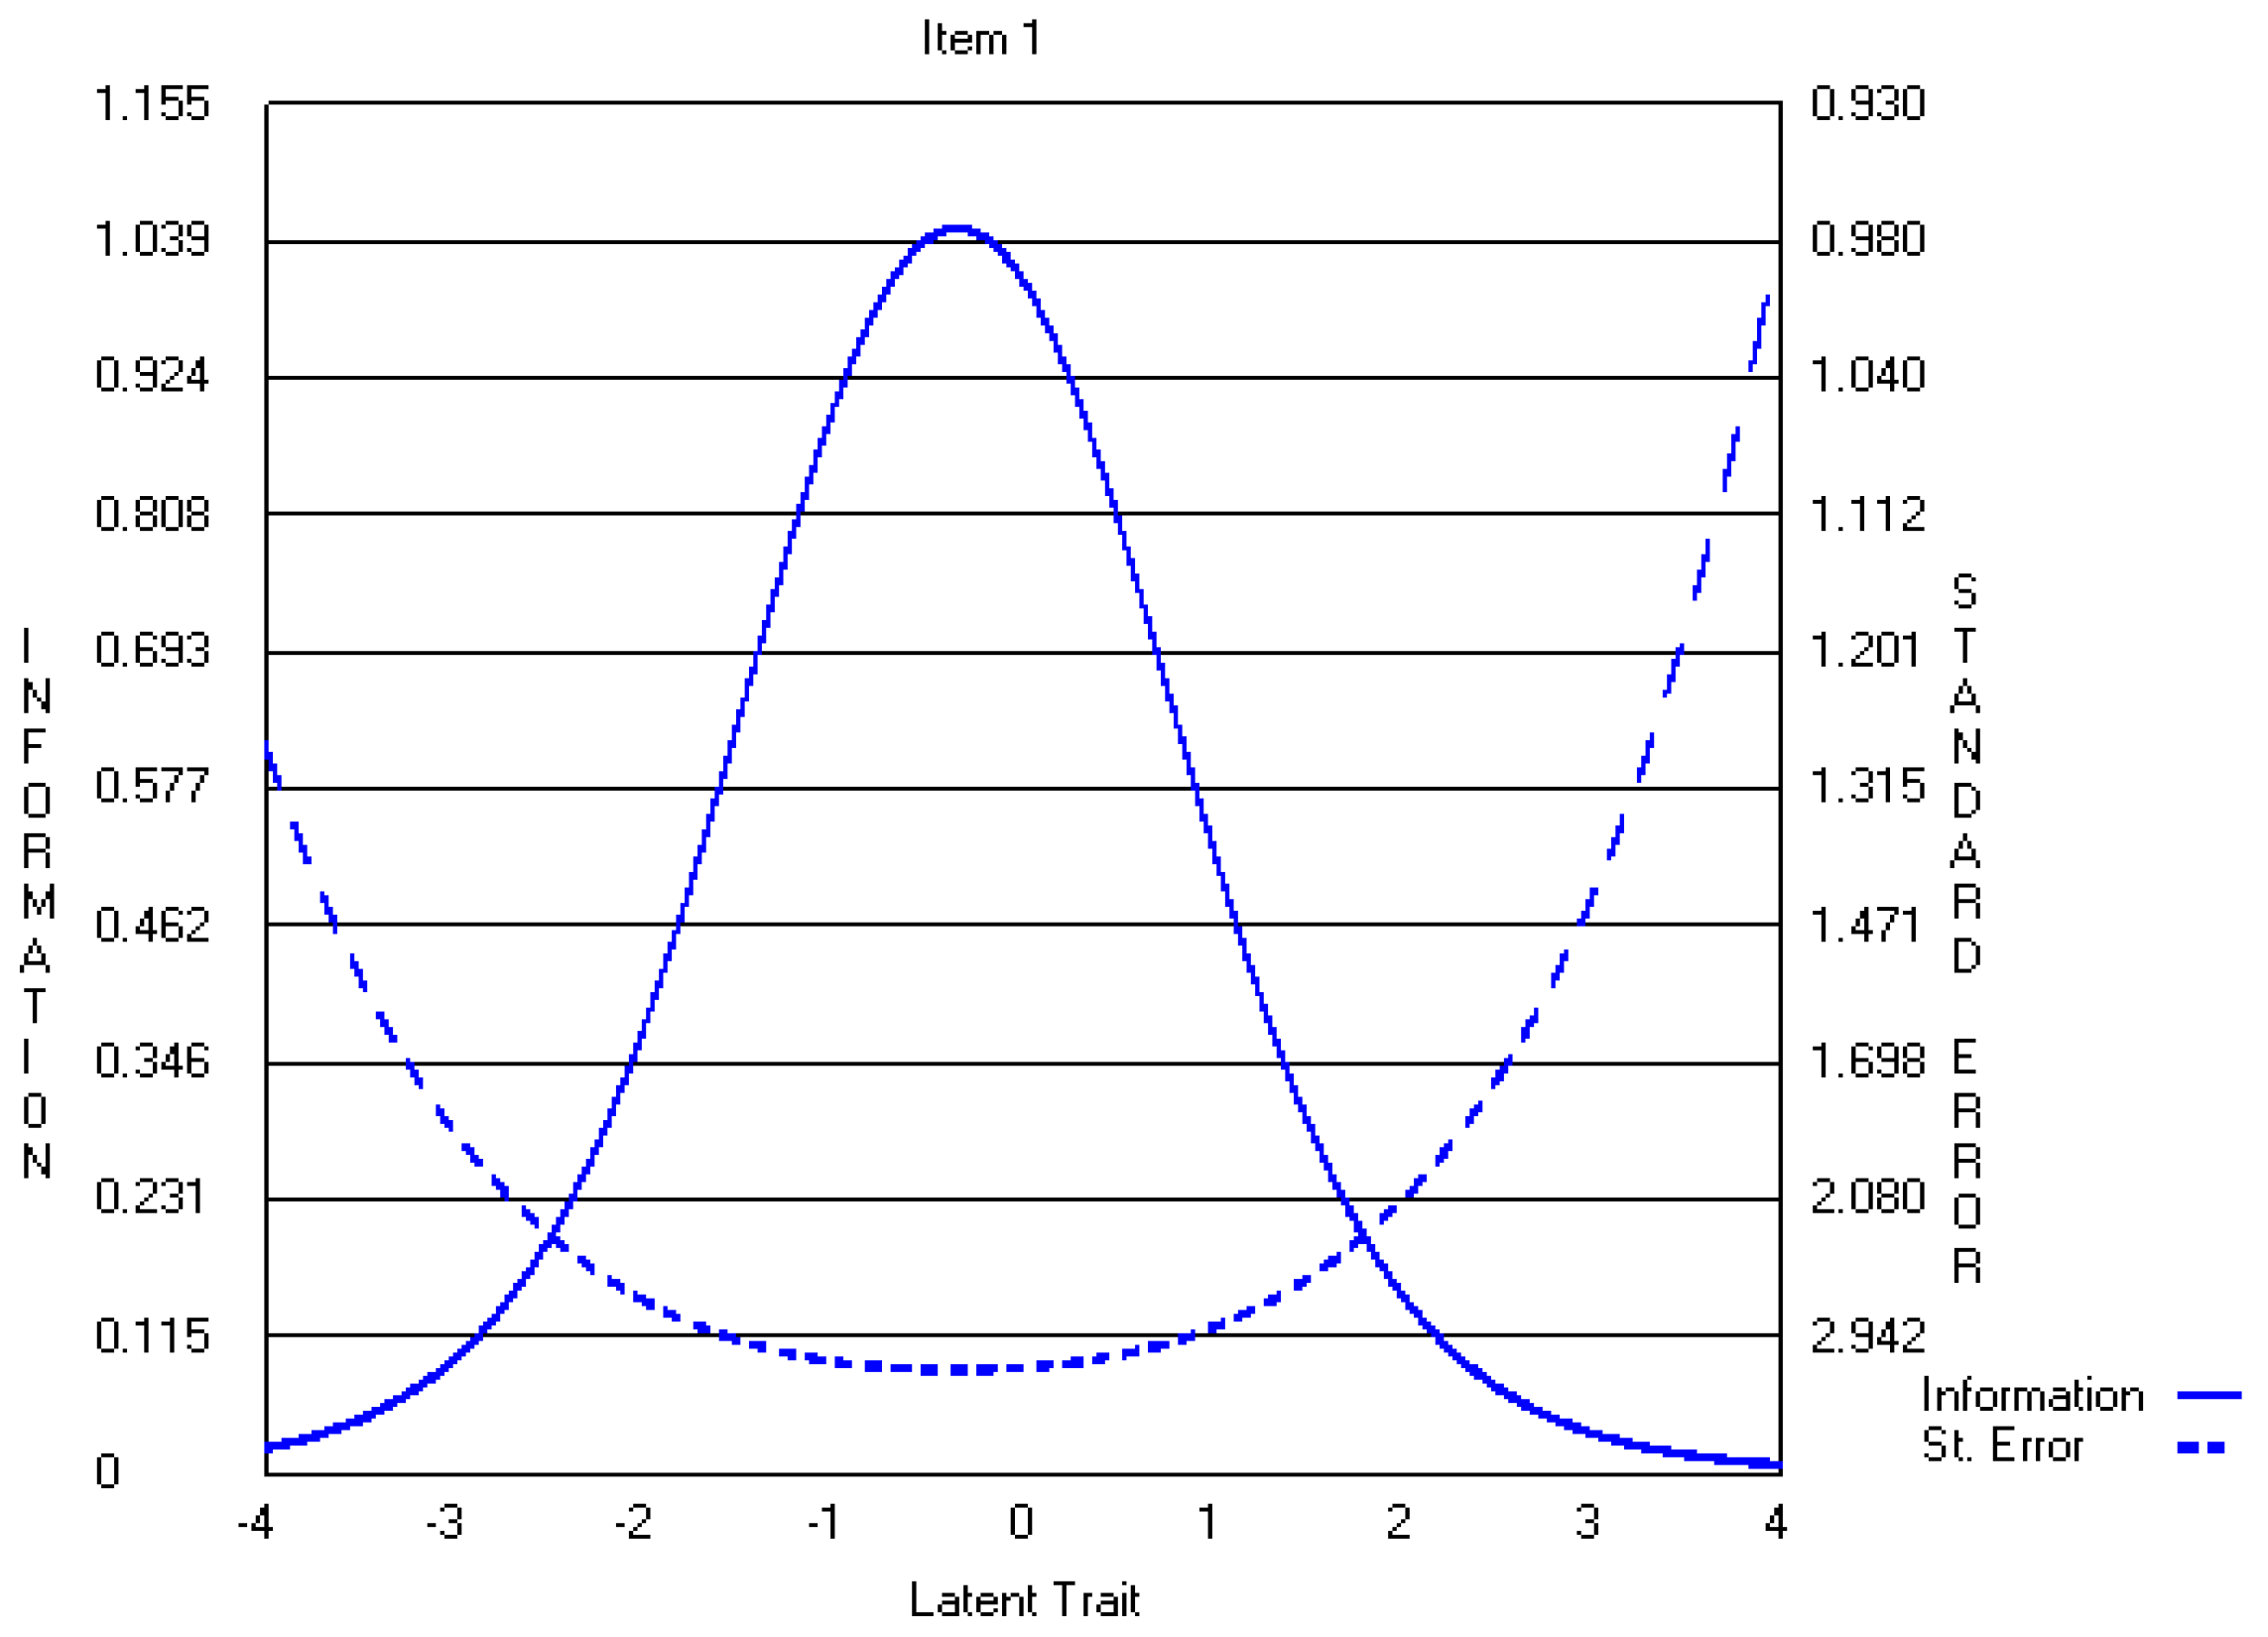
Polytomous IRT
3. Methods
3.1. Sample and Sample Size Requirements
3.2. Data Analysis
3.3. IRT Assumptions
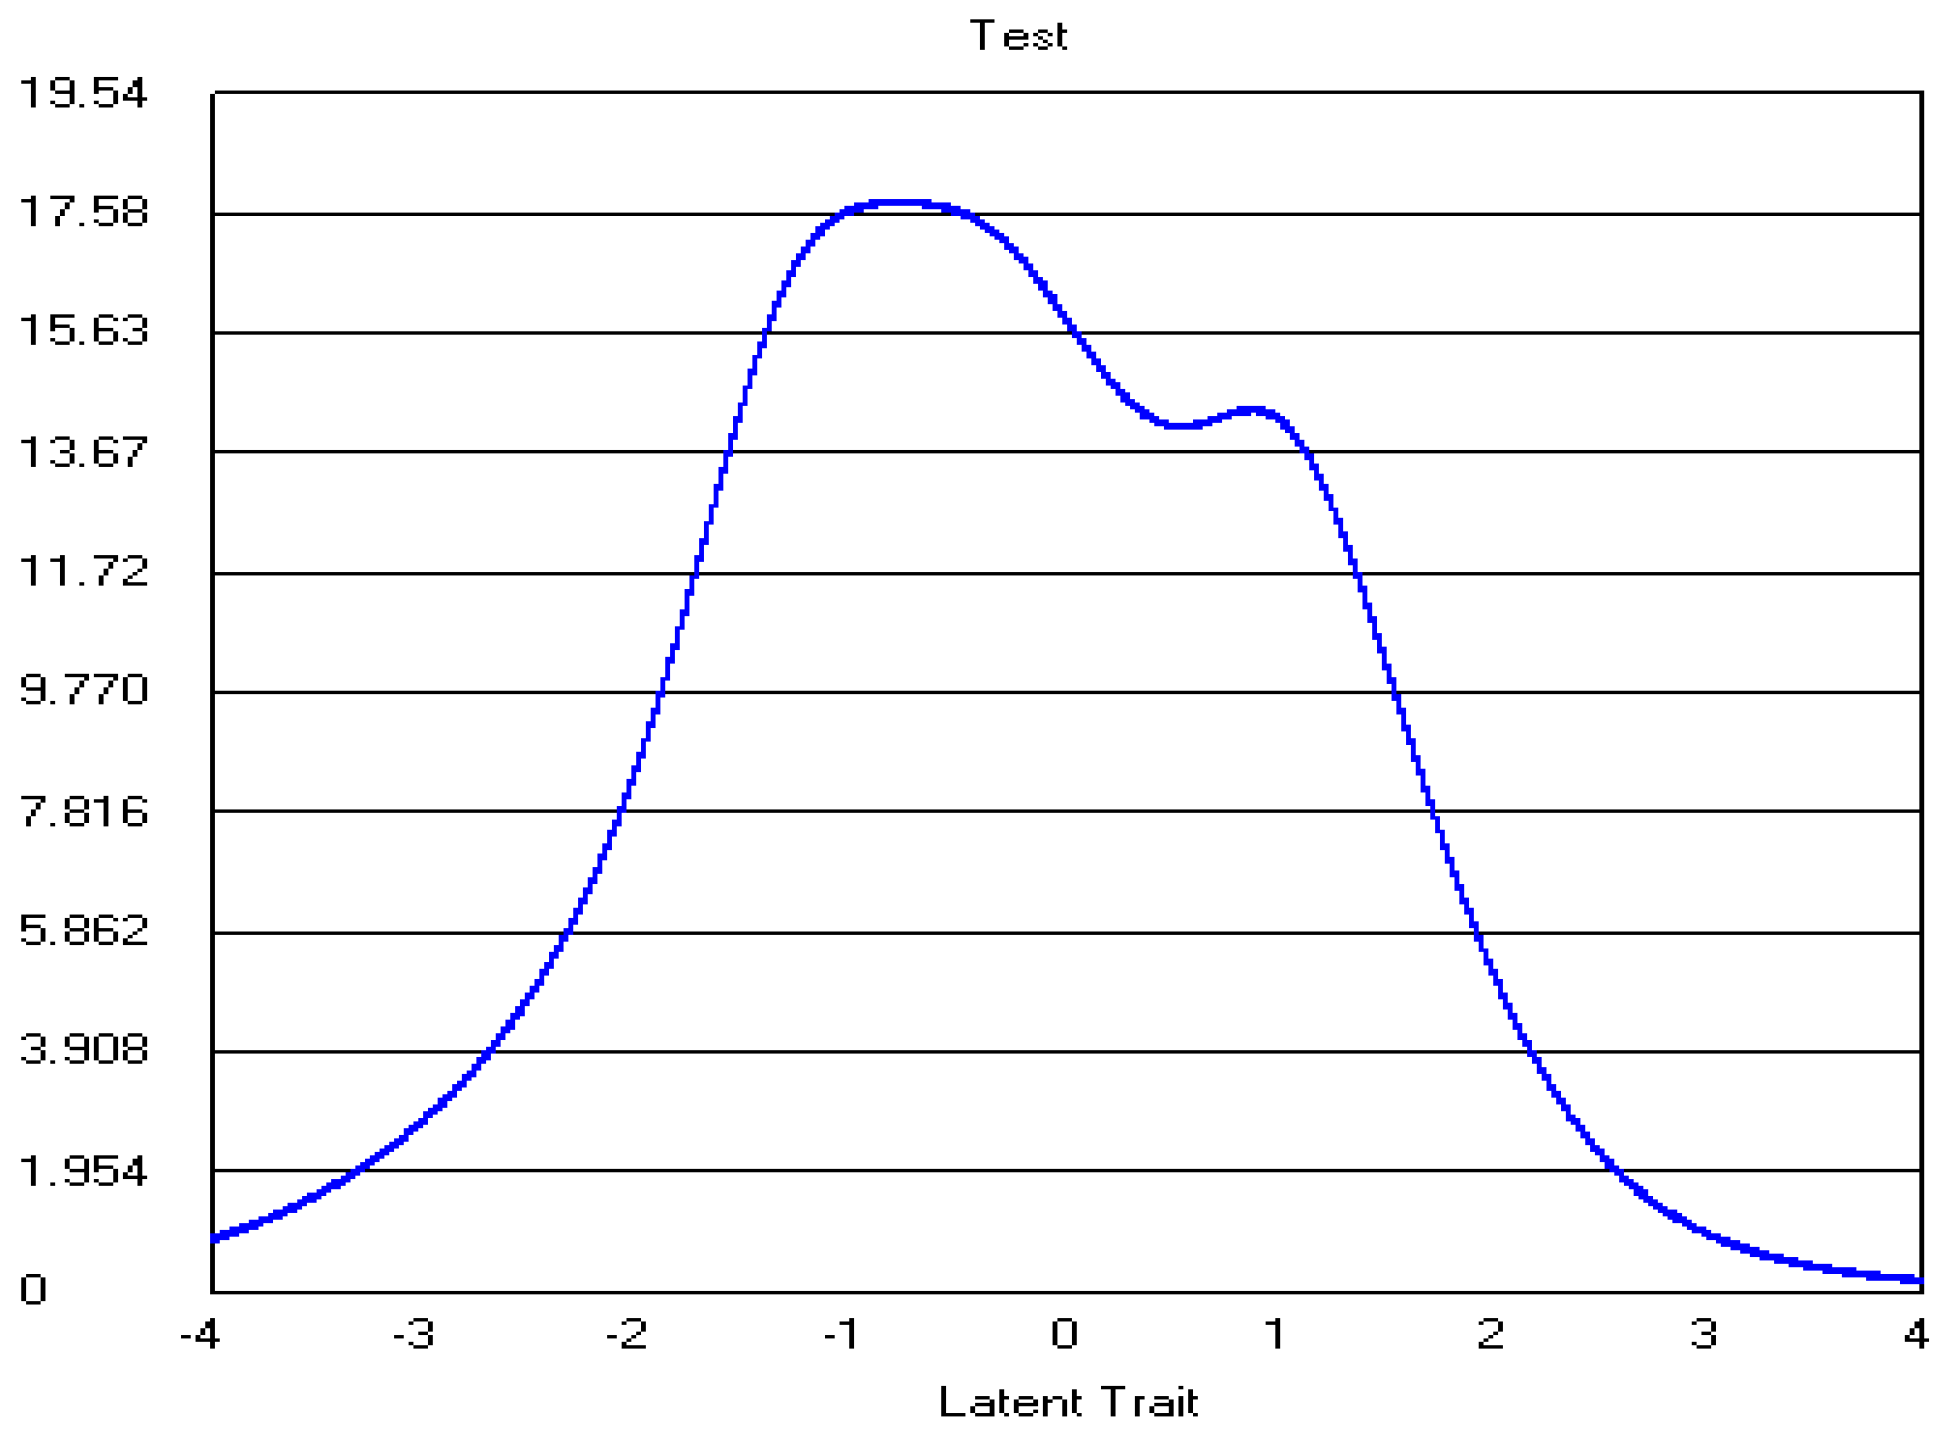
4. Results
4.1. Model Assumptions
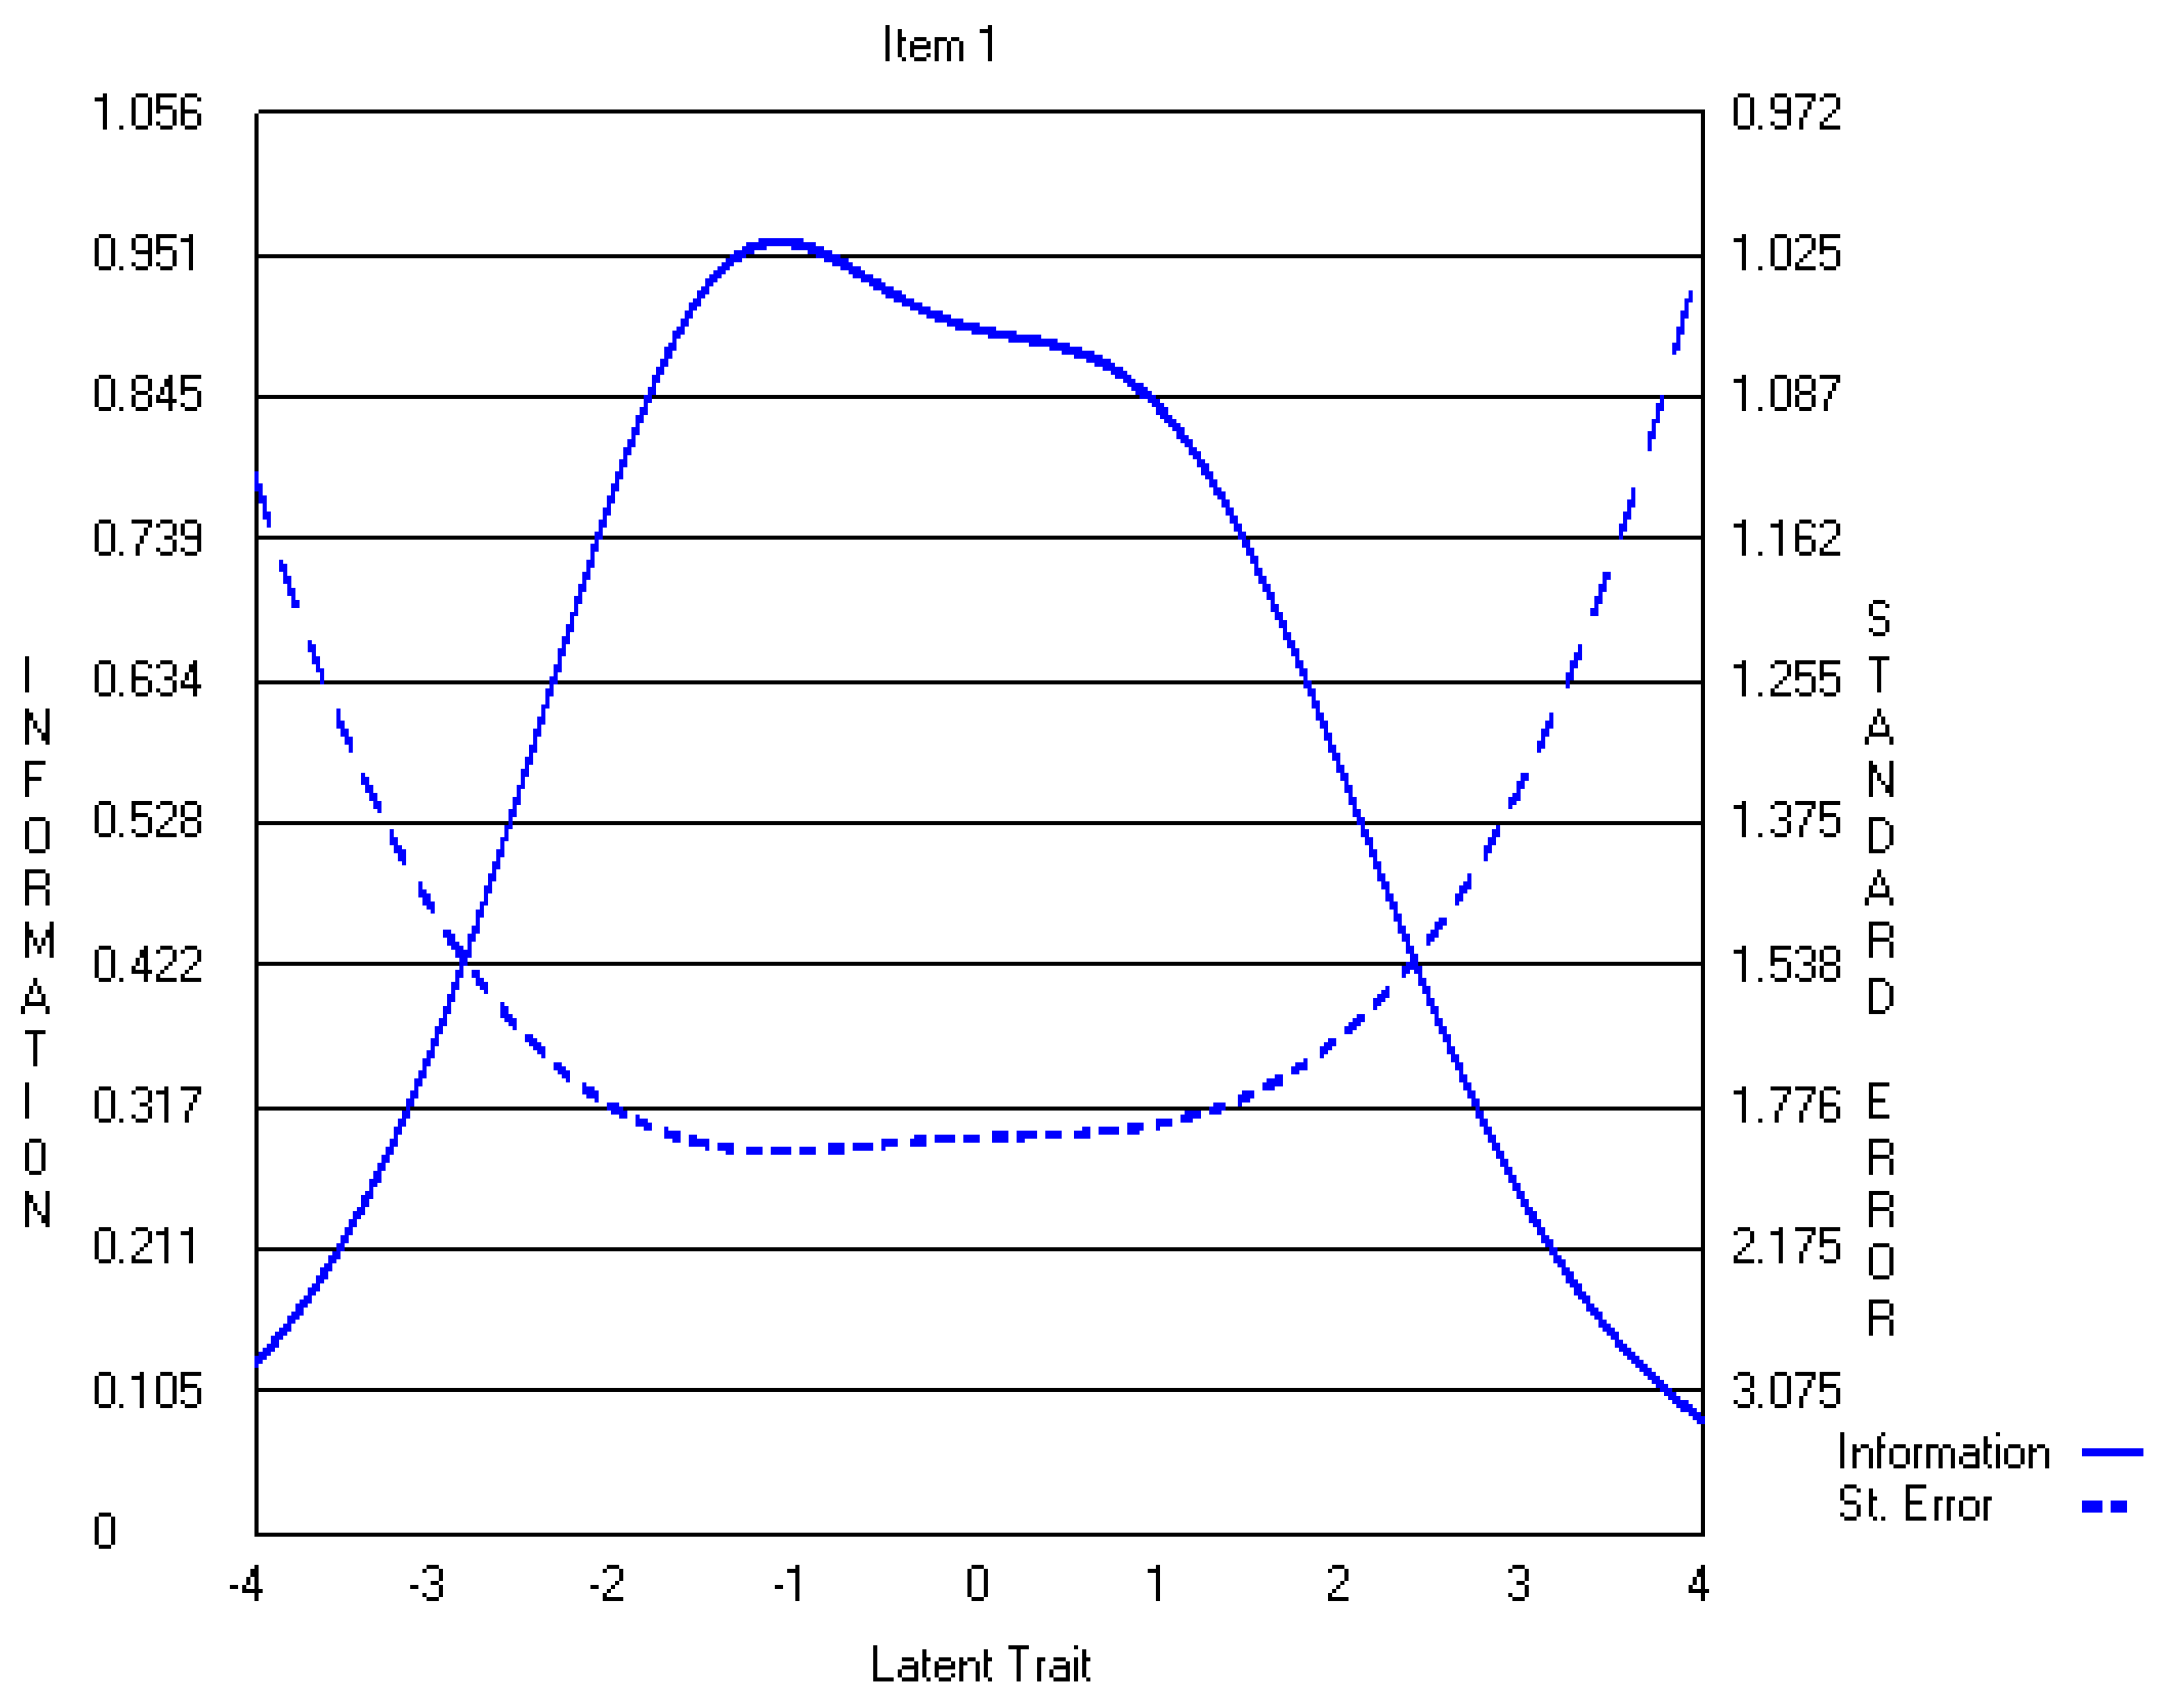
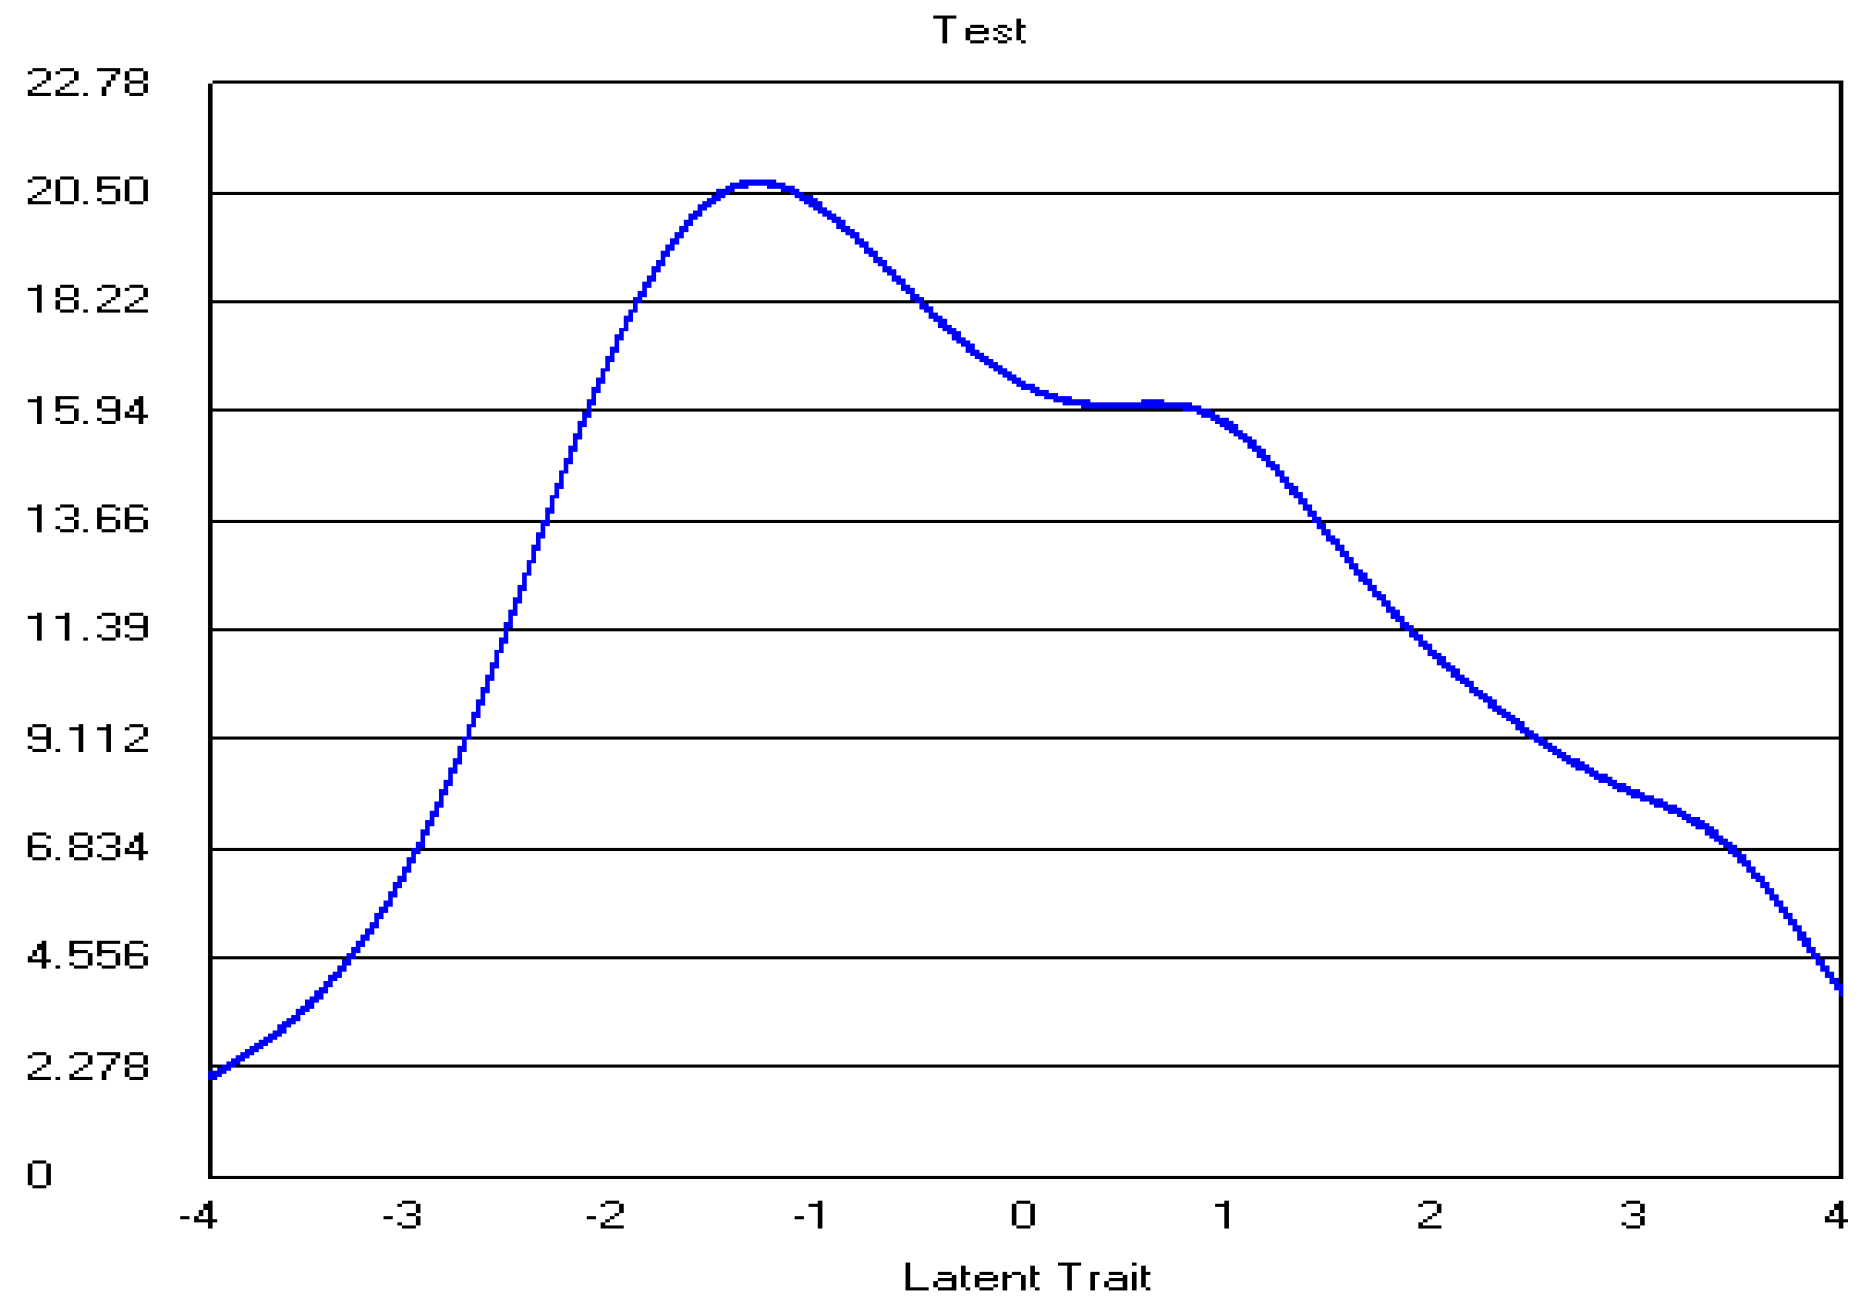
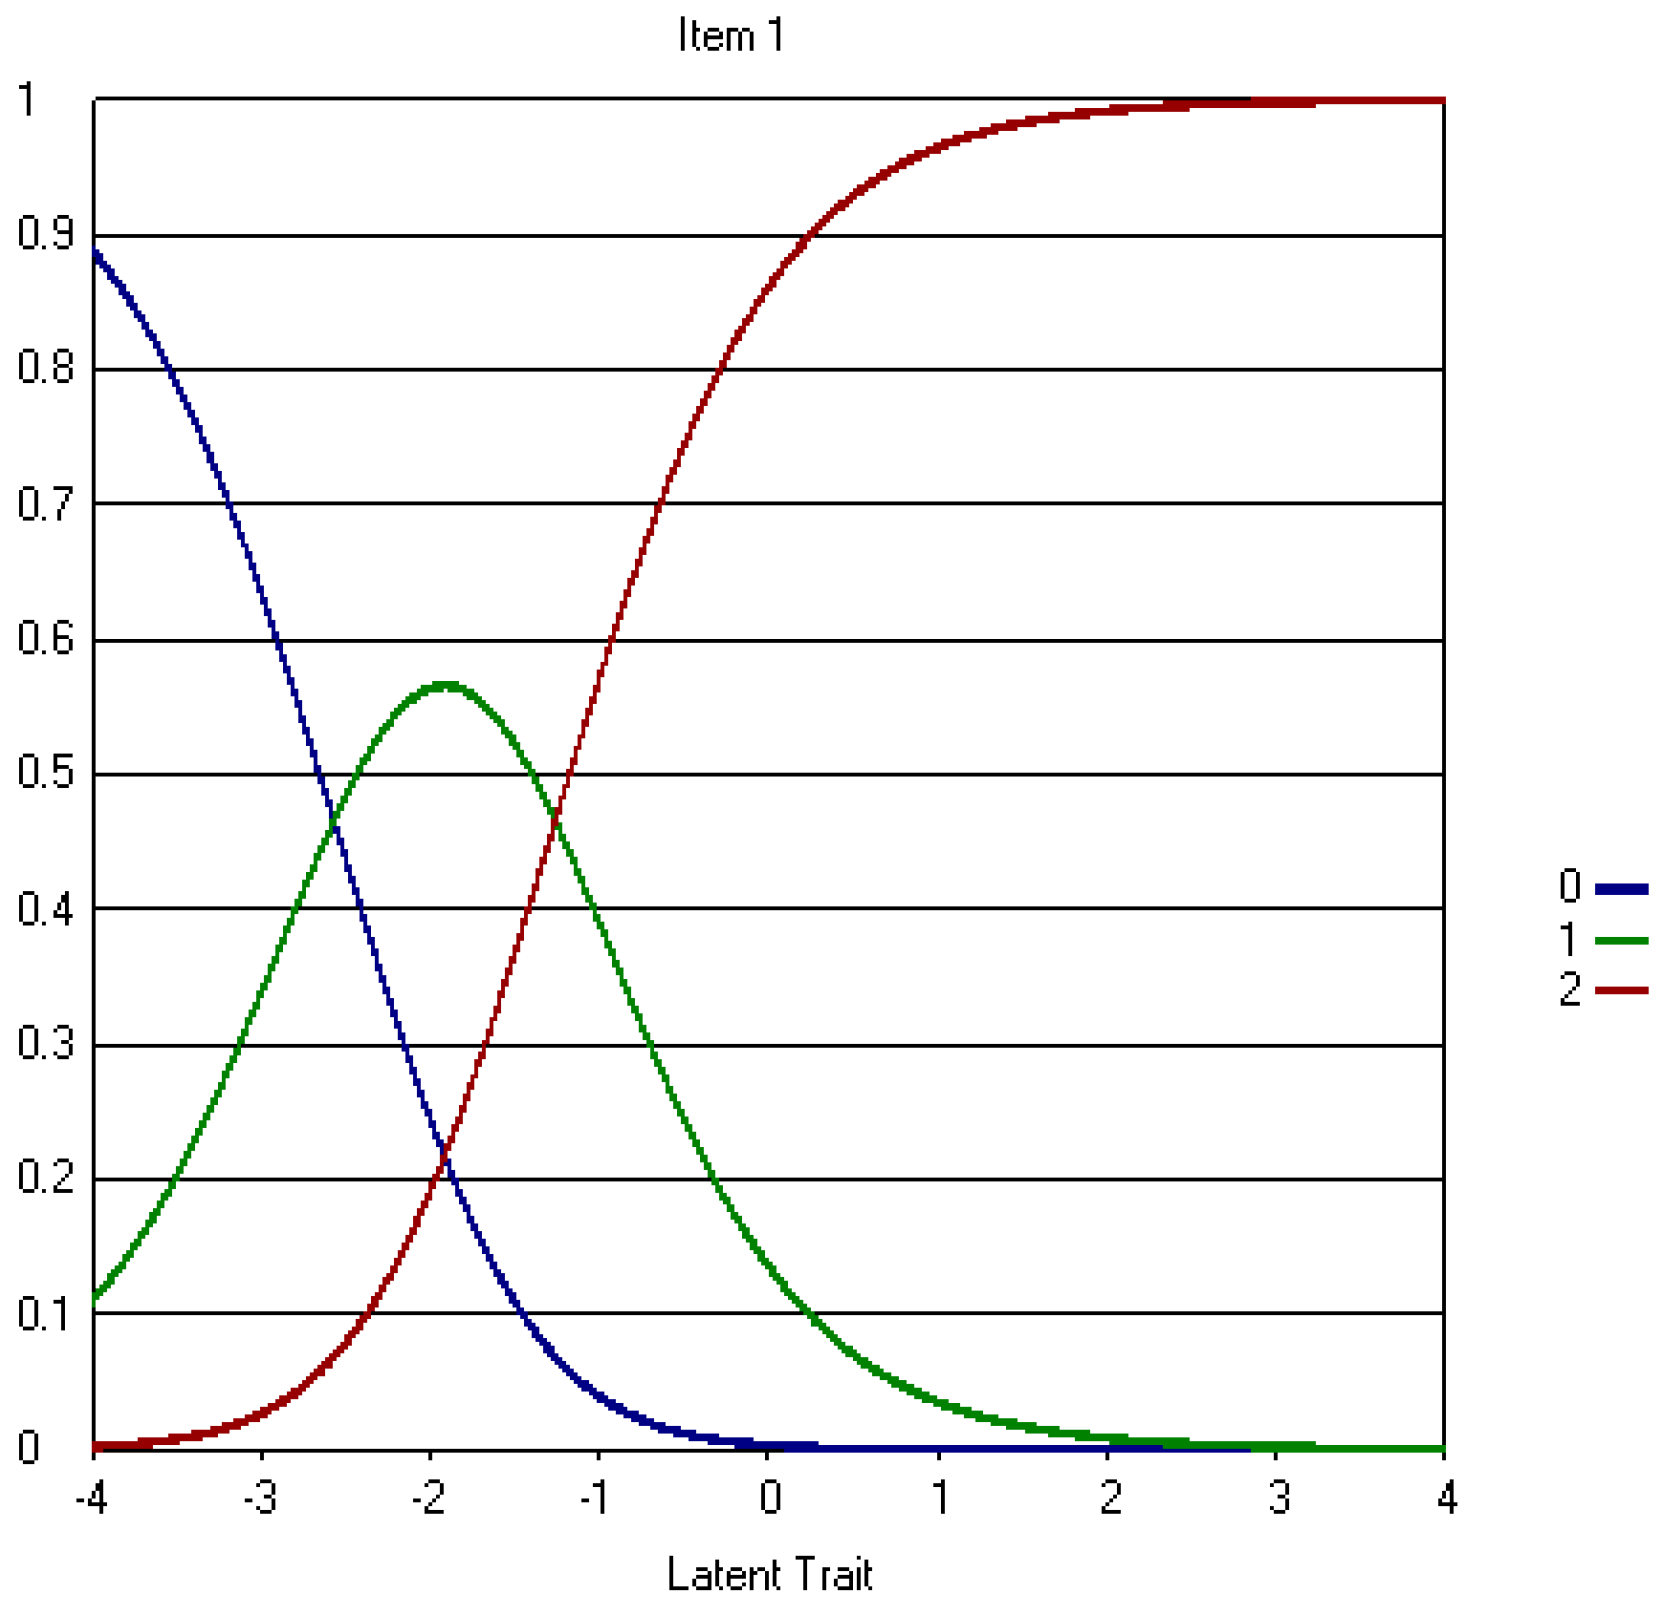
4.2. Five-Point CWEQ II
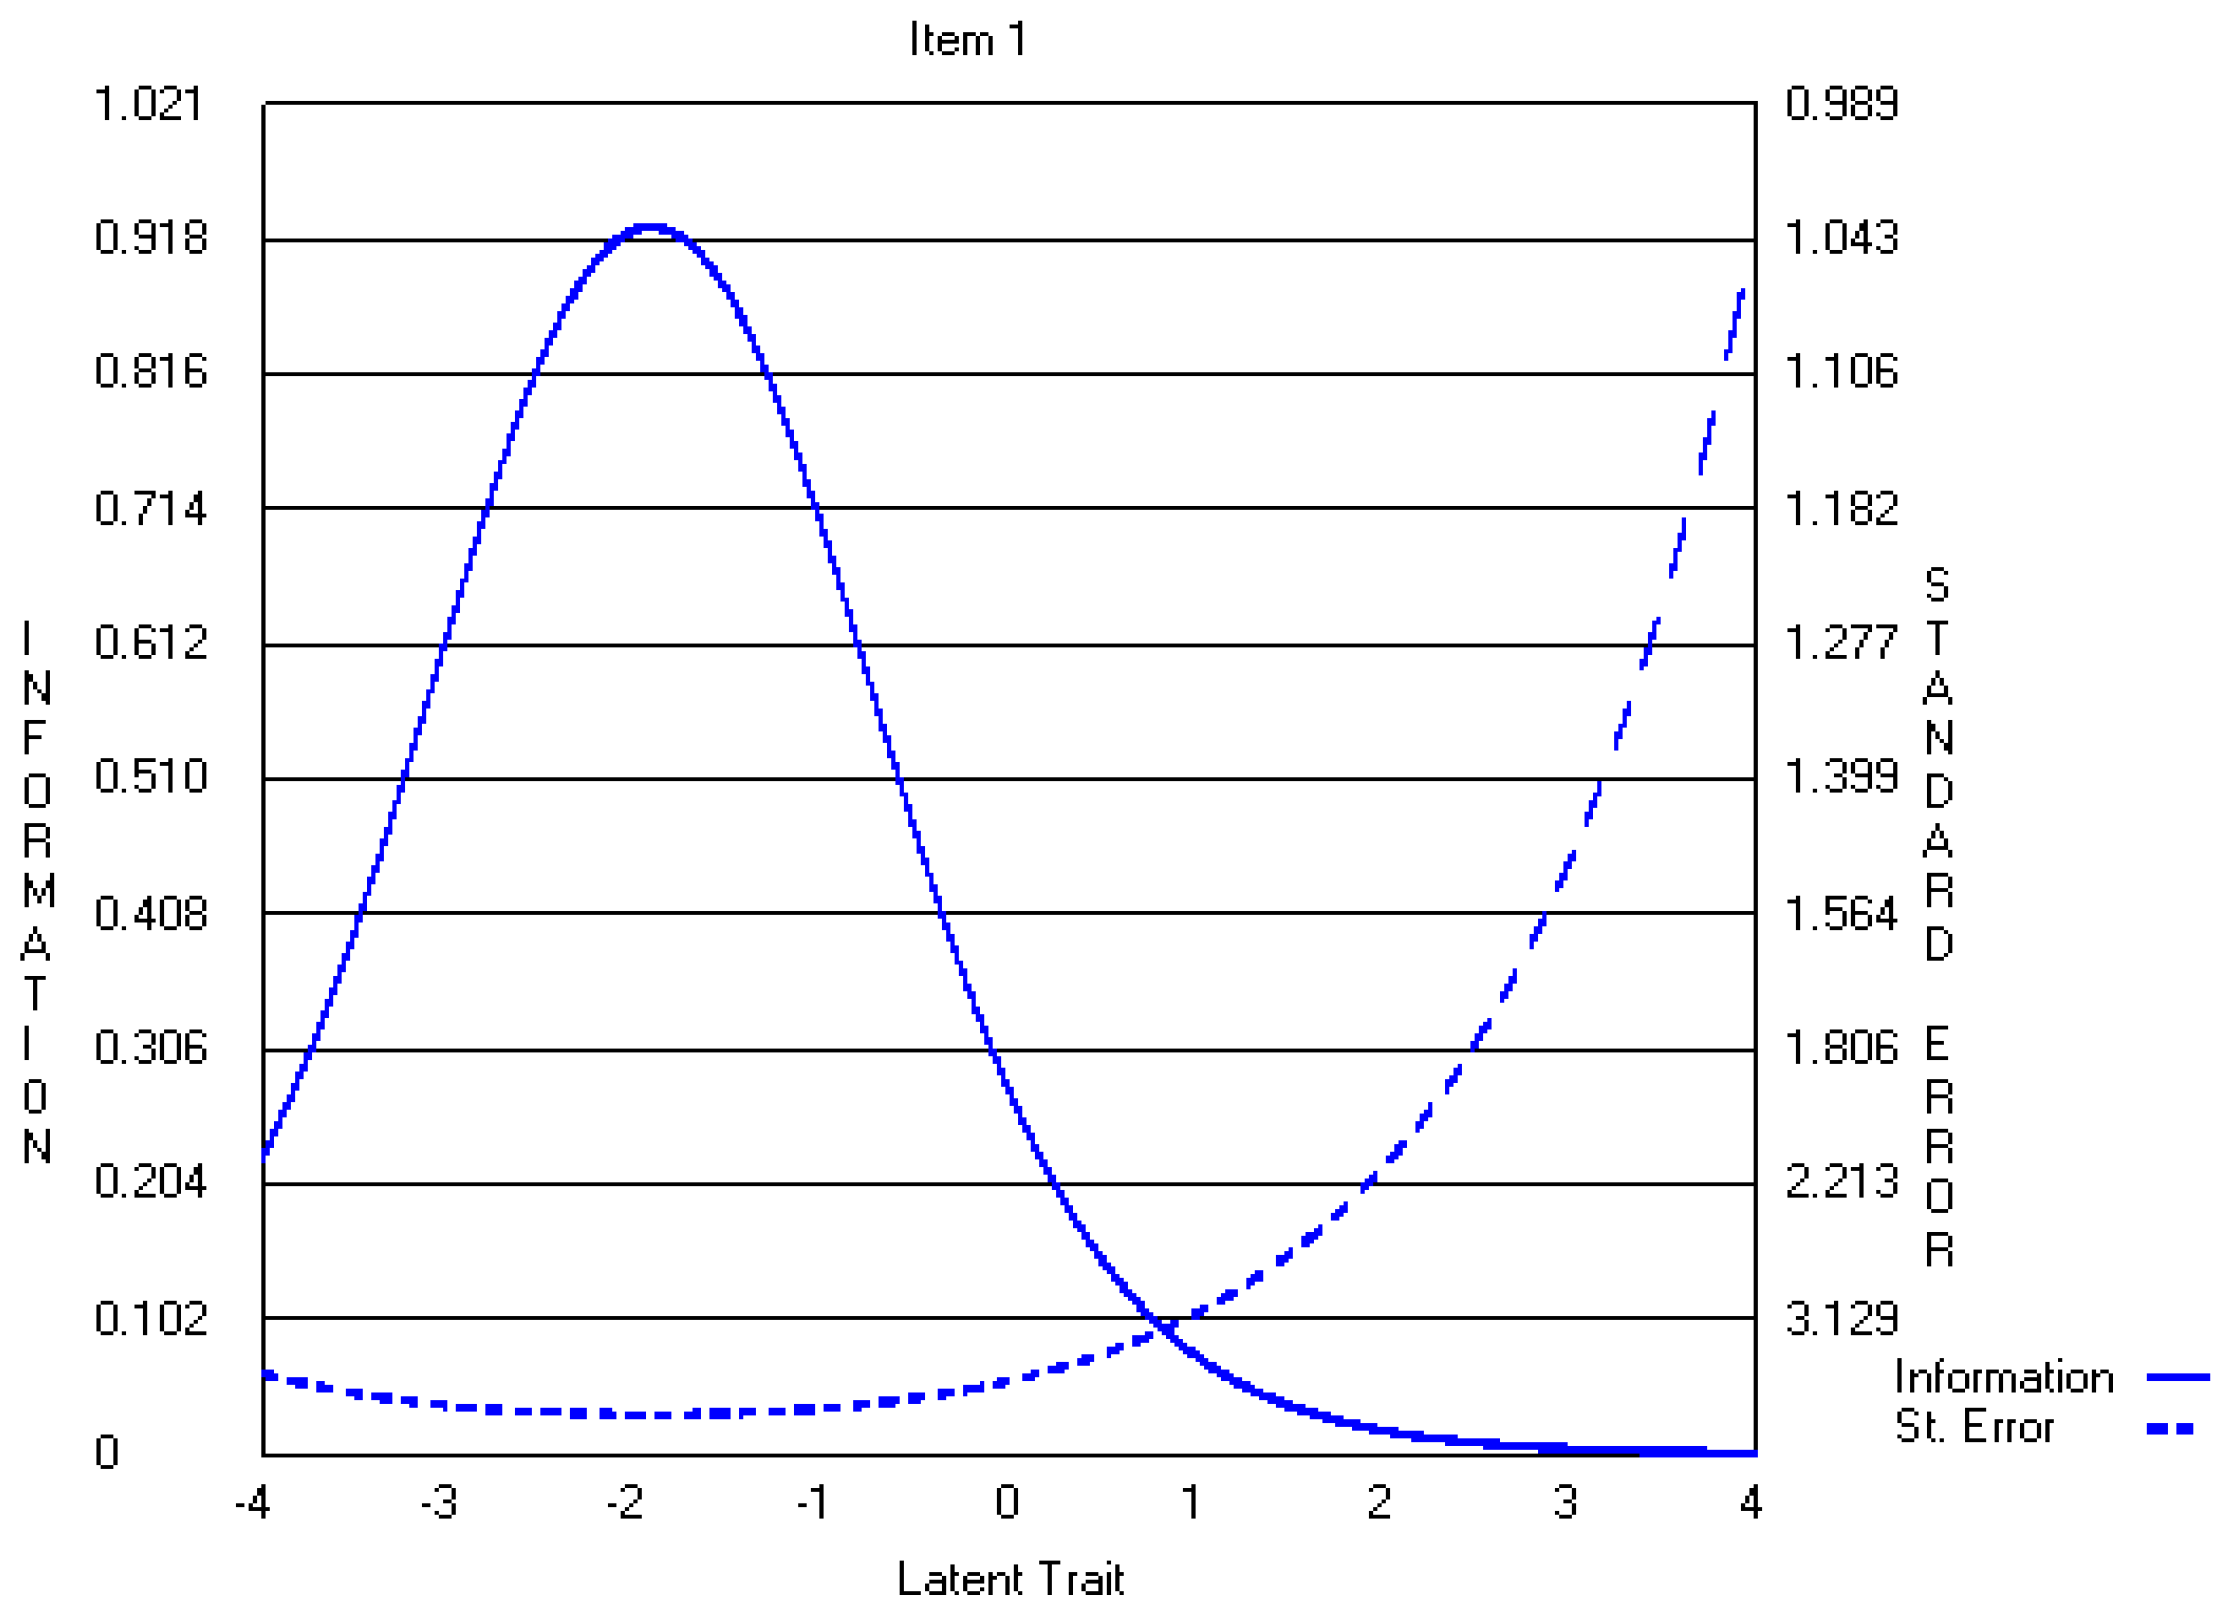
4.3. Three-Point CWEQ II
5. Discussion
5.1. Data-Model Fit
5.2. Validity and Reliability
5.3. Implications
6. Conclusions
Acknowledgments
Author Contributions
Conflicts of Interest
Appendix A
Appendix A.1. The Original Five-Point CWEQ II Items


Appendix A.2. The Revised Three-Point CWEQ II Items


References
- Laschinger, H.K.S., J. Finegan, J. Shamian, and P. Wilk. 2001. Impact of structural and psychological empowerment on job strain in nursing work settings: Expanding Kanter’s model. J. Nurs. Adm. 31: 260–272. [Google Scholar] [CrossRef] [PubMed]
- Laschinger, H.K.S., J. Finegan, J. Shamian, and P. Wilk. 2003. Workplace empowerment as a predictor of nurse burnout in restructured healthcare settings. Hosp. Q. 6: 2–11. [Google Scholar]
- Laschinger, H.K.S., J. Finegan, J. Shamian, and P. Wilk. 2004. A longitudinal analysis of the impact of workplace empowerment on work satisfaction. J. Organ. Behav. 25: 527–545. [Google Scholar] [CrossRef]
- Laschinger, H.K.S., J. Finegan, and P. Wilk. 2009. Context matters: The impact of unit leadership and empowerment on nurses’ organizational commitment. J. Nurs. Adm. 39: 228–235. [Google Scholar] [CrossRef] [PubMed]
- Hauck, A., M.T. Quinn Griffin, and J.J. Fitzpatrick. 2011. Structural empowerment and anticipated turnover among critical care nurses. J. Nurs. Manag. 19: 269–276. [Google Scholar] [CrossRef] [PubMed]
- Purdy, N., H.K.S. Laschinger, J. Finegan, M. Kerr, and F. Olivera. 2010. Effects of work environments on nurse and patient outcomes. J. Nurs. Manag. 18: 901–913. [Google Scholar] [CrossRef] [PubMed]
- Aiken, L.H., and P.A. Patrician. 2000. Measuring organizational traits of hospitals: The Revised Nursing Work Index. Nurs. Res. 49: 146–153. [Google Scholar] [CrossRef] [PubMed]
- Aiken, L.H., S.P. Clarke, D.M. Sloane, J.A. Sochalski, R. Busse, H. Clarke, P. Giovannetti, J. Hunt, A.M. Rafferty, and J. Shamian. 2001. Nurses’ reports on hospital care in five countries. Health Aff. 20: 43–53. [Google Scholar] [CrossRef]
- Aiken, L.H., S.P. Clarke, D.M. Sloane, J. Sochalski, and J.H. Silber. 2002. Hospital nurse staffing and patient mortality, nurse burnout, and job dissatisfaction. J. Am. Med. Assoc. 288: 1987–1993. [Google Scholar] [CrossRef]
- Aiken, L.H., S.P. Clarke, D.M. Sloane, E.T. Lake, and T. Cheney. 2009. Effects of Hospital Care Environment on Patient Mortality and Nurse Outcomes. J. Nurs. Adm. 39: S45–S51. [Google Scholar] [CrossRef] [PubMed]
- Laschinger, H.K.S. CWEQ-Conditions for Work Effectiveness Questionnaire I and II. (n.d.). Available online: http://publish.uwo.ca/~hkl/tools/cweq/index.html (accessed on 1 March 2017).
- Wagner, J.I., G. Cummings, D.L. Smith, J. Olson, L. Anderson, and S. Warren. 2010. The relationship between structural empowerment and psychological empowerment for nurses: A systematic review. J. Nurs. Manag. 18: 448–462. [Google Scholar] [CrossRef] [PubMed]
- Román, M.J. J., and F.D. Bretones. 2013. Spanish adaptation of the structural empowerment scale. Span. J. Psychol. 16: E15. [Google Scholar] [CrossRef] [PubMed]
- Bernardino, E., A.M. Dyniewicz, K.L. B. Carvalho, L.C. Kalinowski, and W.H. Bonat. 2013. Transcultural adaptation and validation of the Conditions of Work Effectiveness-Questionnaire-II instrument. Rev. Lat. Am. Enferm. 21: 1112–1118. [Google Scholar] [CrossRef] [PubMed]
- Sun, N., Q.J. Li, D.M. Lv, G.Z. Lu, P. Lin, and X.M. An. 2014. The psychometric properties of the Chinese version of the Conditions of Work Effectiveness Questionnaire-II. J. Nurs. Manag. 22: 848–854. [Google Scholar] [CrossRef] [PubMed]
- Orgambídez-Ramos, A., G. Gonçalves, J. Santos, Y. Borrego-Alés, and M.I. Mendoza-Sierra. 2015. Empowering employees: A Portuguese adaptation of the Conditions of Work Effectiveness Questionnaire (CWEQ-II). Rev. Psichol. 29: 1–10. [Google Scholar]
- Teixeira, A.C., M.A.A. Nogueira, and P.J.P. Alves. 2016. Structural empowerment in nursing: Translation, adaptation and validation of the Conditions of Work Effectiveness Questionnaire II. Rev. Enferm. Ref. 4: 39. [Google Scholar] [CrossRef]
- Hambleton, R.K., H. Swaminathan, and H.J. Rogers. 1991. Fundamentals of Item Response Theory. Newbury Park, CA, USA: Sage. [Google Scholar]
- Tsutsumi, A., N. Iwata, T. Wakita, R. Kumagai, H. Noguchi, and N. Kawakami. 2008. Improving the measurement accuracy of the effort-reward imbalance scales. Int. J. Behav. Med. 15: 109–119. [Google Scholar] [CrossRef] [PubMed]
- Yen, W.M., and A.R. Fitzpatrick. 2006. Item Response Theory. In RL Brennan. Educational Measurement, 4th ed. Westport, CT, USA: Praeger, pp. 111–153. [Google Scholar]
- Reise, S.P., A.T. Ainsworth, and M.G. Haviland. 2005. Item Response Theory: Fundamentals, applications, and promise in psychological research. Curr. Dir. Psychol. Sci. 14: 95–101. [Google Scholar] [CrossRef]
- Muraki, E. 1993. Information functions of the generalized partial credit model. ETS Res. Rep. Ser. 1993. [Google Scholar] [CrossRef]
- Ercikan, K., R.D. Sehwarz, M.W. Julian, G.R. Burket, M.M. Weber, and V. Link. 1998. Calibration and scoring of tests with multiple-choice and constructed-response item types. J. Educ. Meas. 35: 137–154. [Google Scholar] [CrossRef]
- Linacre, J.M. 1994. Sample size and item calibration stability. Rasch Meas. Trans. 7: 328. [Google Scholar]
- Tsutakawa, R.K., and J.C. Johnson. 1990. The effect of uncertainty of item parameter estimation on ability estimates. Psychometrika 55: 371–390. [Google Scholar] [CrossRef]
- Yen, M., and S.R. Edwardson. 1999. Item-response theory approach in scale development. Nurs. Res. 48: 234–238. [Google Scholar] [CrossRef] [PubMed]
- Slocum-Gori, S.L., and B.D. Zumbo. 2011. Assessing the unidimensionality of psychological scales: Using multiple criteria from factor analysis. Soc. Indic. Res. 102: 443–461. [Google Scholar] [CrossRef]
- Wainer, H., and D. Thissen. 1996. How is reliability related to the quality of test scores? What is the effect of local dependence on reliability? Educ. Meas. Issues Pract. 15: 22–29. [Google Scholar] [CrossRef]
- Yen, W.M. 1993. Scaling performance assessments: Strategies for managing local item dependence. J. Educ. Meas. 30: 187–213. [Google Scholar] [CrossRef]
- Lee, Y.-W. 2004. Examining passage-related local item dependence (LID) and measurement construct using Q3 statistics in an EFL reading comprehension test. Lang. Test. 21: 74–100. [Google Scholar] [CrossRef]
- Edelen, M.O., and B.B. Reeve. 2007. Applying Item Response Theory (IRT) modeling to questionnaire development, evaluation, and refinement. Qual. Life Res. 16: 5. [Google Scholar] [CrossRef] [PubMed]
- Lecointe, D.A. How the Collapsing of Categories Impacts the Item Information Function in polytomous Item Response Theory. In Proceedings of the Annual Meeting of the Americal Educational Research Association, San Francisco, CA, USA, 1995; Available online: http://www.eric.ed.gov/PDFS/ED386469.pdf (accessed on 1 December 2016).
- Wakita, T., N. Ueshima, and H. Noguchi. 2012. Psychological distance between categories in the Likert scale: Comparing different numbers of options. Educ. Psychol. Meas. 72: 533–546. [Google Scholar] [CrossRef]
- Andrich, D. 1988. A general form of Rasch’s extended logistic model for partial credit scoring. Appl. Meas. Educ. 1: 363–378. [Google Scholar] [CrossRef]
- Fletcher, R., and J. Hattie. 2005. Gender differences in physical self-concept: A multidimensional differential item functioning analysis. Educ. Psychol. Meas. 65: 657–667. [Google Scholar] [CrossRef]
- Linn, R.L. 1990. Has Item Response Theory increased the validity of achievement test scores? Appl. Meas. Educ. 3: 115–141. [Google Scholar] [CrossRef]
- Hubley, A.M., and B.D. Zumbo. 1996. A dialectic on validity: Where we have been and where we are going. J. Gen. Psychol. 123: 207–215. [Google Scholar] [CrossRef]
- Hubley, A.M., and B.D. Zumbo. 2011. Validity and the consequences of test interpretation and use. Soc. Indic. Res. 103: 219. [Google Scholar] [CrossRef]
- Chang, L. 1994. A psychometric evaluation of 4-point and 6-point Likert-type scales in relation to reliability and validity. Appl. Meas. Educ. 18: 205–215. [Google Scholar] [CrossRef]


| Items and Subscales | Mean (SD) | Strongly Disagree | Disagree | Neutral | Agree | Strongly Agree |
|---|---|---|---|---|---|---|
| 1. Challenging work (Opportunity) | 3.05 (0.89) | 0.8 | 3.0 | 23.4 | 35.7 | 37.1 |
| 2. Gain New Skills (Opportunity) | 2.80 (1.00) | 1.9 | 8.0 | 26.4 | 35.2 | 28.5 |
| 3. Tasks using all skills/knowledge (Opportunity) | 2.92 (0.94) | 1.3 | 6.2 | 21.9 | 40.3 | 30.3 |
| 4. Current State of hospital (Information) | 2.03 (1.01) | 7.5 | 18.9 | 44.5 | 21.2 | 7.9 |
| 5. Values of management (Information) | 1.68 (1.05) | 15.5 | 25.7 | 39.2 | 14.9 | 4.7 |
| 6. Goals of management (Information) | 1.63 (1.08) | 17.1 | 27.3 | 36.0 | 14.7 | 4.9 |
| 7. Support to information (Support) | 2.00 (1.06) | 10.8 | 17.7 | 38.8 | 26.7 | 6.0 |
| 8. Information about things to improve (Support) | 1.88 (1.02) | 11.0 | 21.4 | 40.0 | 23.5 | 4.2 |
| 9. Problem solving advice (Support) | 2.20 (1.07) | 8.1 | 14.7 | 35.8 | 31.8 | 9.6 |
| 10. Time to do paperwork (Resources) | 2.08 (0.92) | 3.8 | 22.6 | 40.1 | 28.9 | 4.6 |
| 11. Time to do job requirement (Resources) | 2.30 (0.88) | 2.0 | 22.6 | 40.1 | 28.9 | 4.6 |
| 12. acquiring temp help (Resources) | 1.86 (1.08) | 12.4 | 24.3 | 34.1 | 23.8 | 5.4 |
| 13. Collaborating on patient care (Informal Power) | 2.51 (1.10) | 4.1 | 13.5 | 32.5 | 27.4 | 22.5 |
| 14. Being sought by peers (Informal Power) | 3.01 (0.84) | 0.3 | 3.5 | 22.8 | 41.6 | 31.9 |
| 15. Being sought by management (Informal Power) | 1.97 (1.12) | 10.9 | 22.6 | 33.4 | 24.4 | 8.6 |
| 16. Seeking out other professionals’ ideas (Informal Power) | 2.51 (1.10) | 5.3 | 12.2 | 28.7 | 34.0 | 19.8 |
| 17. Rewards for innovation (Formal Power) | 1.68 (1.05) | 15.7 | 25.4 | 38.1 | 17.2 | 3.6 |
| 18. Amount of flexibility (Formal Power) | 2.19 (0.98) | 4.6) | 18.1 | 39.7 | 28.7 | 8.9 |
| 19. Amount of visibility (Formal Power) | 1.8 (0.97) | 8.1 | 26.9 | 41.7 | 18.9 | 4.4 |
| Items (Subscales) | Factors | ||||
|---|---|---|---|---|---|
| 1 | 2 | 3 | 4 | 5 | |
| 1. Challenging work (Opportunity) | 0.411 | 0.664 | |||
| 2. Gain new skills (Opportunity) | 0.575 | 0.475 | |||
| 3. Tasks that use all skills/ knowledge (Opportunity) | 0.475 | 0.593 | |||
| 4. Current state of hospital (Information) | 0.544 | −0.470 | |||
| 5. Values of top management (Information) | 0.649 | −0.591 | |||
| 6. Goals of top management (Information) | 0.647 | −0.577 | |||
| 7. Support to information (Support) | 0.751 | ||||
| 8. Information about things to improve (Support) | 0.683 | ||||
| 9. Problem solving advice (Support) | 0.713 | ||||
| 10. Time to do paperwork (Resources) | 0.500 | −0.520 | |||
| 11. Time to do job requirements (Resources) | 0.485 | −0.545 | 0.406 | ||
| 12. Acquiring temporary help (Resources) | 0.481 | ||||
| 13. Collaborating on patient care (Informal Power) | 0.470 | 0.512 | |||
| 14. Being sought by peers (Informal Power) | 0.489 | 0.489 | |||
| 15. Being sought by managers (Informal Power) | 0.582 | −0.421 | |||
| 16. Seeking out other professionals’ ideas (Informal Power) | 0.469 | ||||
| 17. Rewards for innovation (Formal Power) | 0.682 | ||||
| 18. Amount of flexibility (Formal Power) | 0.559 | ||||
| 19. Amount of visibility (Formal Power) | 0.627 | ||||
| Items and Subscales | Slope | SE | b1 | SE | b2 | SE | b3 | SE | b4 | SE |
|---|---|---|---|---|---|---|---|---|---|---|
| 1. Challenging work (Opportunity) | 0.47 | 0.40 | −1.89 | 0.19 | −2.35 | 0.09 | −0.53 | 0.09 | 0.05 | 0.08 |
| 2. Gain New Skills (Opportunity) | 0.72 | 0.27 | −2.32 | 0.14 | −1.68 | 0.08 | −0.41 | 0.08 | 0.47 | 0.09 |
| 3. Tasks using all skills/knowledge (Opportunity) | 0.53 | 0.30 | −2.11 | 0.15 | −1.58 | 0.08 | −0.71 | 0.08 | 0.42 | 0.08 |
| 4. Current State of hospital (Information) | 0.63 | 0.15 | −1.40 | 0.09 | −1.03 | 0.09 | 0.88 | 0.09 | 1.46 | 0.14 |
| 5. Values of management (Information) | 0.92 | 0.12 | −1.14 | 0.08 | −0.52 | 0.10 | 1.39 | 0.10 | 2.18 | 0.19 |
| 6. Goals of management (Information) | 0.88 | 0.11 | −1.03 | 0.08 | −0.35 | 0.11 | 1.32 | 0.11 | 2.07 | 0.18 |
| 7. Support to information (Support) | 1.73 | 0.17 | −2.30 | 0.11 | −1.41 | 0.10 | 0.93 | 0.10 | 3.50 | 0.20 |
| 8. Information about things to improve (Support) | 1.34 | 0.15 | −1.91 | 0.09 | −.98 | 0.10 | 1.06 | 0.10 | 3.34 | 0.21 |
| 9. Problem solving advice (Support) | 1.36 | 0.18 | −2.10 | 0.11 | −1.53 | 0.08 | 0.34 | 0.08 | 2.43 | 0.15 |
| 10. Time to do paperwork (Resources) | 0.60 | 0.18 | −2.26 | 0.09 | −0.75 | 0.08 | 0.45 | 0.08 | 2.28 | 0.17 |
| 11. Time to do job requirement (Resources) | 0.62 | 0.24 | −2.68 | 0.10 | −1.06 | 0.07 | 0.01 | 0.07 | 2.24 | 0.15 |
| 12. acquiring temp help (Resources) | 0.52 | 0.12 | −.96 | 0.08 | −0.42 | 0.09 | 0.49 | 0.09 | 1.86 | 0.16 |
| 13. Collaborating on patient care (Informal Power) | 0.43 | 0.18 | −1.51 | 0.11 | −1.04 | 0.08 | 0.17 | 0.08 | 0.36 | 0.09 |
| 14. Being sought by peers (Informal Power) | 0.59 | 0.61 | −3.22 | 0.19 | −2.31 | 0.09 | −0.75 | 0.09 | 0.41 | 0.08 |
| 15. Being sought by management (Informal Power) | 0.67 | 0.13 | −1.20 | 0.09 | −0.55 | 0.09 | 0.48 | 0.09 | 1.56 | 0.14 |
| 16. Seeking out other professionals’ ideas (Informal Power) | 0.45 | 0.17 | −1.18 | 0.11 | −1.03 | 0.08 | −0.18 | 0.08 | 0.71 | 0.09 |
| 17. Rewards for innovation (Formal Power) | 1.09 | 0.13 | −1.28 | 0.09 | −0.53 | 0.11 | 1.34 | 0.11 | 2.92 | 0.22 |
| 18. Amount of flexibility (Formal Power) | 0.73 | 0.18 | −2.04 | 0.10 | −1.05 | 0.08 | 0.44 | 0.08 | 1.71 | 0.14 |
| 19. Amount of visibility (Formal Power) | 0.91 | 0.15 | −1.95 | 0.08 | −0.63 | 0.10 | 1.14 | 0.10 | 2.43 | 0.19 |
| Items and Subscales | Chi Square | DF | N | Z (fit) |
|---|---|---|---|---|
| 1. Challenging work (Opportunity) | 31.47 | 35 | 1056 | −0.42 |
| 2. Gain New Skills (Opportunity) | 27.66 | 35 | 1057 | −0.88 |
| 3. Tasks using all skills/knowledge (Opportunity) | 23.94 | 35 | 1057 | −1.32 |
| 4. Current State of hospital (Information) | 27.91 | 35 | 1038 | −0.85 |
| 5. Values of management (Information) | 22.75 | 35 | 1054 | −1.46 |
| 6. Goals of management (Information) | 17.90 | 35 | 1055 | −2.04 |
| 7. Support to information (Support) | 28.69 | 35 | 1058 | −0.75 |
| 8. Information about things to improve (Support) | 37.67 | 35 | 1056 | 0.32 |
| 9. Problem solving advice (Support) | 77.17 | 35 | 1057 | 5.04 |
| 10. Time to do paperwork (Resources) | 38.57 | 35 | 1059 | 0.43 |
| 11. Time to do job requirement (Resources) | 27.20 | 35 | 1058 | −0.93 |
| 12. acquiring temp help (Resources) | 54.12 | 35 | 1054 | 2.29 |
| 13. Collaborating on patient care (Informal Power) | 46.78 | 35 | 1025 | 1.41 |
| 14. Being sought by peers (Informal Power) | 38.11 | 35 | 1032 | 0.37 |
| 15. Being sought by management (Informal Power) | 48.88 | 35 | 1032 | 1.66 |
| 16. Seeking out other professionals’ ideas (Informal Power) | 59.73 | 35 | 1028 | 2.96 |
| 17. Rewards for innovation (Formal Power) | 42.66 | 35 | 1024 | 0.92 |
| 18. Amount of flexibility (Formal Power) | 32.34 | 35 | 1027 | −0.32 |
| 19. Amount of visibility (Formal Power) | 68.84 | 35 | 1022 | 4.04 |
| Items | Slope | SE | b1 | SE | b2 | SE |
|---|---|---|---|---|---|---|
| 1. Challenging work (Opportunity) | 0.86 | 0.07 | −2.57 | 0.21 | −1.26 | 0.08 |
| 2. Gain New Skills (Opportunity) | 0.97 | 0.07 | −1.71 | 0.15 | −0.92 | 0.08 |
| 3. Tasks using all skills/knowledge (Opportunity) | 0.73 | 0.06 | −1.57 | 0.15 | −1.23 | 0.08 |
| 4. Current State of hospital (Information) | 0.87 | 0.06 | −0.83 | 0.09 | 0.70 | 0.08 |
| 5. Values of management (Information) | 1.22 | 0.07 | −0.22 | 0.08 | 1.38 | 0.11 |
| 6. Goals of management (Information) | 1.18 | 0.07 | −0.01 | 0.08 | 1.28 | 0.11 |
| 7. Support to information (Support) | 2.07 | 0.11 | −1.31 | 0.11 | 1.00 | 0.11 |
| 8. Information about things to improve (Support) | 1.64 | 0.09 | −0.83 | 0.10 | 1.14 | 0.11 |
| 9. Problem solving advice (Support) | 1.65 | 0.09 | −1.41 | 0.12 | −0.27 | 0.09 |
| 10. Time to do paperwork (Resources) | 0.65 | 0.05 | −0.62 | 0.08 | 0.34 | 0.08 |
| 11. Time to do job requirement (Resources) | 0.64 | 0.05 | −0.96 | 0.10 | −0.11 | 0.07 |
| 12. acquiring temp help (Resources) | 0.61 | 0.05 | −0.06 | 0.08 | 0.34 | 0.08 |
| 13. Collaborating on patient care (Informal Power) | 0.62 | 0.05 | −0.89 | 0.10 | −0.37 | 0.07 |
| 14. Being sought by peers (Informal Power) | 0.92 | 0.08 | −2.64 | 0.21 | −1.31 | 0.08 |
| 15. Being sought by management (Informal Power) | 0.85 | 0.06 | −0.26 | 0.09 | 0.29 | 0.09 |
| 16. Seeking out other professionals’ ideas (Informal Power) | 0.61 | 0.05 | −0.78 | 0.11 | −0.58 | 0.08 |
| 17. Rewards for innovation (Formal Power) | 1.42 | 0.08 | −0.26 | 0.08 | 1.44 | 0.12 |
| 18. Amount of flexibility (Formal Power) | 0.92 | 0.06 | −0.97 | 0.10 | 0.28 | 0.08 |
| 19. Amount of visibility (Formal Power) | 1.13 | 0.07 | −0.50 | 0.08 | 1.12 | 0.10 |
| Items and Subscales | Chi square | DF | N | Z (fit) |
|---|---|---|---|---|
| 1. Challenging work (Opportunity) | 14.66 | 17 | 1046 | −0.40 |
| 2. Gain New Skills (Opportunity) | 10.08 | 17 | 1047 | −1.19 |
| 3. Tasks using all skills/knowledge (Opportunity) | 17.63 | 17 | 1047 | 0.11 |
| 4. Current State of hospital (Information) | 13.34 | 17 | 1028 | −0.63 |
| 5. Values of management (Information) | 14.81 | 17 | 1044 | −0.37 |
| 6. Goals of management (Information) | 18.94 | 17 | 1045 | 0.33 |
| 7. Support to information (Support) | 16.58 | 17 | 1047 | −0.07 |
| 8. Information about things to improve (Support) | 18.85 | 17 | 1045 | 0.32 |
| 9. Problem solving advice (Support) | 24.42 | 17 | 1046 | 1.27 |
| 10. Time to do paperwork (Resources) | 7.79 | 17 | 1048 | −1.58 |
| 11. Time to do job requirement (Resources) | 19.10 | 17 | 1047 | 0.36 |
| 12. acquiring temp help (Resources) | 12.65 | 17 | 1043 | −0.75 |
| 13. Collaborating on patient care (Informal Power) | 13.87 | 17 | 1012 | −0.54 |
| 14. Being sought by peers (Informal Power) | 17.40 | 17 | 1019 | 0.07 |
| 15. Being sought by management (Informal Power) | 17.03 | 17 | 1019 | 0.00 |
| 16. Seeking out other professionals’ ideas (Informal Power) | 19.00 | 17 | 1015 | 0.34 |
| 17. Rewards for innovation (Formal Power) | 31.75 | 17 | 1011 | 2.53 |
| 18. Amount of flexibility (Formal Power) | 16.70 | 17 | 1014 | −0.05 |
| 19. Amount of visibility (Formal Power) | 49.04 | 17 | 1009 | 5.49 |
© 2017 by the authors. Licensee MDPI, Basel, Switzerland. This article is an open access article distributed under the terms and conditions of the Creative Commons Attribution (CC BY) license (http://creativecommons.org/licenses/by/4.0/).
Share and Cite
Havaei, F.; Dahinten, V.S. How Well Does the CWEQ II Measure Structural Empowerment? Findings from Applying Item Response Theory. Adm. Sci. 2017, 7, 15. https://doi.org/10.3390/admsci7020015
Havaei F, Dahinten VS. How Well Does the CWEQ II Measure Structural Empowerment? Findings from Applying Item Response Theory. Administrative Sciences. 2017; 7(2):15. https://doi.org/10.3390/admsci7020015
Chicago/Turabian StyleHavaei, Farinaz, and V. Susan Dahinten. 2017. "How Well Does the CWEQ II Measure Structural Empowerment? Findings from Applying Item Response Theory" Administrative Sciences 7, no. 2: 15. https://doi.org/10.3390/admsci7020015
APA StyleHavaei, F., & Dahinten, V. S. (2017). How Well Does the CWEQ II Measure Structural Empowerment? Findings from Applying Item Response Theory. Administrative Sciences, 7(2), 15. https://doi.org/10.3390/admsci7020015