Article

Board Gender Diversity and Environmental, Social, and Governance (ESG) Disclosure in Developed Countries

by
Chinonyerem Matilda Omenihu
1,*,
Madina Abdrakhmanova
1,* and
Dimitrios N. Koufopoulos
2
1
Department of Finance, Accounting and Risk, Glasgow Caledonian University, Glasgow G4 0BA, UK
2
Global Online MBA Program, University of London Worldwide, London WC1E 7HU, UK
*
Authors to whom correspondence should be addressed.
Adm. Sci. 2025, 15(4), 141; https://doi.org/10.3390/admsci15040141
Submission received: 20 February 2025 / Revised: 7 April 2025 / Accepted: 8 April 2025 / Published: 12 April 2025

Abstract

:
This paper examines the relationship between board gender diversity and Environmental, Social, and Governance (ESG) disclosure in developed economies. Using a sample of forty-five firms across developed countries between 2012 and 2023, the analysis employs Bloomberg’s ESG disclosure score as a proxy. In terms of methodology, both pooled ordinary least squares (OLS) and fixed effects regression models are employed. However, to mitigate potential endogeneity concerns, the study employs an instrumental variable approach and dynamic panel regression techniques to provide robust causal inference. The findings offer two significant insights. In accordance with critical mass theory, firms with a minimum of three female directors demonstrate a significant positive relationship between board gender diversity and ESG disclosure. This indicates that achieving a critical level of female representation is essential for fostering meaningful improvements in ESG disclosure scores. Second, firms with merely one or two female directors, often considered token representation, exhibit a negative significant impact on ESG disclosure. Additionally, within the UK context, board gender diversity is positively associated with ESG disclosure, suggesting that institutional frameworks and regulatory environment shape this relationship.

1. Introduction

A growing body of research has examined the factors influencing ESG performance, with particular attention to boardroom composition, especially board gender diversity, emerging as one of the key determinants (Yarram & Adapa, 2021; Abdelkader et al., 2024). Studies suggest that greater female representation on corporate boards enhances firms’ disclosure of environmental information and responsiveness to external stakeholders’ interests (Pucheta-Martínez & Bel-Oms, 2019; Atif et al., 2020). Female directors bring diverse perspectives, fostering more comprehensive decision-making that accounts for a broader range of values and interests. Their presence has been linked to improved environmental performance, including reduced resource consumption and greater product innovation (Wasiuzzaman & Wan Mohammad, 2020).
Additionally, their unique expertise contributes to shaping corporate social responsibility attitudes and enhancing information disclosure (Wu et al., 2024). Nevertheless, studies regarding the association between board gender diversity and ESG have yielded conflicting results. Some studies indicated a positive correlation (Bhatia & Marwaha, 2022; Albitar et al., 2023; Zhu & Chen, 2024; Ma et al., 2024; Eissa et al., 2024; Wu et al., 2024), while others reported a negative correlation (Husted & de Sousa-Filho, 2019; Cucari et al., 2018; Arhinful et al., 2024) or no significant correlation whatsoever (Manita et al., 2018; Zaid et al., 2020). These contradictory findings may stem from variations in corporate governance structures, the empirical methodologies employed, the statistical models utilised, the time frames analysed, and the exclusion of certain variables (Muhammad & Migliori, 2023). Given the diverse outcomes, further empirical investigation is needed to establish definitive conclusions regarding the impact of gender diversity on boards on ESG disclosure scores.
The empirical inconsistency in previous studies may arise from the commonly used estimation methods. Previous research mostly employed conventional linear regression techniques, including ordinary least squares (OLS) and fixed effects, which are methodologically insufficient for a comprehensive analysis of the relationship between board gender diversity and ESG practices. According to Wintoki et al. (2012), these techniques fail to consider the inherent endogeneity problem, which is a fundamental challenge in governance research that has the potential to result in skewed causal findings. As a result, OLS regression may yield biased outcomes stemming from problems related to endogeneity and unobserved heterogeneity. However, many of the earlier studies overlooked these issues. This underscores the necessity of thoroughly examining and identifying all possible explanations for these conflicting results.
Consequently, this study employs multiple estimation techniques to analyse the relationship between board gender diversity and ESG disclosure scores. These include ordinary least squares (OLS), fixed effects regression, and the instrumental variables-generalised method of moments (IV-GMM) estimator. While conventional approaches such as OLS are commonly used, they are limited in addressing endogeneity issues that may arise due to omitted variable bias, measurement error, or reverse causality. To mitigate these concerns, we implement the IV-GMM approach proposed by Baum et al. (2003), which provides consistent estimates even in the presence of heteroskedasticity and autocorrelation in panel data. Furthermore, we apply two-stage least squares (2SLS) and inverse probability weighting (IPW) regression as additional robustness checks to validate the reliability of the results and enhance confidence in the conclusions drawn.
This paper analyses data from the Bloomberg database, focusing on 45 firms within the EURO STOXX Index, which has been comprehensively updated over a 12-year period from 2012 to 2023. Following Muhammad and Migliori (2023), we utilised a multi-theoretical framework incorporating resource dependence theory, stakeholder theory, and critical mass theory to examine the relationship between board gender diversity and ESG scores. Our findings indicate a significant positive relationship between board gender diversity and the ESG disclosure score, especially when a minimum of three female directors are nominated. This indicates that a substantial presence of female representation may be essential to foster major enhancements in ESG transparency, rather than superficial appointments that are unlikely to produce meaningful outcomes. The findings exhibit consistency when evaluated through diverse estimation techniques.
The remainder of this paper is structured as follows. Section 2 presents the theoretical framework and research hypotheses. Section 3 outlines the research methodology. Section 4 reports the key empirical findings, while Section 5 discusses the study’s conclusions and implications.

2. Literature Review

This study examines the relationship between gender diversity and Environmental, Social, and Governance (ESG) disclosure scores. Given the complex nature of this relationship, it is apparent that no single theoretical framework can provide an in-depth analysis. We employ a multi-theoretical framework, integrating resource dependence theory, stakeholder theory, and critical mass theory to analyse the impact of board gender diversity on ESG disclosure (Muhammad & Migliori, 2023).
The board of directors is essential in providing critical resources, developing company strategy, and responding to stakeholder demands (Hillman et al., 2009; Post et al., 2015). Resource dependence theory asserts that a firm’s performance is contingent upon the expertise, background, psychological characteristics, and skills of its directors (Kyaw et al., 2017). From this perspective, the impact of female board membership on ESG practices is shaped by the unique contributions women bring to corporate governance (T. Nguyen et al., 2015). Shaukat et al. (2016) contend that the presence of women on corporate boards improves the decision-making process by integrating varied perspectives, skills, and orientations, which ultimately promotes ethical business conduct.
Empirical research indicates that women typically exhibit greater responsiveness to sustainability initiatives compared to men, ascribed to psychological characteristics including empathy, sensitivity, and a strong commitment to ethical duty (Samara et al., 2019; Manita et al., 2018). Hillman et al. (2000) further argued that the inclusion of female directors leads to better corporate decision-making through the introduction of diverse perspectives, which in turn enhances social and environmental transparency. Post et al. (2015) indicate that firms that have a greater number of women serving on their boards of directors are more likely to form partnerships that are focused on sustainability practices. Consequently, resource dependence theory presents a strong rationale for the positive relationship observed between board gender diversity and ESG performance, emphasising the critical role of female directors in addressing stakeholder concerns regarding ESG issues. Menicucci and Paolucci (2024) substantiate this view by finding that board gender diversity is a critical determinant of ESG performance. The increasing focus on sustainability within corporate governance has resulted in the incorporation of stakeholder theory, thereby broadening the definition of corporate responsibility to encompass a wider array of stakeholders beyond just shareholders. Historically, the objective of corporate governance has been to enhance shareholder value through the execution of strategic policies, resource acquisition, and sustaining internal controls (Lan & Heracleous, 2010). Nonetheless, modern frameworks for corporate governance are starting to acknowledge that there needs to be a balance between shareholder value and ethical, social, and environmental obligations (Longo et al., 2005).
Scholars have observed that the influence of board features on promoting ESG efforts can vary significantly among countries, mainly due to differences in institutional frameworks (Zaman et al., 2020). Numerous ESG studies employ institutional theory as it provides an effective framework for examining the influence of societal, legislative, and cultural factors on sustainability practices (Lewellyn & Muller-Kahle, 2023). Scott and Meyer (1994) argue that organisational practices are influenced not only by efficiency or performance metrics but also by the dominant beliefs, assumptions, and expectations that exist within a given context. From this viewpoint, ESG disclosure transcends being just a strategic or operational choice; it embodies the institutionalised pressures to align with recognised guidelines for corporate sustainability. Organisations that operate within institutional frameworks that are comparable to one another are more inclined to embrace practices that are equivalent to one another, such as ethical behaviour and transparency.
Stakeholder theory highlights the significance of corporate transparency, ethical decision-making, and sustainability practices (De Vasconcelos et al., 2012; Freeman et al., 2021). According to Chen and Roberts (2010), businesses are required to improve their economic performance while simultaneously communicating their contributions to sustainable development and the promotion of human well-being. Adopting a proactive strategy for engaging stakeholders enables organisations to improve their ESG performance while addressing the varied expectations of those involved (Arayssi et al., 2016). Regardless of their independence, board members are accountable for making ethical and well-informed decisions that are consistent with the sustainability objectives of the organisation. Integrating resource dependence theory with stakeholder theory demonstrates that the presence of female board members is associated with increased stakeholder representation (Freeman, 1984), enhanced access to valuable information (Benson et al., 1978), and improved Environmental, Social, and Governance (ESG) performance (Muhammad & Migliori, 2023).
Kanter’s early work (Kanter, 1977a, 1977b) introduced the concept of tokenism, suggesting that women who constitute a minority on corporate boards are frequently viewed as figurative members with restricted influence. Both Kulich et al. (2007) and Lee and James (2007) highlighted that the under-representation of women on boards can reinforce gender stereotypes and limit their impact on board decisions. While Kanter’s theory remains pertinent in the examination of boardroom dynamics, it must be contextualised within the broader and evolving global landscape, where progress in gender diversity has been noted across different regions. Elaborating on this viewpoint, critical mass theory posits that minority group members must reach a specific threshold to have substantial influence within a bigger entity. This theory suggests that corporate boards consisting of only one or two women are unlikely to effect meaningful change, as their contributions may be minimal, and their influence easily overlooked. Konrad et al. (2008) assert that the impact of female directors becomes significant only upon reaching a critical mass. Torchia et al. (2011) furnish empirical evidence for this concept, illustrating that the presence of a minimum of three women on boards markedly enhances the probability of female directors engaging actively in governance activities. At this juncture, women possess a greater capacity to influence the substance and dynamics of board debates, potentially affecting strategic decisions and supervisory roles.
Empirical research by Brahma et al. (2021) and Schwartz-Ziv (2017) indicates that boards with a minimum of three female directors exhibit enhanced involvement and more inclusive decision-making processes. Jia and Zhang (2012) also discover that the existence of a critical mass leads to substantial alterations in board interactions. In a similar vein, Amin et al. (2022) demonstrate that boards comprising three or more female directors are associated with reduced agency costs, suggesting enhanced governance efficiency. Consequently, achieving a minimum representation of female directors can improve board effectiveness; however, it may not, on its own, address more profound structural and cultural obstacles.

Theoretical Framework and Hypothesis Development

This subsection delineates the theoretical framework and hypotheses posited in this study, building upon the theoretical insights and empirical findings discussed in the preceding section. Although previous research presents inconclusive data, the subsequent arguments embody the authors’ conceptual framework grounded in critical mass theory and associated viewpoints.
The inclusion of diverse genders on corporate boards has emerged as a vital component of governance structures (Lewellyn & Muller-Kahle, 2023). Diversity within the board enriches the knowledge base, fosters creativity, and improves leadership effectiveness (Ma et al., 2024). In the realm of corporate social responsibility, gender diversity is acknowledged as the most prominent board characteristic due to the differing leadership styles of men and women (Bart & McQueen, 2013), their disparate sensitivities to ESG issues (Williams, 2003), variations in information-processing expenses (Gul et al., 2011), and their comparative effectiveness in overseeing corporate activities (Nielsen & Huse, 2010).
Empirical studies largely support the notion that the presence of women on boards has a beneficial effect on ESG scores (Orazalin & Mahmood, 2021; Bhatia & Marwaha, 2022; Albitar et al., 2023; Zhu & Chen, 2024; Eissa et al., 2024). However, the existing literature showcases contradictory results, indicating a more complex relationship. Manita et al. (2018) indicate no significant correlation between board gender diversity and ESG disclosure in S&P 500 companies; however, Husted and de Sousa-Filho (2019), Cucari et al. (2018), and Arhinful et al. (2024) demonstrate that female board representation has an adverse effect on ESG performance. In a similar vein, Abdelkader et al. (2024) observe that board gender diversity has a negative impact on ESG outcomes in publicly listed non-financial firms in South Africa. Furthermore, the moderating influence of the institutional environment is emphasised by Wasiuzzaman and Subramaniam (2023), who demonstrate that female directors improve ESG disclosure quality, but only in developed economies. The varied findings highlight the need for a more detailed investigation of the effects of female representation, especially via the perspective of critical mass theory. The mixed findings highlight the need for a detailed analysis of the impact of female representation, especially through the lens of critical mass theory.
Critical mass theory is essential in clarifying the circumstances under which female board members shape governance outcomes and decision-making. The theory suggests that the capacity of a minority group, specifically women, to bring about significant change depends on its absolute or relative numerical strength (Konrad et al., 2008). Liu et al. (2014) summarise this phenomenon by asserting that “one is a token, two is a presence, and three is a voice”. Numerous research (Amorelli & García-Sánchez, 2021; Terjesen et al., 2009) indicate that a critical mass is reached when a board comprises a minimum of three female directors, allowing them to significantly impact organisational sustainability policy. Atif et al. (2020) demonstrate that in S&P 500 companies, the inclusion of one woman on the board produces only marginally significant advancements in sustainable practices, while the participation of two or more women leads to significant benefits.
Other research suggests that the critical threshold for significant influence is reached when a board contains at least thirty per cent female directors (Brahma et al., 2021). Issa and Hanaysha (2023) present empirical evidence indicating that boards comprising three or more female directors experience a lower number of ESG-related controversies. Similarly, research conducted by Toerien et al. (2023) on 92 South African companies indicates a positive association between female board representation and overall ESG scores. Despite these findings, there is still a dearth of evidence that substantiates critical mass theory. Nevertheless, female directors play a crucial role in ensuring that corporations are transparent and responsive to the demands of stakeholders (Khemakhem et al., 2023). Considering this, we hypothesize the following.
H1: 
The presence of three or more female directors has a positive impact on ESG disclosure score.
According to critical mass theory, an increased ratio of female directors improves group dynamics, reduces tokenism, and promotes board decision-making related to sustainability (Zaichkowsky, 2014; Abdelkader et al., 2024). Conversely, numerous boards do not attain critical mass, leading to tokenistic representation, wherein female directors occupy one or two positions yet possess inadequate power within a male-dominated boardroom. This proxy status limits their ability to impact corporate decisions, frequently as a result of institutionalised gender biases, predefined roles, and marginalisation (Brahma et al., 2021). Although token representation may enhance the ESG disclosure score, its influence is expected to be less significant than that of a critical mass. In light of these considerations, we propose:
H2: 
Token representation of women on the board (one or two female directors) will exert a weaker positive influence on ESG disclosure than critical mass representation (three or more female directors).

3. Materials and Methods

3.1. Sample and Data Sources

Our initial sample comprises 50 constituent firms of EURO STOXX, fully updated for 12 years from 2012 to 2023. After excluding firms with missing or incomplete information, the final sample consists of 45 firms with complete and consistent data on ESG disclosure scores, corporate governance variables, and financial indicators from 2012 to 2023. The EURO STOXX 50 Index, Europe’s leading blue-chip index for the Eurozone, provides a blue-chip representation of super sector leaders in the region. The dataset comprises a diverse range of 50 stocks from 11 Eurozone countries, including large-, mid-, and small-cap entities. The European context was employed as a sample since European companies are considered leaders in CSR, following specific European Commission guidelines and principles on CSR (European Parliament, 2020). All firm-level data were obtained from Bloomberg, while data on gross domestic product were collected from the World Development Indicators database. No issues arise regarding participant confidentiality or consent since the study relies on archival data.

3.2. Measurement of Variables

This study employed ESG disclosure data from the Bloomberg database, recognised as a prominent standard for corporate sustainability reporting. Bloomberg’s ESG disclosure score is based on the Global Reporting Initiative (GRI) recommendations to guarantee adherence to international standards. Rajesh and Rajendran (2020) point out that the overall ESG score evaluates three fundamental dimensions: Environmental, Social, and Governance (ESG) aspects. The rating system operates on a scale from 0, which signifies a complete absence of ESG disclosure, to 100 percent, which denotes comprehensive disclosure of all ESG data monitored by Bloomberg. This index is developed through a systematic gathering and assessment of data points by Bloomberg experts, with each data point weighted based on its importance and relevance in the industry. Thus, the score serves as a measure of the scope and comprehensiveness of ESG reporting rather than its quality or impact. Due to its reputation, Bloomberg’s ESG disclosure scores have been widely employed in academic research (Manita et al., 2018), highlighting their significance in empirical studies on business transparency.
The primary variable of interest in this study is board gender diversity. Drawing upon the research of Menicucci and Paolucci (2024), Khemakhem et al. (2023), Brahma et al. (2021), and Birindelli et al. (2018), we examine gender diversity at the board level utilising critical mass theory (Konrad et al., 2008). To implement this, we introduce two essential variables. The initial variable is critical mass, assigned a value of 1 if a board comprises three or more female directors, and 0 otherwise. The second variable is the token variable, which assumes a value of 1 if the number of female directors is fewer than three, and 0 otherwise. This distinction is crucial, as prior research suggests that a shift in board dynamics is posited to occur when women occupy more than 30% of decision-making roles inside organisations (Torchia et al., 2011). This ratio indicates a transition from mere token representation to a substantial minority, which holds considerable importance within the framework of critical mass theory (Kurebwa & Ndlovu, 2017). The crucial aspect of gender diversity on corporate boards is not merely the presence of women but rather the adequate representation of women to effectuate meaningful change. Kanter (1977a) posited that a minimum of three women is typically necessary to effectively influence group dynamics. Consistent with Kanter (1977a) and Torchia et al. (2011), we define critical mass as the inclusion of a minimum of three female directors, a benchmark commonly employed in previous research.
To further develop our empirical analysis, we include a comprehensive array of control variables categorised into three groups (Wasiuzzaman & Subramaniam, 2023; Khemakhem et al., 2023). Regarding board characteristics, board size is considered under the assumption that larger boards provide increased expertise and resources, which may improve ESG performance (Post et al., 2015; Alazzani et al., 2017; Beji et al., 2021). Board meetings are accounted for, as increased frequency may indicate greater engagement and accountability. The age of the board is considered, recognising that generational diversity may influence views on sustainability. CEO duality, defined as the CEO concurrently holding the position of board chair, is incorporated as a dummy variable, in accordance with Benjamin and Biswas (2019) and Issa and Zaid (2021). Previous research indicates that independent boards are more responsive to wider stakeholder interests and long-term sustainability objectives, with evidence suggesting that increased board independence is associated with increased CSR disclosure (Jizi et al., 2014). This study uses the percentage of independent directors as a proxy for board independence.
In terms of firm characteristics, firm size is defined as the natural logarithm of total assets, recognising that larger firms typically face increased public scrutiny and regulatory demands, potentially leading to more comprehensive ESG disclosure. Financial leverage is incorporated due to its intricate function in disclosure practices. Baldini et al. (2018) asserts that highly leveraged firms are inclined to disclose more ESG information to meet creditor expectations. In contrast, Giannarakis (2014) and Toerien et al. (2023) present findings from the US and South Africa that suggest highly leveraged firms focus more on fulfilling financial obligations than on making voluntary disclosures. This study measures leverage by examining the ratio of total assets-to-equity (Mehmood et al., 2023; Menicucci & Paolucci, 2024). Profitability is another key factor. Tobin’s Q ratio serves as a proxy, indicating that more profitable companies are anticipated to invest more resources in CSR initiatives (Arayssi et al., 2016). At a macro level, the model incorporates Gross Domestic Product (GDP), drawing on previous research indicating a positive correlation between economic growth and ESG performance (Bit & Pasaribu, 2024). Stronger ESG commitments from businesses are frequently the result of increased regulatory pressure and expectations from stakeholders in economies that are wealthier. Table 1 provides all employed variables of the study along with their measurement descriptions.

3.3. Methods

The three primary methods of estimation that can be employed in panel data analysis are pooled ordinary least squares (POLS), fixed effects (FE) regression, and random effects (RE) regression (Mack et al., 2024). Wooldridge (2012) asserts that the pooled ordinary least squares method regards the panel dataset as a singular extensive cross-section. This method assumes that all observations are independent and ignores any potential underlying structure in the data. However, when there is unobserved heterogeneity present, the estimates are inefficient and biassed. On the other hand, the FE and RE models explicitly acknowledge that identical entities (e.g., firms) are present across various time periods, thereby controlling unobserved heterogeneity specific to the entities. Unobserved heterogeneity refers to intrinsic characteristics specific to each firm that remain constant over time but are not explicitly measured within the model (Hsiao, 2005). Factors such as organisational culture, management styles, regional influences, and other unique characteristics of the firm may skew the estimation results if not adequately controlled. To determine the most suitable estimation technique, we performed the Hausman specification test, which assesses whether the fixed effects model or the random effects model yields more reliable estimates (Hsiao et al., 2002). The Hausman test rejects the null hypothesis that random effects are appropriate for estimation; therefore, we employed fixed effects in our regression analysis. Thus, we employed the fixed effects regression model in our empirical analysis. The static model used in this study is specified in Equation (1) below.
E S G   D i s c l o s u r e   s c o r e i t = β + n = 1 2 α n   B o a r d   G e n d e r   d i v e r s i t y i t + m = 1 8   µ m   C o n t r o l s i t + θ j + Φ k + Ɛ i t
ESG disclosure scoreit t represents the ESG disclosure score for firm i at time t;
Board gender diversityit represents board gender diversity indicators firm i at time t
Controls include a set of control variables influencing ESG disclosure;
θj captures firm-specific fixed effects, controlling for unobserved heterogeneity;
ϕk accounts for time-fixed effects, addressing macroeconomic variations;
Ɛit is the error term.
Empirical research has emphasised the problem of endogeneity in corporate governance research (Wintoki et al., 2012), which frequently results from time-invariant heterogeneity. We employ the instrumental variable (IV) method to mitigate endogeneity. To enhance efficiency, we opt for the IV-GMM, which yields effective results in the presence of unknown heteroskedasticity and demonstrates robustness to autocorrelation (Baum et al., 2003). IV-GMM functions as an instrumental variable estimator, utilising the generalised method of moments (GMM) framework to improve efficiency. Furthermore, IV-GMM mitigates the problem of variable omission bias and yields consistent results.
This study employs lagged independent variables as instruments in the IV-GMM analysis, given their strong correlation with the current values of the independent variables and their lack of correlation with the error term (Yurtseven, 2015). This instrumental method enables us to capture the exogenous variation in the explanatory variables, thus alleviating potential endogeneity issues (Muoneke et al., 2023). The justification for employing lagged values as instruments hinges on the premise that present independent variables are affected by their historical values while remaining unaffected by current error terms. This ensures that the instruments meet the criteria for both relevance and exogeneity, thus improving the validity of the IV-GMM estimation. The utilisation of IV-GMM in corporate governance research is well-documented, as evidenced by numerous recent studies that have employed this estimator to evaluate corporate social responsibility (e.g., V. C. Nguyen & Huynh, 2023; Sheikh, 2020). Hansen’s over-identification test, the Cragg–Donald F-statistic, Kleibergen–Paap rk LM statistic, and the endogeneity test were conducted to verify the validity of the instruments. Additionally, we implemented the instrumental variable (IV-2SLS) regression to execute robustness checks. The count of observations differs across models due to differences in the availability of variables, the inclusion of lagged variables in the IV-GMM specification, and the usage of sub-samples.

4. Results

This section presents a detailed analysis of the empirical results obtained from our investigations. We commence with the presentation of descriptive statistics and correlation analyses, which provide insights into central tendency, dispersion, and interrelationships among the variables. We utilise a panel data methodology that considers both temporal effects and individual variability. To enhance the reliability and credibility of our results, we perform a series of checks to evaluate the consistency of our findings across different model specifications and estimation methods.

4.1. Descriptive Statistics

Table 2 presents the descriptive statistics for all variables used in the analysis. The average ESG disclosure score is 58.108%, with a standard deviation of 10.083%, and it ranges from a minimum of 18.408% to a maximum of 83.613%. This significant variation highlights the diversity in companies’ approaches to ESG engagement, indicating differences in sustainability initiatives and disclosure practices throughout the sample. The critical mass of women directors has a mean value of 0.815 (SD = 0.389), suggesting that firms are approaching the threshold for a significant female presence on their boards. The average board size is 14.229 members (SD = 3.834), ranging from a minimum of 2 to a maximum of 221 members. This aligns with Orozco et al. (2018), who propose that a nine-member board is optimal for effective oversight and governance. Tobin’s Q ratio, which measures firm performance, suggests that the average firm in the industry has positive profitability, with values ranging from 0.831 to 12.032. In the same vein, the average growth rate of firm size is 11.488%, with a minimum of 8.133% and a maximum of 14.809%, which indicates a substantial degree of variability in corporate expansion plans.
The descriptive analysis also indicates that the average financial leverage ratio (long-term debt-to-total equity) is 7.053, which implies that the firms in the sample operate in a low-leverage environment. Nevertheless, the leverage levels are highly variable, with a minimum of 1.355 and a maximum of 70.363. This suggests that certain firms operate with highly leveraged capital structures, potentially impacting financial risk and corporate decision-making processes.

4.2. Correlation Analysis
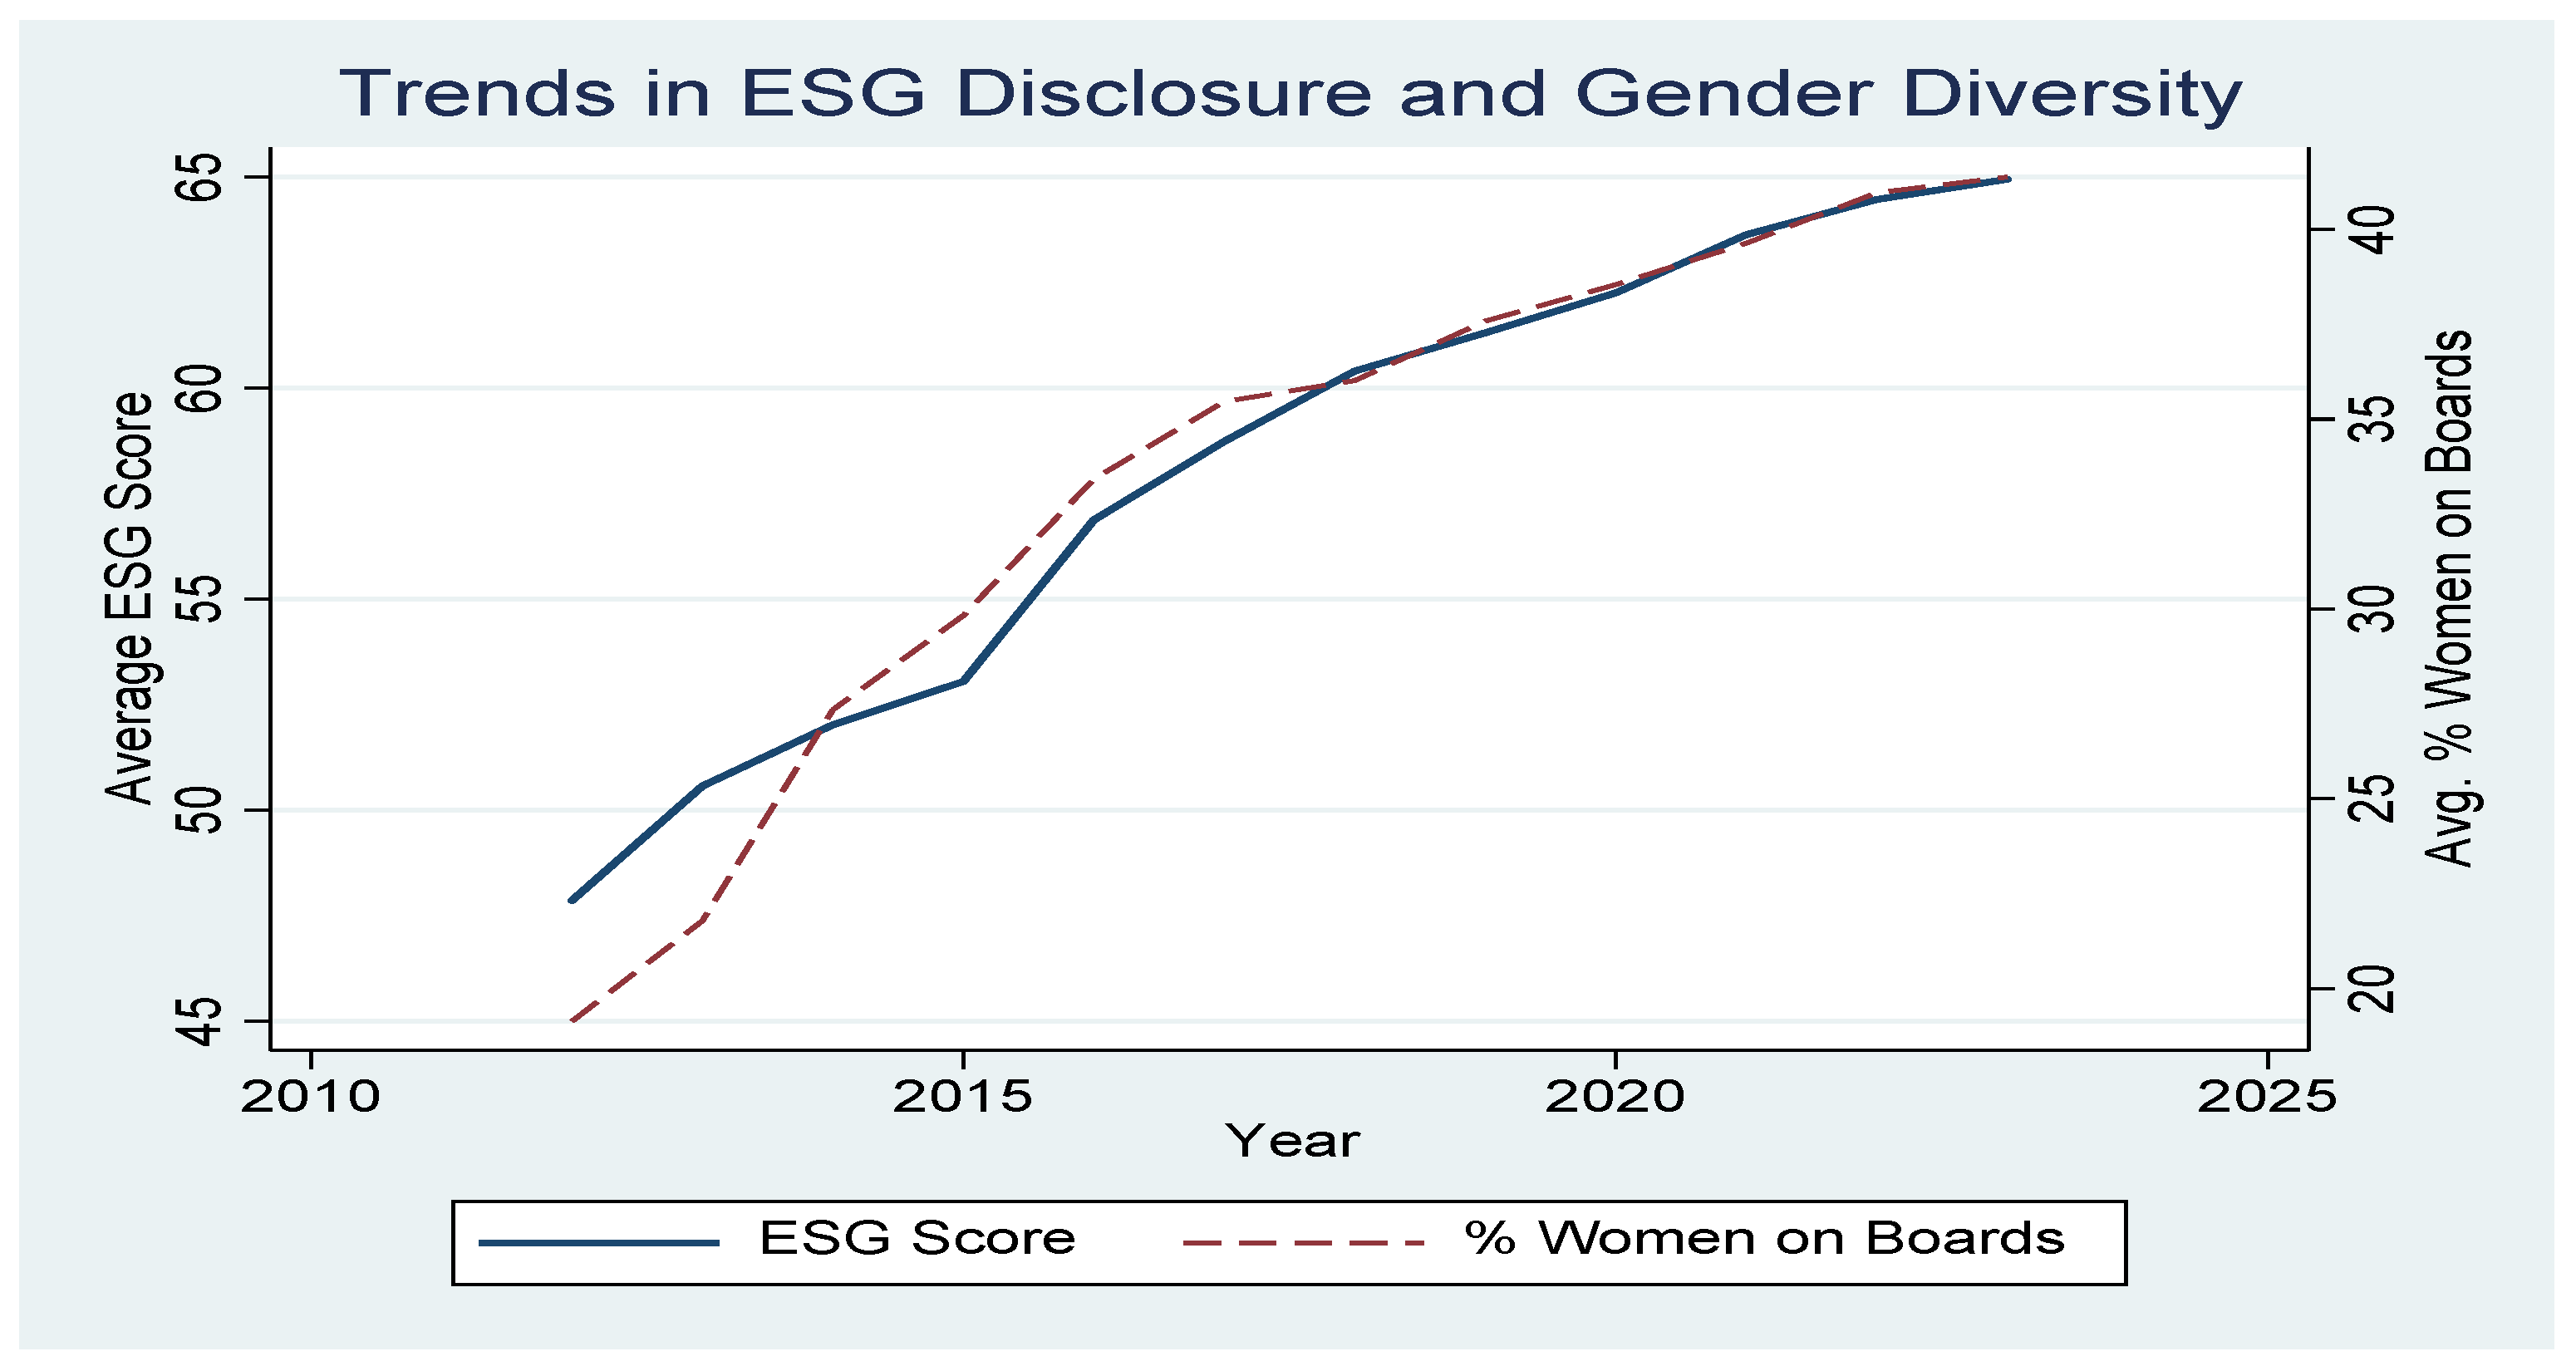
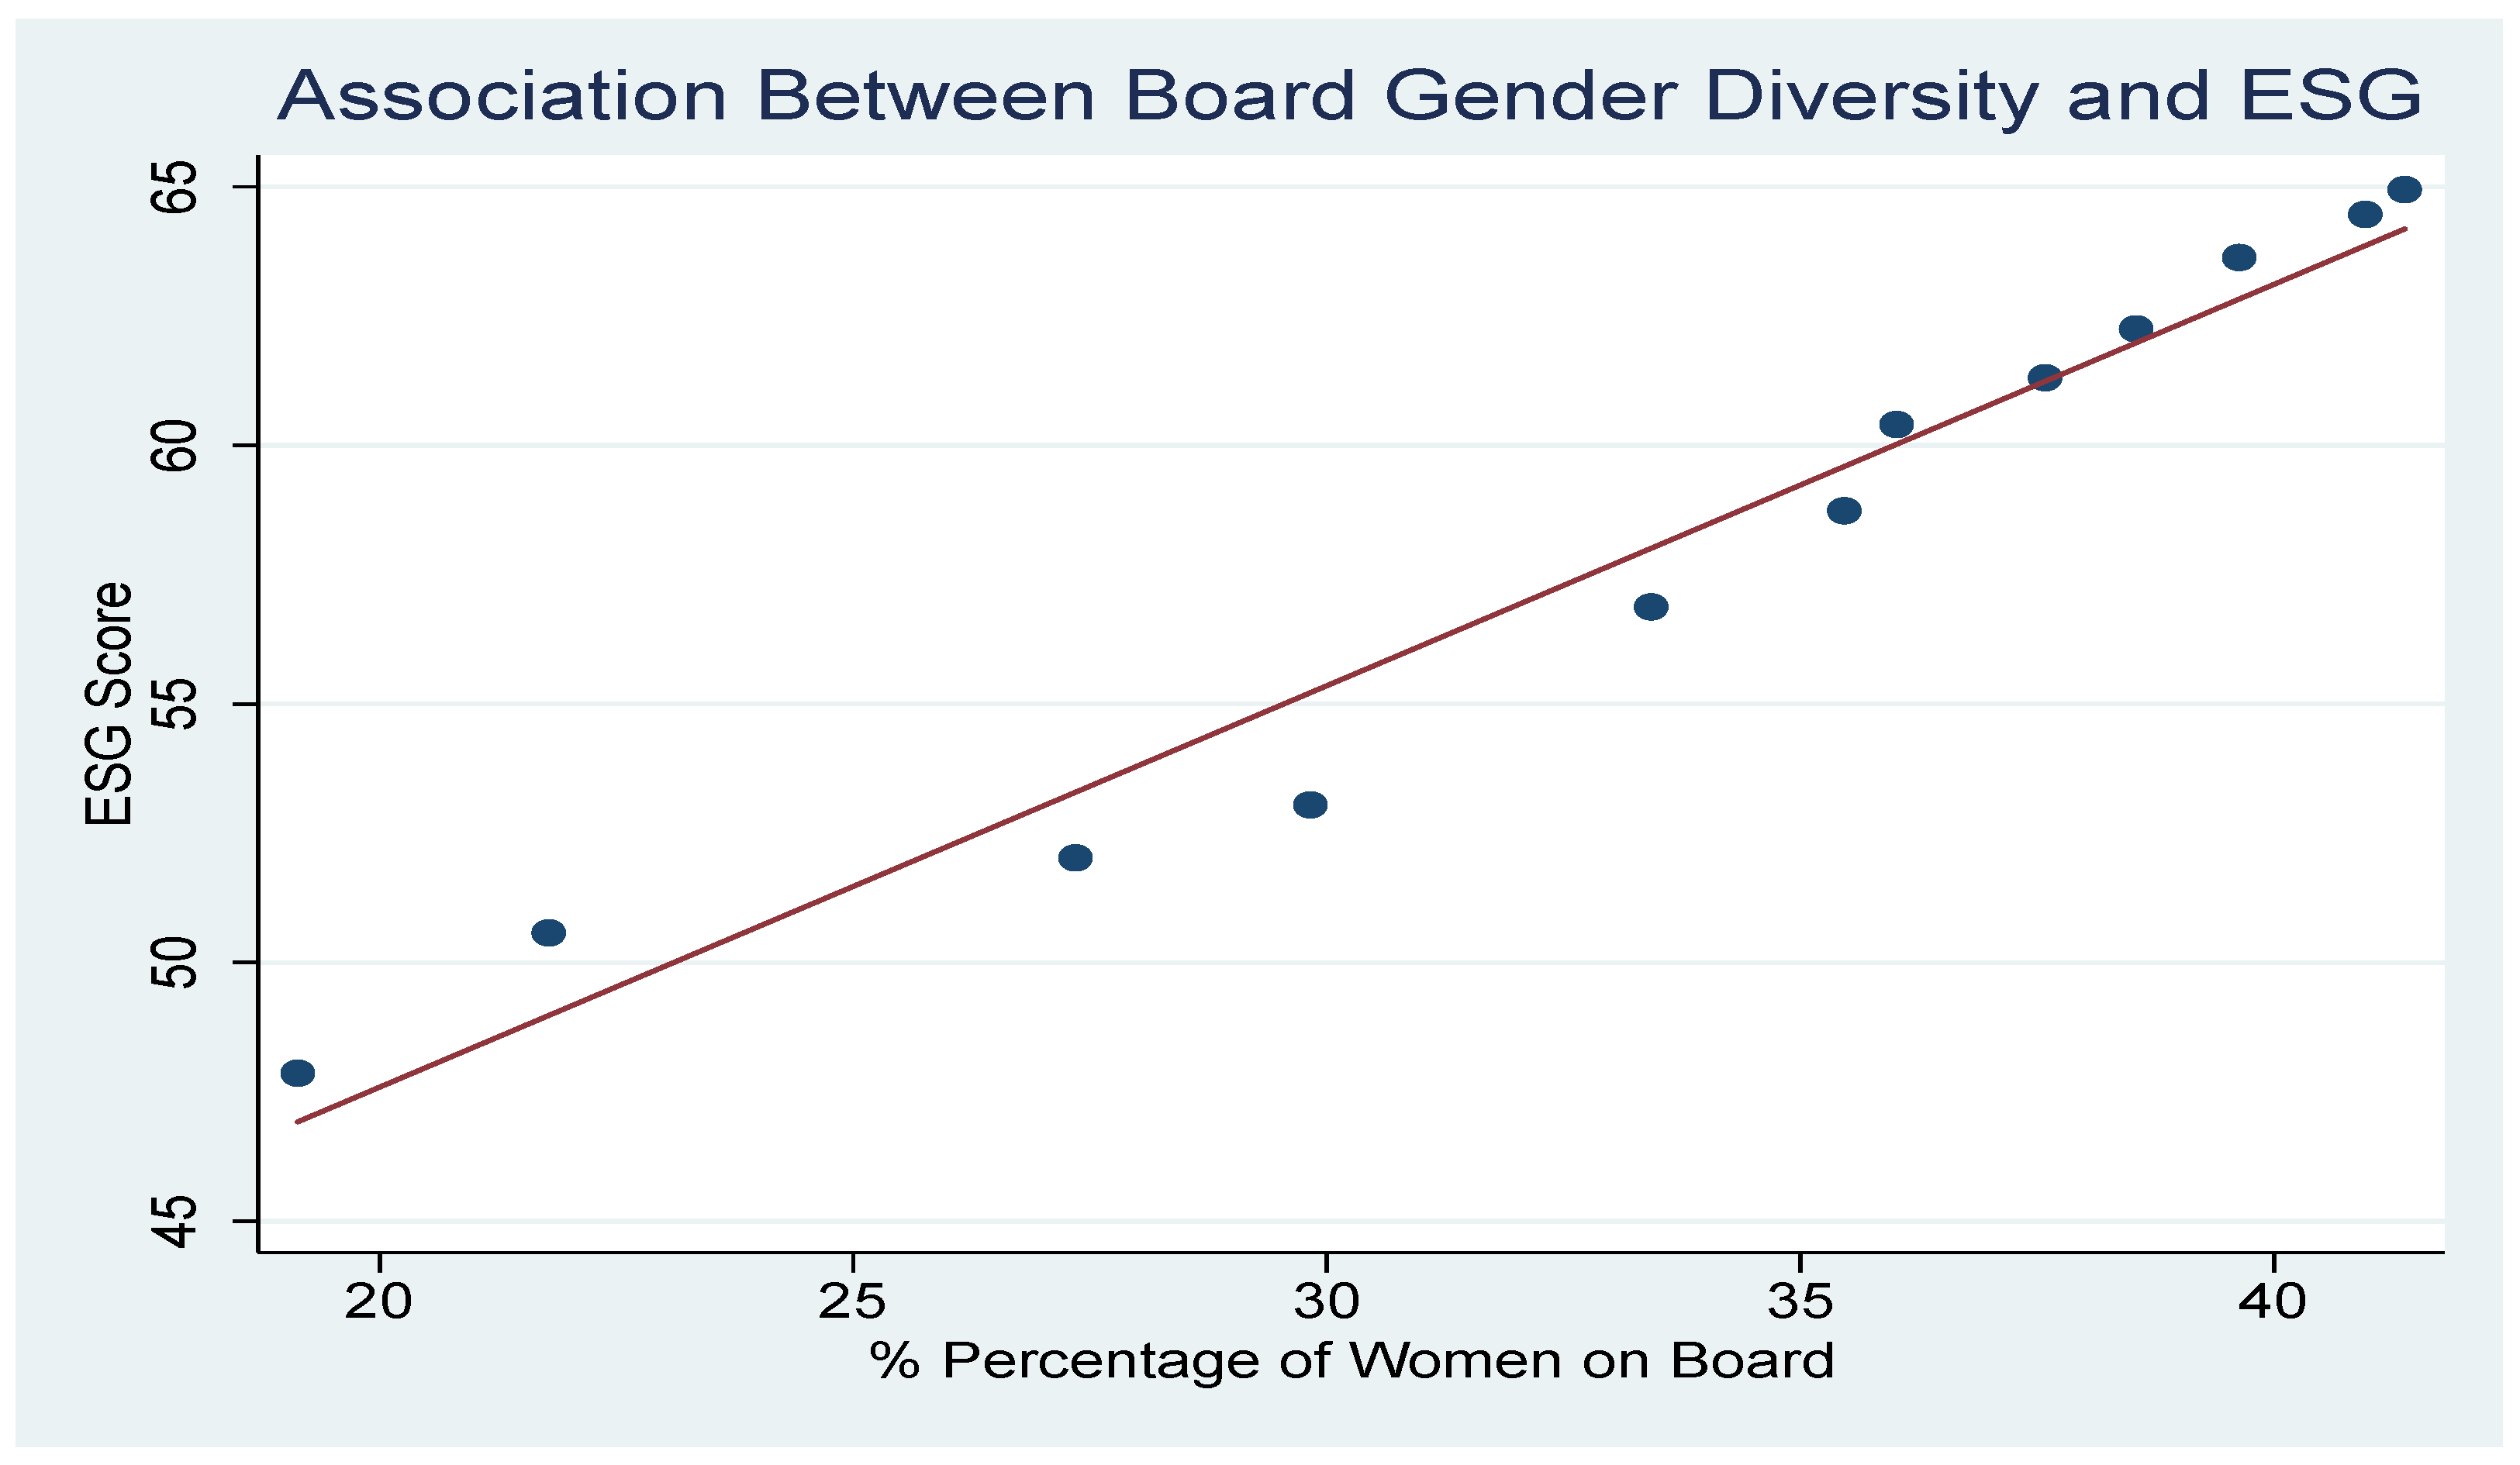
Table 3 presents the correlation coefficients between the variables employed in our empirical analysis. The findings indicate a positive and significant correlation between the ESG score and the critical mass variable. On the other hand, there is a negative correlation between the ESG score and the token variable. Moreover, both the Blau index and the Shannon index, which quantify board gender diversity, exhibit a positive and significant correlation with the ESG score. Additionally, the ESG score exhibits a positive and significant correlation with the frequency of board meetings and the size of the firm.
Although certain variables in the correlation matrix (Table 3) demonstrate moderate correlations, multicollinearity was additionally assessed by the variance inflation factor (VIF). Wooldridge (2012) indicates that multicollinearity becomes problematic when VIF levels are above 10. Table 4 illustrates that the VIF values in this research vary from 1.09 to 2.53, much below the threshold, signifying the absence of substantial multicollinearity concerns.

Graphical Analysis

Figure 1 shows the trends in average ESG scores and the proportion of women on corporate boards from 2012 to 2023. Both measures demonstrate a steadily rising trajectory, indicating a possible connection between gender diversity and ESG disclosure.
Figure 2 shows a scatter plot illustrating the positive relationship between board gender diversity and ESG disclosure. Every point signifies an average at the country’s level. The upward-sloping trend line reveals that greater percentages of women on corporate boards correlate with enhanced ESG disclosure scores, indicating a robust positive relationship between board gender diversity and sustainability reporting performance.

4.3. Regression on the Impact of Board Gender Diversity on ESG Score

The study employs a panel dataset of 45 firms to examine the impact of board gender diversity on the ESG disclosure score. Panel data analysis presents numerous benefits compared to cross-sectional and time-series methods, especially in generating reliable and efficient estimations (Baltagi, 2005). Table 5 presents the results examining the impact of board gender diversity (proxied by token representation and critical mass) on ESG disclosure score. Columns (1) and (2) present the findings from the pooled OLS regression, which assumes homogeneity across firms and offer a baseline estimate. Columns (3) and (4) show the results of the fixed effects (FE) model, which takes time-invariant firm-specific heterogeneity into account. The Hausman test was conducted to assess the validity of the fixed effects specification, which confirmed its suitability in comparison to the random effects model.
Furthermore, to mitigate potential endogeneity concerns, the IV-GMM estimation method was employed, using the lags of board gender diversity variables as instruments. Columns (5) and (6) display findings derived from the instrumental variable generalised method of moments (IV-GMM) approach. The problem of endogeneity has been extensively studied in the field of corporate governance (Wintoki et al., 2012). This is because the formation of a board is not a matter of external choice but an endogenously determined corporate decision. Organisations deliberately choose board characteristics to enhance decision-making and to maximise information flow, rendering the appointment of women on boards an endogenous process (Sila et al., 2016). Hansen’s over-identification test was conducted to verify the validity of the instruments, which confirmed that the instruments are uncorrelated with the error term and have been appropriately excluded from the estimated equation. The Cragg–Donald F-statistic confirmed the absence of weak instrument issues, while the Kleibergen–Paap rk LM statistic allowed for the rejection of the null hypothesis that the instruments are uncorrelated with the endogenous regressors, thereby confirming that the model is well-identified.
Hypothesis 1 posits that a critical mass of women on the board positively influences ESG disclosure score. The most notable observation in Table 5 is the consistent and statistically significant positive relationship between the critical mass variable and ESG scores, irrespective of the econometric technique employed. Hypothesis 2 predicts a negative relationship between token representation and ESG disclosure score. The findings suggest that the token variable consistently exhibits a negative coefficient, although its significance varies across the models. The negative relationship is statistically significant in both the pooled OLS and IV-GMM models, indicating that token representation of women on boards does not lead to improved ESG disclosure scores. The negative relationship can be analysed via the framework of tokenism theory (Kanter, 1977a). The insufficient representation of women in board seats frequently results in their representation as mere “tokens”, individuals who are symbolized but possess minimal influence due to their minority status (Yoder, 1991). Moreover, empirical evidence indicates that female directors are less likely than their male counterparts to receive informal mentorship concerning the expectations and standards of executive leadership. This gap can impede their effectiveness, reduce opportunities to serve on various boards, and ultimately undermine their capacity to influence meaningful change in ESG policies (McDonald & Westphal, 2013; Cook & Glass, 2018).
Furthermore, the findings resonate with the theoretical principles of Resource Dependence Theory and Stakeholder Theory, which assert that gender-diverse boards are more effective at representing a wider array of stakeholder interests (Wasiuzzaman & Subramaniam, 2023; Manita et al., 2018). An inclusive board composition enables organisations to leverage a diverse array of professional backgrounds, educational paths, and expertise, thereby improving the transparency and comprehensiveness of ESG disclosures (Shaukat et al., 2016). This conclusion is further corroborated by empirical studies conducted by Khemakhem et al. (2023), Menicucci and Paolucci (2024), and Yadav and Prashar (2022), all of which reveal a positive relationship between board gender diversity and sustainability practices. Evidence from Birindelli et al. (2018) indicates that in financial institutions, the relationship between sustainability performance and board composition is more significantly influenced by gender-balanced boards than by simply having a critical mass of female directors. However, evidence from Birindelli et al. (2018) suggests that within financial institutions, the sustainability performance of financial institutions is more strongly linked to gender-balanced boards rather than just the existence of a critical mass of female directors.
The regression results for the key control variables indicate that firm size consistently exhibits a positive and significant relationship with ESG scores across all regressions. This suggests that larger firms tend to outperform smaller firms regarding ESG disclosure scores, potentially due to their more excellent resources for managing ESG controversies and challenges (Li et al., 2018). Arhinful et al. (2024) contend that larger organisations possess greater access to resources and skills, enabling them to undertake more deliberate and significant investments in ESG efforts. This competitive edge can be attributed to specialised groups or divisions committed to sustainability initiatives, along with the financial resources to facilitate sustainable processes and guarantee adherence to regulatory standards.
The findings from our pooled OLS regression reveal a significant and positive relationship between board size and ESG scores, suggesting that firms with larger boards tend to demonstrate improved ESG performance. This finding aligns with the empirical evidence provided by Suttipun (2021), Khoiriawati and Nuswantara (2021), Bamahros et al. (2022), and Shu et al. (2024), who also report the positive impact of board size on improving ESG practices. Furthermore, our results correspond with the theoretical assertions of Resource Dependence Theory, which suggest that larger boards are more proficient at delivering essential resources, strengthening strategic oversight, and effective decision-making (Daily & Dalton, 1994). Additionally, our findings are supported by Stakeholder Theory, which asserts that a larger board composition yields a broader spectrum of expertise, enhanced stakeholder representation, and broadens external connections, thereby strengthening sustainability practices (Hillman et al., 2000). However, our result contradicts the findings of Birindelli et al. (2018), Alareeni and Hamdan (2020), and Arhinful et al. (2024), who argue that the performance of ESG may not always be enhanced by larger boards, potentially due to challenges with coordination, increased agency expenses, or decision-making dynamics.
Our findings indicate a significant negative relationship between CEO duality and ESG scores in the fixed effects model. This corroborates the assertions of Husted and de Sousa-Filho (2019) and Khoiriawati and Nuswantara (2021), who argue that concentrating power in a single individual can weaken accountability, reduce oversight, and diminish the strategic focus on ESG factors. The dual role of the CEO as board chair may compromise governance structures that enforce stringent ESG management and reporting standards, thereby hindering transparency and sustainability initiatives. However, our results in column 6 suggest a statistically significant and positive relationship between the CEO duality and ESG disclosure score when endogeneity is accounted for. In addition, the percentage of independent board members had a significant positive effect on ESG disclosure scores in both the OLS and IV-GMM estimations. This finding is consistent with previous studies conducted by Harjoto and Wang (2020) and Arhinful et al. (2024), reinforcing the notion that independent directors are essential in determining ESG outcomes. Their presence on corporate boards improves corporate governance by fostering transparency and accountability in sustainability reporting. However, contrary to our results, studies by Birindelli et al. (2018) and Shu et al. (2024) have reported a negative association between board independence and ESG score, suggesting that the influence of independent directors on ESG may vary across different contexts and governance structures. Regarding country-level variables, the result revealed a positive and significant relationship between GDP and ESG disclosure score. Generally, a higher GDP denotes economic expansion, which raises business profits and earnings. The return of the ESG indices rose due to improved performance, which translated into better values. Moreover, robust economic growth implies greater purchasing power for investors, boosting investment demand, including those based on ESG criteria (Bit & Pasaribu, 2024).

4.4. Robustness Checks

Our primary sample comprises 45 firms listed in the EURO STOXX 50 Index. To validate the reliability of our empirical findings and ensure that the relationship between board gender diversity and disclosure score is not influenced by the characteristics of a specific index or country, we conduct robustness tests. As part of this process, we first adopt alternative measures of board gender diversity, specifically the Blau and Shannon indices, within the EURO STOXX 50 framework, allowing for a more comprehensive evaluation of gender diversity’s impact on ESG disclosure score. These alternate diversity measures evaluate our results’ sensitivity to the selected measurement methodology. Second, we examine a cross-industry comparison of gender diversity and ESG disclosure. Third, we reevaluate our econometric model utilising an alternative market sample by concentrating on companies listed in the UK FTSE 100 from 2012 to 2023. This enables us to evaluate the consistency of our findings across various institutional contexts and governance structures. Finally, we applied a different analytical method to enhance the validation of our findings. The results across all robustness check consistently align with the main findings outlined in Table 5.

4.4.1. Alternative Board Gender Diversity Measures

In this section, we perform robustness checks to ensure the consistency of our results by utilising alternative variables of gender diversity, specifically the Blau index and the Shannon index, to confirm the reliability of our findings. To address potential endogeneity concerns, we estimate IV 2SLS models alongside fixed effects models. In the IV 2SLS specifications, the Blau index is instrumented with the industry-level average Blau index, whereas the Shannon index is instrumented with the industry-level average Shannon index. The Durbin–Wu–Hausman tests presented in Table 6 indicate the existence of endogeneity in both models, thereby justifying the application of instrumental variable estimation. The results from the first-stage regression indicate a robust relevance of the instruments, evidenced by F statistics of 56.86 for the Blau model and 59.98 for the Shannon model, both surpassing the critical thresholds established by Stock and Yogo (2005). The diagnostics indicate that the instruments are valid and relevant, thereby enhancing the strength of our primary findings.

4.4.2. Cross-Industry Comparison of Gender Diversity and ESG Disclosure

The regression analysis in Table 7 presents the empirical results across different industries, examining whether the impact of board gender diversity on corporate ESG performance varies by industry. To explore this, the study categorises firms into consumer discretionary, consumer staples, energy, financial, healthcare, industrial, information technology, and utilities and conducts fixed-effects regressions for each industry separately. The results indicate that the percentage of women on corporate boards significantly impacts ESG disclosure scores across all industries except for the utilities sector, where the coefficient is positive but not statistically significant. This suggests that increasing female representation on boards generally enhances ESG performance, though the effect varies in magnitude across industries. By comparing the coefficients for board gender diversity, the findings reveal that the impact is strongest in the healthcare industry, while the utilities sector exhibits the lowest coefficient.

4.4.3. Alternative Sample (UK FSTE 100)

The econometric model was re-estimated, concentrating on UK FTSE 100 firms from 2012 to 2023. We employed a fixed-effects regression model alongside the two-stage least squares (2SLS) instrumental variables method to mitigate endogeneity issues and ensure robust analysis. Implementing the 2SLS method necessitates the identification of an exogenous instrument that demonstrates a robust correlation with the explanatory variables yet exerts no direct influence on the outcome variable. Following Muhammad and Migliori (2023), we selected the industry-wide average of board gender diversity as our exogenous instrument. This decision was influenced by its capacity to affect a company’s diversity-related choices, while it is not expected to have a direct impact on the company’s ESG disclosure score.
We employed the Durbin–Wu–Hausman test to evaluate any endogeneity concerns within our model. The results of the test (F-statistic, p < 0.01) for both models validate the presence of endogeneity, requiring the implementation of instrumental variables (IVs) to mitigate this issue in the OLS regression. The null hypothesis of the Durbin–Wu–Hausman test posits that the variable in question is exogenous. Considering the high significance of both test statistics, we reject the null hypothesis and conclude that the board gender diversity variables (Blau index and Shannon index) must be regarded as endogenous. Given that the Pagan–Hall test is statistically significant, we can confidently dismiss heteroskedasticity concerns (Pagan & Hall, 1983). Moreover, the Cragg–Donald Wald F-statistic (Cragg & Donald, 1993) verifies that our model is not undermined by weak instrumental variables, hence enhancing the credibility of our IV methodology. The results in Table 8 indicate a positive and significant relationship between ESG disclosure scores and board gender diversity, hence corroborating our earlier findings.

4.4.4. Inverse Probability Weighting (IPW) Regression

Inverse probability weighting (IPW) is a treatment effect analysis method similar to propensity score matching (PSM) (Rosenbaum & Rubin, 1983). It is commonly employed to mitigate bias and the adjustment of unequal sampling fractions in survey research (Liu & Fan, 2023). We employ the IPW model because it estimates treatment effects in observational research by adjusting weights by propensity scores (Imbens & Wooldridge, 2009). IPW is a two-step process. First, it estimates propensity scores using a logistic regression model. Then, it calculates inverse probability weights for each firm based on their propensity score. These weights are applied to compute weighted averages of the outcomes (ESG disclosure scores) for treated and control firms, providing the average treatment effect on the treated (ATET). Unlike matching methods, which can lead to losing a significant portion of the data (significantly when the control group is shrunk to match the treatment group), IPW preserves the entire sample. This avoids the problem of data loss while still achieving a balance between treated and control groups. Here, we employ the treatment group as firms with female CEOs and the control group as firms without female CEOs or its equivalent.
Table 9 presents the results of our IPW using the propensity score analysis. The outcome variable is the ESG disclosure score. The average treatment effect on the treated (ATET) ESG score is 2.752011. This coefficient indicates that firms with female CEOs have an ESG disclosure score of 2.752 points higher than firms without female CEOs. The probability value is statistically significant, indicating that female CEO is significantly associated with ESG disclosure scores. Further, the coefficient of potential-outcome means (POmean) suggests that the average ESG disclosure score of firms that do not have female CEOs is 53.68. This indicates that the ESG score for firms with female CEOs is 5.12% (ATET/means* 100) higher than those without female CEOs.
Table 10 presents a summary of the robustness checks, detailing the methodologies employed and the consistency of the findings.

5. Conclusions

This study examines the relationship between board gender diversity and ESG disclosure scores, focusing on European publicly listed firms from 2012 to 2023. Employing the instrumental variables-generalised method of moments (IV-GMM) methodology, widely acknowledged for its capacity to minimise bias, inefficiency, and inconsistency in panel data estimation, we show robust empirical evidence that contests existing assumptions. Our findings indicate that firms with a minimum of three female directors demonstrate a greater commitment to ESG disclosure. In contrast, token representation (i.e., the existence of one or two female directors) has a significant and negative impact on ESG disclosure scores. The findings are consistent with previous research (Khemakhem et al., 2023; Menicucci & Paolucci, 2024; Yadav & Prashar, 2022), which lends credence to the argument that substantial gender diversity improves board decision-making and promotes better ESG practices.
This study makes a substantial contribution to the existing literature. First, it offers valuable perspectives on the impact of female representation on a firm’s ESG disclosure score. The finding that appointing three or more female directors enhances sustainability practices suggests that the effectiveness of women’s representation on corporate boards and its influence on ESG performance depends on reaching a critical mass. Therefore, policymakers should ensure a minimum of three women on a board to achieve a meaningful impact. This result lends credence to critical mass theory while challenging the validity of tokenism theory. Second, we employed a rigorous methodological framework to mitigate any endogeneity, leading to more reliable causal results. Conventional estimate methods like ordinary least squares (OLS) sometimes do not address endogeneity, which can arise from omitted variable bias, measurement error, or reverse causality. To address these issues, we use the instrumental variables-generalised method of moments (IV-GMM) established by Baum et al. (2003), which yields consistent estimates despite heteroskedasticity and autocorrelation in panel data. Third, this paper adopts a multi-theoretical framework to examine the relationship between board gender diversity and ESG disclosure score, acknowledging that different perspectives shape corporate governance discourse. It also examines the dynamics of board gender diversity within the European context. More importantly, the study considers the conditions that allow female directors to evolve from mere symbolic characters to proactive agents of change in corporate sustainability initiatives.
From a theoretical perspective, our research supports the principles of stakeholder theory and resource dependence theory, arguing that gender-diverse boards improve the quality of decision-making by integrating a variety of perspectives and skillsets, which, in turn, strengthen the implementation of ESG strategies. In addition, the findings have significant implications for critical mass theory, which proposes that the presence of three or more female directors promotes strategic oversight and effective governance. Conversely, token representation, typically a symbolic or compliance-oriented strategy, fails to yield major improvements in ESG performance. This emphasises the necessity of advancing from simple numerical representation to achieving substantial gender inclusion in corporate governance. The practical implications of our findings are significant for policymakers, company executives, and regulatory authorities who are striving to improve ESG compliance. Given the increasing scrutiny from investors regarding ESG disclosures, our findings indicate that businesses committed to genuine sustainability objectives must ensure their boards of directors include more than a token representation of women. Therefore, policymakers should consider mandating a minimum of three female directors rather than exclusively concentrating on broad quotas. Furthermore, the promotion of female executives to senior positions, including CEO responsibilities, has the potential to further boost ESG transparency policies and corporate sustainability programs. Regulators should establish policies that foster substantial gender diversity while also ensuring that firms integrate ESG priorities into their fundamental governance structures.
Specifically, focused recruitment, systematic succession planning, and periodic diversity evaluations can assist organisations in cultivating and maintaining inclusive leadership. Moreover, board training and development initiatives that prioritise participatory governance, insights into ESG-related risk and opportunities, and the strategic importance of diversity may guarantee that all members, both new and incumbent, are adequately prepared to contribute effectively. Collectively, these approaches can enhance ESG performance beyond mere compliance with legal obligations and increase board effectiveness.

Study Limitations

Despite its robust empirical approach, the paper acknowledges significant limitations that call for additional research. First, our research primarily focuses on developed European economies, with the analysis relying on firms listed in the EURO STOXX and FTSE 100 for robustness check. Consequently, the findings may not be universally applicable to other developed regions. It is possible that the ways in which female board membership affects ESG scores are influenced by differences in institutional frameworks, cultural norms, legal contexts, and corporate governance procedures. This geographic concentration indicates a limitation and highlights the need for future research to explore similar relationships in other developed market contexts. Second, analysis depends on archive data, which, although robust in empirical rigour, fail to adequately encapsulate the intricacies of boardroom dynamics. Future research should combine qualitative approaches, including surveys, interviews, and focus groups, to offer deeper insights into the relationship between gender diversity and ESG performance. Third, we recognise that the analysis has limitations, notably the exclusion of some variables such as ownership concentration and industry competition. The results might be more robust if specific governance measures were incorporated, subject to the availability of data. Moreover, we acknowledge that ESG disclosure is influenced by a variety of factors beyond the composition of the board, including political frameworks, ownership structure, the quality of governance, and media coverage in emerging markets. Future research should incorporate these variables to gain a more comprehensive understanding of the factors that influence ESG performance in developing economies.
This research is constrained by various methodological limitations. The ESG disclosure score data were sourced from Bloomberg. While this is a well-regarded database for data collection, it is important to note that there may be variations in coverage and reporting standards across various companies and over time. The presence of these inconsistencies may impact the ability to compare ESG scores effectively. Moreover, while the GMM method mitigates potential endogeneity and unobserved heterogeneity, residual confounding may persist due to omitted variables or measurement errors.

Author Contributions

Conceptualization, C.M.O., M.A. and D.N.K.; methodology, C.M.O., M.A. and D.N.K.; software, C.M.O., M.A. and D.N.K.; validation, C.M.O., M.A. and D.N.K.; investigation, C.M.O., M.A. and D.N.K.; resources, C.M.O., M.A. and D.N.K.; data curation, C.M.O., M.A. and D.N.K.; writing—original draft preparation, C.M.O., M.A. and D.N.K.; writing—review and editing, C.M.O., M.A. and D.N.K.; visualization, C.M.O., M.A. and D.N.K.; supervision, C.M.O., M.A. and D.N.K.; project administration, C.M.O., M.A. and D.N.K.; All authors have read and agreed to the published version of the manuscript.

Funding

This research received no external funding.

Institutional Review Board Statement

Not applicable.

Informed Consent Statement

Not applicable.

Data Availability Statement

Data are contained within the article.

Conflicts of Interest

The authors declare no conflict of interest.

References

  1. Abdelkader, M. G., Gao, Y., & Elamer, A. A. (2024). Board gender diversity and ESG performance: The mediating role of temporal orientation in South Africa context. Journal of Cleaner Production, 440, 140728. [Google Scholar] [CrossRef]
  2. Alareeni, B. A., & Hamdan, A. (2020). ESG impact on performance of US S&P 500-listed firms. Corporate Governance: The International Journal of Business in Society, 20(7), 1409–1428. [Google Scholar] [CrossRef]
  3. Alazzani, A., Hassanein, A., & Aljanadi, Y. (2017). Impact of gender diversity on social and environmental performance: Evidence from Malaysia. Corporate Governance: The International Journal of Business in Society, 17(2), 266–283. [Google Scholar] [CrossRef]
  4. Albitar, K., Abdoush, T., & Hussainey, K. (2023). Do corporate governance mechanisms and ESG disclosure drive CSR narrative tones? International Journal of Finance & Economics, 28(4), 3876–3890. [Google Scholar] [CrossRef]
  5. Amin, A., Rehman, R. U., Ali, R., & Ntim, C. G. (2022). Does gender diversity on the board reduce agency costs? Evidence from Pakistan. Gender in Management an International Journal, 37(2), 164–181. [Google Scholar] [CrossRef]
  6. Amorelli, M., & García-Sánchez, I. (2021). Trends in the dynamic evolution of board gender diversity and corporate social responsibility. Corporate Social Responsibility and Environmental Management, 28(2), 537–554. [Google Scholar] [CrossRef]
  7. Arayssi, M., Dah, M., & Jizi, M. (2016). Women on boards, sustainability reporting, and firm performance. Sustainability Accounting Management and Policy Journal, 7(3), 376–401. [Google Scholar] [CrossRef]
  8. Arhinful, R., Mensah, L., & Owusu-Sarfo, J. S. (2024). Board governance and ESG performance in Tokyo stock exchange-listed automobile companies: An empirical analysis. Asia Pacific Management Review, 29(4), 397–414. [Google Scholar] [CrossRef]
  9. Atif, M., Alam, M. S., & Hossain, M. (2020). Firm sustainable investment: Are female directors greener? Business Strategy and the Environment, 29(8), 3449–3469. [Google Scholar] [CrossRef]
  10. Baldini, M., Maso, L. D., Liberatore, G., Mazzi, F., & Terzani, S. (2018). Role of country-and firm-level determinants in environmental, social, and governance disclosure. Journal of Business Ethics, 150(1), 79–98. [Google Scholar] [CrossRef]
  11. Baltagi, B. H. (2005). Econometric analysis of panel data (3rd ed.). John Wiley & Sons Inc. [Google Scholar]
  12. Bamahros, H. M., Alquhaif, A., Qasem, A., Wan-Hussin, W. N., Thomran, M., Al-Duais, S. D., Shukeri, S. N., & Khojally, H. M. A. (2022). Corporate governance mechanisms and ESG reporting: Evidence from the Saudi Stock Market. Sustainability, 14(10), 6202. [Google Scholar] [CrossRef]
  13. Bart, C., & McQueen, G. (2013). Why women make better directors. International Journal of Business Governance and Ethics, 8(1), 93. [Google Scholar] [CrossRef]
  14. Baum, C. F., Schaffer, M. E., & Stillman, S. (2003). Instrumental Variables and GMM: Estimation and testing. The Stata Journal Promoting Communications on Statistics and Stata, 3(1), 1–31. [Google Scholar] [CrossRef]
  15. Beji, R., Yousfi, O., Loukil, N., & Omri, A. (2021). Board diversity and corporate social responsibility: Empirical evidence from France. Journal of Business Ethics, 173, 133–155. [Google Scholar] [CrossRef]
  16. Benjamin, S. J., & Biswas, P. (2019). Board gender composition, dividend policy and COD: The implications of CEO duality. Accounting Research Journal, 32(3), 454–476. [Google Scholar] [CrossRef]
  17. Benson, J. K., Pfeffer, J., & Salancik, G. R. (1978). The external control of organizations. Administrative Science Quarterly, 23(2), 358. [Google Scholar] [CrossRef]
  18. Bhatia, S., & Marwaha, D. (2022). The influence of board factors and gender diversity on the ESG disclosure Score: A study on Indian companies. Global Business Review, 23(6), 1544–1557. [Google Scholar] [CrossRef]
  19. Birindelli, G., Dell’Atti, S., Iannuzzi, A. P., & Savioli, M. (2018). Composition and activity of the Board of Directors: Impact on ESG performance in the banking system. Sustainability, 10(12), 4699. [Google Scholar] [CrossRef]
  20. Bit, N. E. a. A., & Pasaribu, P. (2024). The Relationship between macroeconomic variables and ESG index: Evidence from six emerging markets. Quantitative Economics and Management Studies, 5(6), 1218–1226. [Google Scholar] [CrossRef]
  21. Brahma, S., Nwafor, C., & Boateng, A. (2021). Board gender diversity and firm performance: The UK evidence. International Journal of Finance & Economics, 26(4), 5704–5719. [Google Scholar] [CrossRef]
  22. Chen, J. C., & Roberts, R. W. (2010). Toward a more coherent understanding of the organization–society relationship: A theoretical consideration for social and environmental accounting research. Journal of Business Ethics, 97(4), 651–665. [Google Scholar] [CrossRef]
  23. Cook, A., & Glass, C. (2018). Women on corporate boards: Do they advance corporate social responsibility? Human Relations, 71(7), 897–924. [Google Scholar] [CrossRef]
  24. Cragg, J. G., & Donald, S. G. (1993). Testing identifiability and specification in instrumental variable models. Econometric Theory, 9(2), 222–240. Available online: http://www.jstor.org/stable/3532477 (accessed on 5 February 2025). [CrossRef]
  25. Cucari, N., De Falco, S. E., & Orlando, B. (2018). Diversity of board of directors and environmental social governance: Evidence from Italian listed companies. Corporate Social Responsibility and Environmental Management, 25(3), 250–266. [Google Scholar] [CrossRef]
  26. Daily, C. M., & Dalton, D. R. (1994). Bankruptcy and corporate governance: The impact of board composition and structure. Academy of Management Journal, 37(6), 1603–1617. [Google Scholar] [CrossRef]
  27. De Vasconcelos, I. F. F. G., Alves, M. A., & Pesqueux, Y. (2012). Responsabilidade social corporativa e desenvolvimento sustentável: Olhares habermasianos. Revista De Administração De Empresas, 52(2), 148–152. [Google Scholar] [CrossRef]
  28. Eissa, A. M., Hamdy, A., & Diab, A. (2024). Governmental Ownership, board gender diversity, and ESG performance: Evidence from an emerging market. Sustainability, 16(16), 6963. [Google Scholar] [CrossRef]
  29. European Parliament. (2020). Corporate social responsibility (CSR) and its implementation into EU company law. Policy Department for Citizens’ Rights and Constitutional Affairs, Directorate General for Internal Policies. Available online: https://www.europarl.europa.eu/RegData/etudes/STUD/2020/658541/IPOL_STU(2020)658541_EN.pdf (accessed on 5 February 2025).
  30. Freeman, R. E. (1984). Strategic management: A stakeholder approach. Pitman Publishing. [Google Scholar]
  31. Freeman, R. E., Dmytriyev, S. D., & Phillips, R. A. (2021). Stakeholder theory and the resource-based view of the firm. Journal of Management, 47(7), 1757–1770. [Google Scholar] [CrossRef]
  32. Giannarakis, G. (2014). Corporate governance and financial characteristics affect the extent of corporate social responsibility disclosure. Social Responsibility Journal, 10(4), 569–590. [Google Scholar] [CrossRef]
  33. Gul, F. A., Srinidhi, B., & Ng, A. C. (2011). Does board gender diversity improve the informativeness of stock prices? Journal of Accounting and Economics, 51(3), 314–338. [Google Scholar] [CrossRef]
  34. Harjoto, M. A., & Wang, Y. (2020). Board of Directors network centrality and environmental, social, and governance (ESG) performance. Corporate Governance, 20(6), 965–985. [Google Scholar] [CrossRef]
  35. Hillman, A. J., Cannella, A. A., & Paetzold, R. L. (2000). The resource dependence role of corporate directors: Strategic adaptation of board composition in response to environmental change. Journal of Management Studies, 37(2), 235–256. [Google Scholar] [CrossRef]
  36. Hillman, A. J., Withers, M. C., & Collins, B. J. (2009). Resource dependence theory: A review. Journal of Management, 35(6), 1404–1427. [Google Scholar] [CrossRef]
  37. Hsiao, C. (2005). Why panel data? The Singapore Economic Review, 50(02), 143–154. [Google Scholar] [CrossRef]
  38. Hsiao, C., Pesaran, M. H., & Tahmiscioglu, A. K. (2002). Maximum likelihood estimation of fixed effects dynamic panel data models covering short time periods. Journal of Econometrics, 109(1), 107–150. [Google Scholar] [CrossRef]
  39. Husted, B. W., & de Sousa-Filho, J. M. (2019). Board structure and environmental, social, and governance disclosure in Latin America. Journal of Business Research, 102, 220–227. [Google Scholar] [CrossRef]
  40. Imbens, G., & Wooldridge, J. (2009). Recent developments in the econometrics of program evaluation. Journal of Economic Literature, 47(1), 5–86. [Google Scholar] [CrossRef]
  41. Issa, A., & Hanaysha, J. R. (2023). Breaking the glass ceiling for a sustainable future: The power of women on corporate boards in reducing ESG controversies. International Journal of Accounting and Information Management, 31(4), 623–646. [Google Scholar] [CrossRef]
  42. Issa, A., & Zaid, M. A. (2021). Boardroom gender diversity and corporate environmental performance: A multi-theoretical perspective in the MENA region. International Journal of Accounting & Information Management, 29(4), 603–630. [Google Scholar] [CrossRef]
  43. Jia, M., & Zhang, Z. (2012). Critical mass of women on BODs, multiple identities, and corporate philanthropic disaster response: Evidence from privately owned chinese firms. Journal of Business Ethics, 118(2), 303–317. [Google Scholar] [CrossRef]
  44. Jizi, M. I., Salama, A., Dixon, R., & Stratling, R. (2014). Corporate governance and corporate social responsibility disclosure: Evidence from the US banking sector. Journal of Business Ethics, 125(4), 601–615. [Google Scholar] [CrossRef]
  45. Kanter, R. (1977a). Men and women of the corporation. Basic Books. [Google Scholar]
  46. Kanter, R. M. (1977b). Some effects of proportions on group life: Skewed sex ratios and responses to token women. American Journal of Sociology, 82(5), 965–990. [Google Scholar] [CrossRef]
  47. Khemakhem, H., Arroyo, P., & Montecinos, J. (2023). Gender diversity on board committees and ESG disclosure: Evidence from Canada. Journal of Management & Governance, 27(4), 1397–1422. [Google Scholar] [CrossRef]
  48. Khoiriawati, N., & Nuswantara, D. A. (2021). Board characteristics and disclosure of environmental, social, and governance (ESG) Matters: Evidence from Asean countries. Review of business. Accounting, & Finance, 1(4), 374–391. [Google Scholar]
  49. Konrad, A. M., Kramer, V., & Erkut, S. (2008). Critical mass: The impact of three or more women on corporate boards. Organizational Dynamics, 37(2), 145–164. [Google Scholar] [CrossRef]
  50. Kulich, C., Ryan, M. K., & Haslam, S. A. (2007). Where is the romance for women leaders? The effects of gender on leadership attributions and performance-based pay. Applied Psychology, 56(4), 582–601. [Google Scholar] [CrossRef]
  51. Kurebwa, J., & Ndlovu, S. (2017). The critical mass theory and quota systems debate. International Journal of Advanced Research and Publications, 1(1), 48–55. Available online: http://www.ijarp.org/online-papers-publishing/july2017.html (accessed on 1 February 2025).
  52. Kyaw, K., Olugbode, M., & Petracci, B. (2017). Can board gender diversity promote corporate social performance? Corporate Governance, 17(5), 789–802. [Google Scholar] [CrossRef]
  53. Lan, L. L., & Heracleous, L. (2010). Rethinking agency theory: The view from law. Academy of Management Review, 35(2), 294–314. [Google Scholar] [CrossRef]
  54. Lee, P. M., & James, E. H. (2007). She’-e-os: Gender effects and investor reactions to the announcements of top executive appointments. Strategic Management Journal, 28(3), 227–241. [Google Scholar] [CrossRef]
  55. Lewellyn, K., & Muller-Kahle, M. (2023). ESG leaders or laggards? A configurational analysis of ESG performance. Business & Society, 63(5), 1149–1202. [Google Scholar] [CrossRef]
  56. Li, Y., Gong, M., Zhang, X., & Koh, L. (2018). The impact of environmental, social, and governance disclosure on firm value: The role of CEO power. The British Accounting Review, 50(1), 60–75. [Google Scholar] [CrossRef]
  57. Liu, Y., & Fan, Y. (2023). Biased-sample empirical likelihood weighting for missing data problems: An alternative to inverse probability weighting. Journal of the Royal Statistical Society Series B: Statistical Methodology, 85(1), 67–83. [Google Scholar] [CrossRef]
  58. Liu, Y., Wei, Z. B., & Xie, F. X. (2014). Do women directors improve firm performance in China? Journal of Corporate Finance, 28, 169–184. [Google Scholar] [CrossRef]
  59. Longo, M., Mura, M., & Bonoli, A. (2005). Corporate social responsibility and corporate performance: The case of Italian SMEs. Corporate Governance, 5(4), 28–42. [Google Scholar] [CrossRef]
  60. Ma, Y., Ahmad, M. I., & Torelli, R. (2024). Board gender diversity and ESG disclosure: The moderating role of audit committee. Corporate Social Responsibility and Environmental Management, 31(6), 5971–5983. [Google Scholar] [CrossRef]
  61. Mack, C., Koschnick, C., Brown, M., Ritschel, J. D., & Lucas, B. (2024). A panel data regression model for defense merger and acquisition activity. Journal of Defense Analytics and Logistics, 6(2), 122–142. [Google Scholar] [CrossRef]
  62. Manita, R., Bruna, M. G., Dang, R., & Houanti, L. (2018). Board gender diversity and ESG disclosure: Evidence from the USA. Journal of Applied Accounting Research, 19(2), 206–224. [Google Scholar] [CrossRef]
  63. McDonald, M. L., & Westphal, J. D. (2013). Access denied: Low mentoring of women and minority first-time directors and its negative effects on appointments to additional boards. Academy of Management Journal, 56(4), 1169–1198. [Google Scholar] [CrossRef]
  64. Mehmood, A., Hajdini, J., Iaia, L., De Luca, F., & Sakka, G. (2023). Stakeholder engagement and SDGs: The role of social media in the European context. EuroMed Journal of Business, 18(1), 111–128. [Google Scholar] [CrossRef]
  65. Menicucci, E., & Paolucci, G. (2024). Board gender equality and ESG performance. Evidence from European banking sector. Corporate Governance, 24(8), 147–174. [Google Scholar] [CrossRef]
  66. Muhammad, H., & Migliori, S. (2023). Effects of board gender diversity and sustainability committees on environmental performance: A quantile regression approach. Journal of Management & Organization, 29(6), 1051–1076. [Google Scholar] [CrossRef]
  67. Muoneke, O. B., Okere, K. I., & Egbo, O. P. (2023). Does political conflict tilt finance-renewable energy dynamics in Africa? Accounting for the multi-dimensional approach to financial development and threshold effect of political conflict. Heliyon, 9(3), e14155. [Google Scholar] [CrossRef] [PubMed]
  68. Nguyen, T., Locke, S., & Reddy, K. (2015). Does boardroom gender diversity matter? Evidence from a transitional economy. International Review of Economics & Finance, 37, 184–202. [Google Scholar] [CrossRef]
  69. Nguyen, V. C., & Huynh, T. N. T. (2023). Characteristics of the board of directors and corporate financial performance—Empirical evidence. Economies, 11(2), 53. [Google Scholar] [CrossRef]
  70. Nielsen, S., & Huse, M. (2010). The contribution of women on boards of directors: Going beyond the surface. Corporate Governance an International Review, 18(2), 136–148. [Google Scholar] [CrossRef]
  71. Orazalin, N., & Mahmood, M. (2021). Toward sustainable development: Board characteristics, country governance quality, and environmental performance. Business strategy and the environment, 30(8), 3569–3588. [Google Scholar] [CrossRef]
  72. Orozco, L. A., Vargas, J., & Galindo-Dorado, R. (2018). Trends on the relationship between board size and financial and reputational corporate performance. European Journal of Management and Business Economics, 27(2), 183–197. [Google Scholar] [CrossRef]
  73. Pagan, A. R., & Hall, A. D. (1983). Diagnostic tests as residual analysis. Econometric Reviews, 2(2), 159–218. [Google Scholar] [CrossRef]
  74. Post, C., Rahman, N., & McQuillen, C. (2015). From board composition to corporate environmental performance through sustainability-themed alliances. Journal of Business Ethics, 130(2), 423–435. [Google Scholar] [CrossRef]
  75. Pucheta-Martínez, M. C., & Bel-Oms, I. (2019). What have we learnt about board gender diversity as a business strategy? The appointment of board subcommittees. Business Strategy and the Environment, 28(2), 301–315. [Google Scholar] [CrossRef]
  76. Rajesh, R., & Rajendran, C. (2020). Relating environmental, social, and governance scores and sustainability performances of firms: An empirical analysis. Business Strategy and the Environment, 29(3), 1247–1267. [Google Scholar] [CrossRef]
  77. Rosenbaum, P. R., & Rubin, D. B. (1983). The central role of the propensity score in observational studies for causal effects. Biometrika, 70(1), 41–55. [Google Scholar] [CrossRef]
  78. Samara, G., Jamali, D., & Lapeira, M. (2019). Why and how should SHE make her way into the family business boardroom? Business Horizons, 62(1), 105–115. [Google Scholar] [CrossRef]
  79. Schwartz-Ziv, M. (2017). Gender and board activeness: The role of a critical mass. Journal of Financial and Quantitative Analysis, 52(2), 751–780. [Google Scholar] [CrossRef]
  80. Scott, W. R., & Meyer, J. W. (1994). Institutional environments and organizations: Structural complexity and individualism. Sage Publications. [Google Scholar]
  81. Shaukat, A., Qiu, Y., & Trojanowski, G. (2016). Board attributes, corporate social responsibility strategy, and corporate environmental and social performance. Journal of Business Ethics, 135(3), 569–585. [Google Scholar] [CrossRef]
  82. Sheikh, S. (2020). CEO inside debt and corporate social responsibility. International Journal of Managerial Finance, 16(4), 525–546. [Google Scholar] [CrossRef]
  83. Shu, P., Chiang, S., & Wu, T. (2024). Board network and ESG performance: Evidence from China. Corporate Social Responsibility and Environmental Management, 31(6), 5709–5729. [Google Scholar] [CrossRef]
  84. Sila, V., Gonzalez, A., & Hagendorff, J. (2016). Women on board: Does boardroom gender diversity affect firm risk? Journal of Corporate Finance, 36, 26–53. [Google Scholar] [CrossRef]
  85. Stock, J. H., & Yogo, M. (2005). Testing for weak instruments in linear IV regression. In D. W. K. Andrews, & J. H. Stock (Eds.), Identification and inference for econometric models: Essays in honor of Thomas Rothenberg (pp. 80–108). Cambridge University Press. [Google Scholar]
  86. Suttipun, M. (2021). The influence of board composition on environmental, social and governance (ESG) disclosure of Thai listed companies. International Journal of Disclosure and Governance, 18(4), 391–402. [Google Scholar] [CrossRef]
  87. Terjesen, S., Sealy, R., & Singh, V. (2009). Women directors on corporate boards: A review and research agenda. Corporate Governance: An International Review, 17(3), 320–337. Available online: http://hdl.handle.net/10871/24385 (accessed on 5 February 2025). [CrossRef]
  88. Toerien, F., Breedt, C., & De Jager, P. G. (2023). Does board gender diversity improve environmental, social and governance disclosure? Evidence from South Africa. South African Journal of Business Management, 54(1), 3646. [Google Scholar] [CrossRef]
  89. Torchia, M., Calabrò, A., & Huse, M. (2011). Women directors on corporate boards: From tokenism to critical mass. Journal of Business Ethics, 102(2), 299–317. [Google Scholar] [CrossRef]
  90. Wasiuzzaman, S., & Subramaniam, V. (2023). Board gender diversity and environmental, social and governance (ESG) disclosure: Is it different for developed and developing nations? Corporate Social Responsibility and Environmental Management, 30(5), 2145–2165. [Google Scholar] [CrossRef]
  91. Wasiuzzaman, S., & Wan Mohammad, W. M. (2020). Board gender diversity and transparency of environmental, social and governance disclosure: Evidence from Malaysia. Managerial and Decision Economics, 41(1), 145–156. [Google Scholar] [CrossRef]
  92. Williams, R. J. (2003). Women on corporate boards of directors and their influence on corporate philanthropy. Journal of Business Ethics, 42(1), 1–10. [Google Scholar] [CrossRef]
  93. Wintoki, M. B., Linck, J. S., & Netter, J. M. (2012). Endogeneity and the dynamics of internal corporate governance. Journal of Financial Economics, 105(3), 581–606. [Google Scholar] [CrossRef]
  94. Wooldridge, J. M. (2012). Introductory econometrics: A modern approach. Nelson Education. [Google Scholar]
  95. Wu, Q., Shahbaz, M., & Bigerna, S. (2024). Does board gender diversity benefit for corporate ESG performance: Evidence from Germany. Journal of Environmental Management, 372, 123304. [Google Scholar] [CrossRef]
  96. Yadav, P., & Prashar, A. (2022). Board gender diversity: Implications for environment, social, and governance (ESG) performance of Indian firms. International Journal of Productivity and Performance Management, 72(9), 2654–2673. [Google Scholar] [CrossRef]
  97. Yarram, S. R., & Adapa, S. (2021). Board gender diversity and corporate social responsibility: Is there a case for critical mass? Journal of Cleaner Production, 278, 123319. [Google Scholar] [CrossRef]
  98. Yoder, J. D. (1991). Rethinking tokenism: Looking beyond numbers. Gender and Society, 5(2), 178–192. Available online: http://www.jstor.org/stable/189483 (accessed on 5 February 2025). [CrossRef]
  99. Yurtseven, C. (2015). The causes of electricity theft: An econometric analysis of the case of Turkey. Utilities Policy, 37, 70–78. [Google Scholar] [CrossRef]
  100. Zaichkowsky, J. L. (2014). Women in the board room: One can make a difference. International Journal of Business Governance and Ethics, 9(1), 91. [Google Scholar] [CrossRef]
  101. Zaid, M. a. A., Wang, M., Adib, M., Sahyouni, A., & Abuhijleh, S. T. F. (2020). Boardroom nationality and gender diversity: Implications for corporate sustainability performance. Journal of Cleaner Production, 251, 119652. [Google Scholar] [CrossRef]
  102. Zaman, R., Jain, T., Samara, G., & Jamali, D. (2020). Corporate governance meets corporate social responsibility: Mapping the interface. Business & Society, 61(3), 690–752. [Google Scholar] [CrossRef]
  103. Zhu, Y., & Chen, J. (2024). How does board gender diversity shape ESG performance? Finance Research Letters, 74, 106717. [Google Scholar] [CrossRef]
Figure 1. Trends in average ESG disclosure scores and the percentage of women on boards.
Admsci 15 00141 g001
Figure 2. Board Gender Diversity and ESG disclosure.
Admsci 15 00141 g002
Table 1. Description and measurements of research variables.
Name of VariableDefinitionA Priori Expectation
Dependent variable
ESG disclosure scoreA combined disclosure score of an individual firm’s overall ESG transparency. It comprises the Environmental, Social, and Governance scores.
Independent Variables
 Critical massThe dummy variable equals one if boards have at least three women directors on board and zero otherwise.Positive
 TokenThe dummy variable is equal to 1 if the number of women directors on the board is 1 or 2 and 0 otherwise.Negative
 Blau indexGender diversity on the board ranges from 0 to 0.5.Positive
 Shannon indexGender diversity on the board ranging from 0 to 0.6.Positive
Control variables
 Board sizeBoard size is the total number of directors.Positive
 Board meetings per year Number of board meetings per year.Positive
 Pct of independent directorsPercentage of independent or outside directors on the board.Positive/Negative
 CEO duality
(CEO)
A dummy variable that takes the value of 1 if the chairperson is also the CEO and 0 otherwise.Positive/Negative
 Financial leverage
(FILV)
Financial leverage is the total debt divided by the firm’s total assets. Positive
 Tobin Q ratioTobin’s Q is calculated as the sum of the market value of equity, total liabilities, preferred equity, and minority interest divided by the value of total assets.Positive/Negative
 Firm sizeFirm size is the natural log of the total assets of the firm.Positive
 GDP growth annualGross domestic product annual growth rate.Positive/Negative
Industry dummiesA dummy variable for each industry to account for industry-specific fixed effects. One industry is established as the standard to circumvent the dummy variable trap.
Year dummiesA dummy variable for each year from 2012 to 2023 to account for time-invariant effects. The year 2012 is chosen as the reference point to circumvent the dummy variable trap.
Table 2. Descriptive Statistics.
VariablesObsMeanStd. Dev.MinMaxp1p99Skew.Kurt.
ESG disclosure score53458.10810.08318.40883.61336.13380.223−0.05713.104
Critical mass5400.8150.3890101−1.6213.627
Token5400.0670.2501013.47413.071
Blau index5400.4160.09800.500.5−2.1148.304
Shannon index5400.5640.14300.69300.693−1.8396.772
Board size53714.2293.834221720−0.1412.282
Board meetings per year 53210.0664.7223344261.5816.179
Pct of independent directors52465.6721.21620100201000.1932.226
CEO duality5370.2510.43401011.1462.314
Financial leverage5367.0538.4781.35570.3631.38832.0723.05517.51
Tobin Q ratio5351.8261.510.83112.0320.8997.4533.0513.876
Firm size53811.4881.5528.13314.8098.27814.5570.0532.217
GDP growth annual5403.9476.62−11.16723.655−8.71221.8790.2182.991
Note: This table presents the descriptive statistics for all variables analyzed in this study. The standard deviation (SD) indicates the variability of the data, while the minimum (Min) and maximum (Max) values define the range. Skewness (Skew) measures the asymmetry of the distribution, and kurtosis (Kurt) measures the tailedness of the data distribution.
Table 3. Pairwise Correlations.
Variables(1)(2)(3)(4)(5)(6)(7)(8)(9)(10)(11)(12)(13)
(1) ESG disclosure score1.000
(2) Token−0.175 *1.000
(0.000)
(3) Critical mass0.338 *−0.561 *1.000
(0.000)(0.000)
(4) Blau index0.271 *−0.281 *0.549 *1.000
(0.000)(0.000)(0.000)
(5) Shannon index0.283 *−0.292 *0.556 *0.998 *1.000
(0.000)(0.000)(0.000)(0.000)
(6) Board_size0.075−0.304 *0.216 *0.0770.0711.000
(0.085)(0.000)(0.000)(0.075)(0.102)
(7) Firm size0.153 *−0.107 *0.0610.110 *0.115 *0.310 *1.000
(0.000)(0.013)(0.161)(0.011)(0.007)(0.000)
(8) Financial leverage−0.152 *−0.040−0.0420.0450.0440.0500.585 *1.000
(0.000)(0.361)(0.331)(0.298)(0.305)(0.247)(0.000)
(9) Percentage of independent directors −0.0430.069−0.0510.0120.009−0.259 *−0.0620.0591.000
(0.330)(0.113)(0.240)(0.781)(0.845)(0.000)(0.159)(0.178)
(10) CEO duality0.090 *−0.0350.0540.0710.070−0.066−0.231 *−0.258 *−0.225 *1.000
(0.038)(0.416)(0.211)(0.101)(0.104)(0.126)(0.000)(0.000)(0.000)
(11) Board meetings0.203 *0.048−0.0360.0390.049−0.0570.409 *0.312 *0.028−0.210 *1.000
(0.000)(0.272)(0.402)(0.366)(0.260)(0.190)(0.000)(0.000)(0.522)(0.000)
(12) Tobin Q ratio−0.0700.0360.0450.0670.066−0.246 *−0.568 *−0.289 *−0.120 *0.093 *−0.334 *1.000
(0.106)(0.412)(0.300)(0.122)(0.127)(0.000)(0.000)(0.000)(0.006)(0.031)(0.000)
(13) GDP growth annual0.180 *0.053−0.0380.0260.035−0.516 *−0.104 *−0.0190.0050.243 *−0.0260.182 *1.000
(0.000)(0.215)(0.378)(0.553)(0.410)(0.000)(0.016)(0.665)(0.914)(0.000)(0.553)(0.000)
Note: This table reports Pearson correlation coefficients between variables. Variables are defined in Table 1. * Shows significance at p < 0.05. The correlation coefficients between the independent and control variables indicate that none surpass the threshold of 0.8.
Table 4. Variance Inflation Factor (VIF) Result.
VariablesVIF1/VIF
Firm size2.5340.395
Board size1.8440.542
Tobin Q ratio1.6910.591
Financial leverage 1.6270.615
GDP growth annual1.4880.672
Board meetings per year1.3370.748
CEO duality1.2890.776
Percentage of independent directors 1.2460.803
Token1.1280.887
Mean VIF1.576.
Table 5. Impact of Board Gender Diversity (Critical Mass and Token) on ESG Score.
VariablesPOOLED OLSFIXED EFFECTIV-GMM
(1)(2)(3)(4)(5)(6)
Token−3.1141 *** −1.4666 −8.83 ***
(−3.4744) (−1.3946) (3.229)
Critical Mass 2.8139 *** 1.7514 ** 10.31 ***
(2.6616) (1.9742) (3.345)
Board Size0.4719 ***0.4872 ***−0.3345−0.33070.2410.348
(3.5701)(3.6526)(−1.5955)(−1.5857)(0.223)(0.220)
Firm Size2.8203 ***2.8311 ***8.8968 ***8.8573 ***3.130 ***3.091 ***
(5.6371)(5.6600)(9.0636)(9.0622)(0.689)(0.685)
Financial Leverage0.01570.0153−0.0621−0.0663−0.131−0.0643
(0.1574)(0.1559)(−0.8165)(−0.8733)(0.169)(0.165)
Percentage of Independent Directors0.0411 **0.0412 **−0.0026−0.00350.0415 *0.0546 **
(2.3593)(2.3599)(−0.1184)(−0.1602)(0.0238)(0.0241)
CEO Duality1.25231.1449−1.8830 *−1.9274 **1.4982.015 *
(1.5125)(1.3851)(−1.9338)(−1.9833)(1.185)(1.192)
Board Meetings Per Yr0.4172 ***0.4234 ***0.01490.00720.451 ***0.502 ***
(5.5000)(5.6261)(0.1856)(0.0897)(0.106)(0.103)
Tobin Q Ratio0.5446 **0.5608 **1.7438 ***1.7568 ***0.557 *0.842 ***
(2.2049)(2.2753)(4.5376)(4.5799)(0.318)(0.325)
GDP Growth Annual0.3038 ***0.3098 ***0.4477 ***0.4231 **0.261 ***0.218 **
(4.1666)(4.3001)(2.6509)(2.4975)(0.100)(0.102)
Constant13.3993 **10.0771 *−42.172 ***−43.219 ***14.46 **1.920
(2.5856)(1.9137)(−3.7794)(−3.9303)(6.935)(7.567)
Observations519519519519442442
R-squared0.50250.50310.47460.47680.4260.410
Industry dummiesYESYESYESYESYESYES
Year dummiesYESYESYESYESYESYES
First stage F-stat 18.3829.59
Kleibergen–Paap rk LM statistic 18.5623.90
Cragg–Donald Wald F statistic 105.6129.8
Hansen 0.39919.70
Hansen p-value 0.5289.06 × 10⁻⁶
Endogeneity test 4.4346.144
Endogeneity test p-value 0.03520.0132
Number of cids 4545
Note: This table presents the impact of board gender diversity on the ESG disclosure score for firms in the EURO STOXX 50 Index. The dependent variable is the ESG disclosure score, while the critical mass and token variables measure female representation levels. The analysis covers the period from 2012 to 2023. The table reports results from both pooled OLS, fixed effect regression, and IV- GMM regression. t-statistics are shown in parentheses. *** p < 0.01, ** p < 0.05, * p < 0.1.
Table 6. Impact of board gender diversity (Blau and Shannon index) on ESG score.
VariablesFIXED EFFECTIV-2SLS
(1)(2)(3)(4)
Blau index15.5683 *** 16.1782 ***
(4.4583) (4.7633)
Shannon index 11.1650 *** 11.0177 ***
(4.6337) (5.0319)
Board_size−0.3617 *−0.3495 *−0.0611 ***−0.0625 ***
(−1.8311)(−1.7721)(−2.625)(−2.6452)
Firm size7.0398 ***6.9277 ***0.01450.0136
(7.3351)(7.2065)(0.9637)(0.8862)
Financial leverage−0.0420−0.03990.0081 **0.0079 **
(−0.5809)(−0.5541)(2.3577)(2.2864)
Percentage of independent directors−0.0049−0.0048−0.2803−0.3077
(−0.2403)(−0.2326)(−1.4059)(−1.5253)
CEO duality−1.7038 *−1.6768 *−0.0541 ***−0.0544 ***
(−1.8433)(−1.8167)(−4.7669)(−4.7205)
Board meetings per year−0.0232−0.0252−0.1847 ***−0.1894 ***
(−0.3032)(−0.3304)(−3.3617)(−3.3936)
Tobin Q ratio1.7331 ***1.7293 ***0.02030.0164
(4.7572)(4.7556)(0.2861)(0.2284)
GDP growth annual0.3813 **0.3826 **−0.0099−0.0103
(2.3862)(2.3988)(−0.8589)(−0.8826)
Constant−26.1700 **−24.9049 **−1.7343−1.1432
(−2.4258)(−2.3101)(−1.1405)(−0.8159)
Observations519519384384
Number of cid45454545
Country FEYESYESYESYES
Year FEYESYESYESYES
Durbin (score) chi2(1) 19.8783
(p = 0.0000)
23.9178
(p = 0.0000)
Wu–Hausman F (1364) 19.8717
(p = 0.0000)
24.178
(p = 0.0000)
First-stage F(1365)—Minimum eigenvalue statistic 56.8606
(p = 0.0000)
59.9802
(p = 0.0000)
Note: This table presents the impact of board gender diversity on the ESG disclosure score for firms in the EURO STOXX 50 Index. The dependent variable is the ESG disclosure score, while the key independent variables are the Blau and Shannon indices. The analysis covers the period from 2012 to 2023. The table reports results from both fixed-effects regression and IV-2SLS estimation. t-statistics are shown in parentheses. *** p < 0.01, ** p < 0.05, * p < 0.1.
Table 7. Impact of the percentage of women on board on ESG disclosure score in different industries.
(1)(2)(3)(4)(5)(6)(7)(8)
VARIABLESIndustry: Consumer DiscretionaryIndustry: Consumer StaplesIndustry: EnergyIndustry: FinancialIndustry: Health CareIndustry: IndustrialIndustry: Information TechnologyIndustry: Utilities
Percentage of women on board0.147 **0.122 **0.414 *0.265 ***0.573 ***0.127 *0.420 ***0.073
(2.276)(2.295)(1.885)(4.416)(4.054)(1.724)(3.304)(0.644)
Board size0.817−0.2041.623−0.715 **0.518−0.1061.258−2.606
(1.625)(−0.430)(0.730)(−2.141)(0.505)(−0.206)(1.521)(−0.786)
Firm size8.308 ***11.804 ***17.1309.383 ***0.77817.746 ***−2.74814.889 *
(3.434)(4.249)(0.961)(2.847)(0.244)(5.488)(−0.730)(1.861)
Financial leverage −1.449 ***−1.77712.4200.214 **3.957−0.379 *−3.725−4.09 ***
(−5.149)(−0.658)(1.032)(2.467)(0.917)(−1.775)(−1.612)(−3.064)
Percentage of independent directors0.0410.035−0.419−0.007−0.0540.192 ***0.1800.085
(1.090)(0.219)(−1.491)(−0.154)(−0.603)(3.955)(1.502)(0.533)
CEO duality3.9921.90710.886−5.035 **0.4780.3079.1812.606
(0.904)(1.003)(1.112)(−2.108)(0.156)(0.167)(1.190)(1.095)
Board meetings per year0.292 *0.392−0.351−0.017−0.1400.016−0.031−0.206
(1.985)(1.366)(−0.329)(−0.135)(−0.302)(0.059)(−0.093)(−1.049)
Tobin Q ratio0.9463.447 ***45.51987.715 ***−1.3741.2341.673 *7.044
(1.479)(2.769)(0.961)(2.826)(−0.864)(0.762)(1.982)(0.902)
GDP growth annual3.236 ***0.6100.0480.326 *−0.019−0.6404.979 *4.880 **
(3.195)(1.499)(0.066)(1.670)(−0.004)(−1.653)(1.999)(2.509)
Constant−60.796 ***−82.323 ***−226.979−162.321 **24.857−148.81 ***38.462−121.492
(−2.808)(−2.762)(−1.033)(−2.600)(0.500)(−4.326)(1.267)(−1.129)
Observations104592413136944724
R-squared0.7410.5840.6120.4970.7530.6310.6720.951
Number of cids1052113842
Note: This table reports the impact of the gender diversity of UK FSTE 100 Index boards on the ESG disclosure score across different industries. The outcome variable is the ESG disclosure score, and the main explanatory variables are the Blau and Shannon index. The sample spans from 2012 to 2023. The table displays the results of IV2SLS regression and fixed-effect regression. t-statistics in parentheses. *** p < 0.01, ** p < 0.05, * p < 0.1.
Table 8. Impact of Board Gender Diversity on ESG Score in the UK FTSE 100: Fixed Effects and Instrumental Variable Regression Models.
VariablesFIXED EFFECTIV 2SLS
(1)(2)(3)(4)
 Blau index8.629 *** 34.326 ***
(4.231) (4.839)
 Shannon index 5.673 *** 23.457 ***
(4.011) (4.975)
 Board size 0.329 ***0.333 ***0.250 *0.256 *
(2.855)(2.879)(1.648)(1.692)
 Board average tenure0.276 **0.277 **0.348 **0.359 **
(2.108)(2.117)(2.028)(2.094)
 Percentage of independent directors0.0150.015−0.075 **−0.075 ***
(0.755)(0.778)(−2.558)(−2.577)
 Financial leverage −0.017−0.018−0.364 **−0.365 ***
(−0.408)(−0.417)(−9.721)(−9.742)
 Firm size 3.161 ***3.213 ***3.160 ***3.166 ***
(6.284)(6.401)(13.810)(13.887)
 CEO duality0.8180.7122.4582.104
(0.552)(0.480)(1.012)(0.876)
 Tobin Q ratio 0.932 ***0.955 ***0.2070.206
(3.014)(3.090)(1.051)(1.049)
 Constant 7.1616.88411.552 ***12.374 ***
(1.473)(1.416)(3.808)(4.179)
Industry dummiesYes Yes Yes Yes
Year dummiesYesYesYesYes
F (1944)
(Prob > F)
242.079
(0.0000)
262.046
(0.0000)
Cragg and Donald’s statistic 242.079242.079
Durbin (score) chi2(1)
(p-value)
5.97392
(p = 0.0145)
6.15837
(p = 0.0131)
Wu–Hausman F (1943) 5.88022
(p = 0.0155)
6.06294
(p = 0.0140)
Pagan–Hall general test
(p-value)
75.800
(0.0000)
77.229
(0.0000)
 Observations964964964964
 R-squared0.6320.6310.4800.481
T-values are in parentheses.
Note: This table reports the impact of the gender diversity of UK FSTE 100 Index boards on the ESG disclosure score. The outcome variable is the ESG disclosure score, and the main explanatory variables are the Blau and Shannon index. The sample spans from 2012 to 2023. The table displays the results of IV2SLS regression and fixed-effect regression. t-statistics in parentheses. *** p < 0.01, ** p < 0.05, * p < 0.1.
Table 9. Impact of Board Gender Diversity on ESG Score in the UK FTSE 100: Inverse Probability Weighting (IPW) Regression.
ESG Disclosure ScoreCoefficient Standard ErrorZ-Statisticsp > |z|
ATET
Female CEO or equivalent
(1 vs. 0)2.7520111.0160042.710.007
POmean
Female CEO or equivalent
053.683960.652843382.230.000
Number of obs = 964
Outcome model: weighted mean
Treatment model: logit
Note: This table reports the impact of gender diversity on the boards of UK FTSE 100 Index firms concerning their ESG disclosure score. The dependent variable is the ESG disclosure score, with the main independent variable being the presence of female CEOs. The sample covers the period from 2012 to 2023. The results presented are based on the inverse probability weighting (IPW) method.
Table 10. Robustness Summary Table.
Test DescriptionChange AppliedKey Finding Table Reference
Alternative Board Gender Diversity MeasuresEmployed various metrics to measure gender diversity (Blau and Shannon index)Finding remains consistentTable 6
Cross-Industry ComparisonAnalysed gender diversity and ESG disclosures across several industriesFinding remains consistent across all industriesTable 7
Alternative Market Sample Focused on UK FSTE 100 (2012–2023)Main finding persistsTable 8
Alternative techniqueApplied inverse probability weighting (IPW) regressionResults are robust to methodological change Table 9
Disclaimer/Publisher’s Note: The statements, opinions and data contained in all publications are solely those of the individual author(s) and contributor(s) and not of MDPI and/or the editor(s). MDPI and/or the editor(s) disclaim responsibility for any injury to people or property resulting from any ideas, methods, instructions or products referred to in the content.

