Article

Rise and Fall of the Materiality Matrix: Lessons from a Missed Takeoff

by
Tiziana De Cristofaro
and
Domenico Raucci
*
Department of Economic Studies, “G. d’Annunzio” University, 65127 Pescara, Italy
*
Author to whom correspondence should be addressed.
Adm. Sci. 2022, 12(4), 186; https://doi.org/10.3390/admsci12040186
Submission received: 27 October 2022 / Revised: 25 November 2022 / Accepted: 29 November 2022 / Published: 6 December 2022

Abstract

:
After a long period of the inclusion of materiality matrices within standard setters documents and non-financial reports, the Global Reporting Initiative officially abandoned the materiality matrix in 2021 after the GRI 3 standard release. To bridge the detected gaps in the literature, this article aims to investigate approaches to and arguments for the matrix until the issuance of GRI 3. The two-step research strategy adopted gives the same level of attention to the opposite positions found. Phase 1 (approach-oriented) reviews the materiality matrix presentation in the 2014–2020 non-financial reports of a sample of worldwide sustainability-oriented companies. Phase 2 (argument-oriented) performs qualitative content analysis on feedback for the GRI 3 preparatory works. The findings show that, besides the staunch adopters, a core of non-adopters persisted and prevented the takeoff of the matrix. Moreover, further insights into possible drivers both in favour of and against these approaches are provided. The final discussion both considers the lessons learnt, overlapping with policy implications, and suggests future research avenues.

1. Introduction

Materiality is a key and many-faceted concept (Edgley 2014) that steers the selection of the themes a company reports on. In this sense, materiality is binary (Eccles et al. 2015) and defines what counts to readers when they come across companies’ reports, because it takes into account (or should take into account) what information can serve the stakeholders’ decisional processes. First appearing in financial reporting contexts during the 1900s (Bernstein 1967; Hicks 1964; Holmes 1972), in the 2000s materiality gradually spread in non-financial reporting (NFR) contexts, assuming an increasingly central role regardless of whether a voluntary or mandatory approach was adopted. This led the standard setters involved in NFR to coin different conceptualisations and multi-step materiality assessment approaches, such that the concept still appears to be contested and ambiguous (Cooper and Michelon 2022).
The Global Reporting Initiative (GRI), which is among these standard setters, in the G3 version of the Sustainability Reporting Guidelines (GRI 2006) launched the season of defining a report’s contents through a process devoted to assessing materiality. This materiality assessment process (MAP) includes an issue prioritization phase, the output of which is exemplified by a graph. The graph depicts the relative reporting priority of the topics assessed, which moves, in the GRI’s materiality analysis, along the perspectives of the companies’ external impacts and/or the influence of topics on stakeholders’ decisions. This visual tool, generally known as the materiality matrix (MM), was regularly included in subsequent GRI guidelines and standards. In 2021, GRI radically modified its approach to both prioritization (i.e., two independent criteria are no longer encompassed) and its visualization (i.e., a matrix is no longer needed). Hence, the universal standard “GRI 3: Material Topics” removed MM (GRI 2021). However, any devoted graphical tool took its place in the standard, despite non-financial reports (NFRs) frequently requiring the use of graphs (Varachia and Yasseen 2020).
Although, for this period, MM could be found both in GRI documents and in companies’ NFRs, an in-depth debate between scholars on the tool never arose. Thus, several related research areas remained uncovered, leading to a lack of knowledge on MM’s best and worst practices, as well as a gap in the literature on its pros and cons. Furthermore, the disregarded existence of a group of companies that never presented MM in their NFRs has emerged. As a result, existing studies do not consider the true extent of the MM’s success. In particular, the trends in practice are never interpreted through arguments expressed over time by insider voices. To bridge this gap, this study aims to investigate the landscape of the NFR insiders’ positions and arguments about MM that emerged before the GRI 3 shift. In order to achieve our aim, the following research question is set:
What approaches to MM adoption emerge over time and why?”
We answered this question through a mixed research strategy articulated in two phases, which differ in nature and, hence, in the methodologies adopted. The first phase, based on a quantitative methodology, reviews the adoption over time of MM in NFRs in a sample of worldwide sustainability-oriented companies for the 2014–2020 period. The second phase, based on a qualitative methodology, performs a content analysis of the public comments on MM included within the responses to the 2020 Exposure Draft, which led to GRI 3.
Among the major findings, two striking results emerged. First, besides staunch MM adopters, a core of non-adopters persisted over time and prevented the takeoff of the tool. Second, interesting further insights on possible drivers underlying these opposite approaches are provided, including those insights in favour of retaining MM that the GRI did not consider in drafting GRI 3.
On the basis of the above, this article aims to contribute to the literature on materiality assessment disclosure in corporate NFRs by focusing on insiders’ viewpoints on MM.
In detail, the study provides the following manifold value. First, practices and voices on MM are analysed by simultaneously paying the same level of attention to both MM adoption and non-adoption, as well as to opinions both in favour of and against MM. Furthermore, the paper extends the time span that has been investigated thus far. Indeed, it diachronically maps MM adoption and non-adoption over a seven-year period, ending at the issuance of GRI 3. Furthermore, the paper provides a preliminary literature review and a content analysis of comment letters, which both offer novel insights on the opinions expressed on the pros and cons of MM, including those from the most active GRI stakeholders.
The article is structured as follows. Section 2 presents the research background, namely the evolution of the specific NFR standard setting context in which MM was developed and fell in popularity. Section 3 outlines the relevant literature, its detected gaps, and the research question stemming from the latter. Section 4 introduces the research design and describes the methodologies used by detailing the materials and methods of the two research phases. Section 5 presents the results of the two research phases. Finally, Section 6 offers a discussion that takes into account the lessons learnt, with policy implications, and suggests future research avenues arising from the limitations of this study.

2. Background: The Materiality Matrix in the Evolution of Standard Setters’ Approaches to Materiality Analysis

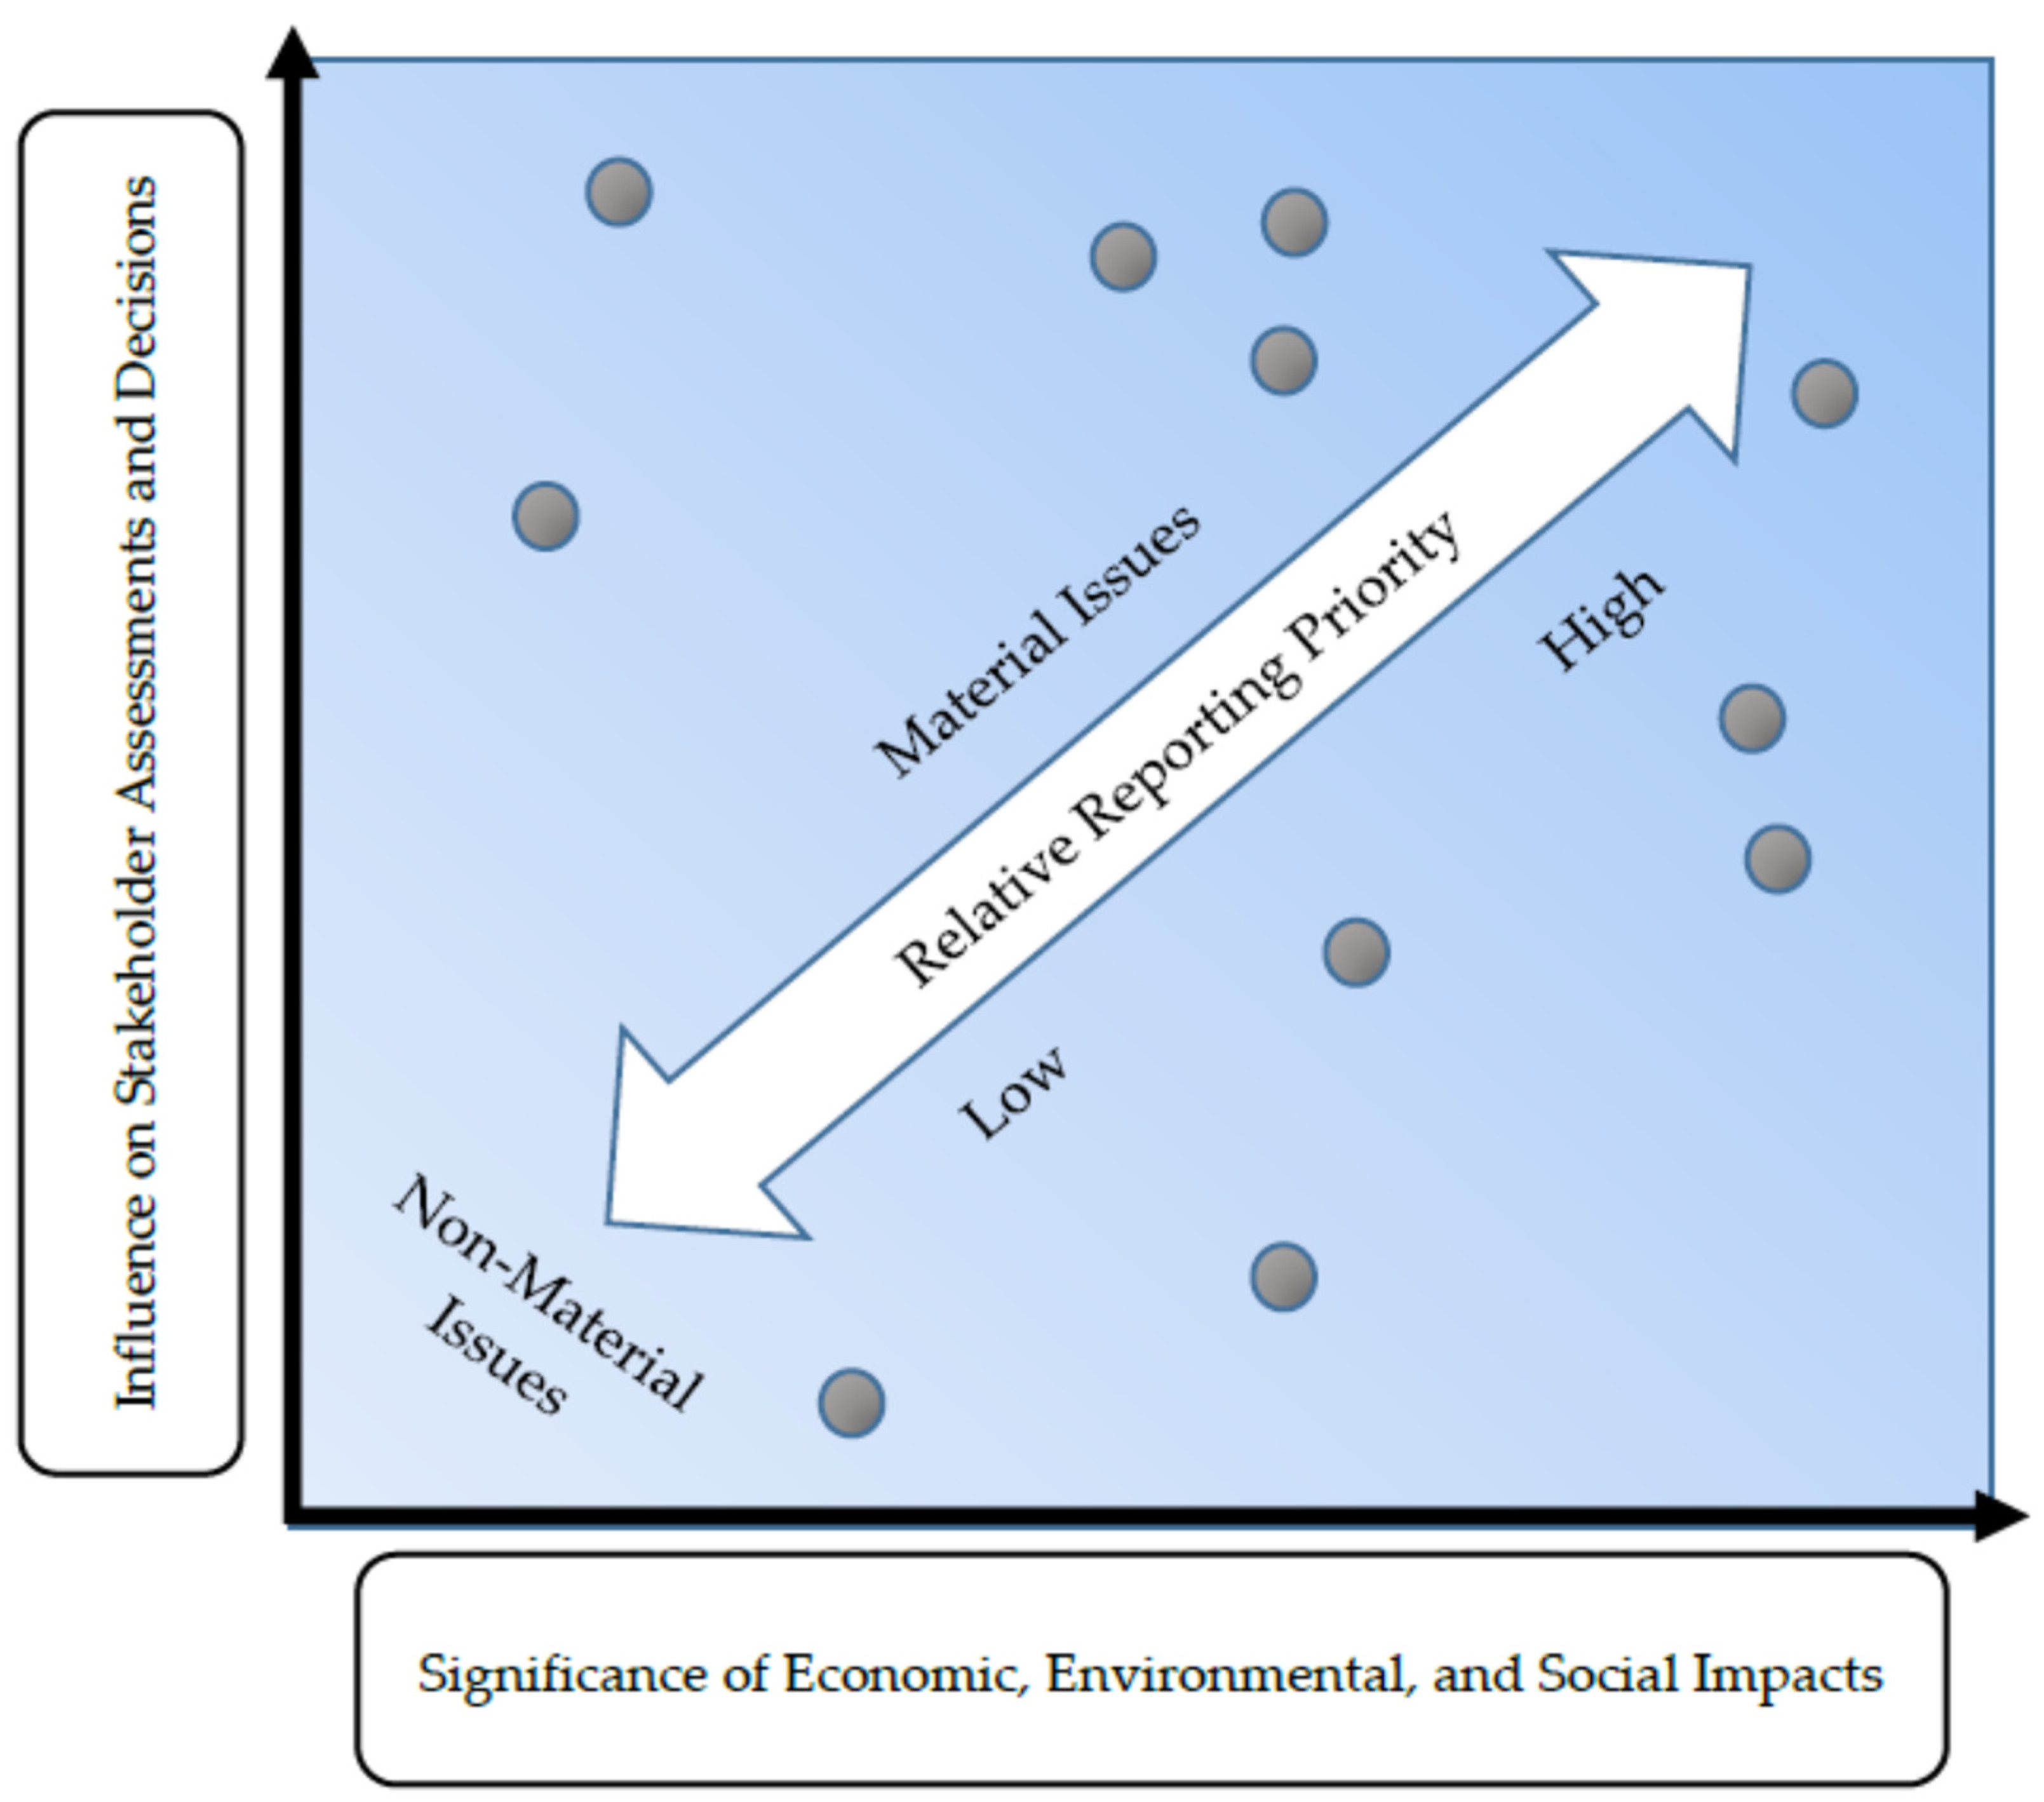
2.1. Origins and Spread of the Materiality Matrix

The MM is a special techno-rational tool (Adams et al. 2021), namely, a graph that simultaneously represents stakeholders’ and companies’ perspectives on the relevance of sustainability issues through Cartesian axes. Hence, MM visually reports on how and why some topics have been deemed material enough for reporting and/or strategic aims.
The tool appeared in 2004–2006 sustainability reports as a visual exemplification of the first practices of issue prioritization that pioneering companies experimented with (AccountAbility 2006).
Soon after, AccountAbility and GRI introduced their own MM versions (AccountAbility 2006; GRI 2006), although these versions were grounded in different materiality concepts (Mio and Fasan 2014; Edgley et al. 2015; Cooper and Michelon 2022), different MAPs (Mio 2013; Mio and Fasan 2013; Bellandi 2017; De Cristofaro 2022), and different axes labels (Figure 1).
During the subsequent decade, while AccountAbility dismissed MM at an early stage in subsequent official documents, GRI included this graphic tool in subsequent guidelines (GRI 2011a, 2011b, 2013) and standards (GRI 2016) issued until 2016 (Figure 2). In those years, to exemplify the company’s evaluation of the importance of matters, carried out before prioritisation, even the International Integrated Reporting Council (IIRC) proposed a system of Cartesian axes (IIRC 2013, 2015). However, this cannot be considered a proper MM, because the stakeholders’ perspective is missing.
Nevertheless, although the GRI has trusted MM since 2006, at the end of the 2010s something changed. The following section provides insights into this special case.

2.2. Decline of the Materiality Matrix in the GRI’s Approach

As a part of the 2019 project reviewing the 2016 GRI Universal Standards (GSSB 2019), the Global Sustainability Standards Board (GSSB), i.e., the GRI’s independent standard-setting body, submitted an exposure draft to public comments in 2020 (GSSB 2020). Among other things, the draft included a revised version of “GRI 103: Management Approach”. The feedbacks received were summarized (GSSB 2021a) and considered as a basis for discussion (GSSB 2021b). All of the above led to the new universal standard “GRI 3: Material Topics 2021” (GRI 2021).
These steps heavily involved MM. Indeed, from the 2020 draft onwards, the graph was removed completely. Accordingly, no matrix was mentioned or exposed among any of the document’s text lines. Rather, while no visual exemplifying criteria used to determine material topics was inserted in the text, the MAP exemplification included only a stylized final list of material topics (GRI 2021), as the schematization presented in Figure 3 shows.
However, during the period of GRI 3 drafting, it quickly emerged that not all of the feedback on MM agreed with its removal1. Particularly, GSSB’s summary simply devoted a phrase to each of the two opposite categories of comments on MM (GSSB 2021a). Despite no details being provided (e.g., the weight of the respondents’ opinions, concerns, and suggestions), this was enough to mitigate a drastic removal. Thus, the following new paragraph was inserted into both the revised draft (GSSB 2021b) and the final GRI 3 (GRI 2021): “For transparency, the organization can provide a visual representation of the prioritization that shows the initial list of topics it has identified and the threshold it has set for reporting” (GSSB 2021b, p. 11; GRI 2021, p. 13).
GSSB justified the removal as follows: “The materiality matrix has not been reinstated, as the revised concept of ‘material topic’ no longer encompasses two dimensions. The GSSB will consider developing further guidance on materiality for reporting organizations in a format such as a website FAQ, which could also include suggestions for visuals. This may include options for visual representations of the revised GRI concept of materiality and its connection to double materiality” (GSSB 2021a, p. 7).
GRI further explained its choice. In particular, GRI replied to Frequently Asked Questions (FAQs), reiterating that “The revisions to the concept of ‘material topic’ eliminate the need for a matrix as the concept no longer encompasses two independent criteria” (GRI 2022, p. 17). Namely, material topics no more reflect the “organization’s significant economic, environmental, and social impacts” (MM x-axis) and/or “their substantive influence on the assessments and decisions of stakeholders” (MM y-axis). According to the GRI, feedback indicated that MM often led “to biases based on stakeholder selection, since organizations prioritized impacts only if the consulted stakeholders highlighted them” (GRI 2022, p. 16). Furthermore, it is feared that retaining MM would generate incorrect interpretations based on a two-dimensions impact assessment since “organizations would consider the impacts on themselves instead of how they impact the economy, the environment, and society” (GRI 2022, p. 16).
Hence, the GRI paid more attention to feedback highlighting that material topics now “represent an organization’s most significant impacts on the economy, environment, and people, including impacts on their human rights” (GRI 2022, p. 16). The influence on stakeholders’ assessments decisions is no longer a standalone factor because stakeholder engagement now “forms part of identifying and assessing an organization’s impacts and informs the process for determining material topics” (GRI 2022, p. 16). In other words, since the incorporation of the “old” materiality stakeholders dimension into the “old” external impacts dimension would involve the fusion of the “old” two MM axes, a matrix would no longer make sense.
Then, in GRI 3, both mandatory and voluntary novel disclosures were introduced. As for mandatory, two elements now have to be compulsorily disclosed, namely the material topic list and the cut-off thresholds set for reporting purposes. As for voluntary disclosures, a discretionary (“the organization can provide”) hypothesis of visual tools (not necessarily graphs) was inserted (GRI 2021, pp. 13, 18).
However, despite further guidance on materiality, including “options for visual representations of the revised GRI concept of materiality” was expected in a Frequently Asked Question (FAQ) format (GSSB 2021b, p. 7), the 2022 FAQs (GRI 2022) do not yet include suggestions for visuals.
In summary, the presented GRI shift will likely weaken the adoption of MM in the next NFRs, opening the field to as yet unidentified visual tools exemplifying the future MAPs. Nevertheless, to better understand and foreshadow the next scenario by grounding in the past, it is worth investigating what is really known about the perceived importance and usefulness of MM, in theory and practice, from 2006 to date.
With a special focus on both the adoption and critique of MM, the following section presents the literature that we reviewed in depth to examine the state of the art of MM and how the detected literature’s gaps led to the formulation of our research question.

3. From the Literature to the Research Question

Generally, MM is addressed by studies on materiality analysis devoted to non-financial information disclosure and/or sustainability strategies. These two areas overlap because several company activities (e.g., NFR, stakeholder engagement, report assurance, risk assessment, performance management, and long-term scenarios simulation) can rest upon a materiality assessment approach that encompasses MM (AccountAbility 2006). Furthermore, some studies that do not strictly focus on materiality address MM (e.g., Garcia-Torres et al. 2017; Campra et al. 2020).
However, among these studies addressing MM, only some articles expressly include it in their research aims (Calabrese et al. 2019; Saenz 2019; Torelli et al. 2019; Ortar 2020; Ferrero-Ferrero et al. 2021; Geldres-Weiss et al. 2021; Costa et al. 2022). Even fewer are the devoted book chapters (Eccles et al. 2015; Kuisma 2017), the chapter sections (Gelmini et al. 2015), and the web contributions (Cohen 2014; McElroy 2011). The remaining studies do not focus much on MM, and only cover it occasionally through mere introductions or the discussion of results.
Hence, knowledge on the MM experiences of companies results in a very fragmented literature that both considers MM from several perspectives (e.g., as discussed focal topic, as investigated or detected aspect, as part of a coined approach, and as a research tool) and overlaps the studies cited here. For example, studies that considered MM as a research tool, used the MM as source of the following:
As a result, neither a systematic corpus of knowledge nor a specific stream of literature on MM exist. Thus, to better capture the relevant literature, all of the MM citations found were manually “picked” and examined according to the following four aspects of findings and foci: MM adoption, MM features, MM as an approach, and critiques of MM. These aspects are separately presented below.
MM adoption was detected in several contributions through single case studies, both interview-based (Lai et al. 2017) and not (Taubken and Feld 2018; Mathur and Kumar 2019), as well as through the investigation of a larger number of companies. In the latter studies, MM adoption can be found and described both by percentages (Table 1) and not (Jones 2016; Jones et al. 2016a, 2016b, 2016c; Wee et al. 2016; Morrós 2017; Guix et al. 2018; Farooq et al. 2021; Madasu 2019; Lakshan et al. 2021). Table 1 provides evidence that, although MM increased in importance over the 2008–2020 period, the percentages of adoption never reached striking values (range: 25–69%). Table 1 also highlights that companies in several industries and countries around the world have included a MM in their NFRs regardless of the reporting approach chosen (e.g., sustainability reporting, integrated reporting, etc.).
As for MM features (e.g., Eccles et al. 2015; Ortar 2020) and role (Geldres-Weiss et al. 2021), heterogeneous design as well as commonalities have emerged. For example, Ortar (2020) noted that many MMs are devoid of numerical attributes and the presented issues are not always covered in accordance with specified guidelines. Good practices are even less stressed (e.g., the joint depiction of issues and risks/opportunities in Eccles et al. 2015).
Some authors studied MM theory as an approach. One group integrated MM with an “adequacy matrix” to evaluate sustainability communication (Calabrese et al. 2019), with a “value creation matrix” (Saenz 2019) and into/within a theory model for the materiality analysis of sustainability reports (Slacik and Greiling 2019). Ferrero-Ferrero et al. (2021) found that the MM prioritization approach generates a risk of environmental performance overestimation when compared with an expert knowledge approach. Eccles et al. (2015) upgraded MM into a four-cell “Sustainable Value Matrix” for which the y-axis represents the firm’s perception of the significance of an issue to the chosen stakeholders.
Finally, the critique of MM includes both appreciations and criticisms that alternatively refer to and/or overlap with how preparers implement MM, its own virtues and faults, and the GRI approach. For example, the following strengths were stressed:
  • MM typically describes firms’ orientation to sustainability more accurately than the GRI content index (Pizzi et al. 2020);
  • MM allows the easy identification of most material issues (Ortar 2020);
  • MM both visualizes the overall materiality assessment and helps to consider the baseline SDGs-related responsibilities (Costa et al. 2022);
  • MM explains the dynamics of sustainability-oriented value creation and business models (Geldres-Weiss et al. 2021);
  • MM creates a multi-stakeholder context that fosters virtuous paths of co-creation of value and sustainable society (Formisano et al. 2017);
  • As it is instantly and visually observable, MM is a powerful mechanism of communication (Bavagnoli et al. 2014);
  • MM is an effective model for assessing the impact of issues using different sizes for different bulks (Bavagnoli et al. 2014);
  • MM provides summaries (Farooq and de Villiers 2019) and preliminary maps (Morrós 2017);
  • MM shows the same communication advantages of graphs (Gelmini et al. 2015) outlined by Beattie and Jones (2002), namely, to capture attention, to allow direct data acquisition, to simplify data retrieval, and to enliven data presentation;
  • MM is a tool that simplifies the inherent complexity of assessing material sustainability issues, stakeholder engagement, and the societal pursuit of sustainable development (Adams et al. 2021).
On the other hand, the following flaws were highlighted:
  • MM design requires a lot of time (Aureli et al. 2020) and energy (Taubken and Feld 2018).
  • Along the lines of Beattie and Jones (2002), Gelmini et al. (2015) stress that MM creates risks of graphical infidelity, namely selectivity (e.g., x-axis re-labelled “Potential Impact on Our Business”), measurement distortion (e.g., an item’s size being unrepresentative of its relevance), and presentation enhancement (e.g., an item’s emphatization through colours).
  • Among the several x-axis labels chosen (Jones et al. 2016a), companies sometimes substitute the GRI’s label for “success to the organisation” and similar labels. This inward focus involves the risk of omitting impacts with little effect on the organisations’ success (Guix et al. 2019), regardless of how much they relate to a particular business plan or strategy (McElroy 2011).
  • The lack of detailed guidance makes the y-axis the more complex axis (Bellantuono et al. 2016), since it merges divergent stakeholders’ voices rather than precisely portraying converging instances and conflicting interests (Puroila and Mäkelä 2019). This compromise, although it could marginalize certain stakeholders, provides an illusory consensus among stakeholders that implies a weak comparability between reports (Reimsbach et al. 2020).
  • Sometimes companies report only on issues that score highly on both axes (top-right quadrant), essentially omitting significant issues that are relevant to stakeholders (top-left quadrant) (Guix et al. 2019);
  • The heterogeneous design of MM (e.g., axes and quadrants) allows companies to manipulate the data to suit their needs (Guix et al. 2018);
  • Sometimes a lack of correlation between MM and the report’s content occurs (Sepúlveda-Alzate et al. 2021).
  • Companies do not usually disclose background information on how exactly the matrix was constructed, e.g., how issues are ranked and the threshold set (Puroila and Mäkelä 2019).
  • Since most of the reports give no clue as to how the material issues were placed in the matrix, it seems that “that there is a focus on moving dots around a matrix and not on the underlying drivers of sustainability performance” (Cohen 2014).
  • MM “effectiveness is somewhat limited since it doesn’t show the priorities of different groups, industrial benchmarks used by peers and investors to compare performance, characteristics such as “innovation” that represent resilience and adaptability to changing times”, industry key sustainability performance indicators as well as does not “provide for future disruptive events or changes in stakeholder priorities that may change the mix” (Morrós 2017, p. 115).
Summarizing the above-mentioned literature, some main considerations emerge concerning its features and flaws.
First, only a few studies investigated MM under a graphical lens (e.g., Gelmini et al. 2015). This reveals a weak interest in the study of the tool as a special visual content of NFRs.
Moreover, despite the existence of a contradictory framework of scattered MM pros and cons, an in-depth debate on these features never arose. Consequently, literature focused on MM critique is lacking, even in the basic form of surveying good and bad practices.
Furthermore, the adoption of MM was mapped without considering its rate of spread. Hence, the literature completely disregarded the detected existence of a steady group of companies that never presented MM in their reports, as if this was not proof of criticalities.
Last but not least, a weak aptitude toward the search for direct proof of the usefulness of MM was detected. A few works focused on subjects affected by materiality, such as non-professional investors (Backof et al. 2020) or financial market professionals (Jørgensen et al. 2021), including a case study (Lai et al. 2017), while none directly consider the perceptions of MM.
If considered together, the latter two flags reveal that existing studies do not substantially enquire about the real extent of MM’s success by interpreting the practice trends, through cues offered by conflicting arguments expressed over time by multiple voices.
In order to bridge this gap, this article aims to better understand the NFR insiders’ viewpoints (namely, positions and arguments) on MM, which emerged before the GRI 3 shift, including those who were neglected by GRI. To this end, we formulated the following research question:
What approaches to MM adoption emerged over time and why?
The following section explains the line of enquiry applied to answer this question.

4. Research Design and Methodology

4.1. Research Design

In order to answer the research question, we set a quali-quantitative strategy of research (Table 2). Specifically, we selected the “sequential explanatory” approach, a mixed strategy (Tucker and Hoque 2017) for which the two phases are connected, yet separated (Creswell 2014).
As Table 2 exhibits, the first phase is quantitatively oriented while the second phase is qualitatively oriented. Each phase answers part of the main research question. Furthermore, one aspect detected during the first phase connects the two phases; particularly, the main approaches to MM detected during the first phase were used to set some a priori codes to be used during the second phase.
Table 2 summarizes the whole strategy of enquiry. The table starts from the parts of the research question answered and ends with the methodology adopted in each phase, including the materials and methods.

4.2. Phase 1: Materials and Methods

To detect the specific MM adoption approaches, MMs were searched among the 2014–2020 NFRs of a group of sustainability-oriented companies operating all over the world.
The 7-year period extends the span investigated so far, from 2014 to 2020, before the release GRI 3 in 2021. The sustainable orientation, assumed as a feature that increases the possibility of publishing NFRs, was defined as having consistently received the yearly RobecoSAM medals over the selected period. The RobecoSAM source was also used in previous studies (De Cristofaro and Gulluscio 2019; López-Arceiz et al. 2020a, 2020b; Tan et al. 2020).
The sample includes 60 companies, a statistical subpopulation that represents 5.83% of the initial sample (Table 3).
The sample covers 20 countries (frequency range: 1–6) and four continents (America, Asia, Europe, and Oceania). Companies are distributed across 41 sectors, with frequencies ranging between one (27 sectors) and six (one sector). The most represented continent, countries, and sectors are, respectively, Europe (slightly more than 50%), Spain, Switzerland, and the USA (six instances each), and electric utilities (six Spanish, Italian, and Portuguese companies).
With regard to the data source, the pdf files of 888 reports were found online at the selected cut-off date (15 May 2022).
Through the keywords “matrix” and “materiality”, MMs were searched among report pages. When the launch failed, only the sections on the materiality analysis of the NFRs were manually examined by the authors. Afterwards, the results of their reading were compared and discussed.
The main output of this phase should be to highlight whether companies tend to gather based on their choice to publish MM (i.e., approaches to MM). In order to verify whether and how these groups differ in terms of the number of MM published yearly, they were compared through descriptive statistics measures.
Moreover, a Chi-square test associated the following pairs through SPSS: (i) yearly MM presentation (modes: yes/not) and yearly GRI compliance (modes: strong/medium/weak/any), and (ii) attitude toward MM presentation over the period (modes: pro MM/against MM) and attitude toward GRI compliance over the period (modes: any/weak/medium/strong/very strong). The variables chosen to perform the latter association overcame the risk of repeating observations within longitudinal data.

4.3. Phase 2: Materials and Methods

To detect the reasons behind the approaches to MM adoption, a qualitative content analysis of public responses to the ten online survey questions (Table 4) about the GRI 103 Material Topics Exposure Draft (GSSB 2020) was performed.
Developed in the 20th century as a quantitative technique (Mayring 2014), content analysis gradually spread in the social sciences (Holsti 1969; Krippendorff 2004; Weber 1990) as a family of increasingly systematic and rigorous approaches (Hsieh and Shannon 2005), which employ a wide range of document analysis techniques generating qualitative and quantitative insights (White and Marsh 2006). Several studies on company reports rely on the content analysis of responses to standard setting boards, such as, for example IASB (Damian et al. 2014), IIRC (Oprişor 2014, 2015; Reuter and Messner 2015), and SEC (Higgins et al. 2017).
The GRI’s website allows the retrieval of the Excel file containing the 144 submissions received.
By considering the text included in each Excel cell as a single comment, 1620 comments were counted. Afterwards, through four keywords (namely, matrix, matrices, visual, and graph), 14 comments (i.e., 14 excel cells) from 13 respondents were extracted. Consistently, GSSB observed that “A few respondents commented on the use of the materiality matrix included in the current Universal Standards 2016” (GSSB 2021a, p. 7).
As for the geographical provenance of the comments received, they were predominantly received from European respondents, with a percentage of 36.81% and 46.15% when all respondents and respondents commenting on MM are considered, respectively (Table 5, Panel 5A). European respondents were immediately followed by Asiatic, scoring approximately 30% in both cases.
As for the respondents’ categories, the comments were predominantly received from mediating institutions (Table 5, Panel 5B). The relative weight of mediating institutions even increased with the shift in focus from all the comments received (50.69) to only those concerning MM (69.23%). Interestingly, business enterprises represent approximately a fifth of the respondents both in the case of all the comments received (22.22%) and those comments related to MM (23.08%).
At this step, before reading the comments, we discussed which comments had to be extracted in order to be processed through the subsequent content analysis. For consistency with our research aim (i.e., to understand the NFR insiders’ viewpoint about MM), we considered whether all categories of submitters that expressed a comment on MM could have been potentially considered as useful NFR insiders. In this regard, we observed that mediating institutions could discuss and describe preparers’ practices, and business enterprises could discuss their direct experiences. Similarly, civil society organizations could provide interesting opinions on MM.
Thus, we processed all 14 comments extracted through keywords, namely all those including at least a mention of MM.
The 14 comments represented the basic text units to be further divided into smaller meaning units, to be coded during the content analysis process detailed in Figure 4.
This process relied on a mixed coding approach involving both a deductive setting (first cycle) and inductive coinage (second cycle) of codes (Mayring 2014). Small-scale data allowed human coding (Tan et al. 2020).
To enhance coding stability (Weber 1990; Krippendorff 2004; Campbell 2017), phases B, C, and D were repeated.
The intra-coder consistency was tested through percentages of agreements and Cohen’s Kappa (Lombard et al. 2002). At the end of the second round of each phase, an external auditor (Creswell 2014) solved cases of uncertainty coding.
The outcomes of these three phases are indicated in Figure 4, taken from the end of the second round.
The external expert checked the overall procedure.

5. Results

5.1. Results of Phase 1 (Materiality Matrix Adoption): Evolution, Approaches, and GRI Compliance

The first research phase detected the following aspects:
  • The evolution of MM adoption and non-adoption;
  • Approaches to MM publication;
  • MM adoption and GRI-compliant association.
As for the evolution of MM adoption, our results show that:
(i)
Overall, the majority of the companies (52 companies, i.e., 86.67% of the sample) publish an MM at least once over the period 2014–2020 in their NFRs.
(ii)
The yearly percentage of companies that present an MM increases over time and ranged between 63.33% in 2014 and 78.33% in 2017 (Figure 5). Hence, MM adoption never reached 100% because companies that ignored the visual persisted over the period and even recovered in 2019 and 2020.
Moreover, companies include an MM in one or two of the 360 NFRs regardless of the report type adopted, namely annual (40.56%), sustainability (22.22%), integrated (18.06%), social responsibility (17.78%), and materiality (1.39%) reports.
To identify the main approaches to MM adoption, the stability of the choice to publish MM was investigated on the basis of the number of changes in decisions (i.e., whether or not to publish) that occurred over time. Then, 14 detailed choices were found and marked with a-n lowercase letters (see Table 6, first step column). Remarkably, while the majority of companies steadily either published or did not publish an MM (41 companies, resulting in a total sum of “a” and “g” choices of 66.67%), a fourth (12%) was slightly less steady since they mainly began publishing after 2014 (choices b, c, d, and e) or even stopped at the end of the period (choices i and j). The remaining seven companies (11.67%) adopted a more erratic/irregular pattern of behaviour, publishing MM in discontinuous years (choices g, k, l, m, and f) or only once (choice n).
Subsequently, the detailed choices were gathered into the following approaches (Table 6):
(A)
In favour of MM adoption, i.e., cases of both steady adoption over the period and trends revealing a gradual or clear preference towards MM adoption;
(B)
Against MM adoption, i.e., cases of both steady non-adoption over the period and trends revealing MM abandonment or puzzling behaviours.
The descriptive statistics in Table 7 show that the two groups stably differed over time according to the average number of MMs published. In detail, while the mean number of MMs published yearly increases over time in the pro-MM group, it decreases in the against-MM group. The low standard deviations of both series strengthen this difference, since they indicate low dispersions, i.e., the steady homogeneity of the two groups.
Finally, the association between the yearly MM presentation and the yearly GRI compliance was examined (Table 8).
In detail, Table 8 indicates both weak (e.g., pro-MM companies in 2014) and not statistically significant (e.g., against-MM companies in 2014) associations. In two cases (e.g., pro-MM companies in 2018), any Chi-square was calculable, since the MM variable is a constant and this demonstrates in itself that no association exists. The Chi-square test conducted between the attitudes over time towards MM presentation and GRI compliance confirmed a statistically significant low association (i.e., 29.291).

5.2. Results of Phase 2 (Opinions on Materiality Matrix Adoption): Content Analysis of GRI Stakeholders’ Comments

In order to search for opinions that may have driven the two main approaches to MM adoption found in the previous research phase, the second phase performed a content analysis of responses to GSSB’s call for comments on the 2021 Exposure Draft of the GRI 103 Universal Standard.
The first coding cycle (please refer to step C of Figure 4) established two macro-categories of codes based on the two main approaches above, namely “Pro MM” and “Against MM”. Thus, the opinions expressed by the submitters about the removal of MM are encoded within these two macro-categories of codes. In detail, the “Pro MM” macro-category gathered the following arguments (expressed by seven respondents):
  • Explicitly against MM removal (i.e., concerns about the consequences of MM removal; MM abandonment without a clear alternative creates negative consequences);
  • Explicitly in favour of retaining MM (i.e., requests to include MM in the new standard; MM must be retained; a two-dimensional matrix is preferable; the standard should mention that companies can publish MMs);
  • Tacitly in favour of MM (i.e., MM can be cited within the statement of GRI use).
Instead, the “Against MM” macro-category summarized the following arguments (expressed by four respondents):
  • Explicitly in favour of MM removal (i.e., MM removal is a welcome change; the elimination of both double criteria and MM is appreciated; the move away from the matrix approach is supported; MM is no longer needed).
The demographic analysis of the two groups of respondents showed that while pro-MM opinions are predominantly expressed by European mediating institutions, against-MM opinions mainly come from both Asia and Europe, as well as from business enterprises (Table 9). Since two submitters (i.e., a Swiss civil society organization and an American mediating institution) mentioned MM without clearly expressing their position on MM, they were not included within the table.
Afterwards, through emerging codes that were hierarchically organized into code-categories and sub-codes, the second coding cycle (please refer to step D of Figure 4) coded specific arguments in support of both positions on MM (Table 10).
Remarkably, the pro-MM macro-category is internally more articulated (four code categories) and argued (17 sub-codes) than the against-MM macro-category (only one code category and three codes). The majority of the respondents proposed more than one argument each. Moreover, while the pro-MM group proposes both advantages of MM and disadvantages of MM removal, the against-MM group proposes only disadvantages of MM and does not propose any advantage of removal.
In detail, pro-MM respondents appreciate the comprehensibility and applicability of MM, its usefulness in understanding a topic’s importance and determination, its informative potential about stakeholders, and it being a visual approach that both simplifies and provides insights. Thus, in their opinion, the removal of MM would generate difficulties since it would reduce transparency in materiality evaluation. Furthermore, while they suggest MM leverage for its double role as a decision-making and communication tool, they expect a new voluntary MM based on the impact-based concept of materiality, renewed as for the axes and addressing impact significance, as well as occurrence likelihood.
On the other hand, against-MM respondents highlight that MM misleads users, encourages simplistic materiality analysis processes, and undermines both a topic’s accountability and management controls.
As Table 10 highlights in bold, the code tree obtained is consistent with the GSSB’s summary, affirming the following: “Those opposed stated that the matrix tends to encourage overly simplistic issue identification and may undermine accountability and appropriate management controls for a given topic. Those in favour stated that a visual presentation of material topics is a useful tool for understanding the relative importance of an organization’s material topics and makes materiality more transparent, understandable and applicable” (GSSB 2021a, p. 6).
However, a wider range of hierarchically organized arguments (e.g., concerns, expectations, and suggestions) were found. These arguments, besides the quantitative details provided, suggest a very interesting framework of positions on MM that are more articulated than those depicted by GSSB.
Finally, both the percentage of agreement (94.90%; 100%; 88.24%) and the Cohen’s Kappa tests (0.883, 1.00 and 0.845, all significant at the 0.01 alpha-level) performed in phases B, C, and D of the content analysis process (Figure 4) indicated strong intra-coder reliability.

6. Discussion and Conclusions

This paper first considers the disappearance of MM after its long-term inclusion in the official documents of the GRI on materiality assessment. In detail, GRI deems a two-axes matrix to no longer be needed, as the revised GRI concept of “material topics” (namely, topics that represent an organization’s most significant impacts on the economy, environment, and people) no longer encompasses two independent criteria.
In detail, besides making mandatory the final list of material topics in which the impacts were gathered (GRI 2021), GRI 3 now allows organizations to provide a visual representation of the prioritization phase, showing both the initial list of identified topics and the reporting threshold set (GRI 2021). Hence, GRI opts for a mediating solution between still providing examples of visual tools and the complete deletion of any visual.
Unfortunately, the existing literature neither foretells nor considers the removal of MM and its consequences. Moreover, the features found in the literature suggest several considerations. First of all, it was found that a few authors stress the pros and cons of the graphical nature of MM. This collides with the powerful sustainability information that graphs convey to stakeholders through NFRs (Cȕre et al. 2020). Furthermore, it was found that no study centrally links MM with the themes of opportunities and risks. However, AccountAbility noted at an early stage that the first matrices were adapted from previous risk analysis frameworks (AccountAbility 2006). Notably, along the line of pioneers that even used a third axis (AccountAbility 2006), some companies adopt a three-dimensional map, the third axis of which adds “business risks” to the “stakeholder interest” and “impacts on company’s ability to deliver on strategy” axes (Zhou and Lamberton 2011, p. 6).
In order to fill the specific gap in the literature consisting of the neglected existence of a group of companies that never included MM in their NFRs, we asked a devoted research question that this study answered through a two-phase analysis.
The results found in Phase 1 on trends in MM adoption align with the literature. Indeed, consistent with the diachronical evidence provided by the studies mentioned in Table 1, we found an increasing trend of MM adoption over the 2014–2020 period. Furthermore, novel results on the two detected main approaches to MM indicate that a minority core of MM non-adopters have reiterated their reluctance so much as to prevent the substantial takeoff of the tool. Moreover, consistently with previous studies (Garcia-Torres et al. 2017), companies include an MM into their NFRs regardless of the type of report adopted. Interestingly, it was also found that MM presentation is not linked to GRI compliance in both groups of companies. This suggests that MM was adopted with and without GRI compliance, and that MM was not adopted regardless of GRI compliance.
Moreover, the results provided by the content analysis of Phase 2, on the reasons supporting the positions in favour of and against MM, include both already known arguments (i.e., consistent with the 2021 GSSB’s summary) and novel opposing arguments. In detail, several stakeholders’ pro-MM arguments were not considered by the GRI, and very few detailed arguments against MM were provided. If considered together with the critique on MM examined in the literature, these further insights shed light on a wide range of possible drivers underlying the approaches in favour of and against MM.
All of the above makes the future graphical presentations of the MAP in NFRs uncertain, both in terms of MM use and the use of any other visual. For example, it does not seem that the new concept of material topics prevents preparers from drawing MM. Indeed, the list of material topics selected according to the new one-way impact-based criterion (i.e., a criterion that considers the most significant impacts of an organization on the economy, environment, and people) could be further enriched in terms of a visual based on two-way description (i.e., on a criterion that separately considers the company and stakeholder viewpoints on material topics). Hence, the stakeholders’ participation in the processes of identifying impacts and determining material issues will not prevent companies from making the matrix an additional source of information, where internal and external perspectives on selected material issues can be compared.
Lessons that can be learnt throughout this study overlap with policy implications for NFR standard setters, academicians, and companies, as follows.
First, the convergence of certain overly soft positions of NFR standard setters and fanciful company practices can harmfully undermine the usefulness of materiality assessment tools. GRI, for example, must avoid repeating the mistake of creating confusion in the future by assuming that rules restrict the preparers. Indeed, without minimum indications to be respected, companies can distort the original meaning of each operative instrument of MAP. When an exemplificative graphic tool is proposed, strong guidance is needed, regardless of whether it is mandatory or not. A graphic tool does not have to be automatically compulsory but, once it appears in guidelines or standards, it must be used uniquely to avoid a lack of comparability.
Second, the systematic monitoring of company practices is important. To avoid reaching an irrecoverable situation in which a tool for materiality analysis spreads among companies, straying far from the original meaning conceived by the standard setter who proposed it, early company practices must be surveyed. In this way, it could be possible to provide more precise indications as well as useful ideas and clarifications before companies consolidate their own materiality analysis processes in completely non-converging directions. In this context, the role of academicians and research centres is essential in supporting the work of standard setters.
Moreover, how to monitor practices is also important. When authors mapped the adoption of the MM, the spread was detected without considering its speed. Thus, it seems that the literature considered this growth as implicit proof of the usefulness of MM, without appropriately focusing on its intensity. In these research perspectives, our study provides evidence on how the mere mapping of the spreading of an operative tool is not enough to judge its success, since an analysis of the strength of adoption is needed to discover the underlying paths.
Third, besides surveys on the practices of an operative tool, the voices of both the preparers and readers of NFRs about the tool’s usefulness and pitfalls are of great importance. Knowledge on the effectiveness of any graphic means remains opaque without going beyond a merely descriptive mapping of its adoption. To better understand the use and usefulness of a tool, academicians must directly solicit voices involved in MAP and not settle for the adoption of a tool as proof of its usefulness.
Last but not least, relatively few companies tend to respond to calls for feedback from standard setters, and even fewer express their opinion on graphical tools. Hence, the culture of participation in the standard-setting process should be developed among companies. Larger numbers allow a wider range of arguments to be acquired both for and against the proposed instruments, and significant statistical analyses to be carried out based on several dimensions (e.g., stakeholder group, company industry, size, and country), which current numbers still prevent.
In order to overcome the main limitations of this article, some directions for future NFR research avenues on the use of graphical utilities in MAP disclosure can be provided.
First, different samples (i.e., geographically focused, cross-industry, and large samples) could be considered to better investigate the association between GRI compliance and the use of visuals, including MM, as well as between approaches to materiality assessment, including MM and the following: (i) country; (ii) industry; (iii) company’s size; and (iv) early double materiality adoption practices. As for the latter, within European countries involved in the process of issuing the proposal of a Corporate Sustainability Reporting Directive (2021/0104 (COD)), it could be interesting to investigate whether and how both pro- and against-MM approaches affect the coexistence between MM and double materiality implementation. Second, to offset the risk of MM underestimation involved in considering the publication of a visual into an NFR as proof of its adoption within the process of materiality analysis, the future mapping of materiality analysis graphical tools could consider their existence (e.g., through text citations) instead of their mere publication in reports. Third, questionnaires or interviews could be used to solicit responses from a wider range of practitioners involved within companies’ materiality assessment exercises (e.g., NFRs preparers, managers) than those responding to GSSB calls. Fourth, the voices of stakeholders (engaged or not) could be directly heard in order to understand to what extent graphical tools summarizing materiality analysis outputs are really considered useful, and what expectations users express about their setting and design (e.g., at the beginning of the report, linked to the website, clearly connected to report chapters, etc.). Fifth, “why-based” research questions could be coined and interpreted along theoretical lines, depending on the examined period of application of a standard. In detail, in the reporting period immediately after the GRI 3 came into force, mimetic isomorphisms (which generally accompany uncertainty) could be detected under the New Institutional Theory lens, as carried out, for example, by Lakshan et al. (2021) on a materiality exercise in IR. In subsequent periods, impression management (Merkl-Davies and Brennan 2007) or managerial capture (O’Dwyer 2003) lenses could be used to examine graphical choices in NFR disclosure (Cho et al. 2012a, 2012b; Jones 2011; Pesci et al. 2015, 2020) and assurance (Owen et al. 2000), respectively. Finally, the lack of in-depth knowledge on the very drivers of the MM path (i.e., full trust and mechanic compliance) could open up the use of the “path-dependency” framework (Sydow et al. 2009) to explain the stability of graphical practices adopted during the maturity of the GRI 3 application.
Meanwhile, researchers may wonder whether there will be a replacement for the matrix, and, if that be the case, who will be the first to coin it. That is to say, will new graphic tools supporting the explanation of MAP methods and outputs again stem from pioneer companies’ experiences, or will the GRI anticipate companies’ practices by proposing new graphic solutions? Regardless of who will make the first move, it is reasonable to suggest that the path of MM should not be discarded. In whatever way, it could be fruitful to build the next visuals upon the lessons learnt from the missed takeoff described in this study.

Author Contributions

Conceptualization, T.D.C.; methodology, T.D.C.; formal analysis, T.D.C.; investigation, T.D.C. and D.R.; writing—original draft preparation, T.D.C.; writing—review and editing, T.D.C. and D.R. All authors have read and agreed to the published version of the manuscript.

Funding

This research received no external funding.

Institutional Review Board Statement

Not applicable.

Informed Consent Statement

Not applicable.

Data Availability Statement

Not applicable.

Acknowledgments

The authors thank the external auditor of the content analysis and Carmela Gulluscio for the valuable support provided.

Conflicts of Interest

The authors declare no conflict of interest.

Note

1
In 2017, some respondents to the IIRC consultation on a revised International <IR> Framework mentioned or implied an expectation regarding the inclusion of an MM (IIRC 2017, p. 7). IIRC replied that MM “is more commonly associated with sustainability reports than with the Framework’s concept of materiality” (Ibidem).

References

  1. AccountAbility. 2006. The Materiality Report. Aligning Strategy, Performance and Reporting. Available online: www.accountability.org/about-us/publications/materiality.html (accessed on 5 October 2022).
  2. Adams, Carol A., Abdullah Alhamood, Xinwu He, Jie Tian, Le Wang, and Yi Wang. 2021. The Double-Materiality Concept. Application and Issues. Project Report. Global Reporting Initiative. Available online: https://dro.dur.ac.uk/33139/1/33139.pdf (accessed on 28 February 2022).
  3. Aureli, Selena, Mara Del Baldo, Rosa Lombardi, and Fabio Nappo. 2020. Nonfinancial reporting regulation and challenges in sustainability disclosure and corporate governance practices. Business Strategy and the Environment 29: 2392–403. [Google Scholar] [CrossRef]
  4. Backof, Ann G., Eric M. Negangard, and Jennifer Winchel. 2020. CSR Restatements and the Contagion Effect: An Experimental Investigation of Issue Materiality and Intent. Available online: https://papers.ssrn.com/sol3/papers.cfm?abstract_id=3388115 (accessed on 18 June 2022).
  5. Bavagnoli, Francesco, Maurizio Comoli, Lorenzo Gelmini, and Patrizia Riva. 2014. An open question in the integrated reporting: Materiality or conciseness? SSRN Electronic, September 18. [Google Scholar] [CrossRef]
  6. Beattie, Vivien, and Michael J. Jones. 2002. Measurement distortion of graphs in corporate reports: An experimental study. Accounting, Auditing and Accountability Journal 15: 546–64. [Google Scholar] [CrossRef] [Green Version]
  7. Bellandi, Francesco. 2017. Materiality in Financial Reporting: An Integrative Perspective. Bingley: Emerald Publishing Limited. [Google Scholar]
  8. Bellantuono, Nicola, Pierpaolo Pontrandolfo, and Barbara Scozzi. 2016. Capturing the stakeholders’ view in sustainability reporting: A novel approach. Sustainability 8: 379. [Google Scholar] [CrossRef] [Green Version]
  9. Bernstein, Leopold A. 1967. The concept of materiality. The Accounting Review 42: 86–95. [Google Scholar]
  10. Calabrese, Armando, Roberta Costa, Nathan Levialdi Ghiron, and Tamara Menichini. 2019. Materiality analysis in sustainability reporting: A tool for directing corporate sustainability towards emerging economic, environmental and social opportunities. Technological and Economic Development of Economy 25: 1016–38. [Google Scholar] [CrossRef] [Green Version]
  11. Campbell, David. 2017. Content analysis. In The Routledge Companion to Qualitative Accounting Research Methods. Edited by Zahirul Hoque, Lee D. Parker, Mark A. Covaleski and Kathryn Haynes. New York: Routledge, pp. 354–71. [Google Scholar]
  12. Campra, Maura, Paolo Esposito, and Rosa Lombardi. 2020. The engagement of stakeholders in nonfinancial reporting: New information-pressure, stimuli, inertia, under short-termism in the banking industry. Corporate Social Responsibility and Environmental Management 27: 1436–44. [Google Scholar] [CrossRef]
  13. Cho, Charles H., Giovanna Michelon, and Dennis M. Patten. 2012a. Enhancement and obfuscation through the use of graphs in sustainability reports. Sustainability Accounting, Management and Policy Journal 3: 74–88. [Google Scholar] [CrossRef]
  14. Cho, Charles H., Giovanna Michelon, and Dennis M. Patten. 2012b. Impression management in sustainability reports: An empirical investigation of the use of graphs. Accounting and the Public Interest 12: 16–37. [Google Scholar] [CrossRef]
  15. Cohen, Elaine. 2014. Why the Materiality Matrix is Useless. CSR Reporting. Available online: http://csr-reporting.blogspot.com/2014/12/why-materiality-matrix-is-useless.html (accessed on 22 February 2022).
  16. Cooper, Stuart, and Giovanna Michelon. 2022. Conceptions of materiality in sustainability reporting frameworks: Commonalities, differences and possibilities. In Handbook of Accounting and Sustainability. Edited by Carol A. Adams. Cheltenham: Edward Elgar Publishing, pp. 44–66. [Google Scholar]
  17. Costa, Roberta, Tamara Menichini, and Gennaro Salierno. 2022. Do SDGs Really Matter for Business? Using GRI Sustainability Reporting to Answer the Question. European Journal of Sustainable Development 11: 113–13. [Google Scholar] [CrossRef]
  18. Creswell, John W. 2014. Research Design. Qualitative, Quantitative, and Mixed Methods Approaches, 4th ed. New York: SAGE. [Google Scholar]
  19. Cȕre, Tuvana, Emel Esen, and Arzu Özsözgün Çalişkan. 2020. The role of graphs in environmental disclosures: An empirical evidence from Turkey. Eurasian Business and Economics Journal 22: 12–27. [Google Scholar] [CrossRef]
  20. Damian, Maria Ionela, Sorana Mihaela Manoiu, Carmen Giorgiana Bonaci, and Jiři Strouhal. 2014. Bearer plants: Stakeholders’ view on the appropriate measurement model. Accounting and Management Information Systems 13: 719–38. [Google Scholar]
  21. De Cristofaro, Tiziana. 2022. Materiality. In Encyclopedia of Sustainable Management. Edited by Samuel O. Idowu, René Schmidpeter, Nicholas Capaldi, Liangrong Zu, Mara Del Baldo and Rute Abreu. Cham: Springer, pp. 1–10. [Google Scholar] [CrossRef]
  22. De Cristofaro, Tiziana, and Carmela Gulluscio. 2019. Integrated Reporting and Materiality Process Disclosure in European Sustainability Oriented Companies. In Integrated Reporting: Antecedents, Perspectives/Outlooks, for Organizations and Stakeholders. Edited by Samuel O. Idowu and Mara Del Baldo. Cham: Springer International Publishing, pp. 267–90. [Google Scholar]
  23. Eccles, Robert G., Michael P. Krzus, and Liv A. Watson. 2012. Integrated Reporting Requires Integrated Assurance in Effective Auditing for Corporates: Key Developments in Practice and Procedures. Edited by Joe Oringel. London: Bloomsbury Information Ltd., pp. 161–78. [Google Scholar]
  24. Eccles, Robert G., Michael P. Krzus, and Simon Ribot. 2015. The Integrated Reporting Movement. Meaning, Momentum, Motives, and Materiality. Hoboken: John Wiley and Sons. [Google Scholar]
  25. Edgley, Carla. 2014. A genealogy of accounting materiality. Critical Perspectives on Accounting 25: 255–71. [Google Scholar] [CrossRef]
  26. Edgley, Carla, Michael J. Jones, and Jill Atkins. 2015. The adoption of the materiality concept in social and environmental reporting assurance: A field study approach. The British Accounting Review 47: 1–18. [Google Scholar] [CrossRef] [Green Version]
  27. Farooq, Muhammad Bilal, and Charles de Villiers. 2019. Understanding how managers institutionalise sustainability reporting: Evidence from Australia and New Zealand. Accounting, Auditing and Accountability Journal 32: 1240–69. [Google Scholar] [CrossRef]
  28. Farooq, Muhammad Bilal, Zaman Rashid, Dania Sarraj, and Fahad Khalid. 2021. Examining the extent of and drivers for materiality assessment disclosures in sustainability reports. Sustainability Accounting, Management and Policy Journal 12: 965–1002. [Google Scholar] [CrossRef]
  29. Ferrero-Ferrero, Idoya, Raúl León, and María Jesús Muñoz-Torres. 2021. Sustainability materiality matrices in doubt: May prioritizations of aspects overestimate environmental performance? Journal of Environmental Planning and Management 64: 432–63. [Google Scholar] [CrossRef]
  30. Formisano, Vincenzo, Maria Fedele, and Mario Calabrese. 2017. Materiality matrix: A comparison between relevant indicators for banks and stakeholder. Paper presented at the 20th Excellence in Services International Conference (EISIC) Proceedings, Verona, Italy, September 7–8; Available online: https://sites.les.univr.it/eisic/wp-content/uploads/2018/07/20-EISIC-Formisano-Fedele-Calabrese.pdf (accessed on 18 June 2022).
  31. Garcia-Torres, Sofia, Marta Rey-Garcia, and Laura Albareda-Vivo. 2017. Effective disclosure in the fast-fashion industry: From sustainability reporting to action. Sustainability 9: 2256. [Google Scholar] [CrossRef]
  32. Geldres-Weiss, Valeska V., Nicolàs Gambetta, Nathaniel Massa, and Skania L. Geldres-Weiss. 2021. Materiality matrix use in aligning and determining a firm’s sustainable business model archetype and triple bottom line impact on stakeholders. Sustainability 13: 1065. [Google Scholar] [CrossRef]
  33. Gelmini, Lorenzo, Francesco Bavagnoli, Maurizio Comoli, and Patrizia Riva. 2015. Waiting for Materiality in the Context of Integrated Reporting: Theoretical Challenges and Preliminary Empirical Findings. In Sustainability Disclosure: State of the Art and New Directions. Edited by Lucrezia Songini and Anna Pistoni. Studies in Managerial and Financial Accounting. Bingley: Emerald Group Publishing Limited, vol. 30, pp. 135–63. [Google Scholar] [CrossRef]
  34. Gerwanski, Jannik, Othar Kordsachia, and Patrick Velte. 2019. Determinants of materiality disclosure quality in integrated reporting: Empirical evidence from an international setting. Business Strategy and the Environment 28: 750–70. [Google Scholar] [CrossRef]
  35. GRI—Global Reporting Initiative. 2006. Sustainability Reporting Guidelines. 2000–2006 GRI Version 3.0. Available online: https://www.globalreporting.org (accessed on 28 February 2020).
  36. GRI—Global Reporting Initiative. 2011a. Sustainability Reporting Guidelines. 2000–2011 GRI Version 3.1. Available online: https://www.globalreporting.org (accessed on 28 February 2020).
  37. GRI—Global Reporting Initiative. 2011b. Technical Protocol. Applying the Report Content Principles. GRI Version 3.1. Available online: https://www.globalreporting.org (accessed on 28 February 2020).
  38. GRI—Global Reporting Initiative. 2013. G4 Sustainability Reporting Guidelines. Implementation Manual. Available online: https://www.globalreporting.org (accessed on 28 February 2020).
  39. GRI—Global Reporting Initiative. 2016. GRI 101: Foundation. Available online: https://www.globalreporting.org/standards/media/1036/gri-101-foundation-2016.pdf (accessed on 26 May 2020).
  40. GRI—Global Reporting Initiative. 2021. GRI 3: Material Topics 2021. Available online: https://www.globalreporting.org/how-to-use-the-gri-standards/gri-standards-english-language/ (accessed on 28 March 2021).
  41. GRI—Global Reporting Initiative. 2022. GRI Universal Standards 2021 Frequently Asked Questions (FAQs) January 2022. Available online: https://www.globalreporting.org/media/zauil2g3/public-faqs-universal-standards.pdf (accessed on 12 August 2020).
  42. GSSB—Global Sustainability Standards Board. 2019. Review of GRI’s Universal Standards—Project Proposal. Available online: https://www.globalreporting.org/media/tyghiekh/universal_standards_final_project_proposal_approved.pdf (accessed on 28 March 2022).
  43. GSSB—Global Sustainability Standards Board. 2020. GRI Universal Standards: GRI 101, GRI 102, and GRI 103—Exposure Draft (June 2020). Available online: https://www.globalreporting.org/standards/media/2605/universal-exposure-draft.pdf (accessed on 28 March 2022).
  44. GSSB—Global Sustainability Standards Board. 2021a. GRI Universal Standards Project—GSSB Basis for Conclusions. Summary of Public Comments on the Exposure Draft of the Standards, and GSSB Responses (October 2021). Available online: https://www.globalreporting.org/media/0ymfh0xu/gssb-basis-for-conclusions_gri-universal-standards-project.pdf (accessed on 28 March 2022).
  45. GSSB—Global Sustainability Standards Board. 2021b. Item 08—GRI Universal Standards Project—Revised GRI 103: Material Topics for GSSB Discussion (February 2021). Available online: https://www.globalreporting.org/media/s4qlicgs/item-08-gri-universal-standards-project-revised-gri-103-material-topics.pdf (accessed on 28 March 2022).
  46. Guix, Mireia, Maria Jesús Bonilla-Priego, and Xavier Font. 2018. The process of sustainability reporting in international hotel groups: An analysis of stakeholder inclusiveness, materiality and responsiveness. Journal of Sustainable Tourism 26: 1063–84. [Google Scholar] [CrossRef]
  47. Guix, Mireia, Xavier Font, and Maria Jesús Bonilla-Priego. 2019. Materiality: Stakeholder accountability choices in hotels’ sustainability reports. International Journal of Contemporary Hospitality Management 31: 2321–38. [Google Scholar] [CrossRef] [Green Version]
  48. Hicks, Ernest L. 1964. Materiality. Journal of Accounting Research 2: 158–71. [Google Scholar] [CrossRef]
  49. Higgins, Keith, Alan Beller, John White, and Mary Schapiro. 2017. The SEC and improving sustainability reporting. Journal of Applied Corporate Finance 29: 22–31. [Google Scholar] [CrossRef]
  50. Holmes, William. 1972. Materiality—Through the looking glass. Journal of Accountancy 133: 44–49. [Google Scholar]
  51. Holsti, Ole R. 1969. Content Analysis for the Social Sciences and Humanities. Reading: Addison-Wesley. [Google Scholar]
  52. Hsieh, Hsiu-Fang, and Sarah E. Shannon. 2005. Three approaches to qualitative content analysis. Qualitative Health Research 15: 1277–88. [Google Scholar] [CrossRef]
  53. IIRC—International Integrated Reporting Council. 2013. Materiality. Background Paper for <IR>. Available online: https://www.integratedreporting.org/wp-content/uploads/2013/03/IR-Background-Paper-Materiality.pdf (accessed on 10 June 2022).
  54. IIRC—International Integrated Reporting Council. 2015. Materiality in <IR>. Guidance for the Preparation of Integrated Reports (November 2015). Available online: https://www.integratedreporting.org/wp-content/uploads/2015/11/1315_MaterialityinIR_Doc_4a_Interactive.pdf (accessed on 10 June 2022).
  55. IIRC—International Integrated Reporting Council. 2017. International <IR> Framework Implementation Feedback. Summary Report. Available online: http://www.integratedreporting.org/wp-content/uploads/2017/10/Framework_feedback_Sum2017.pdf (accessed on 10 June 2022).
  56. Jebe, Ruth. 2017. Corporate Sustainability Reporting and Material Information: An Empirical Study of Materiality under the GRI and Frameworks. Connecticat Journal of International Law 33: 95–135. [Google Scholar]
  57. Jones, Michael J. 2011. The nature, use and impression management of graphs in social and environmental accounting. Accounting forum 35: 75–89. [Google Scholar] [CrossRef]
  58. Jones, Peter. 2016. Materiality in corporate sustainability reporting: A research note on the UK’s leading food retailers. International Journal of Management Cases 18: 42–56. [Google Scholar]
  59. Jones, Peter, Daphne Comfort, and David Hillier. 2016a. Managing materiality: A preliminary examination of the adoption of the new GRI G4 guidelines on materiality within the business community. Journal of Public Affairs 16: 222–30. [Google Scholar] [CrossRef]
  60. Jones, Peter, Daphne Comfort, and David Hillier. 2016b. Materiality and external assurance in corporate sustainability reporting: An exploratory study of Europe’s leading commercial property companies. Journal of European Real Estate Research 9: 147–70. [Google Scholar] [CrossRef] [Green Version]
  61. Jones, Peter, Daphne Comfort, and David Hillier. 2016c. Materiality in corporate sustainability reporting within UK retailing. Journal of Public Affairs 16: 81–90. [Google Scholar] [CrossRef]
  62. Jørgensen, Sveinung, Aksel Mjøs, and Lars J. T. Pedersen. 2021. Sustainability reporting and approaches to materiality: Tensions and potential resolutions. Sustainability Accounting, Management and Policy Journal 13: 341–61. [Google Scholar] [CrossRef]
  63. Karagiannis, Ioannis, Panagiotis Vouros, Nikolaos Sioutas, and Konstantinos Evangelinos. 2022. Mapping the maritime CSR agenda: A cross-sectoral materiality analysis of sustainability reporting. Journal of Cleaner Production 338: 130139. [Google Scholar] [CrossRef]
  64. Krippendorff, Klaus. 2004. Content Analysis. An Introduction to Its Methodology. London: Sage. [Google Scholar]
  65. Kuisma, Jouko. 2017. Managing Corporate Responsibility in the Real World. Cham: Palgrave Macmillan. [Google Scholar]
  66. Kurniawan, Putu S., Dewi I. G. P. Banu, Sujana Astawa, and Luh G. K. Dewi. 2019. An Analysis of Information Materiality on Corporate Sustainability Report: A Comprehensive Study from Mining Industry in Indonesia. Advances in Economics, Business and Management Research 69: 91–97. [Google Scholar] [CrossRef] [Green Version]
  67. Lai, Alessandro, Gaia Melloni, and Riccardo Stacchezzini. 2017. What does materiality mean to integrated reporting preparers? An empirical exploration. Meditari Accountancy Research 25: 533–52. [Google Scholar] [CrossRef] [Green Version]
  68. Lakshan, A. M. I., Mary Low, and Charl de Villiers. 2021. Challenges of, and techniques for, materiality determination of non-financial information used by integrated report preparers. Meditari Accountancy Research 30: 626–60. [Google Scholar] [CrossRef]
  69. Lombard, Mattew, Jennifer Snyder-Duch, and Cheryl C. Bracken. 2002. Content analysis in mass communication: Assessment and reporting of intercoder reliability. Human Communication Research 28: 587–604. [Google Scholar] [CrossRef]
  70. López-Arceiz, Francisco J., Cristina Del Río, and Ana J. Bellostas. 2020a. Sustainability performance indicators: Definition, interaction, and influence of contextual characteristics. Corporate Social Responsibility and Environmental Management 27: 2615–30. [Google Scholar] [CrossRef]
  71. López-Arceiz, Francisco J., Rafael Santamaría Aquilué, and Cristina Del Río. 2020b. Sustainability for European investors: Evidence from a sustainable ranking. Revista de Contabilidad-Spanish Accounting Review 23: 148–66. [Google Scholar] [CrossRef]
  72. Lubinger, Melanie, Judith Frei, and Dorothea Greiling. 2019. Assessing the materiality of university G4-sustainability reports. Journal of Public Budgeting, Accounting and Financial Management 31: 364–91. [Google Scholar] [CrossRef]
  73. Madasu, Pardhasaradhi. 2019. Growing Relevance of ‘Materiality’ in Sustainability Reporting. Srusti Management Review 12: 14–23. [Google Scholar]
  74. Mathur, Sandeep, and Ravinder Kumar. 2019. Materiality analysis of SCM issues for Competitive Advantage: Study of an Indian FMEG Organization. In IOP Conference Series: Materials Science and Engineering, Paper presented at the 2nd International Conference on Computational & Experimental Methods in Mechanical Engineering, Greater Noida, India, May 3–5. Greater Noida: GL Bajaj Institute of Technology and Management, vol. 691. [Google Scholar]
  75. Mayring, Philipp. 2014. Qualitative Content Analysis. Theoretical Foundation, Basic Procedures and Software Solution. Available online: https://www.ssoar.info/ssoar/handle/document/39517 (accessed on 17 September 2022).
  76. McElroy, Mark W. 2011. Are Materiality Matrices Really Material? December 2. Available online: http://www.sustainablebrands.com/news_and_views/articles/are-materiality-matrices-really-material (accessed on 7 March 2022).
  77. Merkl-Davies, Doris M., and Niamh Brennan. 2007. Discretionary disclosure strategies in corporate narratives: Incremental information or impression management? Journal of Accounting Literature 26: 116–96. [Google Scholar]
  78. Mio, Chiara. 2013. Materiality and Assurance: Building the link. In Integrated Reporting: Concepts and Cases That Redefine Corporate Accountability. Edited by Cristiano Busco, Mark L. Frigo, Angelo Riccaboni and Paolo Quattrone. Berlin/Heidelberg: Springer International Publishing, pp. 79–94. [Google Scholar]
  79. Mio, Chiara, and Marco Fasan. 2013. Materiality from Financial Towards Non-Financial Reporting. Working Paper Series 19/2013; Venice: Università Ca’ Foscari. Available online: http://virgo.unive.it/wpideas/storage/2013wp19.pdf (accessed on 27 May 2022).
  80. Mio, Chiara, and Marco Fasan. 2014. The Determinants of Materiality Disclosure in Integrated Corporate Reporting. Working Paper Series 9/2014; Venice: Università Ca’ Foscari. [Google Scholar] [CrossRef]
  81. Mio, Chiara, Marco Fasan, and Antonio Costantini. 2020. Materiality in integrated and sustainability reporting: A paradigm shift? Business Strategy and the Environment 29: 306–20. [Google Scholar] [CrossRef]
  82. Morrós, Ribera Jordi. 2017. Materiality in sustainability reporting: Multiple standards and looking for common principles and measurement. The case of the seven biggest groups in Spain. European Accounting and Management Review 4: 108–47. [Google Scholar] [CrossRef]
  83. O’Dwyer, Brendan. 2003. Conceptions of corporate social responsibility: The nature of managerial capture. Accounting, Auditing and Accountability Journal 16: 523–57. [Google Scholar] [CrossRef] [Green Version]
  84. Oprişor, Tudor. 2014. Contributions to an improved framework for integrated reporting. AMIS 2014: 1043. [Google Scholar]
  85. Oprişor, Tudor. 2015. Auditing integrated reports: Are there solutions to this puzzle? Procedia Economics and Finance 25: 87–95. [Google Scholar] [CrossRef] [Green Version]
  86. Ortar, Liad. 2016. From flexibility to specificity: Practical lessons from comparing materiality in sustainability reports of the world’s largest financial institutions. International Journal of Corporate Strategy and Social Responsibility 1: 44–64. [Google Scholar] [CrossRef]
  87. Ortar, Liad. 2020. Materiality Matrixes in Sustainability Reporting: An Empirical Examination. Journal of Strategic Innovation and Sustainability 15: 108–33. [Google Scholar] [CrossRef]
  88. Owen, David L., Tracey A. Swift, Christopher Humphrey, and Mary Bowerman. 2000. The new social audits: Accountability, managerial capture or the agenda of social champions? European Accounting Review 9: 81–98. [Google Scholar] [CrossRef]
  89. Pesci, Caterina, Ericka Costa, and Teerooven Soobaroyen. 2015. The forms of repetition in social and environmental reports: Insights from Hume’s notion of ‘impressions’. Accounting and Business Research 45: 765–800. [Google Scholar] [CrossRef] [Green Version]
  90. Pesci, Caterina, Luca Fornaciari, Alice Medioli, Silvia Triani, and Teerooven Soobaroyen. 2020. Can Graphs in Sustainability Reports Actually Manage Impressions? An Analysis from the Investors’ Perspective. In Accounting, Accountability and Society. Edited by Mara Del Baldo, Jesse Dillard, Maria-Gabriella Baldarelli and Massimo Ciambotti. Cham: Springer, pp. 225–43. [Google Scholar]
  91. Pizzi, Simone, Andrea Venturelli, and Fabio Caputo. 2020. The “comply-or-explain” principle in directive 95/2014/EU. A rhetorical analysis of Italian PIEs. Sustainability Accounting, Management and Policy Journal 12: 30–50. [Google Scholar] [CrossRef]
  92. Puroila, Jenni, and Hannele Mäkelä. 2019. Matter of opinion: Exploring the socio-political nature of materiality disclosures in sustainability reporting. Accounting, Auditing and Accountability Journal 32: 1043–72. [Google Scholar] [CrossRef]
  93. Reimsbach, Daniel, Frank Schiemann, Rüdiger Hahn, and Eric Schmiedchen. 2020. In the eyes of the beholder: Experimental evidence on the contested nature of materiality in sustainability reporting. Organization and Environment 33: 624–51. [Google Scholar] [CrossRef]
  94. Reuter, Marek, and Martin Messner. 2015. Lobbying on the integrated reporting framework: An analysis of comment letters to the 2011 discussion paper of the IIRC. Accounting, Auditing and Accountability Journal 28: 365–402. [Google Scholar] [CrossRef]
  95. Ruiz-Lozano, Mercedes, Marta De Vicente-Lama, Pilar Tirado-Valencia, and Magdalena Cordobes-Madueno. 2021. The disclosure of the materiality process in sustainability reporting by Spanish state-owned enterprises. Accounting, Auditing and Accountability Journal 35: 385–412. [Google Scholar] [CrossRef]
  96. Saenz, Cesar. 2019. Creating shared value using materiality analysis: Strategies from the mining industry. Corporate Social Responsibility and Environmental Management 26: 1351–60. [Google Scholar] [CrossRef]
  97. Sepúlveda-Alzate, Yully M., Maria A. García-Benau, and Mauricio Gómez-Villegas. 2021. Materiality assessment: The case of Latin American listed companies. Sustainability Accounting, Management and Policy Journal 13: 88–113. [Google Scholar] [CrossRef]
  98. Slacik, Johannes, and Dorothea Greiling. 2019. Compliance with materiality in G4-sustainability reports by electric utilities. International Journal of Energy Sector Management 14: 583–608. [Google Scholar] [CrossRef]
  99. Sydow, Jörg, Georg Schreyögg, and Jochen Koch. 2009. Organizational path dependence: Opening the black box. Academy of Management Review 34: 689–709. [Google Scholar] [CrossRef] [Green Version]
  100. Tan, Yongtao, Chenyang Shuai, Liyin Shen, Lei Hou, and Guomin Zhang. 2020. A study of sustainable practices in the sustainability leadership of international contractors. Sustainable Development 28: 697–710. [Google Scholar] [CrossRef]
  101. Taubken, Norbert, and Tim Y. Feld. 2018. Impact measurement and the concept of materiality—New requirements and approaches for materiality assessments. Nachhaltigkeits Management Forum Sustainability Management Forum 26: 87–100. [Google Scholar] [CrossRef]
  102. Tibiletti, Veronica, Pier Luigi Marchini, Katia Furlotti, and Alice Medioli. 2021. Does corporate governance matter in corporate social responsibility disclosure? Evidence from Italy in the “era of sustainability”. Corporate Social Responsibility and Environmental Management 28: 896–907. [Google Scholar] [CrossRef]
  103. Torelli, Riccardo, Federica Balluchi, and Katia Furlotti. 2019. The materiality assessment and stakeholder engagement: A content analysis of sustainability reports. Corporate Social Responsibility and Environmental Management 27: 470–84. [Google Scholar] [CrossRef]
  104. Tucker, Basil, and Zahirul Hoque. 2017. Mixed methods for understanding accounting issues. In The Routledge Companion to Qualitative Accounting Research Methods. Edited by Zahirul Hoque, Lee D. Parker, Mark A. Covaleski and Kathryn Haynes. London: Routledge, pp. 301–20. [Google Scholar]
  105. Varachia, Zakiyyah, and Yaeesh Yasseen. 2020. The use of graphs as an impression management tool in the annual integrated reports of South African listed entities. Journal of Economic and Financial Sciences 13: 1–11. [Google Scholar] [CrossRef]
  106. Weber, Robert P. 1990. Basic Content Analysis. London: Sage. [Google Scholar]
  107. Wee, Marwin, Ann Tarca, Lee Krug, Walter Aerts, Penelope Pink, and Matthew Tilling. 2016. Factors Affecting Preparers’ and Auditors’ Judgements about Materiality and Conciseness in Integrated Reporting. London: ACCA. Available online: https://research.tilburguniversity.edu/en/publications/factors-affecting-preparers-and-auditors-judgements-about-materia (accessed on 20 April 2022).
  108. White, Marilyn, and Emily E. Marsh. 2006. Content analysis: A flexible methodology. Library Trends 55: 22–45. [Google Scholar] [CrossRef]
  109. Zhou, Yining, and Geoff Lamberton. 2011. Stakeholder diversity versus stakeholder general views: A theoretical gap in sustainability materiality conception. Paper presented at the 1st World Sustainability Forum, Basel, Switzerland, November 1–30. [Google Scholar]
Figure 1. Examples of first materiality matrices in standard setters’ documents: a rielaboration of axes labels and graphical formats in 2006 GRI Guidelines.
Admsci 12 00186 g001
Figure 2. GRI materiality matrices, 2011–2016: a rielaboration of the graphical formats.
Admsci 12 00186 g002
Figure 3. 2021 GRI 3 process to determine material topics: a schematization.
Admsci 12 00186 g003
Figure 4. Content analysis process of the examined comments on the GRI 103 Universal Standard.
Admsci 12 00186 g004
Figure 5. Materiality matrix adoption and non-adoption over time.
Admsci 12 00186 g005
Table 1. Empirical findings on materiality matrix adoption in existent sample-based works *.
ReferenceSample Analysed and
Reports Examined
Percentages Found by Years
CountryIndustryNo Report2008200920102011201220132014201520162017201820192020
Ortar (2016)WBanks 5SR0.45 ¶
Tibiletti et al. (2021)ItalyC-I200SRR25.4 † 25.4 † 25.4 †
Eccles et al. (2012)WC-I800SR 8.88 ¶
Bavagnoli et al. (2014)EURC-I32IR 28
Slacik and Greiling (2019)WELU-SR 58
Jebe (2017)WC-I 96SR, IR 37.5
De Cristofaro and Gulluscio (2019)EURC-I 108IR 69.44
Karagiannis et al. (2022)WMAR42SR 42.86
Lubinger et al. (2019)WUNI33SR 48.48¶
Torelli et al. (2019)ItalyC-I 152 NFR 66
Costa et al. (2022)WTOU49SR 43%
* Key: W, worldwide; EUR, Europe; C-I, cross-industry; ELU, electric utilities; MAR, maritime; UNI, university; TOU, tourism; SRR, social responsibility reports; IR, integrated reports; SR, sustainability reports; NFR, non-financial reports. (†) Percentage of the three years considered. (¶) Author’s calculation.
Table 2. Research design.
Phase FeaturePhase 1 (Quantitative)Phase 2 (Qualitative)
Fraction of research question answered What approaches to MM adoption emerged over time?Why did certain approaches to MM adoption emerge?
How viewpoints on MM are captured IndirectlyDirectly
Focused insidersNFRs preparersGRI stakeholders
Data source2014–2020/21 non-financial reportsPublic comments on Exposure Draft of the Universal Standards GRI 103: Material Topics (GSSB 2020)
RationaleBoth MM publication and non publication as tacit proof of preparers’ positions about MM adoptionComments on MM as explicit proof of insiders’ opinions of MM
Analysed aspects (tools of analysis used are indicated between brackets)Evolution of MM publication
(percentages and graphs)
Submitters examined by approaches,
category, and country (absolute values)
Approaches to MM adoption
(descriptive statistics)
Approaches to MM
(qualitative content analysis)
Association between MM adoption and GRI compliance (Chi-square)Arguments expressed on MM
(qualitative content analysis)
Table 3. Sampling.
Table 3. Sampling.
Criteria of Inclusion Resulting Number of Companies
Initial list of companies: companies included at least once in the RobecoSAM Yearbooks (years 2014–2021)1028
Minus: 849 companies not included in all eight 2015–2022 Yearbooks 179
Minus: 118 companies that did not consistently receive the yearly RobecoSAM medals over the selected period 61
Minus: one company that does not publish online pdf versions in English of its NFRs 60 (the sample)
Table 4. The GSSB survey questions on the GRI 103 Universal Standard exposure draft: themes.
QuestionTheme
1Key concepts in the GRI standards
2Using the GRI standards for sustainability reporting
3 and 4Statement of use
5Governance
6Identifying material topics
7 and 8Reporting on material topics
9Structure of the universal standards
10Other comments
Table 5. Respondents to the 2021 Universal Standards exposure draft: demography.
Panel 5A. Geographical Provenance.
ContinentRespondents
OverallCommenting MM
(No. 144)% (Out of 144)(No. 13)% (Out of 13)
Africa74.86--
Asia4430.56430.77
Europe5336.81646.15
America3121.53215.38
Oceania53.4717.69
Not stated42.78--
Panel 5B. Categories.
CategoryRespondents
OverallCommenting MM
(No. 144)% (Out of 144)(No. 13)% (Out of 13)
Business enterprise3222.22323.08
Civil society organization2315.9717.69
Investment institution106.94--
Labour organization42.78--
Mediating institution7350.69969.23
Not stated21.39--
Table 6. Main approaches to MM publishing in 2014–2020 non-financial reports: steps.
First Step—Detection of Choice to
Publish MM according to Stability
Second Step—Aggregation of
Detailed Choices of Approaches
Detailed ChoicesAbs%Approaches to MMAbs%
(a) Always published3355.00A—In favour of MM adoption4575.00
(b) Always published from 2015 onwards46.67
(c) Always published from 2016 onwards35.00
(d) Always published from 2017 onwards23.33
(e) Always published from 2018 onwards11.67
(f) Not published only in 2017 and 201911.67
(g) Not published only in 2017 and 202011.67
(h) Never published813.33B—Against MM adoption1525.00
(i) No more published from 201811.67
(j) No more published from 201711.67
(k) Published only in 2016 and 201711.67
(l) Published only in 2017 and 201811.67
(m) Not published in 2017, 2019, and 202011.67
(n) Published only in 202023.33
Table 7. Materiality matrices published over the period 2014–2020: descriptive statistics *.
CompaniesMeasures2014201520162017201820192020
SampleMean0.620.770.870.870.970.920.92
Standard Deviation0.550.590.590.620.630.630.61
Pro MMMean0.730.931.021.071.241.181.18
Standard Deviation0.490.490.450.490.430.440.44
Against MMMean0.270.270.400.270.1300.13
Standard Deviation0.570.570.710.570.340.000.34
(*) The distributions used count twice the matrices that are published in two reports (regardless of their being identical or not).
Table 8. Statistical association between yearly MM presentation and yearly GRI compliance: Chi-square.
YearPro-MM
Companies (No. 45)
Against-MM
Companies (No. 15)
Overall
(No. 60)
201419.688 *1.45820.400 *
20158.2262.29215.485 *
20160.5200.9386.319
20170.5173.39312.243 **
2018Not calculable3.46217.111 *
20190.157Not calculable25.390 *
20200.1574.9044.432
* Significant at the 0.01 alpha level. ** Significant at the 0.05 alpha level.
Table 9. Two main groups of opinions on MM: submitter demographics.
Panel 9A. The “Pro-MM Group” (7 Respondents) Examined by Stakeholder Category and Geographical Provenance.
ContinentCountryMediating Institution (No. 7)Totals
ContinentCountry
AsiaHong Kong121
Russian Federation1 1
EuropeItaly141
Switzerland1 1
United Kingdom1 1
North AmericaUnited States111
OceaniaAustralia111
Panel 9B. The “Against-MM Group” (4 Respondents) Examined by Stakeholder Category and Geographical Provenance.
ContinentCountryBusiness
Enterprise (No. 3)
Mediating
Institution (No. 1)
Totals
ContinentCountry
AsiaHong Kong1-21
Malaysia1- 1
EuropeItaly1-21
United Kingdom-1 1
Table 10. Content analysis output: the code tree.
Code Macro-CategoriesCode Categories Sub-Codes
LabelLabelNoLabel ‡
A. Pro-MMMM advantages6(a2) MM fosters transparency.
(c1) The MM y-axis has a double potential (impact significance and scaling).
(a2) MM is useful to understand the relative importance of topics and the reasons behind their materiality.
(b3) The MM visual approach provides insights to users.
(a2) MM shows stakeholder assessments.
(a3ii) MM is understandable and applicable.
MM removal
disadvantages
4(e1) MM removal generates difficulties for preparers.
(e2) MM removal reduces transparency on material topics evaluation.
(b4) MM reshaping would weaken the stakeholder engagement concept.
(a4) MM removal without providing alternatives will create confusion, inconsistency, and incomparability.
Expected MM features5(e4) MM should be both a decision-making and communication tool.
(a2) MM should be voluntary.
(a3) MM should be presented according to the new impact-based materiality concept.
(b1) The MM axes have to be specified (e.g., impact probability/severity).
(b2) The MM axes have to be redefined.
Suggestions for MM2(e5) Both MM and other tools could be leveraged.
(e6) A new MM addressing both impact significance and occurrence likelihood could be considered.
B. Against-MMMM disadvantages3(a2) MM misleads.
(b3) MM encourages simplistic issue identification.
(b4) MM undermines a topic’s accountability and management controls.
‡ Words in bold indicate arguments included in the GSSB’s summary (GSSB 2021a, p. 7). Each sub-code scores one.
Publisher’s Note: MDPI stays neutral with regard to jurisdictional claims in published maps and institutional affiliations.

