Evaluation of Product Development Success: A Student Perspective


Abstract
:1. Introduction
- purpose and direction: a common understanding of the project goals is worthwhile,
- authenticity: a trusting relationship among the project team members and the stakeholders allows for integrity;
- devolved decision-making: authorization of the team members can speed up problem solutions;
- collaborative achievements: project outcome is the result of shared efforts, and effective performance requires collaboration;
- agility: adaptation to the changing requirements is required in line with the purposes.
2. Literature Review
2.1. Approach to New Product Development
- Marketing, product, and production task integration with management focus according to Olsson (1985) and Andreasen and Hein (1987);
- Simultaneous optimization of the product and its production processes, according to Ehrlenspiel (1991);
2.2. Project Success
- The elements of project management competency, including behavioral, technical, and contextual competencies of project manager and project team members;
- Organizational culture, structure, competence, atmosphere;
- Project management methodologies, software, tools, techniques, risk assessment tools, and communication support tools.
- Product: the characteristics of the new product project or the product itself;
- Business: Drivers of success for the business, including organizational and strategic factors such as the business’s innovation strategy and how it makes its R&D investment decisions; climate and culture; leadership; and how the firm organizes for NPD;
- Methods: the systems and methods applied for managing new product development.
2.3. Project Failures
- the implementation process itself, internal efficiency;
- the perceived value, quality of the project deliverables;
- client satisfaction with the delivered project, external efficiency.
- Senior management is not sufficiently involved;
- Too many requirements and scope changes;
- Lack of necessary management skills;
- Over budget;
- Lack of necessary technical skills;
- No more need for the system to be developed;
- Over schedule;
- Technology is too new; it does not work as expected;
- Insufficient staff;
- Critical quality problems with software;
- End users are not sufficiently involved.
- Lack of commitment and support from top management;
- Poor communication practices;
- Incompetent team;
- Inadequate training and learning;
- Faulty selection of process improvement methodology and its associated tools/techniques;
- Inappropriate rewards and recognition system/culture;
- Scope creep;
- Sub-optimal team size and composition;
- Inconsistent monitoring and control (lack of expert supervision);
- Resistance to change (partial cooperation by employees).
3. Research Design
3.1. Research Goal
- RQ1: What level of regulation is considered appropriate by the students?
- RQ2: What are the main barriers to product development projects’ success based on the students’ judgment?
- RQ3: Can patterns be explored in the students’ judgment?
3.2. Research Instrument and Analysis Methods
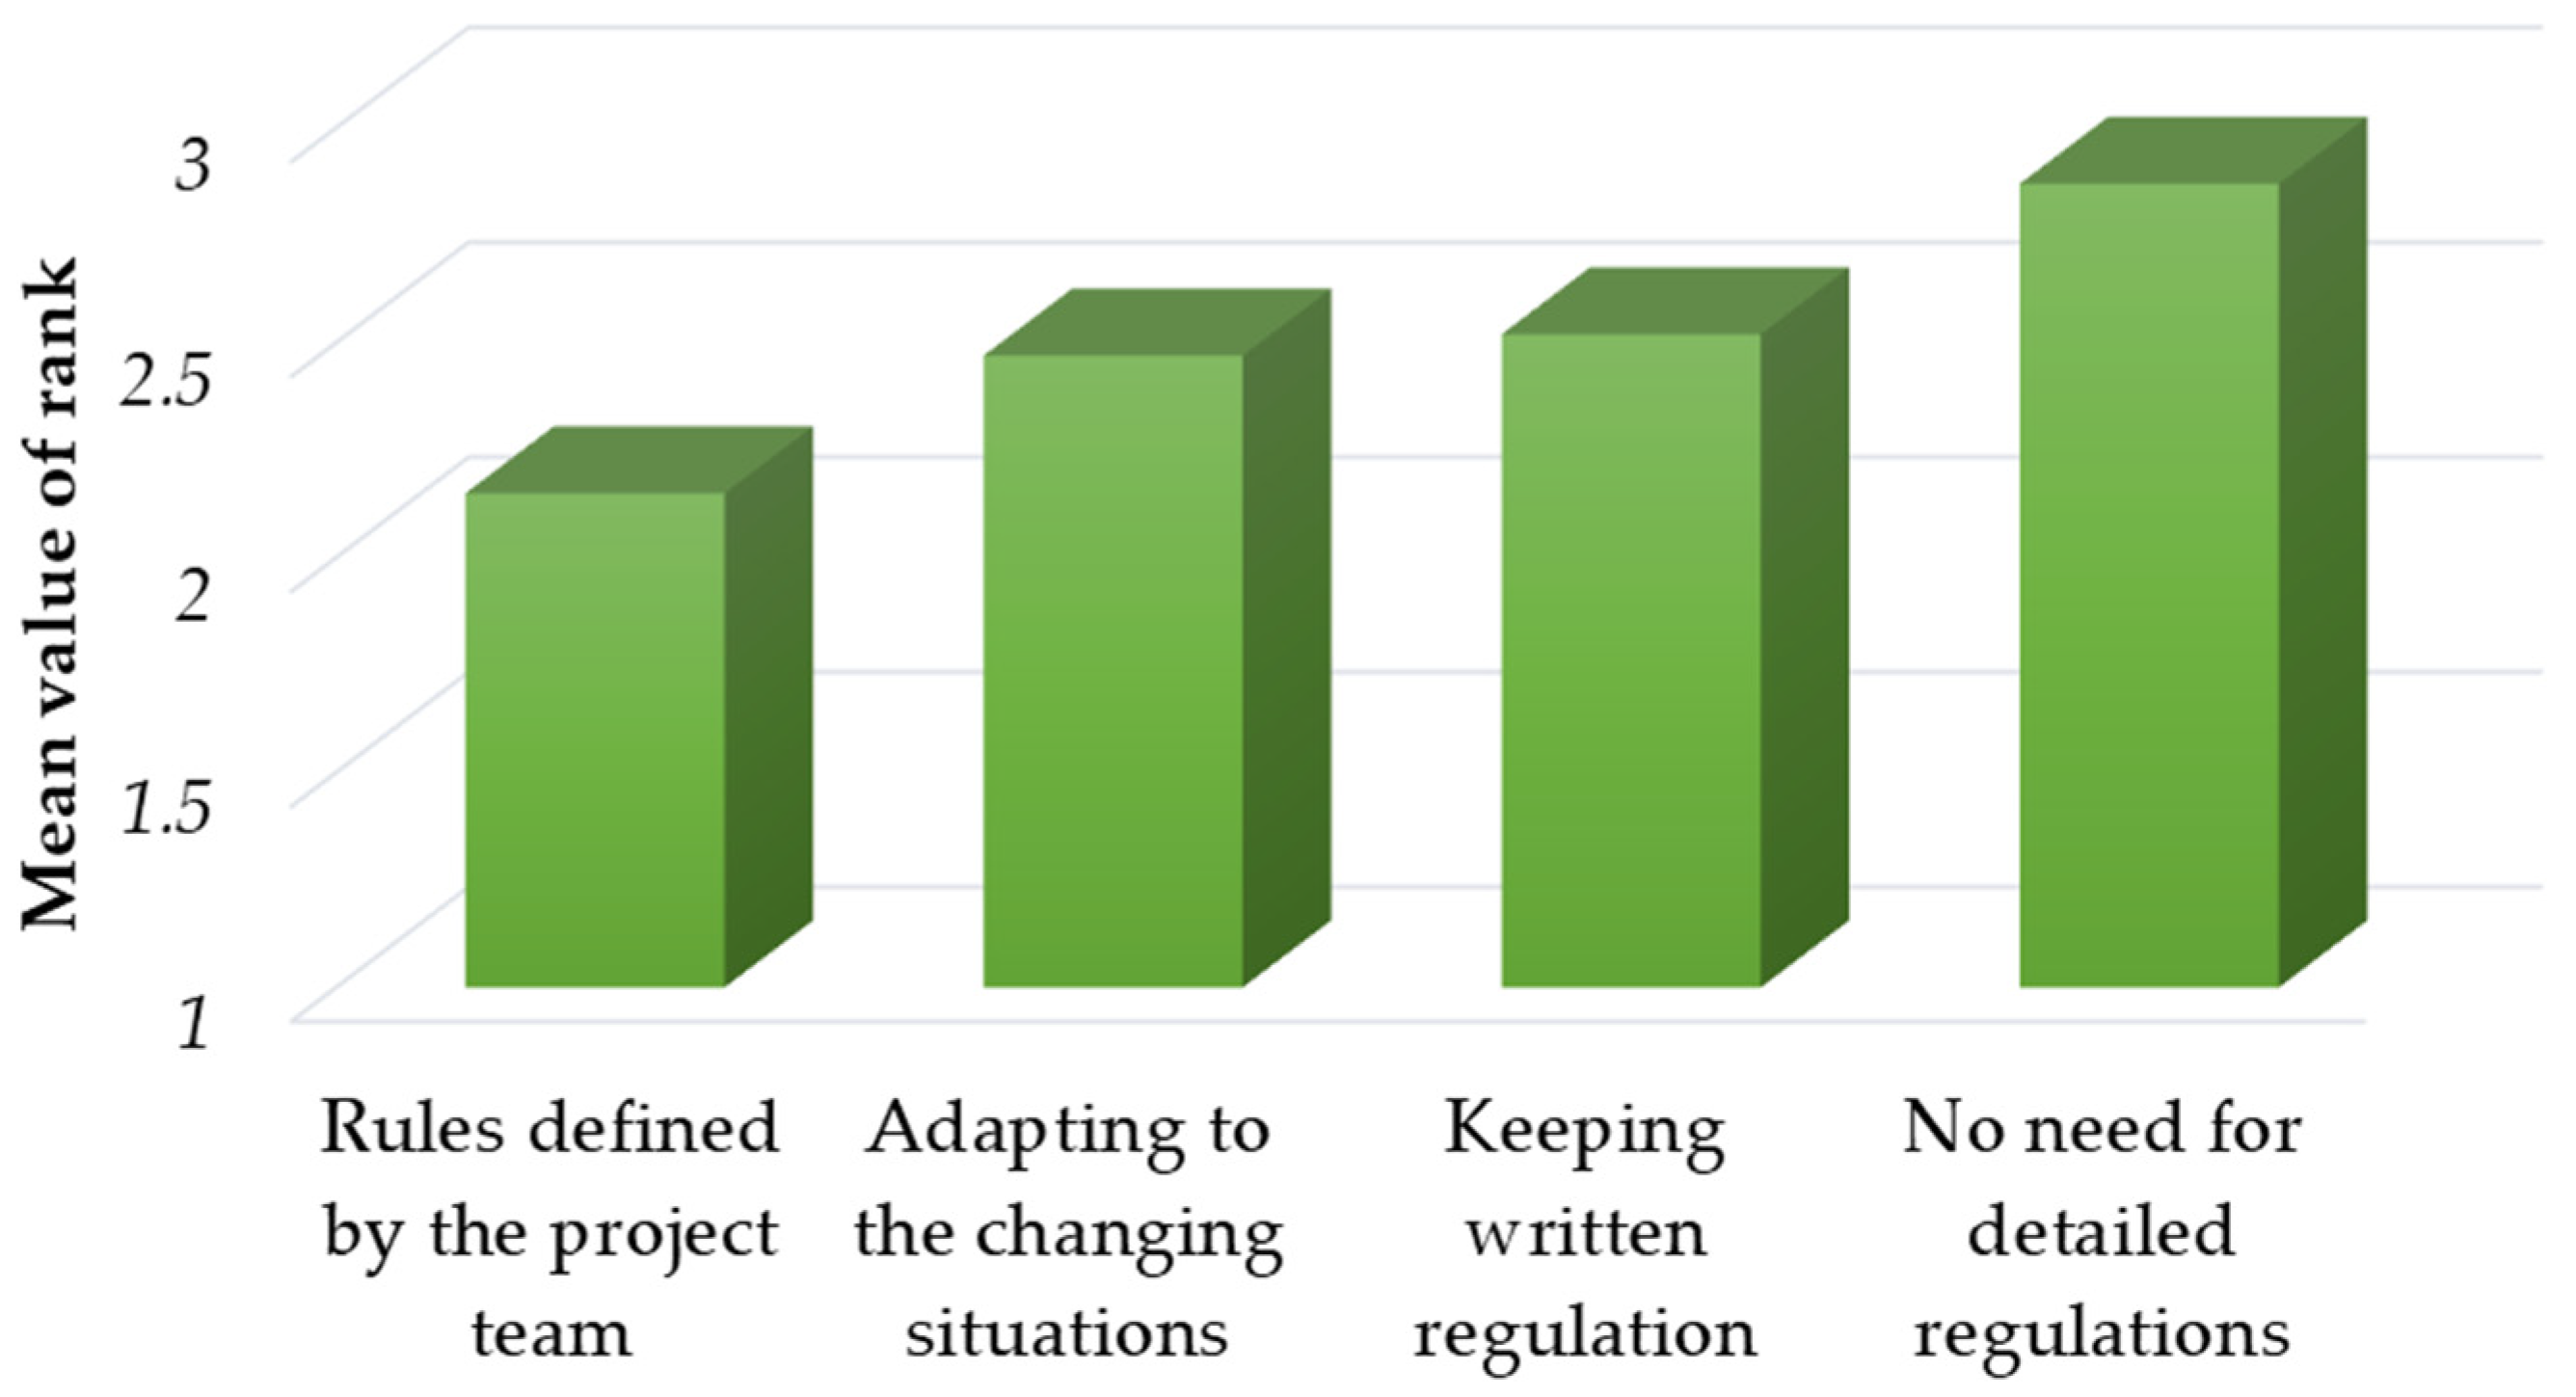
- Keeping the written regulations and plans is the most expedient (Keeping written regulation);
- The project team must define the rules for a given project (Rules defined by the project team);
- The team must consciously adapt to changing situations (Adapting to the changing situations);
- There is no need for overregulation since everyone performs to the best of their ability that leads to the fastest competition in the project (No need for detailed regulations).
3.3. Research Sample
4. Results and Discussion
4.1. Approach to the Regulation of Product Development Projects
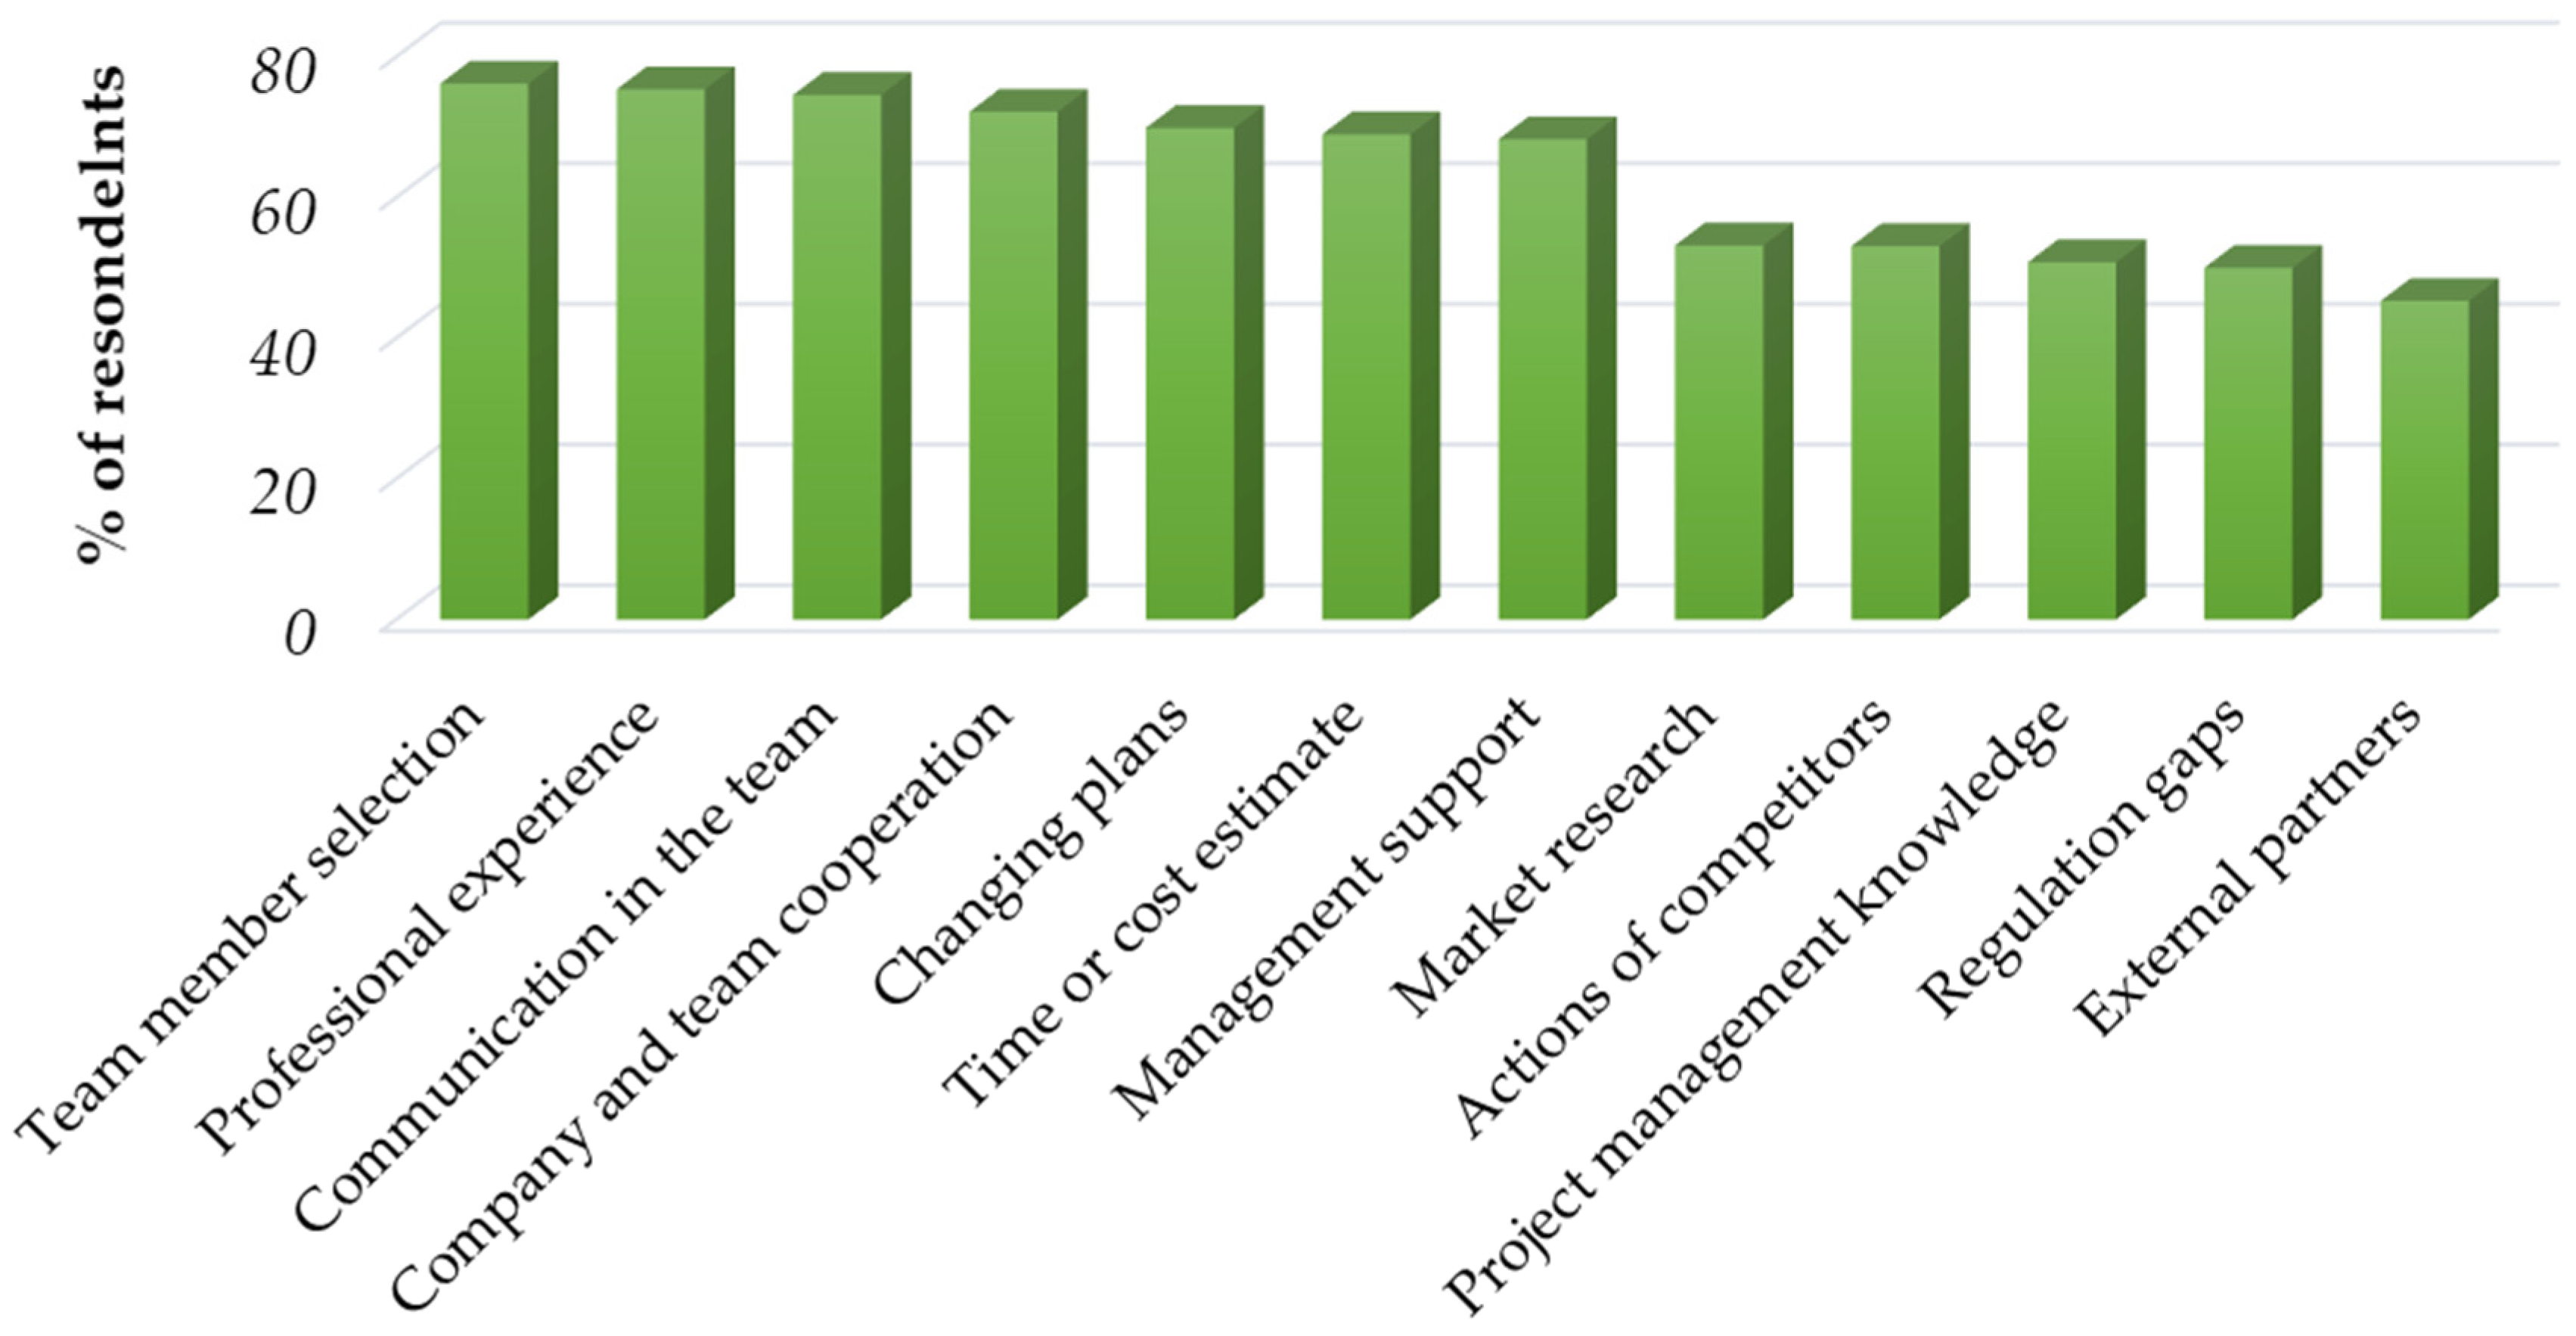
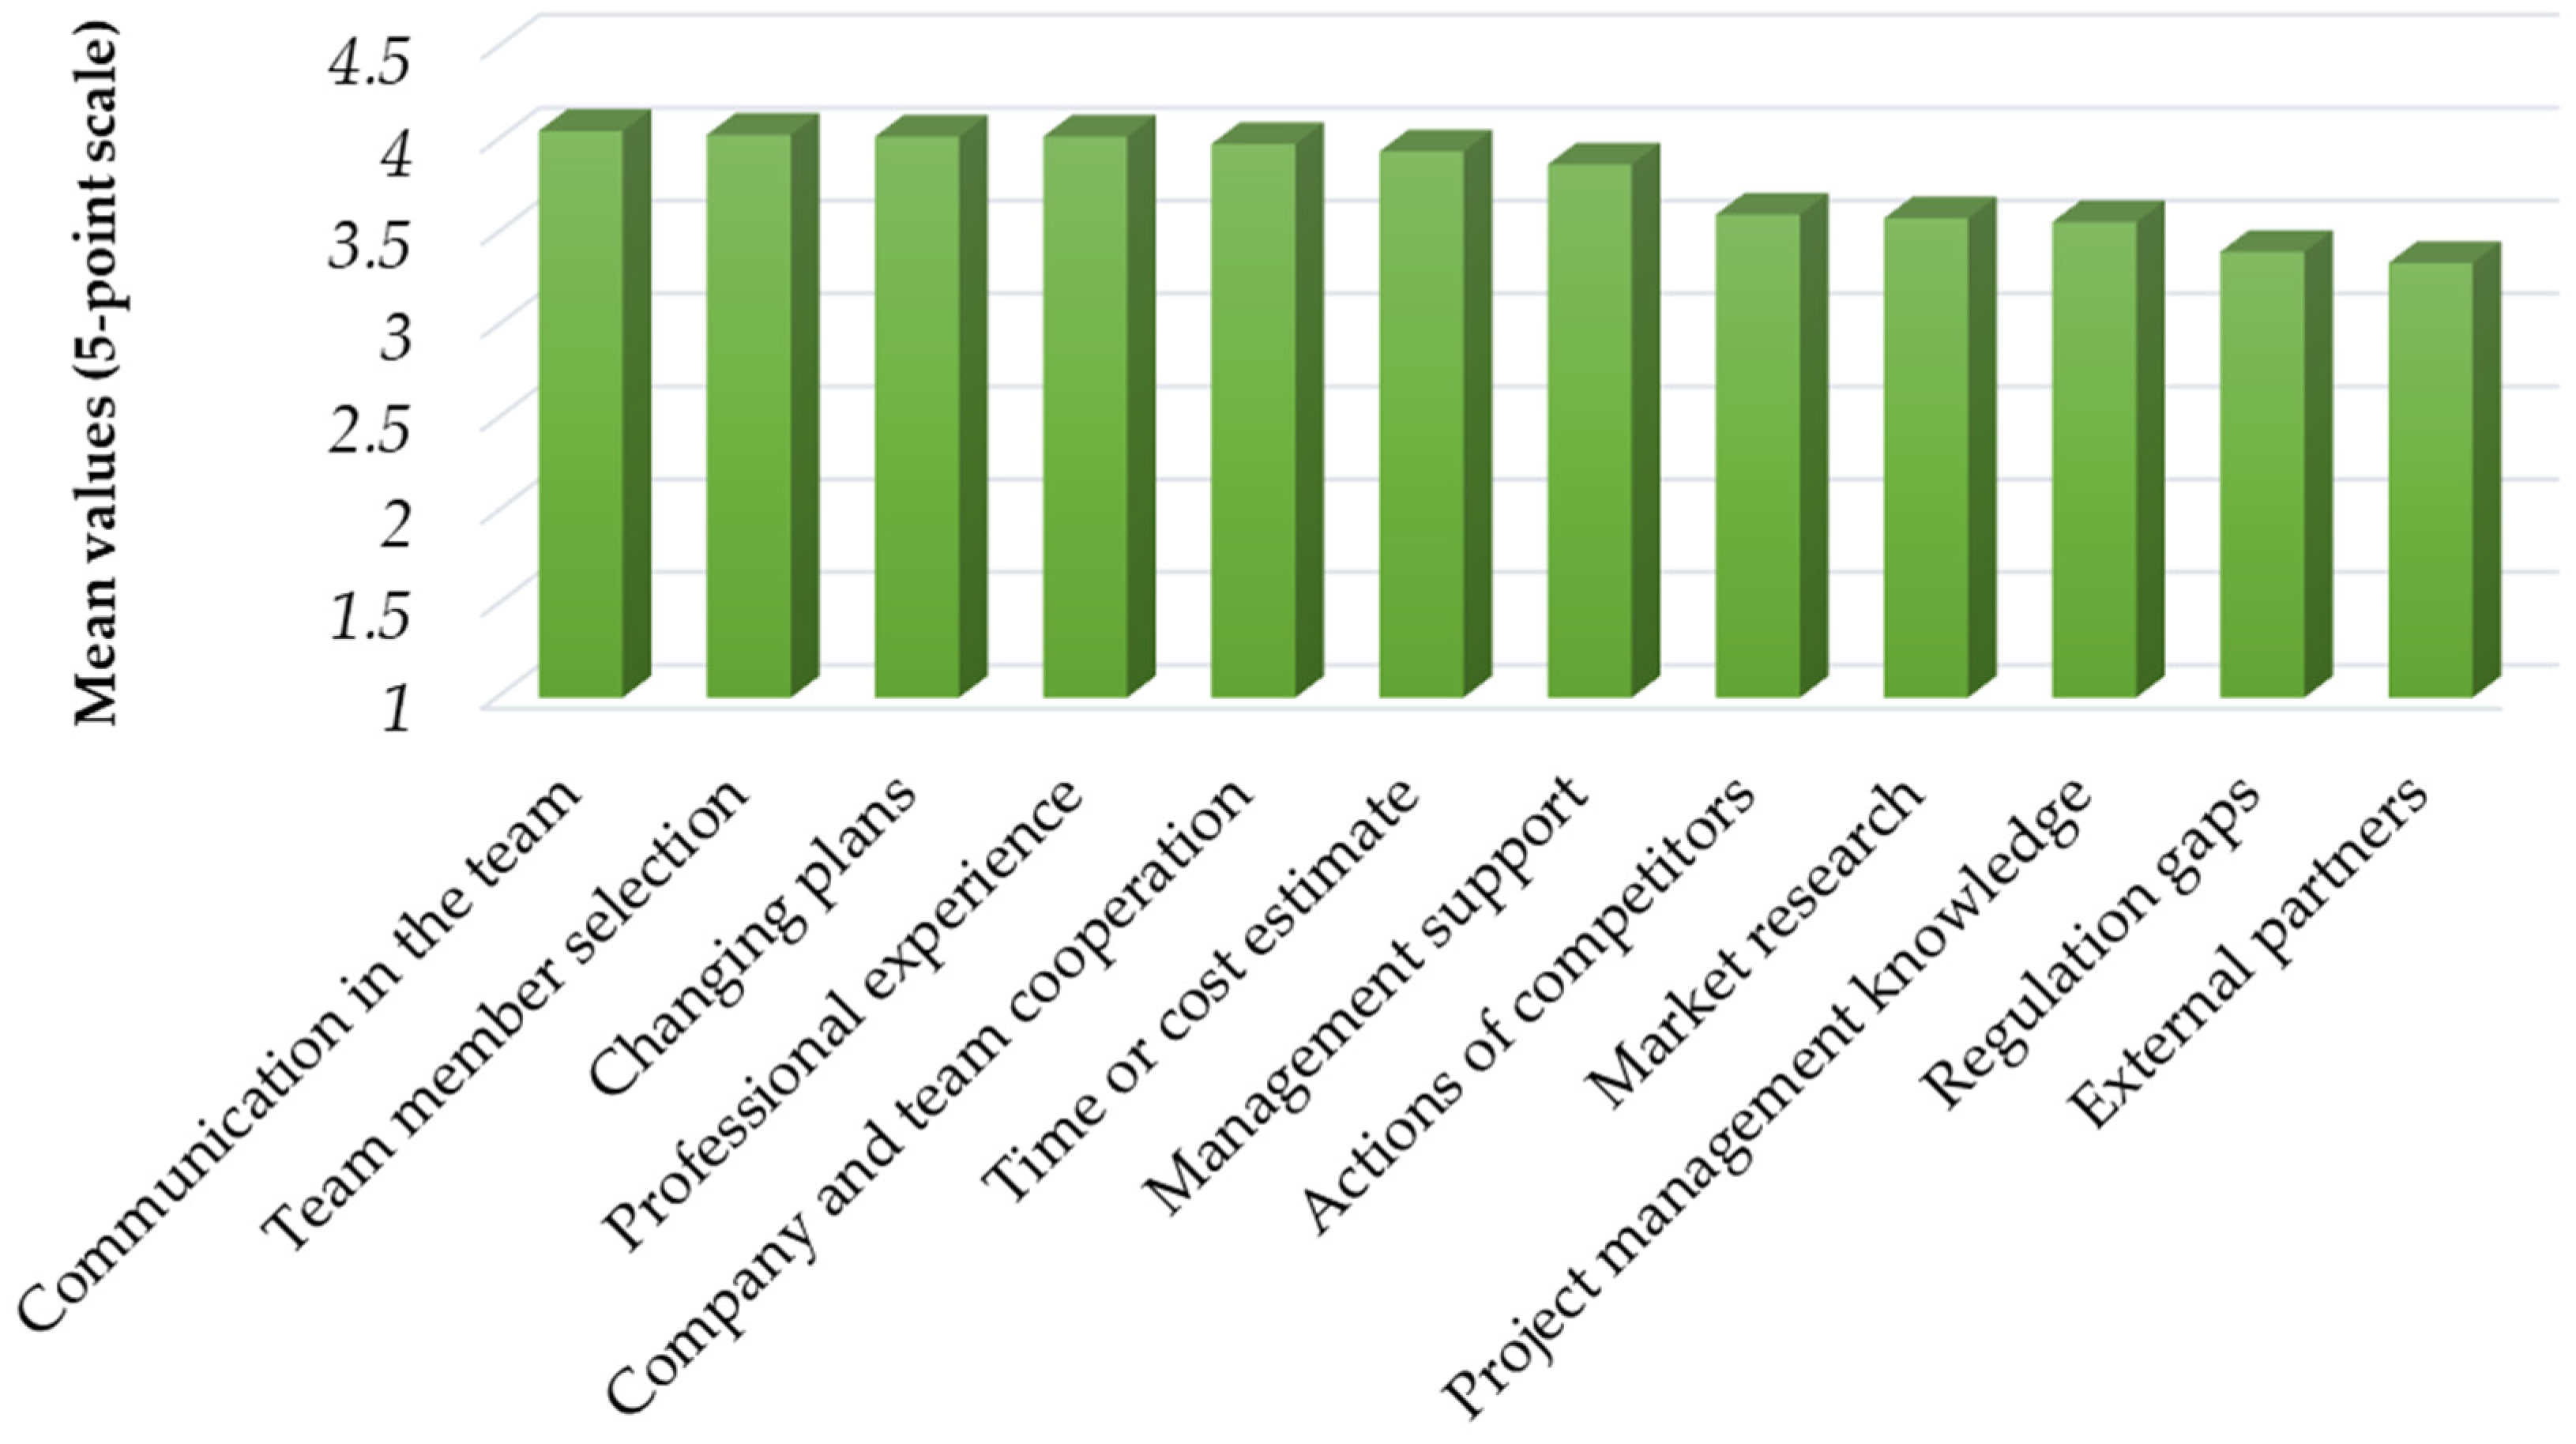
4.2. Factors of Product Development Project Failures
4.3. Alternative Factor Structure
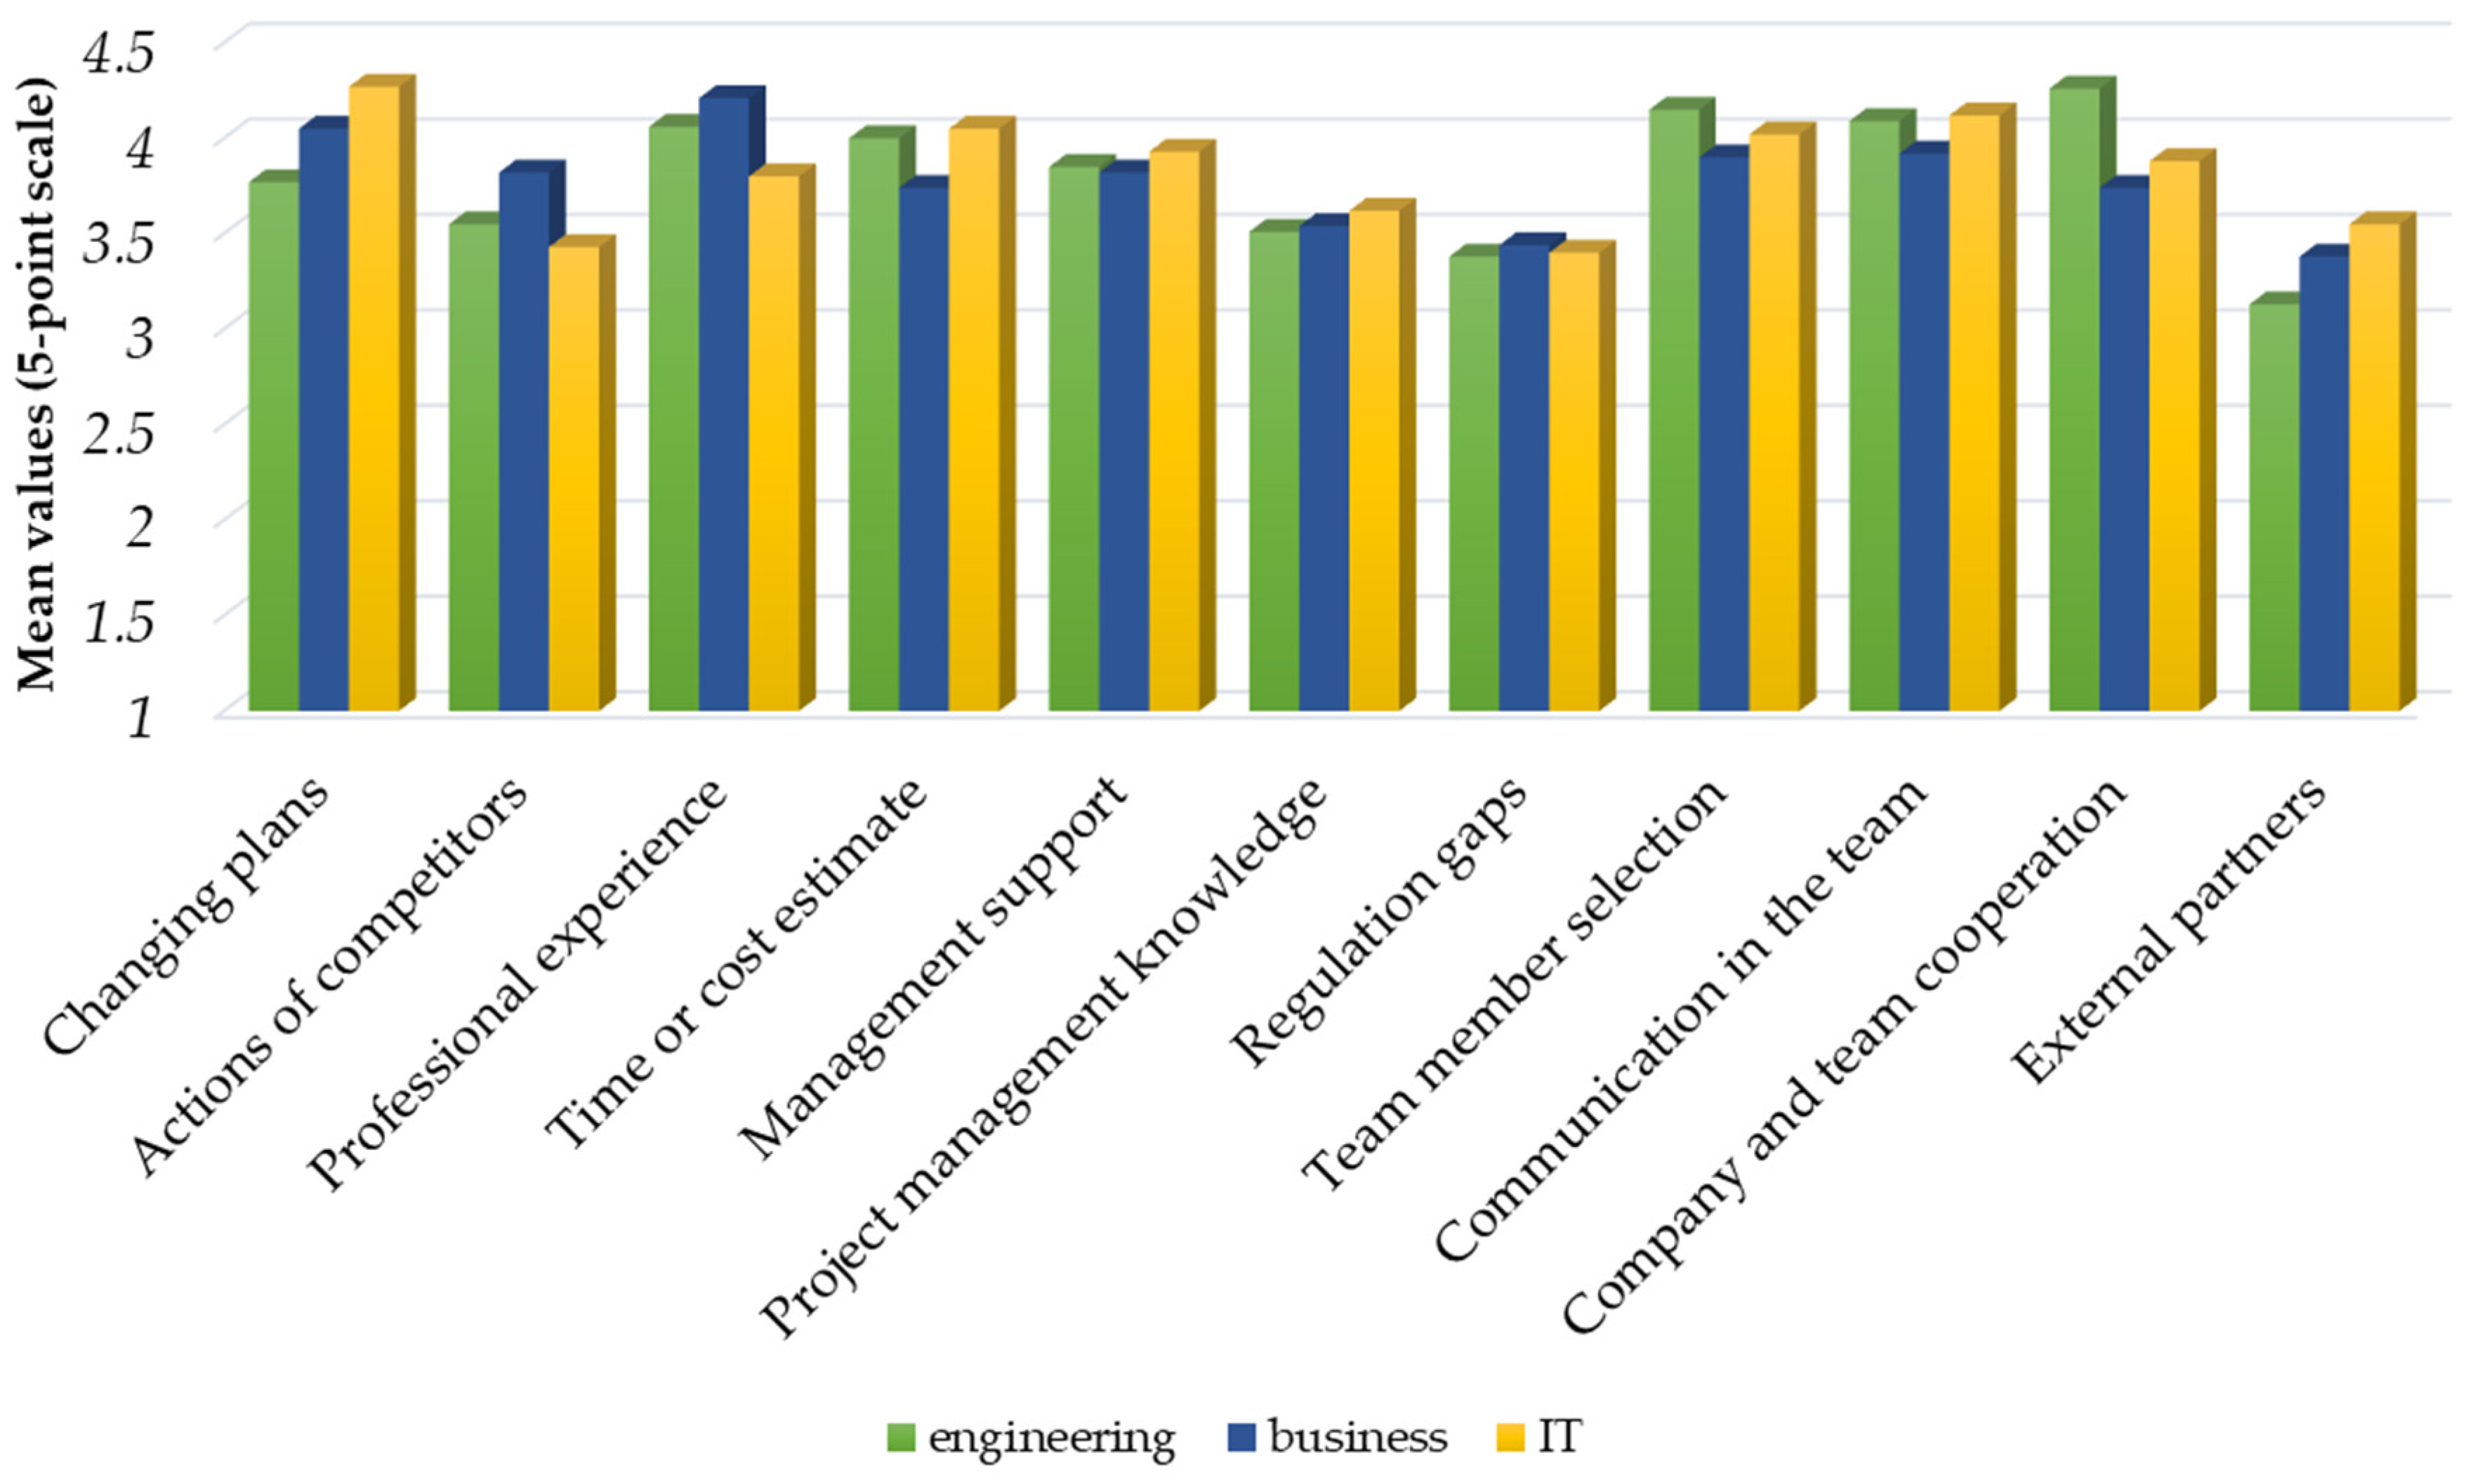
4.4. Analysis of Variance
4.5. Evaluation of the Results
5. Conclusions
Author Contributions
Funding
Institutional Review Board Statement
Informed Consent Statement
Data Availability Statement
Acknowledgments
Conflicts of Interest
Appendix A

| Item | Mean | SD | Skewness | Kurtosis | ||
|---|---|---|---|---|---|---|
| Statistic | Statistic | Statistic | Std. Err. | Statistic | Std. Err. | |
| Communication in the team | 4.05 | 1.019 | −0.927 | 0.216 | 0.163 | 0.428 |
| Team member selection | 4.03 | 0.876 | −0.643 | 0.216 | −0.246 | 0.428 |
| Changing plans | 4.02 | 0.971 | −0.724 | 0.216 | 0.008 | 0.428 |
| Professional experience | 4.02 | 0.815 | −0.586 | 0.216 | 0.405 | 0.428 |
| Company and team cooperation | 3.98 | 0.907 | −0.736 | 0.216 | 0.494 | 0.428 |
| Time or cost estimate | 3.94 | 0.97 | −0.674 | 0.216 | 0.004 | 0.428 |
| Management support | 3.87 | 0.889 | −0.495 | 0.216 | −0.07 | 0.428 |
| Actions of competitors | 3.6 | 1.021 | −0.354 | 0.216 | −0.261 | 0.428 |
| Market research | 3.58 | 1.068 | −0.33 | 0.216 | −0.535 | 0.428 |
| Project management knowledge | 3.56 | 0.899 | −0.068 | 0.216 | −0.426 | 0.428 |
| Regulation gaps | 3.4 | 1.067 | −0.229 | 0.216 | −0.724 | 0.428 |
| External partners | 3.34 | 1.037 | −0.07 | 0.216 | −0.759 | 0.428 |
| Survey Item | (1) | (2) | (3) | (4) | (5) | (6) | |
| Changes in plans are too common | Coeff | −0.091 | −0.031 | 0.087 | 0.230 ** | 0.154 | |
| Sig. | 0.31 | 0.733 | 0.333 | 0.01 | 0.084 | ||
| Competitors move faster in development (2) | Coeff | 0.134 | 0.137 | 0.113 | 0.118 | ||
| Sig. | 0.135 | 0.126 | 0.21 | 0.187 | |||
| Lack of experience in similar development tasks (3) | Coeff | 0.268 ** | 0.074 | 0.088 | |||
| Sig. | 0.002 | 0.413 | 0.327 | ||||
| Bad estimate of costs or deadlines (4) | Coeff | 0.230 ** | 0.187 * | ||||
| Sig. | 0.01 | 0.037 | |||||
| Lack of corporate management support (5) | Coeff | 0.262 ** | |||||
| Sig. | 0.003 | ||||||
| Project management knowledge of project managers (6) | Coeff | 1 | |||||
| Sig. | 0.000 | ||||||
| (7) | (8) | (9) | (10) | (11) | (12) | ||
| Changes in plans are too common | Coeff | 0.094 | 0.293 ** | 0.339 ** | 0.245 ** | 0.101 | 0.068 |
| Sig. | 0.294 | 0.001 | 0 | 0.006 | 0.262 | 0.447 | |
| Competitors move faster in development (2) | Coeff | 0.065 | −0.115 | 0.014 | 0.214 * | 0.077 | 0.289 ** |
| Sig. | 0.471 | 0.198 | 0.876 | 0.016 | 0.392 | 0.001 | |
| Lack of experience in similar development tasks (3) | Coeff | 0.053 | 0.189 * | 0.12 | 0.114 | 0.190 * | 0.149 |
| Sig. | 0.557 | 0.034 | 0.181 | 0.204 | 0.033 | 0.096 | |
| Bad estimate of costs or deadlines (4) | Coeff | 0.179 * | 0.163 | 0.262 ** | 0.258 ** | 0.196 * | 0.220 * |
| Sig. | 0.045 | 0.069 | 0.003 | 0.004 | 0.028 | 0.013 | |
| Lack of corporate management support (5) | Coeff | 0.006 | 0.143 | 0.066 | 0.311 ** | 0.109 | 0.083 |
| Sig. | 0.947 | 0.11 | 0.464 | 0 | 0.226 | 0.357 | |
| Project management knowledge of project managers (6) | Coeff | 0.179 * | 0.285 ** | 0.283 ** | 0.310 ** | 0.247 ** | 0.176 * |
| Sig. | 0.045 | 0.001 | 0.001 | 0 | 0.005 | 0.048 | |
| (7) | (8) | (9) | (10) | (11) | (12) | ||
| Gaps in regulations (7) | Coeff | 0.254 ** | 0.185 * | 0.188 * | 0.240 ** | 0.271 ** | |
| Sig. | 0.004 | 0.038 | 0.035 | 0.007 | 0.002 | ||
| Improper selection of team members (8) | Coeff | 0.514 ** | 0.351 ** | 0.134 | 0.023 | ||
| Sig. | 0 | 0 | 0.134 | 0.8 | |||
| Improper choice of communication solutions between team members (9) | Coeff | 0.401 ** | 0.091 | 0.188 * | |||
| Sig. | 0 | 0.311 | 0.035 | ||||
| Lack of cooperation between company management and the project team (10) | Coeff | 0.270 ** | 0.302 ** | ||||
| Sig. | 0.002 | 0.001 | |||||
| Improper relationship with external partners (11) | Coeff | 0.282 ** | |||||
| Sig. | 0.001 | ||||||
| Insufficient market research (12) | Coeff | 1 | |||||
| Sig. | 0 |
| Gender (df = 1) | Profession (df = 2) | Study Level (df = 1) | Work Experience (df = 2) | |||||
|---|---|---|---|---|---|---|---|---|
| H | Sig. | H | Sig. | H | Sig. | H | Sig. | |
| Keeping written regulation | 0.399 | 0.528 | 0.505 | 0.777 | 0.042 | 0.837 | 1.359 | 0.507 |
| Rules defined by the project team | 1.008 | 0.315 | 0.265 | 0.876 | 0.026 | 0.873 | 0.654 | 0.721 |
| Adapt to the changing situations | 0.426 | 0.514 | 0.514 | 0.774 | 0.951 | 0.329 | 0.64 | 0.726 |
| No need for detailed regulations | 1.454 | 0.228 | 1.361 | 0.506 | 0.523 | 0.47 | 2.427 | 0.297 |
| Changes in plans are too common | 0.409 | 0.522 | 6.235 | 0.044 | 1.044 | 0.307 | 4.009 | 0.135 |
| Competitors move faster in development | 7.12 | 0.008 | 3.858 | 0.145 | 1.39 | 0.238 | 0.097 | 0.953 |
| Lack of experience in similar development tasks | 0.034 | 0.854 | 3.597 | 0.166 | 3.685 | 0.055 | 0.654 | 0.721 |
| Bad estimate of costs or deadlines | 0.45 | 0.503 | 1.628 | 0.443 | 0.085 | 0.77 | 0.425 | 0.809 |
| Lack of corporate management support | 0.89 | 0.346 | 0.249 | 0.883 | 0.431 | 0.512 | 0.49 | 0.783 |
| Project management knowledge of project managers | 1.292 | 0.256 | 0.353 | 0.838 | 2.154 | 0.142 | 3.925 | 0.141 |
| Gaps in regulations | 7.526 | 0.006 | 0.029 | 0.986 | 0 | 0.985 | 1.669 | 0.434 |
| Improper selection of team members | 0.046 | 0.831 | 1.162 | 0.559 | 0.506 | 0.477 | 1.947 | 0.378 |
| Improper choice of communication solutions between team members | 0.97 | 0.325 | 1.279 | 0.527 | 1.144 | 0.285 | 1.319 | 0.517 |
| Lack of cooperation between company management and the project team | 1.015 | 0.314 | 7.017 | 0.03 | 0.913 | 0.339 | 3.823 | 0.148 |
| Improper relationship with external partners | 0.619 | 0.432 | 3.555 | 0.169 | 0.2 | 0.655 | 0.159 | 0.923 |
| Insufficient market research | 2.348 | 0.125 | 3.26 | 0.196 | 0.067 | 0.796 | 3.822 | 0.148 |
References
- Ahmad, Sohel, Debasish N. Mallick, and Roger G. Schroeder. 2013. New product development: Impact of project characteristics and development practices on performance. Product Innovation Management 30: 331–48. [Google Scholar] [CrossRef]
- Andreasen, Mogens M., and Lars Hein. 1987. Integrated Product Development. Berlin/Heidelberg: Springer. [Google Scholar]
- Antony, Jiju, and Sandeep Gupta. 2018. Top ten reasons for process improvement project failures. International Journal of Lean Six Sigma 10: 367–74. [Google Scholar] [CrossRef]
- Apa, Roberta, Valentina De Marchi, Roberto Grandinetti, and Silvia R. Sedita. 2021. University-SME collaboration and innovation performance: The role of informal relationships and absorptive capacity. Journal of Technology Transfer 46: 961–88. [Google Scholar] [CrossRef]
- Armenia, Stefano, Rosa Maria Dangelico, Fabio Nonino, and Alessandro Pompe. 2019. Sustainable project management: A conceptualization-oriented review and a framework proposal for future studies. Sustainability 11: 2664. [Google Scholar] [CrossRef] [Green Version]
- Babbie, Earl. 2020. The Practice of Social Research, 15th ed. Boston: Cengage. [Google Scholar]
- Bejinaru, Ruxandra, Cristian Valentin Hapenciuc, Iulian Condratov, and Pavel Stanciu. 2018. The university role in developing the human capital for a sustainable bioeconomy. Amfiteatru Economic 20: 583–98. [Google Scholar] [CrossRef]
- Berényi, László, and Gabriella Vadász-Bognár. 2019. HEIBus: Az ipar és a felsőoktatás nemzetközi együttműködése a Miskolci Egyetemen. Magyar Minőség 28: 14–99. [Google Scholar]
- Bihari, János, and Zsolt Tóbis. 2019. Pneumobilok fejlesztése és építése a Miskolci Egyetem Gép- és Terméktervezési Intézetében. Multidiszciplináris Tudományok: A Miskolci Egyetem Közleménye 9: 305–16. [Google Scholar] [CrossRef]
- Bratianu, Constantin, Gabriela Prelipcean, and Ruxandra Bejinaru. 2020. Exploring the latent variables which support SMEs to become learning organizations. Management & Marketing. Challenges for the Knowledge Society 15: 154–71. [Google Scholar] [CrossRef]
- Burchardt, Carsten. 2001. Ein erweitertes Konzept für die Integrierte Produktentwicklung. In Integrierte Produktentwicklung. Edited by Sándor Vajna. Band 3. Magdeburg: Lehrstuhl für Maschinenbauinformatik, p. 208. [Google Scholar]
- Cooper, Robert G. 2019. The drivers of success in new-product development. Industrial Marketing Management 76: 36–47. [Google Scholar] [CrossRef]
- Derbyshire, James, and Emanuele Giovannetti. 2017. Understanding the failure to understand new product development failures: Mitigating the uncertainty associated with innovating new products by combining scenario planning and forecasting. Technological Forecasting and Social Change 125: 334–44. [Google Scholar] [CrossRef]
- Deutsch, Nikolett, Tamás Mészáros, and Lajos Szabó. 2017. Modelling the development of strategic management. In Proceedings 31st European Conference on Modelling and Simulation: ECMS 2017. Edited by Zita Zoltay-Paprika, Péter Horák, Kata Váradi, Péter T. Zwierczyk, Ágnesd Vidovics-Dancs and Péter Rádics. Regensburg: European Council for Modelling and Simulation, pp. 67–73. [Google Scholar]
- Ehrlenspiel, Kalus. 1991. Integrierte Produkterstellung Organisation—Methoden—Hilfsmittel. In Wettbewerbsfaktor Zeit in Produktionsunternehmen. Edited by Joachim Milberg. Berlin/Heidelberg: Springer, pp. 113–31. [Google Scholar] [CrossRef]
- Emam, Khaled E., and Günes A. Koru. 2008. A Replicated Survey of IT Software Project Failures. IEEE Software 25: 84–90. [Google Scholar] [CrossRef]
- Fekete, István, and Péter Szontágh. 2020. Projektek programszintű kockázatmenedzsmentje. Vezetéstudomány 51: 46–59. [Google Scholar] [CrossRef] [Green Version]
- Gerwin, Donald, and Nicholaj J. Barrowman. 2002. An evaluation of research on integrated product development. Management Science 48: 938–53. [Google Scholar] [CrossRef]
- González, Francisco J. M., and Tomás M. B. Palacios. 2002. The effect of new product development techniques on new product success in Spanish firms. Industrial Marketing Management 31: 261–71. [Google Scholar] [CrossRef]
- Görög, Mihály. 2019. Projektvezetés a Szervezetekben. Budapest: Panem. [Google Scholar]
- Gupta, Sandeep K., Angappa Gunasekaran, Jiju Antony, Shivam Gupta, Surajit Bag, and David Roubaud. 2019. Systematic literature review of project failures: Current trends and scope for future research. Computers & Industrial Engineering 127: 274–85. [Google Scholar] [CrossRef]
- Hallstedt, Sophie I., Ola Isaksson, and Anna Öhrwall Rönnbäck. 2020. The need for new product development capabilities from digitalization, sustainability, and servitization trends. Sustainability 12: 10222. [Google Scholar] [CrossRef]
- Hayward, Simon. 2016. Connected Leadership: How to Build a More Agile, Customer-Driven Business. Harlow: Pearson Education. [Google Scholar]
- Henson, Reilly V., Kelly M. Cobourn, Kathleen C. Weathers, Cayelan C. Carey, Kaitlin J. Farrell, Jennifer L. Klug, Michael G. Sorice, Nicole K. Ward, and Weizhe Weng. 2020. A practical guide for managing interdisciplinary teams: Lessons learned from coupled natural and human systems research. Social Sciences 9: 119. [Google Scholar] [CrossRef]
- Iqbal, Muhammad, and Amalia Suzianti. 2021. New product development process design for small and medium enterprises: A systematic literature review from the perspective of open innovation. Journal of Open Innovation: Technology, Market, and Complexity 7: 153. [Google Scholar] [CrossRef]
- Jones, Oswald, and Gary Stevens. 1999. Evaluating failure in the innovation process: The micropolitics of new product development. R&D Management 29: 167–78. [Google Scholar]
- Karakaya, Fahri, and Bulent Kobu. 1994. New product development process: An investigation of success and failure in high-technology and non-high-technology firms. Journal of Business Venturing 9: 49–66. [Google Scholar] [CrossRef]
- Kärkkäinen, Hannu, Petteri Piippo, and Markku Tuomine. 2001. Ten tools for customer-driven product development in industrial companies. International Journal of Production Economics 69: 161–76. [Google Scholar] [CrossRef]
- Lewis, Michael A. 2001. Success, failure and organisational competence: A case study of the new product development process. Journal of Engineering and Technology Management 18: 185–206. [Google Scholar] [CrossRef]
- Li, Jian, and Yue Yu. 2022. From collaborative research to new product development: Why a central or brokered network position is not enough. Journal of Knowledge Management 26: 615–41. [Google Scholar] [CrossRef]
- Meerkamm, Harald. 1995. Integrierte Produktentwicklung im Spannungsfeld von Kosten-, Zeit-und Qualitätsmanagement. VDI-Jahrbuch 95. Düsseldorf: VDI-Verlag. [Google Scholar]
- Olsson, Fredrick. 1985. Integrerad Produktutveckling—Arbetsmodel. Series 21 Produktutveckling; Stockholm: Sveriges Mekanförbundet. [Google Scholar]
- Ottosson, Stig. 1996. Dynamic product development: Findings from participating action research in a fast new product development process. Journal of Engineering Design 7: 151–69. [Google Scholar] [CrossRef]
- Pallant, Julie. 2020. SPSS Survival Manual: A Step by Step Guide to Data Analysis Using IBM SPSS, 7th ed. London: Open University Press. [Google Scholar]
- Pinto, Jeffery K., and Samuel J. Mantel. 1990. The Causes of project failure. IEEE Transactions on Engineering Management 37: 269–76. [Google Scholar] [CrossRef] [Green Version]
- PMI. 2017. A Guide to the Project Management Body of Knowledge (PMBOK Guide), 6th ed. Newtown Square: Project Management Institute. [Google Scholar]
- PMI. 2021. A Guide to the Project Management Body of Knowledge (PMBOK® Guide)—Seventh Edition and the Standard for Project Management. Newtown Square: Project Management Institute. [Google Scholar]
- Pollack, Julien, Jane Helm, and Daniel Adler. 2018. What is the iron triangle, and how has it changed? International Journal of Managing Projects in Business 11: 527–47. [Google Scholar] [CrossRef]
- Radujkovića, Mladen, and Mariela Sjekavica. 2017. Project management success factors. Procedia Engineering 196: 607–15. [Google Scholar] [CrossRef]
- Shenhar, Aaron J., Dov Dvir, Ofer Levy, and Alan C. Maltz. 2001. Project success: A multidimensional strategic concept. Long Range Planning 34: 699–725. [Google Scholar] [CrossRef]
- Shenhar, Aaron J., Ofer Levy, and Dov Dvir. 1997. Mapping the dimensions of project success. Project Management Journal 28: 5–13. [Google Scholar]
- Soh, Pek-Hooi, and Annapoornima M. Subramanian. 2014. When do firms benefit from university–industry R&D collaborations? The implications of firm R&D focus on scientific research and technological recombination. Journal of Business Venturing 29: 807–21. [Google Scholar] [CrossRef]
- Soltész, László, and László Berényi. 2021. Success factors in product development projects: Expert opinions. Journal Of Physics—Conference Series 1935: 012003. [Google Scholar] [CrossRef]
- Szabó, Lajos, and Gabriella Cserháti. 2013. Stratégiai projektek irányítása—A projektvezetés kihívásai. Vezetéstudomány 44: 6–13. [Google Scholar]
- Todorović, Maria L., Dejan Č. Petrović, Marko M. Mihić, Vladimir L. Obradović, and Sergey D. Bushuyev. 2015. Project success analysis framework: A knowledge-based approach in project management. International Journal of Project Management 33: 772–83. [Google Scholar] [CrossRef]
- Un, Annique C., and Kazuhiro Asakawa. 2015. Types of R&D collaborations and process innovation: The benefit of collaborating upstream in the knowledge chain. Journal of Product Innovation Management 32: 138–53. [Google Scholar] [CrossRef]
- Vajna, Sándor, ed. 2020. Integrated Design Engineering: Interdisciplinary and Holistic Product Development. Cham: Springer. [Google Scholar] [CrossRef]
- Verzuh, Erik. 2021. The Fast Forward MBA in Project Management: The Comprehensive, Easy-to-Read Handbook for Beginners and Pros, 6th ed. Hoboken: Wiley. [Google Scholar]


| Model | Main Focus | Conditions | Utilization |
|---|---|---|---|
| Olsson (1985) | Project management Review of the economics of all activities Parallel processing of equivalent tasks Integration of tasks | Pioneer of the integrated product development process | Integrative approach Project orientation Teamwork |
| Andreasen and Hein (1987) | The parallel design of product versions Using CAD solution | A stable market environment is needed | Time-saving through parallel tasks |
| Ehrlenspiel (1991) | Integration of personal, informational, and organizational levels | Flat organizational structure and management are needed | Exploiting human resources Improving motivation |
| Meerkamm (1995) | Integration through IT | Flexible organization Design for product life cycle | IT integrated performance of project tasks |
| Ottosson (1996) | Reduced development time Focus on product specification | Changing conditions during the project realization | Flexibility through framework thinking |
| Magdeburg model by Burchardt (2001) | Holistic approach Human-centered development | Process parallelization available Available communication | Benefits of human-centered thinking Network as a dynamic organizational form |
| Success Dimension | Project Type: Level of Technological Uncertainty | |
|---|---|---|
| Low-Tech | High-Tech | |
| Project efficiency | Critical | Overruns acceptable |
| Impact on customer | Standard product | Significantly improved capabilities |
| Business success | Reasonable profit | High profits, market share |
| Preparing for the future | Almost none | New product line, new markets |
| Group | Question | Short Name |
|---|---|---|
| Project planning | Changes in plans are too common | Changing plans |
| Bad estimate of costs or deadlines | Time or cost estimate | |
| Gaps in regulations | Regulation gaps | |
| Project management | Project management knowledge of project managers | Project management knowledge |
| Improper choice of communication solutions between team members | Communication in the team | |
| Lack of cooperation between company management and the project team | Company and team cooperation | |
| Company issues | Improper selection of team members | Team member selection |
| Lack of corporate management support | Management support | |
| Lack of experience in similar development tasks | Professional experience | |
| External issues | Insufficient market research | Market research |
| Competitors move faster in development | Actions of competitors | |
| Improper relationship with external partners | External partners |
| Characteristics | Item | Frequency | Percentage |
|---|---|---|---|
| Gender | Female | 60 | 47.6% |
| Male | 66 | 52.4% | |
| Study level | Bachelor | 81 | 64.3% |
| Master | 45 | 35.7% | |
| Profession | Business | 39 | 31.0% |
| Engineering | 47 | 37.3% | |
| IT | 40 | 31.7% | |
| Work experience | No work experience | 29 | 23.0% |
| Internship | 24 | 19.0% | |
| Work experience | 73 | 57.9% |
| Rank | Keeping Written Regulations | Rules Defined by the Project Team | Adapting to the Changing Situations | No Need for Detailed Regulations |
|---|---|---|---|---|
| 1. | 22.2% | 38.1% | 17.5% | 22.2% |
| 2. | 29.4% | 20.6% | 34.9% | 15.1% |
| 3. | 23.0% | 29.4% | 31.0% | 16.7% |
| 4. | 25.4% | 11.9% | 16.7% | 46.0% |
| Item | Rank Order by Mean Values | Rank Order by 4 or 5 Ratings | 1. (%) | 2. (%) | 3. (%) | 4. (%) | 5. (%) |
|---|---|---|---|---|---|---|---|
| Team member selection | 2. | 1. | 0.0 | 6.3 | 17.5 | 42.9 | 33.3 |
| Professional experience | 4. | 2. | 0.8 | 1.6 | 22.2 | 45.2 | 30.2 |
| Communication in the team | 1. | 3. | 1.6 | 7.9 | 15.9 | 33.3 | 41.3 |
| Company and team cooperation | 5. | 4. | 1.6 | 3.2 | 23 | 40.5 | 31.7 |
| Changing plans | 3. | 5. | 1.6 | 4 | 24.6 | 31 | 38.9 |
| Time or cost estimate | 6. | 6. | 1.6 | 5.6 | 23.8 | 35.7 | 33.3 |
| Management support | 7. | 7. | 0.8 | 5.6 | 25.4 | 42.9 | 25.4 |
| Market research | 9. | 8. | 3.2 | 11.9 | 31.7 | 30.2 | 23 |
| Actions of competitors | 8. | 9. | 3.2 | 8.7 | 34.9 | 31.7 | 21.4 |
| Project management knowledge | 10. | 10. | 0.8 | 9.5 | 38.9 | 34.9 | 15.9 |
| Regulation gaps | 11. | 11. | 3.2 | 19 | 27.8 | 34.1 | 15.9 |
| External partners | 12. | 12. | 2.4 | 20.6 | 31.7 | 31 | 14.3 |
| Item | 1. | 2. | 3. | 4. |
|---|---|---|---|---|
| Team member selection | 0.822 | 0.059 | 0.091 | 0.132 |
| Communication in the team | 0.735 | 0.175 | 0.2 | 0.192 |
| Regulation gaps | 0.215 | 0.725 | −0.101 | −0.072 |
| External partners | 0.087 | 0.584 | 0.024 | 0.105 |
| Market research | −0.138 | 0.733 | 0.188 | 0.15 |
| Changing plans | 0.467 | 0.067 | 0.492 | −0.267 |
| Management support | 0.043 | −0.086 | 0.791 | 0.044 |
| Project management knowledge | 0.297 | 0.342 | 0.343 | 0.134 |
| Company and team cooperation | 0.323 | 0.335 | 0.542 | 0.207 |
| Actions of competitors | −0.426 | 0.244 | 0.336 | 0.511 |
| Professional experience | 0.159 | −0.005 | −0.156 | 0.796 |
| Time or cost estimate | 0.181 | 0.179 | 0.263 | 0.568 |
| Item | Original Grouping | Alternative Structure |
|---|---|---|
| Communication in the team | Project management | Team-level cooperation |
| Team member selection | Company issues | |
| Regulation gaps | Project planning | Enablers |
| Market research | External issues | |
| External partners | External issues | |
| Changing plans | Project planning | Management competencies |
| Project management knowledge | Project management | |
| Company and team cooperation | Project management | |
| Management support | Company issues | |
| Time or cost estimate | Project planning | Professional competencies |
| Professional experience | Company issues | |
| Actions of competitors | External issues |
| Grouping Factor | Item | Mean Values | H | df | Sig. |
|---|---|---|---|---|---|
| Profession | Changing plans | Mengineering = 3.77 Mbusiness = 4.05 MIT = 4.27 | 6.235 | 2 | 0.044 |
| Profession | Company and team cooperation | Mengineering = 3.85 Mbusiness = 3.82 MIT = 3.93 | 7.017 | 2 | 0.030 |
| Gender | Actions of competitors | Mfemale = 3.83 Mmale = 3.38 | 7.120 | 1 | 0.008 |
| Gender | Regulation gaps | Mfemale = 3.68 Mmale = 3.15 | 7.526 | 1 | 0.006 |
Publisher’s Note: MDPI stays neutral with regard to jurisdictional claims in published maps and institutional affiliations. |
© 2022 by the authors. Licensee MDPI, Basel, Switzerland. This article is an open access article distributed under the terms and conditions of the Creative Commons Attribution (CC BY) license (https://creativecommons.org/licenses/by/4.0/).
Share and Cite
Berényi, L.; Soltész, L. Evaluation of Product Development Success: A Student Perspective. Adm. Sci. 2022, 12, 49. https://doi.org/10.3390/admsci12020049
Berényi L, Soltész L. Evaluation of Product Development Success: A Student Perspective. Administrative Sciences. 2022; 12(2):49. https://doi.org/10.3390/admsci12020049
Chicago/Turabian StyleBerényi, László, and László Soltész. 2022. "Evaluation of Product Development Success: A Student Perspective" Administrative Sciences 12, no. 2: 49. https://doi.org/10.3390/admsci12020049
APA StyleBerényi, L., & Soltész, L. (2022). Evaluation of Product Development Success: A Student Perspective. Administrative Sciences, 12(2), 49. https://doi.org/10.3390/admsci12020049