Article

Application of Calcified Structures in Fish as Indicators of Metal Exposure in Freshwater Ecosystems

1
Division for Marine and Environmental Research, Ruđer Bošković Institute, Bijenička cesta 54, 10000 Zagreb, Croatia
2
Chair of General and Analytical Chemistry, Montanuniversität Leoben, Franz-Josef-Strasse 18, 8700 Leoben, Austria
3
FFoQSI—Austrian Competence Centre for Feed and Food Quality, Safety & Innovation, FFoQSI GmbH, Technopark 1D, 3430 Tulln, Austria
4
Division of Physical Chemistry, Ruđer Bošković Institute, Bijenička cesta 54, 10000 Zagreb, Croatia
5
Vodovod d.o.o., Spire Brusine 17, 23000 Zadar, Croatia
*
Author to whom correspondence should be addressed.
These authors contributed equally to this work.
Environments 2022, 9(2), 14; https://doi.org/10.3390/environments9020014
Submission received: 14 December 2021 / Revised: 13 January 2022 / Accepted: 18 January 2022 / Published: 21 January 2022
(This article belongs to the Special Issue Feature Papers in Environments in 2021)

Abstract

:
Although there are common and well-established bioindicator organisms and tissues, there is still a need for reliable and sensitive bioindicators in aquatic environments. In the present pilot study, calcified structures in fish were applied as indicators of metal exposure in combination with commonly used fish soft tissues and intestinal parasites, therefore comprising short- and long-term indicators. Patterns of metal accumulation and distribution in soft (muscle, liver) and hard (scales, otoliths) tissues of brown trout (Salmo trutta Linnaeus, 1758) and their intestinal parasites, acanthocephalans (Dentitruncus truttae Sinzar, 1955), from the Krka River influenced by industrial and municipal wastewaters were estimated and compared. Most elements had higher levels in acanthocephalans, scales and liver than muscle and otoliths, possibly reflecting differences in metal uptake routes, tissue function and metabolic activity. Despite the recorded differences in metal contents, all applied bioindicators reflected environmental conditions in a similar way, indicating higher levels of most elements in fish from the contaminated rather than from the reference site. Acanthocephalans were confirmed as sensitive bioindicators due to effective metal accumulation capacity, while the combination of soft and hard tissues provided extended temporal information on metal exposure. Wastewater impact was evidenced as moderate metal pollution by all applied indicators and pointed to present but also long-term disturbances in the Krka River and the importance of continuous monitoring and protective actions.

1. Introduction

Metals are among the major chemical toxicants polluting the environment due to their prolonged persistence and complex interactions with organisms in aquatic ecosystems [1,2,3]. Consequently, changes in metal levels can be reflected in aquatic organisms, which serve as biological indicators of metal exposure [4]. The advantage of applying indicator organisms and organs is that metals are retained in tissues for longer periods than in water, so biological responses indicate long-term metal variability. This is especially valid for hard tissues, such as fish scales and otoliths, which offer a permanent record of metal exposure over the life span of a fish. To date, fish hard tissues were mostly applied for stock discrimination [5,6], movement studies [7,8] and only to a lesser extent as environmental indicators of pollution [9,10,11,12,13], which were mostly represented by fish soft tissues, such as liver, gills and muscle [14,15,16].
Otoliths are calcified structures in the inner ear of teleost fish [13], while scales are composed of a thin, hard, external, well-mineralized layer in which annular structures incorporate metals over time. As they cover the surface of the body of fishes, the application of scales in biomonitoring studies represents a nonlethal alternative in metal exposure assessment [17]. Since calcified structures in fish are acellular and metabolically inert, any elements that incorporate into their surface stay conserved permanently and reflect conditions in the surrounding habitat. In soft tissues, apart from environmental conditions, the influence of fish physiology, mechanisms of elimination of potentially toxic metals and tissue regeneration might have a significant impact on metal levels as well [18,19]. Therefore, the application of soft tissues requires continuous monitoring and consideration of all these factors which might interfere with responses to metal exposure. The application of acanthocephalans as bioindicators of metal exposure has gained increasing interest due to their effective metal accumulation, orders of magnitude higher than those in other commonly used aquatic indicator organisms, such as fish, bivalves and crustaceans [19,20,21]. So far, research dealing with parasites as indicators of environmental health has mainly been focused on reporting and comparing metal levels in parasites and other bioindicator organisms [22,23,24], but studies on their application as indicators in metal exposure assessment are rare [19,20,25]. One of the reasons for this is the high variability of metal levels among parasite individuals, which was explained by fish mobility and different age [19,26].
Studies on the application of scales and otoliths in the metal exposure assessment of freshwater ecosystems and their comparison to soft tissues as bioindicators are rare [12]. Thus, the goal of the present study was to assess whether metal accumulation in hard tissues (scales, otoliths) reflects metal exposure in correspondence to soft tissues (liver, muscle) of brown trout (Salmo trutta Linnaeus, 1758) and their intestinal parasites, acanthocephalans (Dentitruncus truttae Sinzar, 1955). The comparison of bioresponses to metal exposure in soft and hard tissues was carried out for eight elements: Fe, Mg, Mn and Zn as essential elements and Ba, Rb, Sr and Tl as nonessential elements, which were chosen based on results regarding metal concentrations in water and as those measurable in (almost) all of these tissues. Further, most of these elements (Ba, Fe, Mg, Mn and Sr) were already found to correlate significantly between the two fish otoliths [5,27,28,29]. Some toxic elements such as Cd or Hg could not be considered due to the lack of available reference data for hard tissues in fish, which would undermine our goal to compare soft and hard tissues. Fish were collected at a reference (river source) and a contaminated site impacted by the wastewater outlets (Krka Knin) of the Krka River, a typical karst river in the Republic of Croatia. The lower part of the Krka River was proclaimed a National Park in 1985, but only 2 km upstream of the park, borderline technological and municipal wastewaters have a direct impact on the river water.
Since total metal content values in tissues do not necessarily represent the metabolically available metal fraction, known to be able to cause possible toxic effects, but comprise the complete amount of accumulated metal, our study included both fractions, total metal levels in muscle and metals bound to cytosolic biomolecules in liver, representing the metabolically available metal fraction [30,31,32].This way, we applied a new approach against conventional biomonitoring studies and achieved the following specific objectives: (a) evaluation of the calcified tissues in fish as tracers of environmental metal exposure, especially scales as a noninvasive alternative; (b) comparison of metal levels and spatial differences in the river water, fish soft (liver, muscle) and hard tissues (scales, otoliths) and intestinal parasites (acanthocephalans); (c) estimation of the impact of wastewater regarding water, fish and acanthocephalans to obtain a conclusion on the quality status of the karst freshwater ecosystem, the Krka River.

2. Materials and Methods

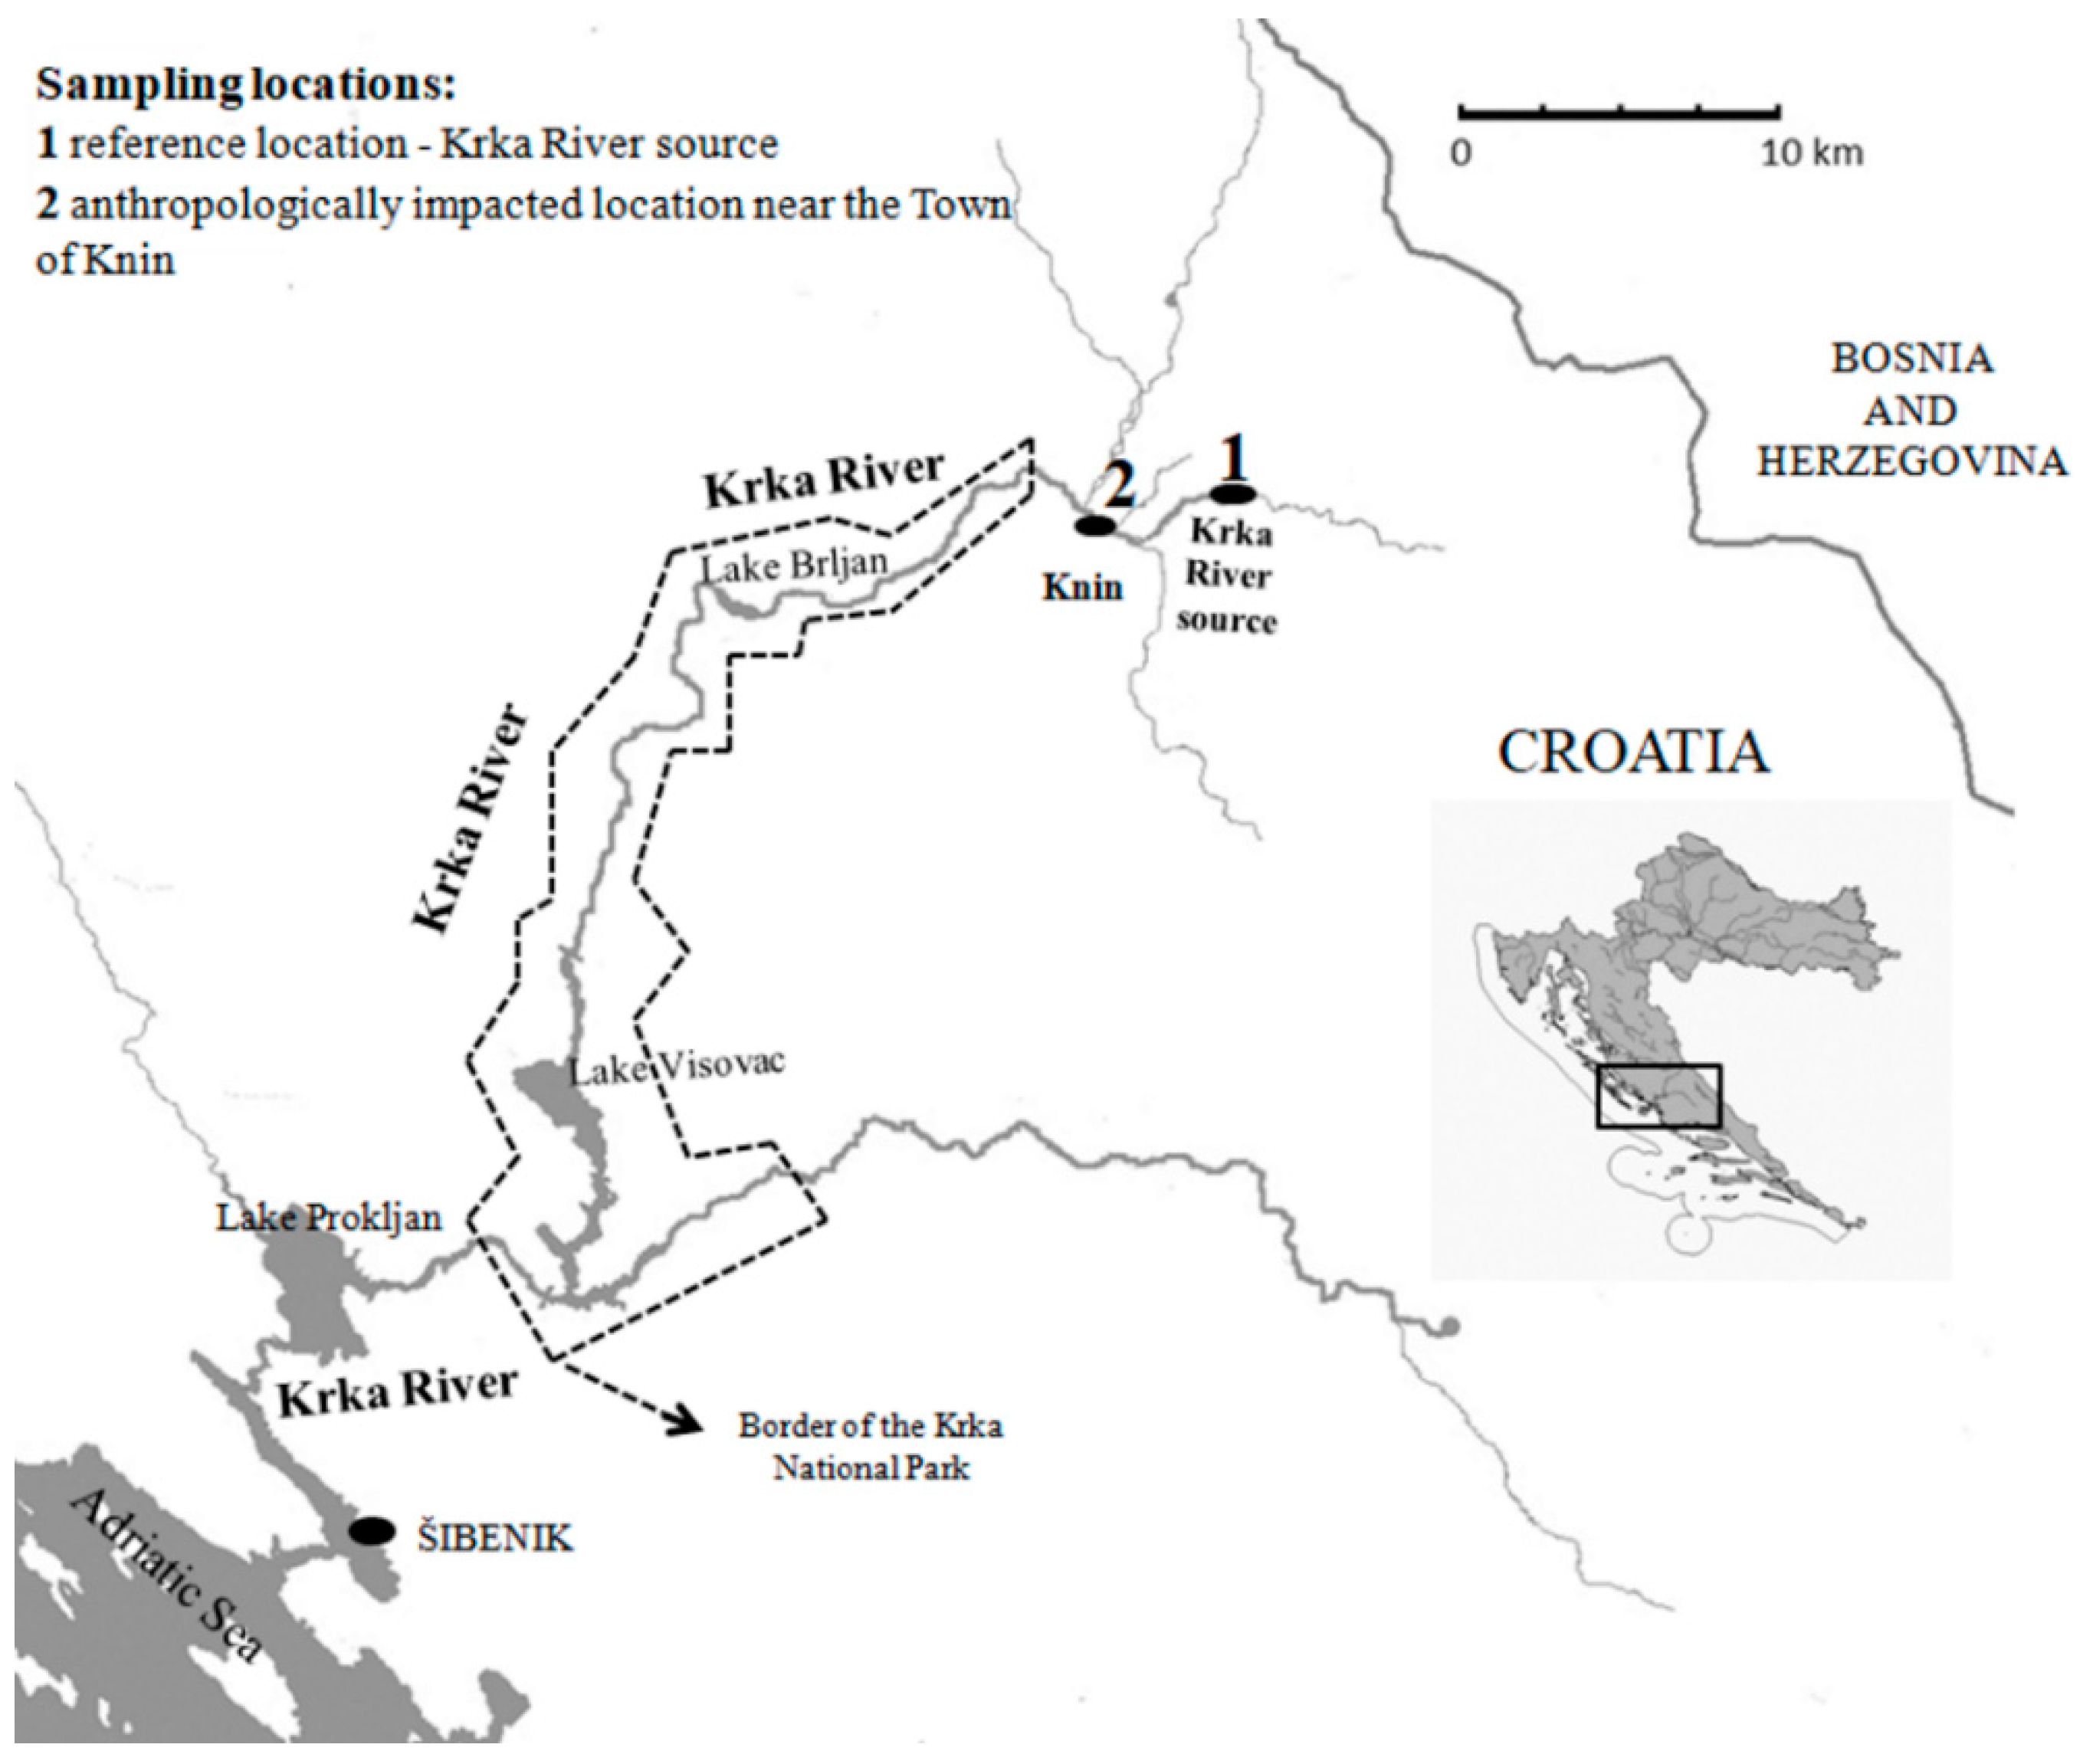
2.1. Study Area and Sampling Procedure

The study was conducted in the Krka River watercourse, influenced by two contamination sources: technological wastewaters from the screw factory and municipal wastewaters from the Town of Knin (11,000 inhabitants), which are released without adequate treatment in the river water. Sampling of the river water (n = 3 per site) and fish was conducted in April 2015 at two locations, reference (Krka River source; n = 18) and wastewater impacted (Krka Knin, located downstream of the wastewater outlets near the Town of Knin; n = 17) (Figure 1).
The river water was collected in triplicate in acid-cleaned polyethylene bottles and immediately filtered through a 0.45 μm pore diameter cellulose acetate filter (Sartorius, Göttingen, Germany) mounted on syringes. Aliquots of filtered samples were transferred into acid-pre-cleaned, 20 mL polyethylene bottles and acidified with concentrated nitric acid (Rotipuran® Supra 69%, Carl Roth, Karlsruhe, Germany) and stored at +4 °C until metal measurements.
Individuals of brown trout were sampled in April in order to avoid physiology-related metal variability during the spawning period, which occurs in the late autumn. Sampling was performed via electrofishing, according to the Croatian standard HRN EN 14,011 [33]. The electric field does not kill fish but only temporarily stuns them, so captured fish were kept alive in an aerated water tank until further processing in the laboratory. This way, all fish survived transport to the laboratory, and physiological disturbances were minimized.

2.2. Dissection of Fish Tissues

After specimens were anesthetized with freshly prepared anesthetic tricaine methanesulfonate (MS 222, Sigma Aldrich, St. Louis, MO, USA) in accordance with the Ordinance on the protection of animals used for scientific purposes (NN 55/2013) [34] and sacrificed, the fish total length and body mass were recorded. Fish sacrifice was performed by scientists who possessed a license to work with laboratory animals (FELASA category C) in the Laboratory for Biological Effects of Metals, which is a laboratory for fish sacrifice and work with fish bodies, organs and tissues, authorized by the Ministry of Agriculture, Veterinary and Food Safety Department (License number: HR-POK-025). Soft tissues of fish (liver and muscle) were dissected, and samples were individually stored at −80 °C for further analyses. Fish intestinal parasites, acanthocephalans, were manually isolated from the intestine using tweezers, counted in each specimen and stored at −80 °C. Gonads were used for sex determination and for the calculation of the fish gonadosomatic index.
Hard tissues, scales and otoliths were taken from each fish and stored in small paper bags. Around 15–20 scales were removed from the area closely above the lateral line and below the dorsal fin. The head of the fish was cut off directly behind the gills, and the skullcap was opened to remove the sagittal otoliths, which were cleaned from adherent tissue. Elemental fingerprints are suggested to be consistent between right and left otoliths [27]; therefore, only one otolith per fish was analyzed. A few other studies already confirmed significant correlation between concentrations of elements such as Al, Ba, Fe, Mg, Mn and Sr in the left and right otoliths of fish [5,28,29].

2.3. Preparation of Hepatic Cytosolic Fraction

Hepatic samples (n = 18 for the reference and n = 15 for the contaminated site) were homogenized via the addition (w/v 1:5) of cooled homogenization buffer (100 mM Tris-HCl/Base (Merck, Darmstadt, Germany, pH 8.1 at 4 °C) supplemented with reducing agent (1 mM dithiotreitol; DTT, Sigma, Ronkonkoma, NY, USA)). Homogenization was performed in ice-cooled tubes using 10 strokes of Potter–Elvehjem homogenizer (Glas-Col, Terre Haute, IN, USA). The resulting homogenates were centrifuged (Avanti J-E centrifuge, Beckman Coulter, Brea, CA, USA) at 50,000× g for 2 h at +4 °C to obtain hepatic soluble cytosolic fractions [16], which were stored at −80 °C until further metal analysis.

2.4. Acid Digestion of Muscle Tissue and Acanthocephalans

Digestion was performed in a dry oven at 85 °C for 3.5 h using concentrated HNO3 (Rotipuran® Supra 69%, Carl Roth, Germany) and 30% H2O2 (Suprapur®, Merck, Darmstadt, Germany) in appropriate volumes for muscle tissues (n = 6 per site) and acanthocephalans (n = 10 per site). Considering the low mass of the acanthocephalan specimens, individuals from the same fish were pooled together in order to perform reliable measurements. After digestion, the clear, colorless solutions of muscle and acanthocephalans were left to cool, and afterwards, they were stored at +4 °C.

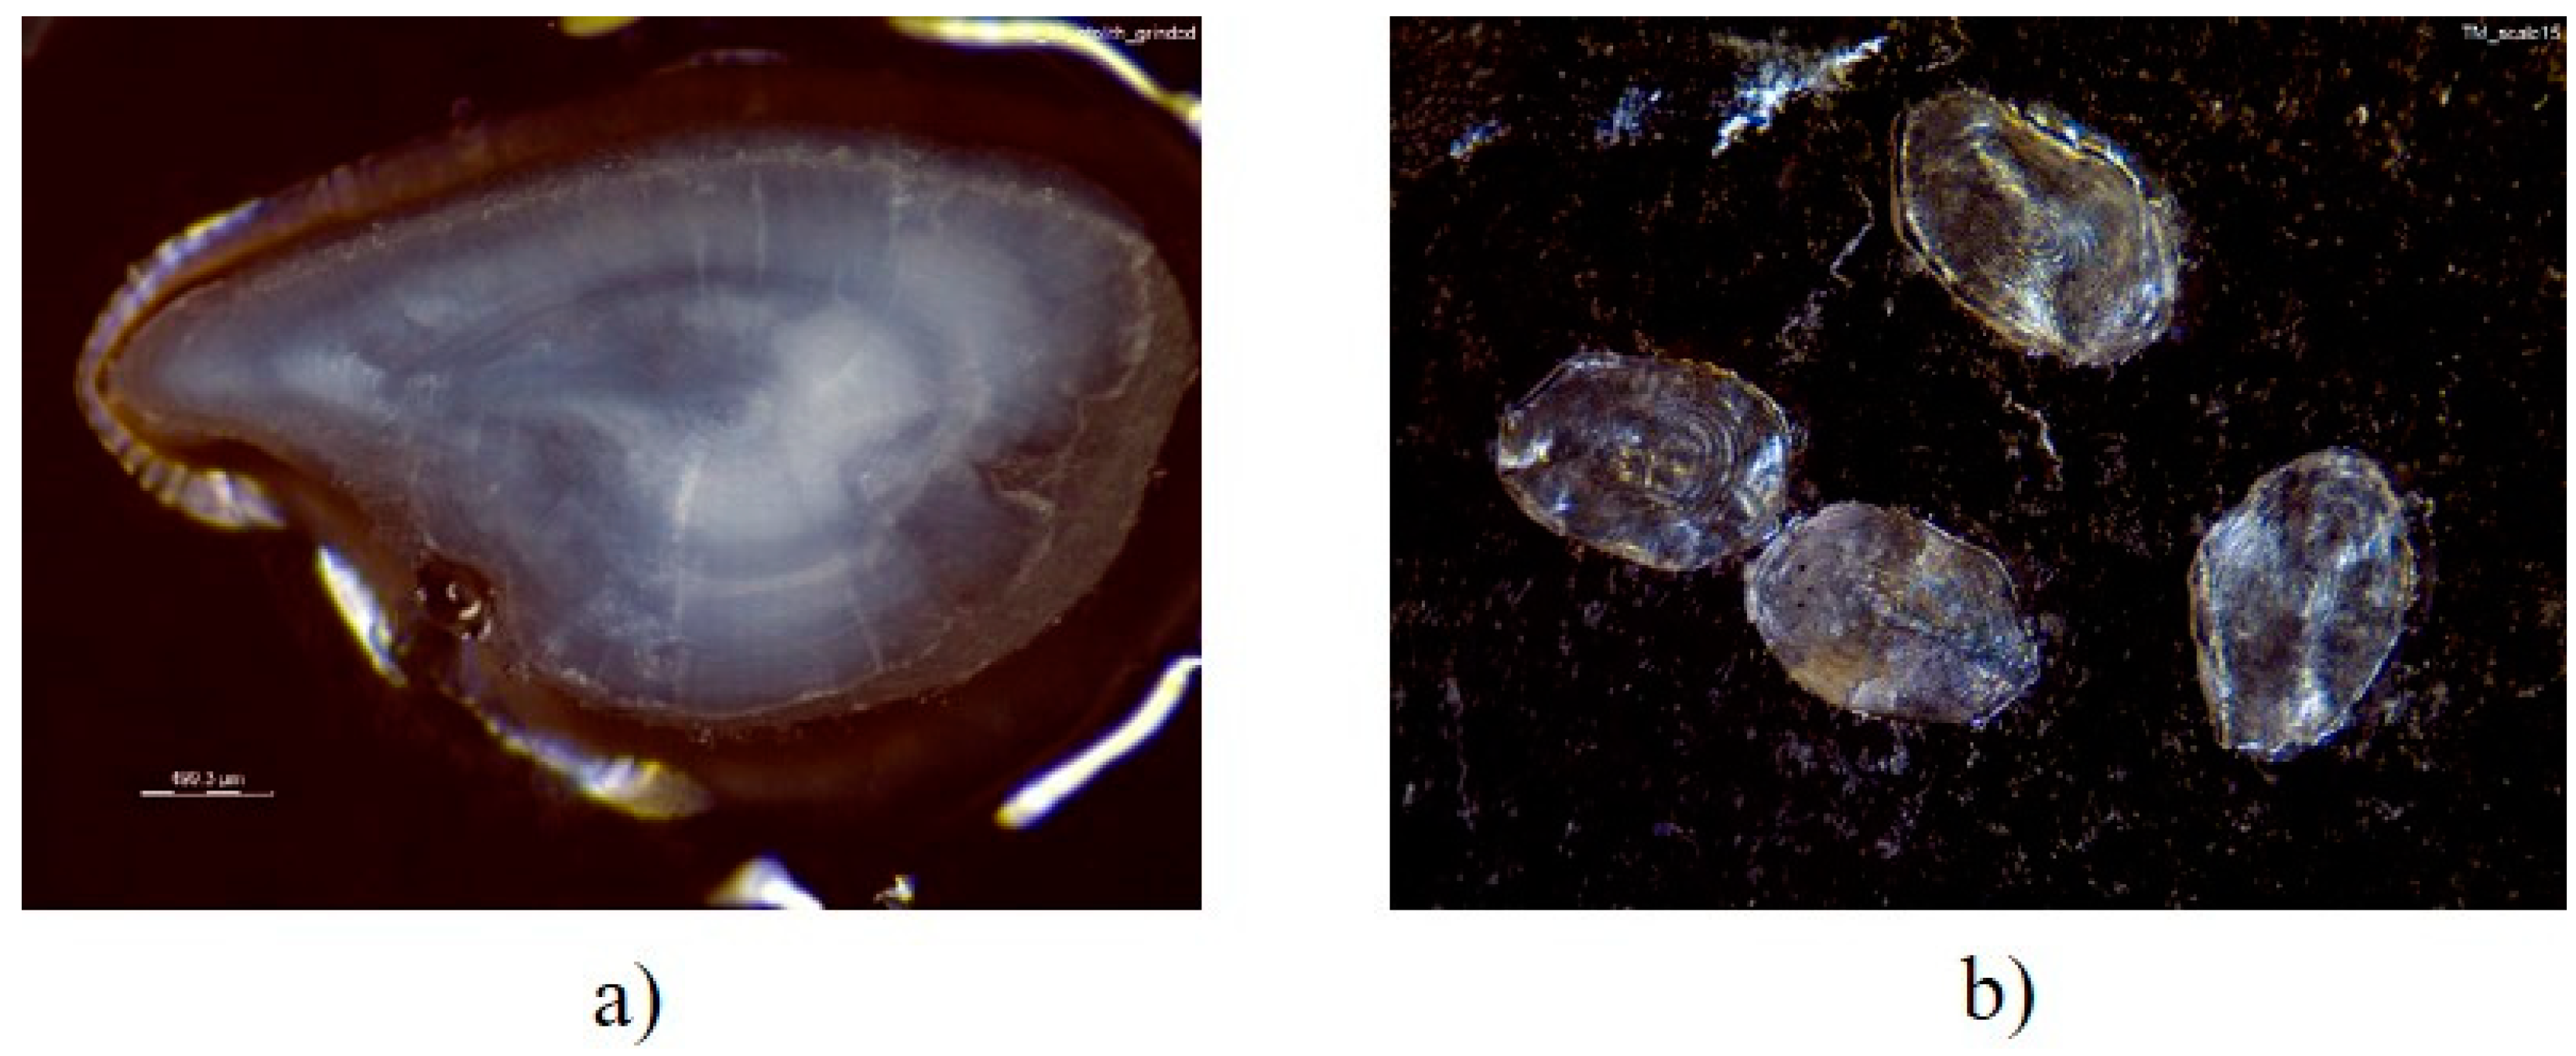
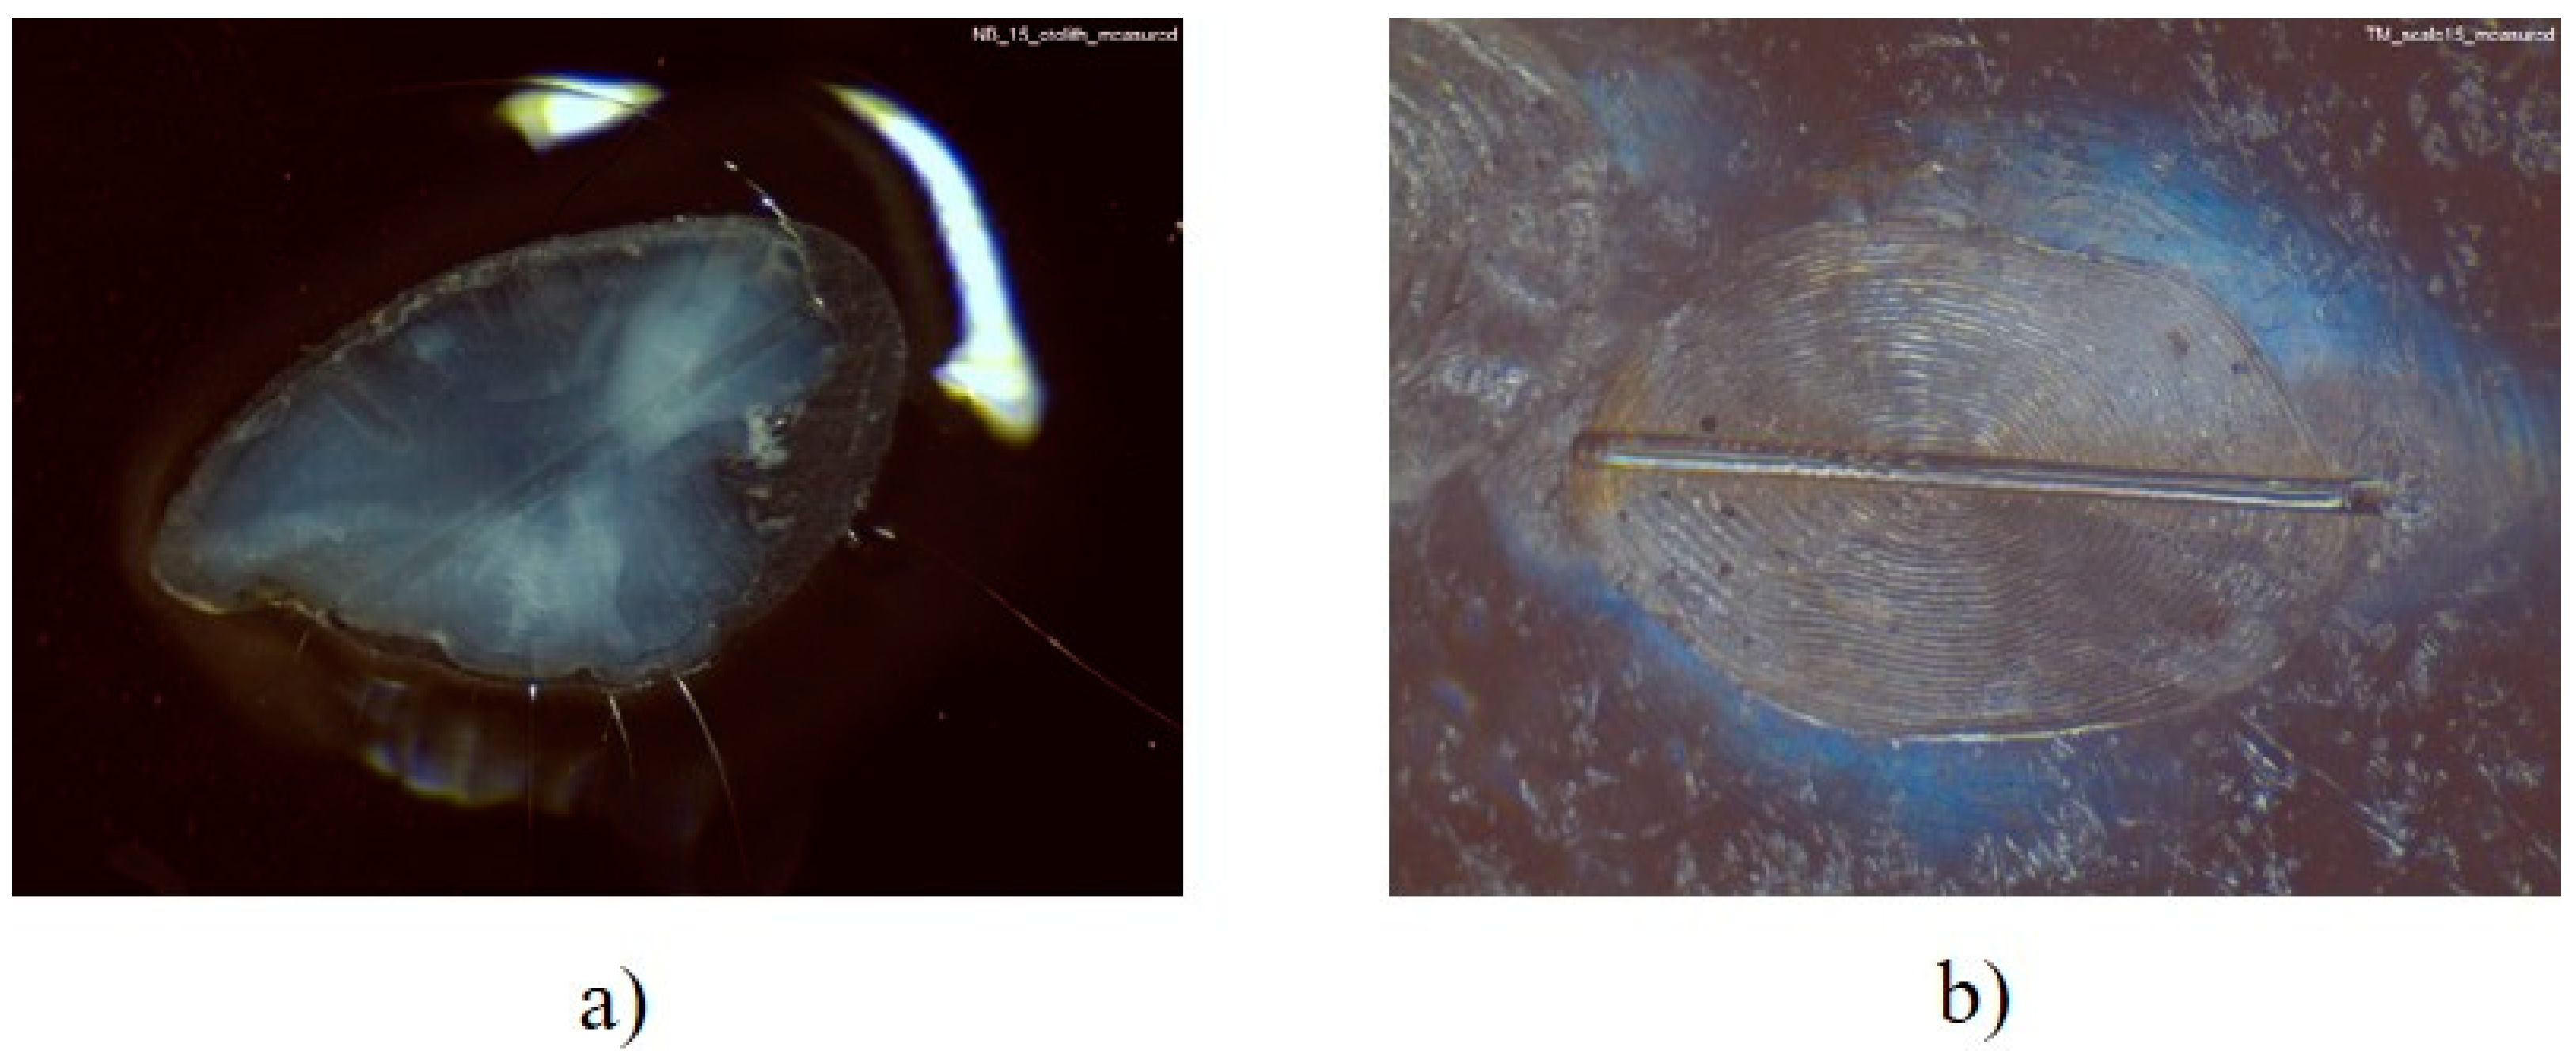
2.5. Calcified Tissue Preparation

Fish otoliths (one sagittus from each individual fish, n = 3 per site) were rinsed and sonicated in Type I reagent-grade water (18 MΩ cm) (F+LGmbH, Vienna, Austria) for 5 min and let to dry completely for about an hour. Dried otoliths were placed on small glass slides using adhesive Krazy glue (Instant Krazy Glue Pen, Elmer’s Products (Distributor), Westerville, OH, USA). After 24 h of hardening, otoliths were carefully ground and polished in small circular movements using lapping films of 30 μm and 3 μm for grinding and polishing (lapping film 266X, 3MTM) (Figure 2). Any remains from polishing were removed under the air flow. Scales of the same three fish per site were rinsed and sonicated in tubes in Type I reagent-grade water for 5 min and then completely cleaned in Type I reagent-grade water using a brush under a light microscope and left to dry. Each sample contained 4–6 scales, which were mounted on small glass slides using two-sided adhesive tape. Afterwards, they were observed under the microscope, and one scale with the most visible growth zones was chosen per sample for the subsequent lasering procedure (Figure 2). Selected scales and otoliths were photographed again, marked and stored in small plastic bags until further analysis using a laser ablation inductively coupled plasma mass spectrometer (LA ICP-MS).

2.6. Determination of Metal Content in Water, Fish Soft Tissues and Acanthocephalans

A high-resolution ICP-MS (HR ICP-MS, Element 2; Thermo Finnigan, Bremen, Germany) equipped with an autosampler SC-2 DX FAST (Elemental Scientific, Omaha, NE, USA) was used to analyze macro and trace elements in water, acanthocephalans and fish soft tissues. Prior to measurement, river water samples were 10 times diluted with Type I reagent-grade water for the determination of Mg due to its higher levels, whereas trace elements were measured directly in the prepared water samples. Hepatic cytosols were 100 times diluted for Mg and 10 times for trace element analyses, whereas digested muscle and acanthocephalans were 20 times diluted with Type I reagent-grade water for Mg analyses and 5 times for the measurements of trace elements.
Depending on the element, the measurement was operated in low (85Rb and 205Tl) or medium (24Mg, 55Mn, 56Fe, 66Zn, 86Sr and 138Ba) resolution mode. Multielement stock standard solution containing Ca 2.0 g L−1, Mg 0.4 g L−1, Na 1.0 g L−1 and K 2.0 g L−1 (Fluka, Darmstadt, Germany) was used as the calibration standard for the measurement of macro element Mg. Multielement standard solution for trace elements (Analytika, Prague, Czech Republic) supplemented with Rb (Sigma-Aldrich, Darmstadt, Germany) was used for the external calibration for the trace element analyses. Indium (1 μg L−1, Indium Atomic Spectroscopy Standard Solution, Fluka, Germany) was added to all solutions as an internal standard. The accuracy and the precision of HR ICP-MS measurements was tested using a quality control sample for macro-elements (QC Minerals, Catalog number 8052, UNEP GEMS, Burlington, ON, Canada) and for trace elements (QC trace metals, catalog number 8072, UNEP GEMS, Burlington, ON, Canada). Good agreement was observed between certified values and our data, resulting in the following average recoveries obtained during measurements of water, liver, muscle and acanthocephalans samples: Ba: 100.3 ± 2.7%, Mg: 95.9 ± 4.7%, Mn: 93.9 ± 11.8%, Sr: 99.9 ± 3.0% and Tl: 102.6 ± 5.5%.

2.7. Determination of Metal Contents in Hard Tissues

Laser ablation measurements were conducted by connecting a laser ablation system (NWR193, Electro Scientific Industries, Portland, OR, USA) to an HR ICP-MS (Element XR; Thermo Finnigan, Germany). Prior to LA-ICP-MS measurement, the instrument was optimized using the solution set-up in a daily routine for maximum intensity while maintaining low oxide and doubly charged ion rates. Cross-sectional line scans were taken through the whole length of the otoliths and scales and going through the core (Figure 3). The time-resolve information in these line scans is the subject of a different study.
The elements of interest showed minor variations as compared to the relative uncertainty of the LA-ICP-MS measurement (approximately 30%). Given limited habitat changes, average metal mass fractions were considered to study their accumulation in these hard tissues. Measurement involved isotopes 24Mg, 55Mn, 57Fe, 64Zn, 85Rb, 88Sr, 138Ba and 205Tl according to the following laser instrumental parameters: spot size of 100 µm, scan speed of 5 µm s−1, repetition rate of 15 Hz and energy of 50%. The otolith and scale samples were analyzed within one batch. At the beginning and the end of the batch, the following certified reference materials were ablated: (i) FEBS-1 (Otolith Certified Reference Material for Trace Metals, National Research Council Canada) and MACS-3 (Calcium carbonate standard, United States Geological Survey, 189 USA) were used as reference materials for the calculations of metal concentrations in otoliths. (ii) In addition, NIST SRM 1400 (Bone ash, National Institute of Standards and Technology, Gaithersburg, MD, USA) and NIST SRM 1486 (Bone meal, National Institute of Standards and Technology, Gaithersburg, MD, USA) were used in the case of the fish scales. Nano-pellets of FEBS-1 and MACS-3 were prepared by µstandards according to standard protocols (Garbe-Schönberg and Müller, 2014). In-house-pressed reference pellets of NIST SRM 1400 and NIST SRM 1486 were prepared using a hydraulic press (10 tons per cm2). All reference pellets were prepared without the addition of any binders. Calcium, as a main element in the aragonite matrix of otoliths (approximately 38%) [35] and in the hydroxyapatite matrix in scales (approximately 25%) [36], was used as internal standard because it only shows small variations in mass fractions. The final mass fractions in the otolith samples were calculated via MACS-3. FEBS-1 was used as quality control for the quantification. For the final calculation of metal mass fractions in scales, NIST SRM 1400, chosen as most suitable material, was used as a reference material. NIST SRM 1486 was used as quality control for the quantification. Differences in Ca content between the reference material used for calibration and the sample were considered in the calibration strategy. Good agreement was observed between certified values and our data, resulting in the following average recoveries obtained during LA-ICP-MS measurements of otolith and hydroxyapatite samples, which were within measurement uncertainties: Ba: 97 ± 15%, Mg: 108 ± 29%, Mn:89 ± 31%, Rb: 121 ± 18%, Sr:126 ± 37% and Zn: 123 ± 33%.

2.8. Data Processing and Statistical Analyses

2.8.1. Biological Data

The Fulton condition index was calculated as: FCI = (W/L3) × 100, the hepatosomatic index was calculated as: HSI = (LW/W) × 100 [37], and the gonadosomatic index was calculated as: GSI = (GW/W) × 100) [38], where W is the body mass (g), L is the total length (cm), LW is the liver mass (g) and GW is the gonad mass (g).
The level of parasite infection was quantified by calculating prevalence (the percentage of infected fish) and mean intensity (parasite number per host individual) according to Bush et al. (1997) [39].

2.8.2. Chemical Data

Metal levels were presented as mean values ± standard deviations for all types of samples and expressed according to IUPAC terminology: mass fraction ω (µg g−1) and mass concentration γ (g L−1). Therefore, elemental contents in water samples were expressed as mass concentration (µg L−1) and as mass fraction (µg g−1) in hard structures in fish (dry mass) and in soft parts (wet mass, w.m.). In muscle and acanthocephalans, total metal contents were measured, while the biologically available metal fraction was quantified in the cytosols of hepatic tissues in fish.
For the purpose of the comparison of soft and hard tissues, metal contents in soft tissues were expressed as µg g−1 of dry mass (d.m.) using the respective ratios between the wet and dry tissue masses. For the muscle tissue, we applied a factor of 4.75 based on the mean value of wet:dry ratios in muscles of 8 freshwater fish species from more than 20 locations in Croatia [40]. Considering hepatic samples, the mean value of 5.4 was used, as reported for the brown trout from Asturian rivers in Spain (5.14–6.83) [41], while for acanthocephalans, a conversion factor of wet:dry mass of 4.3 was determined based on 4 independent measurements during this study.
For the calculation of mean metal content in otoliths and scales, data were accumulated through the whole lines of the structures. The starting and ending point of the lines were determined by the inspection of Ca and Sr intensities to prevent the “edge effect” and to ensure that all analyzed points were within the scale/otolith area.

2.8.3. Statistics

SigmaPlot 11.0 (Systat Software, San Jose, CA, USA) for Windows was used for statistical analysis and for the creation of graphs. Nonparametric statistical tests were used because assumptions of normality and homogeneity of variance were not always met. The variability of metal levels between two data sets was tested using the Mann–Whitney U test, and statistically significant differences in metal concentrations between the two locations at the p < 0.05, p < 0.01 or p < 0.001 level were indicated.

3. Results and Discussion

3.1. Biometric Characteristics of S. trutta Sampled in the Krka River

Biometric data of fish from the two sampling sites did not show significant differences, although the mean fish total length and body mass were higher in the fish from the contaminated location (24.4 cm, 339.4 g) than in the fish from the reference location (20.4 cm, 114.4 g) (Table 1). Such a trend might be related to the presence of more organic matter and food sources downstream of the wastewater outlets [42]. The opposite trend was observed for gonadosomatic and Fulton condition indices, which were slightly higher at the reference than the contaminated site, but not significantly. Usually, decreased values of FCI can indicate the need to induce additional defense mechanisms in fish, which requires a lot of energy and consequently lowers a fish’s condition. The trend of lower FCI values in fish from the metal-polluted locations was already observed, for example, in wild yellow perch Perca flavescens [42] and Prussian carp Carassius gibelio [43,44]. However, in our study, the impact of present contamination on fish condition was not significant.
The total number, prevalence and mean intensity of infection with acanthocephalans were higher in fish from the reference site than those from the contaminated site (Table 1). Altogether, 685 acanthocephalans were isolated from the intestines of 17 infected fish individuals from the Krka River source, and 417 from 13 individuals from the Krka Knin. Accordingly, prevalence of 94% and 76% and mean intensity of infection of 40.3 and 32.1 were recorded at the Krka River source and at the Krka Knin, respectively (Table 1). Such a trend was in accordance with the sampling campaigns conducted in autumn 2015 and spring 2016 at the same research sites of the Krka River, where a prevalence of 83–100% was reported [45]. Vardić Smrzlić et al. (2013) [46] reported an average prevalence of 73% for D. truttae in brown trout from the few sites along the Krka River during 11 sampling campaigns from 2005 to 2008. In Italy, the prevalence of D. truttae in S. trutta from the Tirino River was comparable to our results (90.9–100%) [47], as well as the prevalence (81.2%) and the mean intensity of infection (46.2) in brown trout from the Lake Piediluco [48]. Generally, it was reported that a decrease in species richness, as well as the abundance of endoparasites with indirect life cycles, including acanthocephalans, might indicate pollution impact and stressful environmental conditions [49]. In our research, the decrease of around 20% at the wastewater-impacted site indicated moderate pollution, as was already reported regarding the physico-chemical water parameters and dissolved metal levels [50,51].

3.2. Metal Content in the River Water

The spatial variability of dissolved metal levels in the river water indicated higher metal levels at the Krka Knin than at the river source for the most of the measured metals, being significant for Ba, Fe, Mn, Rb, Sr and Zn (Table 2). The exceptions were Mg and Tl, the levels of which were higher at the reference location. Dissolved metal levels in the Krka River water followed the order at the reference site: Sr > Mg > Ba > Zn > Fe > Rb > Mn > Tl and at the anthropogenically impacted location Krka Knin: Sr > Zn > Fe > Mg > Mn > Ba > Rb > Tl, indicating the higher presence of metals often used in industrial manufacturing (Zn, Fe and Mn) downstream of the screw factory. Iron, Mn and Zn were among the elements with the most pronounced difference between the two investigated sites, with Mn being 673, Fe 34 and Zn 9 times higher at the contaminated site than the reference site (Table 2). Such a high metal increase could be related to the metal production facility, as Fe and Mn are often used in the manufacture of iron and steel alloys and manganese compounds, respectively [51,52]. Zinc is one of the most commonly used metals in the world due to its reducing and anti-corrosive properties, so it has high importance in industrial production. Therefore, we included the same elements in the analysis of biological samples, either due to their toxicity, essentiality or interesting patterns in water samples. Despite recorded spatial differences, metal contents of the Krka River water were still comparable with the other karst ecosystems [53,54] and, according to Filipović Marijić et al. (2018) [50] and Sertić Perić et al. (2018) [51], mostly below environmental quality standards and metal concentrations in the other rivers of technological or rural catchments. However, disturbances of environmental conditions were obvious at the contaminated site of Krka Knin regarding conductivity, chemical oxygen demand, levels of ammonium, total nitrogen, total phosphorus, nitrate and bacteria counts, which did not satisfy the requirements for the good water quality status [50]. As already described, such karst ecosystems are characterized by the effective self-purification process, which reduces the effect of pollution impact in the Krka River [54]. Therefore, metal levels at the location impacted by the wastewater outlets indicated obvious metal input but could be considered as an indication of moderate pollution impact.

3.3. Metal Content in Soft Tissues of Fish and Acanthocephalans

As metal concentrations in water may significantly vary over time, the extent of metal exposure was further evaluated in relation to aquatic organisms, applying commonly used fish liver and muscles and rarely used intestinal parasites, acanthocephalans, as bioindicators. Liver was selected as the main metabolic and detoxification site in the organism, which might reflect chronic exposure to metals [15,41], whereas muscle, due to its importance in human consumption, might represent a health risk for humans in the case of elevated metal content [14,55]. Spiny-headed worms, acanthocephalans, are already described as organisms of rapid and high metal accumulation capacity, which is an order of magnitude higher than in the other aquatic organisms [21,24,26]. Due to the high variability of metal levels among parasite individuals, their application as bioindicators in metal exposure assessment is still under question [21,23].
In our study, the pattern of higher metal levels at the contaminated site compared to the reference site was observed for Sr, Fe, Zn, Mn and Ba in liver, Mg, Mn, Ba, Rb, Sr and Zn in muscle and Zn, Fe, Sr, Mg, Mn and Ba in acanthocephalans (Table 3). The exceptions were Fe, Rb and Tl, showing around 1.6 higher Fe values in muscle of fish from the reference site compared to the contaminated site, 1.2–1.8 times higher Tl values in soft tissues and acanthocephalans and 1.3 times higher Rb in liver and acanthocephalans (Table 3). Other studies also conducted in the Krka River confirmed elevated Rb and Tl contents, as well as Cs and Cd, in liver [16] and the intestine of brown trout and gammarids from the river source rather than downstream locations [56,57]. Although higher metal accumulation in organisms could be an indication of higher exposure levels in the water, in our research, the levels of Tl were comparable, and in relation to Rb and Fe, even significantly higher in the water at the contaminated site compared to the reference site (Table 2). Therefore, the cause of the significantly higher content of these few elements in fish from the reference site could not simply be explained by waterborne uptake and requires further research considering river sediment and food as possible metal sources, i.e., dietborne metal uptake, which can even be a major route of exposure to some metals, including Tl [58,59]. In general, the contents of analyzed metals mostly followed the comparable order in both soft tissues and parasites, with the highest levels of Mg, Fe, Zn and Rb and the lowest of Ba and Tl. The exceptions were the lowest Sr contents in hepatic samples and lower Rb accumulation in acanthocephalans (Table 3). Regarding metal levels in fish parasites, their values were much more variable compared to those in soft tissues of fish (Table 3), confirming previous findings that metal contents among acanthocephalan individuals show high variability, possibly as a result of host mobility, different ages and consequently, different exposure times [19,26]. In addition, our results confirmed that metal levels in acanthocephalans were mostly higher than those in the fish soft tissues, as already reported in many studies involving parasites and fish liver, intestine, kidney or muscle [20,21,24,26].

3.4. Metal Content in Fish Scales and Otoliths

To gain an insight into the long-term metal exposure, metal levels were measured in fish scales and otoliths using LA-ICP-MS, recognized as the most representative technique for the precise analysis of several trace elements in solid samples at the same time, while measurements across laser lines give information on pollution exposure over the whole life history of a fish [8,60]. In the present pilot study, conducted in freshwater fish from Croatian rivers for the first time, the focus was put on the estimation of soft and hard tissue responses to the actual industrial and municipal contamination in the Krka River.
Fewer elements were reported for fish scales (Mg, Sr, Zn, Fe and Mn) than otoliths (Sr, Zn, Mg, Mn, Rb, Ba and Tl) due to the lack of suitable reference material. Those reported in both scales and otoliths mostly had higher levels in fish scales (Table 4), in accordance with a few other studies [61,62,63]. The largest difference between the two hard tissues was observed for Mg with around 53 times higher values in scales than in otoliths at both locations, followed by 10–13 times higher Mn and around 4 times higher Zn levels in scales (Table 4). Similar or even higher differences in Mg and Mn levels between scales and otoliths were reported by Wells et al. (2003) [61] for westslope cutthroat trout from the Coeur d’Alene River. Given the integral role of Mg in apatite formation and its significant levels in biologic hydroxyapatite, high values are expected to appear in scales [64,65]. Mean Mg values of around 4000 µg g−1 found in the scales of the brown trout in our research are comparable with the values reported for the scales of grass carp, common carp, and tench from the Czech Republic, and about two times higher than those reported in European perch [36,65,66]. Higher contents of Mn in fish scales than in otoliths were also consistent with the high affinity of both synthetic and biogenic apatites for Mn [61,67]. Higher Mn values than those found in brown trout in our research (9.26–20.81 µg g−1) were reported in the scales of other freshwater fish species (80–450 µg g−1) [36,66]. Further, higher metal burden in the scales in general could be due to their direct contact with water, possibly increasing the direct metal uptake, as well as due to known high ion-exchange properties of hydroxyapatite structures for metals and radionuclides and different metal uptakes [68]. The opposite trend between the calcified structures of brown trout from the Krka River was visible for Sr content with 4 times higher values obtained in otoliths than scales (Table 4), as already observed in different studies [62,63], probably due to the significant chemical association of Sr with Ca, which is the main component of otoliths [69].
In both scales and otoliths, mean levels of Sr, Mn and Zn tended to be higher at the contaminated site compared to the reference site, with Sr and Mn being around 2–2.5 and Zn around 1.5 times, whereas in otoliths, Rb and Tl levels were around 1.5 times higher at the reference site (Table 4), but a lack of significant differences is probably a consequence of there only being three samples per site. Hard tissues mostly confirmed patterns recorded in soft tissues of fish and in acanthocephalans (Table 3). As in the case of soft tissues, the resulting trends might be connected with significantly elevated Fe, Mn, Zn and Sr contents in the water samples from the contaminated site, whereas some other metal sources, and not the water, should be considered at the river source as a cause of the increased Tl and Rb levels in the otoliths. However, due to the limited number of samples in our study, significant spatial or tissue-specific differences were hard to detect, especially due to the variability of metal levels observed in both hard tissues. Differences in metal accumulation in calcified structures in fish was explained by the differences in ion precipitation, which are in scales incorporated into the crystal lattice from the blood [70], while ions precipitate in otoliths directly from the endolymph fluid [69], which shows less variations in ion levels than the blood [27]. Considering metal variability in our study, both calcified structures showed relatively high variability between fish individuals, as already stated in some other studies [61,62]. Variability was especially emphasized for Mn and Sr contents (Table 4), although in our research, such a finding should be considered with caution due to the small number of samples, and further investigation is required.
In connection to our specific goals regarding the hard tissue application, we mostly confirmed a higher metal accumulation capacity of scales compared to otoliths, as was seen in a few other studies [61,62,63]. Using scales rather than otoliths for the analysis could be advantageous for several reasons: elemental levels are generally higher, which reduces errors and increases the precision of measurements, especially for the elements present in very low contents; they are easy to collect and present a nonlethal alternative, which is especially beneficial if investigating some rare and endangered species; their preparation for the measurement on LA ICP-MS is easier and quicker and due to the scale growth and does not require a grinding procedure, which reduces the possibility of contamination and false element presence from the grinding material. However, there is one analytical and one biological disadvantage that both need to be overcome to completely and successfully apply scales in metal exposure assessments. The analytical problem refers to the lack of completely suitable reference material which would enable precise calculations of contents of more metals in scales, although in the literature, different approaches with NIST 1400, NIST 1486, NIST 610, NIST 612 or NIST 613 reference materials were used [36,62,71]. From the biological point of view, the regeneration and resorption of scales in the case of injuries or scale removal represent a possible problem as such scales are only distinguishable under the microscope, which is not always available and practical during field sampling. These new, regenerated scales do not show concentric patterns in the middle, and consequently, they cannot be used in a time-resolved manner because they do not represent the information on the whole life history of a fish. Nevertheless, even regenerated scales may be useful in interpreting environmental changes over a recent, short time span if the age of the regenerated scale is known [72].

3.5. Comparison of Metal Accumulation in Soft and Hard Fish Tissues and Acanthocephalans

Our final approach was to compare metal accumulation capacities among all used tissues of brown trout, liver, muscle, otoliths and scales, and their intestinal parasites, acanthocephalans. For this purpose, the results of metal contents in soft tissues and acanthocephalans were expressed as µg g−1 d.m. so they could be compared with hard tissue metal levels using the conversion factors on wet:dry ratios from our previous research and the literature data as already explained in Materials and Methods section. Based on this approach, it was obvious that metals showed the most efficient accumulation in acanthocephalans and liver (Fe, Zn, Rb, Tl, Ba), followed by fish scales (Zn, Mg, Mn), whereas in muscle and otoliths, the accumulation was lower, except for Sr in hard tissues and Mg and Rb in muscle.
As already stated, acanthocephalans are known as organisms of high accumulation capacity, while liver plays a main role in metal metabolism, uptake, storage and detoxification/elimination processes [41,63]. In contrast, fish muscle represents tissue with a low metabolic rate [14,24], resulting in the lowest metal levels. Scales showed the highest accumulation of Mg and Mn, which is in accordance with the study of Kalantzi et al. (2019) [63], who investigated elemental distribution in the different tissues of brood stock from Greek hatcheries. Magnesium is a major constituent of hard structures, whereas Mn is known to be mainly accumulated in bone tissues [61]. The research of Kalantzi et al. (2019) [63] is, to our knowledge, the only similar research on the distribution of metals and elements in the different soft and hard tissues of freshwater fish species, and, comparable to our research, the results indicated higher metal contents in the liver, kidney, bone and scales compared to the other body tissues and organs (gills, gonads, otoliths, stomach and muscle) of brood stocks. Rubidium, which was relatively high in muscle in our research, was also elevated in the muscles of brood stocks compared to other tissues [63]. Otoliths were also found to contain the lowest levels of most elements, except highly dominant Sr. Although otoliths are calcified tissues as well, they are mostly composed of aragonite, which has a lower metal affinity than apatite structures [63,68,73].

4. Conclusions

Despite the observed variability in metal levels and their accumulation patterns, which are dependent on tissue function, the uptake route and metabolism, ecological needs and physiology of fish, as well as the chemistry of each element, the comparison of spatial metal differences in all tissues revealed similar trends. Mostly higher Mn, Fe and Zn contents confirmed the impact of the screw factory near the contaminated site, since these elements are often used in that type of industry, while Mg, Rb and Tl were mostly higher at the reference site, pointing to the importance of considering not only the waterborne but also dietborne uptake routes. Therefore, hard tissues reflected the influence of metal contamination from different environmental sources such as water, food or sediments in correspondence to the fish soft tissues and fish intestinal parasites and might be considered as valuable traces of environmental pollution exposure.
However, there were differences in accumulation efficiency: acanthocephalans accumulated Ba, Tl and Zn most effectively compared to the fish tissues representing the combination of short- and long- term metal exposure, which confirmed their great potential and value as bioindicators in metal exposure assessment. Liver, as the main metabolically active and detoxifying fish organ, showed the highest accumulation of Fe and Rb, whereas Mg and Mn mostly accumulated in scales. On the other hand, metal accumulation, except for Sr, was the lowest in muscle or otoliths, both considered as more metabolically inert tissues. Hence, acanthocephalans accumulated most metals more effectively than the fish soft tissues, and therefore, were shown to be rapid and sensitive indicators of bioavailable metal levels and their changes in the environment. The possible application of scales as a nonlethal tool in monitoring programs showed strengths such as high accumulation rate and easy handling, but also a high variability in metal levels between the scales and the lack of reliable reference materials to calibrate concentrations of more elements. Altogether, metal contents in biota and water of the Krka River still showed moderate contamination, but differences between the sites pointed to existing disturbances at the location near the Town of Knin and showed the need for strict monitoring of this sensitive area.

Author Contributions

Conceptualization, V.F.M.; validation, V.F.M., Z.D., A.R. and T.P.; formal analysis, T.M.; investigation, V.F.M., T.M., Z.D., A.R., A.Z., T.P., N.B., Z.R., I.G., N.K., D.I., I.V.S. and M.E.; resources, V.F.M., T.M., N.B., D.V., D.K., J.Ž. and M.E.; writing—original draft preparation, T.M.; writing—review and editing, V.F.M., T.M., A.Z., T.P. and M.E.; visualization, T.M.; supervision, V.F.M.; project administration, V.F.M. and T.P.; funding acquisition, V.F.M. and M.E. All authors have read and agreed to the published version of the manuscript.

Funding

This work was supported by the Adris Foundation for the project “Evaluation of the Krka River water quality and potential risk to the Krka National Park by application of new bioindicators and biomarkers”; the Croatian Science Foundation (project no. IP-2014-09-4255 “AQUAMAPMET” and IP-2020-02-8502 “BIOTOXMET”) and the COMET-K1 competence center FFoQSI funded by the Austrian ministries BMVIT, BMDW and the Austrian provinces Niederoesterreich, Upper Austria and Vienna within the scope of COMET—Competence Centers for Excellent Technologies.

Institutional Review Board Statement

Fish sampling and sacrifice were performed by scientists who possessed a license to work with laboratory animals (FELASA category C) in the Laboratory for Biological Effects of Metals of Ruđer Bošković Institute, a laboratory for fish sacrifice and work with fish bodies, organs and tissues, authorized by the Ministry of Agriculture, Veterinary and Food Safety Department (License number: HR-POK-025). Fish were anesthetized and sacrificed using anesthetic tricaine methanesulfonate (MS 222, Sigma Aldrich) in accordance with the Croatian Ordinance on the protection of animals used for scientific purposes.

Informed Consent Statement

Not applicable.

Data Availability Statement

The data supporting the findings of this study are available within the article or are available upon request.

Acknowledgments

This work was supported by the Adris Foundation for the project “Evaluation of the Krka River water quality and potential risk to the Krka National Park by application of new bioindicators and biomarkers” and Croatian Science Foundation (project no. IP-2014-09-4255 “AQUAMAPMET” and IP-2020-02-8502 “BIOTOXMET”). The Croatian–Austrian Bilateral Project “Investigation of novel bioindicators of metal exposure in the aquatic ecosystems: fish intestinal parasites, cell cytosol and calcified structures” and the CEEPUS scholarship program are acknowledged for the scientific collaboration and scholarship stays at the BOKU University. We acknowledge the support by the COMET-K1 competence center FFoQSI funded by the Austrian ministries BMVIT, BMDW and the Austrian provinces Niederoesterreich, Upper Austria and Vienna within the scope of COMET—Competence Centers for Excellent Technologies. The program COMET is handled by the Austrian Research Promotion Agency FFG. Special thanks are due to Christine Opper, Melanie Diesner and Anastassiya Tchaikovsky for their technical support or for checking the data and calculations on the hard tissues.

Conflicts of Interest

The authors declare no conflict of interest. The funders had no role in the design of the study; in the collection, analyses, or interpretation of data; in the writing of the manuscript, or in the decision to publish the results.

References

  1. Boyd, R.S. Heavy Metal Pollutants and Chemical Ecology: Exploring New Frontiers. J. Chem. Ecol. 2010, 36, 46–58. [Google Scholar] [CrossRef]
  2. Authman, M.M.N.; Zaki, M.S.; Khallaf, E.A.; Abbas, H.H. Use of Fish as Bio-indicator of the Effects of Heavy Metals Pollution. J. Aquac. Res. Dev. 2015, 6, 328–340. [Google Scholar] [CrossRef]
  3. de Paiva Magalhães, D.; da Costa Marques, M.R.; Baptista, D.F.; Buss, D.F. Metal bioavailability and toxicity in freshwaters. Environ. Chem. Lett. 2015, 13, 69–87. [Google Scholar] [CrossRef]
  4. Geffen, A.J.; Jarvis, K.; Thorpe, J.P.; Leah, R.T.; Nash, R.D.M. Spatial differences in the trace element concentrations of Irish Sea plaice Pleuronectes platessa and whiting Merlangius merlangus otoliths. J. Sea Res. 2003, 50, 247–254. [Google Scholar] [CrossRef]
  5. Campana, S.E.; Fowler, A.J.; Jones, C.M. Otolith elemental fingerprinting for stock identification of Atlantic cod (Gadus morhua) using laser ablation ICP MS. Can. J. Fish. Aquat. Sci. 1994, 51, 1942–1950. [Google Scholar] [CrossRef] [Green Version]
  6. Milton, D.; Halliday, I.; Sellin, M.; Marsh, R.; Staunton-Smith, J.; Woodhead, J. The effect of habitat and environmental history on otolith chemistry of barramundi Lates calcarifer in estuarine populations of a regulated tropical river. Estuar. Coast. Shelf Sci. 2008, 78, 301–315. [Google Scholar] [CrossRef]
  7. Tabouret, H.; Bareille, G.; Claverie, F.; Pécheyran, C.; Prouzet, P.; Donard, O.F.X. Simultaneous use of strontium:calcium and barium:calcium ratios in otoliths as markers of habitat: Application to the European eel (Anguilla anguilla) in the Adour basin, South West France. Mar. Environ. Res. 2010, 70, 35–45. [Google Scholar] [CrossRef] [Green Version]
  8. Prohaska, T.; Irrgeher, J.; Zitek, A. Simultaneous multi-element and isotope ratio imaging of fish otoliths by laser ablation split stream ICP-MS/MC ICP-MS. J. Anal. At. Spectrom. 2016, 31, 1612–1621. [Google Scholar] [CrossRef] [Green Version]
  9. Sawhney, A.K.; Johal, M.S. Potential application of elemental analysis of fish otoliths as pollution indicator. Bull. Environ. Contam. Toxicol. 1999, 63, 698–702. [Google Scholar] [CrossRef]
  10. Adami, G.; Miletić, M.; Siviero, P.; Barbieri, P.; Reisenhofer, E. Metal contents in tench otoliths: Relationships to the aquatic environment. Ann. Chim. 2001, 91, 401–408. [Google Scholar]
  11. Saquet, M.; Halden, N.M.; Babaluk, J.; Campbell, J.L.; Nejedly, Z. Micro-PIXE analysis of trace element variation in otoliths from fish collected near acid mine tailings: Potential for monitoring contaminant dispersal. Nucl. Instrum. Methods Phys. Res. B 2002, 189, 196–201. [Google Scholar] [CrossRef]
  12. Darafsh, F.; Mashinchian, A.; Fatemi, M.; Jamili, S. Study of the application of fish scale as bioindicator of heavy metal pollution (Pb, Zn) in the Cyprinus carpio of the Caspian Sea. Res. J. Environ. Sci. 2008, 2, 438–444. [Google Scholar] [CrossRef]
  13. Ranaldi, M.M.; Gagnon, M.M. Trace metal incorporation in otoliths of black bream (Acanthopagrus butcheri Munro), an indicator of exposure to metal contamination. Water Air Soil Pollut. 2008, 194, 31–43. [Google Scholar] [CrossRef] [Green Version]
  14. Jarić, I.; Višnjić-Jeftić, Ž.; Cvijanović, G.; Gačić, Z.; Jovanović, L.; Skorić, S.; Lenhardt, M. Determination of differential heavy metal and trace element accumulation in liver, gills, intestine and muscle of sterlet (Acipenser ruthenus) from the Danube River in Serbia by ICP-OES. Microchem. J. 2011, 98, 77–81. [Google Scholar] [CrossRef]
  15. Krasnići, N.; Dragun, Z.; Erk, M.; Raspor, B. Distribution of selected essential (Co, Cu, Fe, Mn, Mo, Se, and Zn) and nonessential (Cd, Pb) trace elements among protein fractions from hepatic cytosol of European chub (Squalius cephalus L.). Environ. Sci. Pollut. Res. 2013, 20, 2340–2351. [Google Scholar] [CrossRef] [Green Version]
  16. Dragun, Z.; Filipović Marijić, V.; Krasnići, N.; Ivanković, D.; Valić, D.; Žunić, J.; Kapetanović, D.; Vardić Smrzlić, I.; Redžović, Z.; Grgić, I.; et al. Total and cytosolic concentrations of twenty metals/metalloids in the liver of brown trout Salmo trutta (Linnaeus, 1758) from the karstic Croatian river Krka. Ecotoxicol. Environ. Saf. 2018, 147, 537–549. [Google Scholar] [CrossRef] [Green Version]
  17. Muhlfeld, C.C.; Marotz, B. Seasonal movement and habitat use by subadult bull trout in the upper Flathead River system, Montana. N. Am. J. Fish. Manag. 2005, 25, 797–810. [Google Scholar] [CrossRef]
  18. Bath, G.E.; Thorrold, S.R.; Jones, C.M.; Campana, S.E.; Mclaren, J.W.; Lam, J.W.H. Strontium and barium uptake in aragonitic otoliths of marine fish. Geochim. Cosmochim. Acta 2000, 64, 1705–1714. [Google Scholar] [CrossRef]
  19. Filipović Marijić, V.; Vardić Smrzlić, I.; Raspor, B. Does fish reproduction and metabolic activity influence metal levels in fish intestinal parasites, acanthocephalans, during fish spawning and post-spawning period? Chemosphere 2014, 112, 449–455. [Google Scholar] [CrossRef] [PubMed]
  20. Filipović Marijić, V.; Vardić Smrzlić, I.; Raspor, B. Effect of acanthocephalan infection on metal, total protein and metallothionein concentrations in European chub from a Sava River section with low metal contamination. Sci. Total Environ. 2013, 463–464, 772–780. [Google Scholar] [CrossRef] [PubMed]
  21. Sures, B.; Nachev, M.; Selbach, C.; Marcogliese, D.J. Parasite responses to pollution: What we know and where we go in ‘Environmental Parasitology’. Parasites Vectors 2017, 10, 65–83. [Google Scholar] [CrossRef] [Green Version]
  22. Sures, B. The use of fish parasites as bioindicators of heavy metals in aquatic ecosystems: A review. Aquat. Ecol. 2001, 35, 245–255. [Google Scholar] [CrossRef]
  23. Sures, B. Environmental parasitology: Relevancy of parasites in monitoring environmental pollution. Trends Parasitol. 2004, 20, 170–177. [Google Scholar] [CrossRef] [PubMed]
  24. Nachev, M.; Sures, B. Seasonal profile of metal accumulation in the acanthocephalan Pomphorhynchus laevis: A valuable tool to study infection dynamics and implications for metal monitoring. Parasites Vectors 2016, 9, 300–308. [Google Scholar] [CrossRef] [Green Version]
  25. Thielen, F.; Zimmermann, S.; Baska, F.; Taraschewski, H.; Sures, B. The intestinal parasite Pomphorhynchus laevis (Acanthocephala) from barbel as a bioindicator for metal pollution in the Danube River near Budapest, Hungary. Environ. Pollut. 2004, 129, 421–429. [Google Scholar] [CrossRef] [PubMed]
  26. Sures, B.; Siddall, R.; Taraschewski, H. Parasites as accumulation indicators of heavy metal pollution. Parasitol. Today 1999, 15, 16–21. [Google Scholar] [CrossRef]
  27. Campana, S.E.; Chouinard, G.A.; Hanson, J.M.; Frechet, A.; Brattey, J. Otolith elemental fingerprints as biological tracers of fish stocks. Fish. Res. 2000, 46, 343–357. [Google Scholar] [CrossRef]
  28. Rooker, J.R.; Zdanowicz, V.S.; Secor, D.H. Chemistry of tuna otoliths: Assessment of base composition and postmortem handling effects. Mar. Biol. 2001, 139, 35–43. [Google Scholar]
  29. Huxham, M.; Kimani, E.; Newton, J.; Augley, J. Stable isotope records from otoliths as tracers of fish migration in a mangrove system. J. Fish. Biol. 2007, 70, 1554–1567. [Google Scholar] [CrossRef]
  30. Wallace, W.G.; Lee, B.-G.; Luoma, S.N. Subcellular compartmentalization of Cd and Zn in two bivalves. I. Significance of metal-sensitive fractions (MSF) and biologically detoxified metal (BDM). Mar. Ecol. Prog. Ser. 2003, 249, 183–197. [Google Scholar] [CrossRef]
  31. Rainbow, P.S.; Luoma, S.N.; Wang, W.X. Trophically available metal—a variable feast. Environ. Pollut. 2011, 159, 2347–2349. [Google Scholar] [CrossRef]
  32. Urien, N.; Cooper, S.; Caron, A.; Sonnenberg, H.; Rozon-Ramilo, L.; Campbell, P.C.G. Subcellular partitioning of metals and metalloids (As, Cd, Cu, Se and Zn) in liver and gonads of wild white suckers (Catostomus commersonii) collected downstream from a mining operation. Aquat. Toxicol. 2018, 202, 105–116. [Google Scholar] [CrossRef] [Green Version]
  33. Croatian Normative Document HRN EN 14011:2005. Water Quality—Sampling of Fish with Electricity [Kakvoća Vode—Uzorkovanje Riba električnom Strujom, in Croatian]. 2005. Available online: https://standards.iteh.ai/catalog/standards/cen/cd873486-340e-4ee6-ad71-2fbdf24907cc/en-14011-2003 (accessed on 12 December 2021).
  34. Official Gazette of the Republic of Croatia NN 55/2013. Regulation on the Protection of Animals Used for Scientific Purposes [Pravilnik o Zaštiti životinja Koje se Koriste u Znanstvene Svrhe, in Croatian]. 2013. Available online: https://www.ecolex.org/details/legislation/european-union-protection-of-animals-used-for-scientific-purposes-regulations-2012-si-no-543-of-2012-lex-faoc121063/ (accessed on 12 December 2021).
  35. Sturgeon, R.E.; Willie, S.N.; Yang, L.; Greenberg, R.; Spatz, R.O.; Chen, Z.; Scriver, C.; Clancy, V.; Lam, J.W.; Thorrold, S. Certification of a fish otolith reference material in support of quality assurance for trace element analysis. J. Anal. At. Spectrom. 2005, 20, 1067–1071. [Google Scholar] [CrossRef] [Green Version]
  36. Holá, M.; Kalvoda, J.; Bábek, O.; Brzobohatý, R.; Holoubek, I.; Kanický, V.; Škoda, R. LA-ICP-MS heavy metal analyses of fish scales from sediments of the Oxbow Lake Certak of the Morava River (Czech Republic). Environ. Geol. 2010, 58, 141–151. [Google Scholar] [CrossRef]
  37. Heidinger, R.C.; Crawford, S.D. Effect of temperature and feeding rate on the liver-somatic index of largemouth bass, Micropterus salmoides. J. Fish. Res. Board Can. 1977, 34, 633–638. [Google Scholar] [CrossRef]
  38. Wootton, R.J. Ecology of Teleost Fishes; Fish and Fisheries Series 1; Chapman and Hall: London, UK; New York, NY, USA, 1990. [Google Scholar]
  39. Bush, A.O.; Lafferty, K.D.; Lotz, J.M.; Shostak, A.W. Parasitology meets ecology on its own terms: Margolis et al. revisited. J. Parasitol. 1997, 83, 575–583. [Google Scholar] [CrossRef] [PubMed]
  40. Mikac, N.; Filipović Marijić, V.; Mustafić, P.; Lajtner, J. Development of Methodology for Monitoring the Elements of Chemical Status in Biota of Freshwater Ecosystem [Report in Croatian]; Ruđer Bošković Institute: Zagreb, Croatia, 2018. [Google Scholar]
  41. Linde, A.R.; Sánchez-Galán, S.; Izquierdo, J.I.; Arribas, P.; Marañón, E.; García-Vázquez, E. Brown trout as biomonitor of heavy metal pollution: Effect of age on the reliability of the assessment. Ecotoxicol. Environ. Saf. 1998, 40, 120–125. [Google Scholar] [CrossRef]
  42. Couture, P.; Rajotte, J.W. Morphometric and metabolic indicators of metal stress in wild yellow perch (Perca flavescens) from Sudbury, Ontario: A review. J. Environ. Monit. 2003, 5, 216–221. [Google Scholar] [CrossRef]
  43. Zhelev, Z.M.; Mollova, D.; Boyadziev, P. Morphological and hematological parameters of Carassius gibelio (Pisces: Gyprinidae) in conditions of anthropogenic pollution in Southern Bulgaria. Use hematological parameters as biomarkers. Trakia J. Sci. 2016, 14, 1–15. [Google Scholar] [CrossRef]
  44. Zhelev, Z.M.; Tsonev, S.V.; Boyadziev, P.S. Significant changes in morpho physiological and haematological parameters of Carassius gibelio (Bloch, 1782) (Actinopterygii: Cyprinidae) as response to sporadic effusions of industrial wastewater into the Sazliyka River, Southern Bulgaria. Acta Zool. Bulg. 2018, 70, 547–556. [Google Scholar]
  45. Mijošek, T.; Filipović Marijić, V.; Dragun, Z.; Ivanković, D.; Krasnići, N.; Redžović, Z.; Veseli, M.; Gottstein, S.; Lajtner, J.; Sertić Perić, M.; et al. Thallium accumulation in different organisms from karst and lowland rivers of Croatia under wastewater impact. Environ. Chem. 2020, 17, 201–212. [Google Scholar] [CrossRef]
  46. Vardić Smrzlić, I.; Valić, D.; Kapetanović, D.; Dragun, Z.; Gjurčević, E.; Ćetković, H.; Teskeredžić, E. Molecular characterisation and infection dynamics of Dentitruncus truttae from trout (Salmo trutta and Oncorhynchus mykiss) in Krka River, Croatia. Vet. Parasitol. 2013, 197, 604–613. [Google Scholar]
  47. Paggi, L.; Orecchia, P.; Del Marro, M.; Iori, A.; Manilla, G. Parasites of Salmo trutta from the Tirino River II. Host-Parasite interactions of helminth species. Parassitologia 1978, 20, 161–168. [Google Scholar] [PubMed]
  48. Dezfuli, B.S.; Giovinazzo, G.; Lui, A.; Giari, L. Inflammatory response to Dentitruncus truttae (Acanthocephala) in the intestine of brown trout. Fish Shellfish Immunol. 2008, 24, 726–733. [Google Scholar] [CrossRef]
  49. Marcogliese, D.J. Parasites: Small players with crucial roles in the ecological theater. EcoHealth 2004, 1, 151–164. [Google Scholar] [CrossRef]
  50. Filipović Marijić, V.; Kapetanović, D.; Dragun, Z.; Valić, D.; Krasnići, N.; Redžović, Z.; Grgić, I.; Žunić, J.; Kružlicová, D.; Nemeček, P.; et al. Influence of technological and municipal wastewaters on vulnerable karst riverine system, Krka River in Croatia. Environ. Sci. Pollut. Res. 2018, 25, 4715–4727. [Google Scholar] [CrossRef]
  51. Sertić Perić, M.; Matoničkin Kepčija, R.; Miliša, M.; Gottstein, S.; Lajtner, J.; Dragun, Z.; Filipović Marijić, V.; Krasnići, N.; Ivanković, D.; Erk, M. Benthos-drift relationships as proxies for the detection of the most suitable bioindicator taxa in flowing waters—a pilot-study within a Mediterranean karst river. Ecotoxicol. Environ. Saf. 2018, 163, 125–135. [Google Scholar] [CrossRef]
  52. WHO. Manganese in Drinking-water. In Background Document for Development of WHO Guidelines for Drinking-Water Quality; World Health Organization: Geneva, Switzerland, 2011. [Google Scholar]
  53. Dossi, C.; Ciceri, E.; Giussani, B.; Pozzi, A.; Galgaro, A.; Viero, A.; Vigano, A. Water and snow chemistry of main ions and trace elements in the karst system of Monte Pelmo massif (Dolomites, Eastern Alps, Italy). Mar. Freshw. Res. 2007, 58, 649–656. [Google Scholar] [CrossRef]
  54. Cukrov, N.; Cmuk, P.; Mlakar, M.; Omanović, D. Spatial distribution of trace metals in the Krka River, Croatia. An example of the self-purification. Chemosphere 2008, 72, 1559–1566. [Google Scholar] [CrossRef]
  55. Carvalho, M.L.; Santiago, S.; Nunes, M.L. Assessment of the essential element and heavy metal content of edible fish muscle. Anal. Bioanal. Chem. 2005, 382, 426–432. [Google Scholar] [CrossRef] [PubMed]
  56. Mijošek, T.; Filipović Marijić, V.; Dragun, Z.; Ivanković, D.; Krasnići, N.; Erk, M.; Gottstein, S.; Lajtner, J.; Sertić Perić, M.; Matoničkin Kepčija, R. Comparison of electrochemically determined metallothionein concentrations in wild freshwater salmon fish and gammarids and their relation to total and cytosolic metal levels. Ecol. Indic. 2019, 105, 188–198. [Google Scholar] [CrossRef]
  57. Mijošek, T.; Filipović Marijić, V.; Dragun, Z.; Krasnići, N.; Ivanković, D.; Erk, M. Evaluation of multi-biomarker response in fish intestine as an initial indication of anthropogenic impact in the aquatic karst environment. Sci. Total Environ. 2019, 660, 1079–1090. [Google Scholar] [CrossRef]
  58. Clearwater, S.J.; Baskin, S.J.; Wood, C.M.; McDonald, D.G. Gastrointestinal uptake and distribution of copper in rainbow trout. J. Exp. Biol. 2000, 203, 2455–2466. [Google Scholar] [CrossRef]
  59. Lapointe, D.; Couture, P. Influence of the route of exposure on the accumulation and subcellular distribution of nickel and thallium in juvenile fathead minnows (Pimephales promelas). Arch. Environ. Contam. Toxicol. 2009, 57, 571–580. [Google Scholar] [CrossRef] [PubMed]
  60. Zitek, A.; Sturm, M.; Waidbacher, H.; Prohaska, T. Discrimination of wild and hatchery trout by natural chronological patterns of elements and isotopes in otoliths using LA-ICP-MS. Fish. Manag. Ecol. 2010, 17, 435–445. [Google Scholar] [CrossRef]
  61. Wells, B.K.; Rieman, B.E.; Clayton, J.L.; Horan, D.L.; Jones, C.M. Relationships between water, otolith, and scale chemistries of westslope cutthroat trout from the Coeur d”Alene River, Idaho: The potential application of hard-part chemistry to describe movements in freshwater. Trans. Am. Fish. Soc. 2003, 132, 409–424. [Google Scholar] [CrossRef]
  62. Ramsay, A.L.; Milner, N.J.; Hughes, R.N.; McCarthy, I.D. Comparison of the performance of scale and otolith microchemistry as fisheries research tools in a small upland catchment. Can. J. Fish. Aquat. Sci. 2011, 68, 823–833. [Google Scholar] [CrossRef]
  63. Kalantzi, I.; Mylona, K.; Pergantis, S.A.; Coli, A.; Panopoulos, S.; Tsapakis, M. Elemental distribution in the different tissues of brood stock from Greek hatcheries. Aquaculture 2019, 503, 175–185. [Google Scholar] [CrossRef]
  64. Bigi, A.; Foresti, E.; Gregorini, R.; Ripamonti, A.; Roveri, N.; Shah, J.S. The role of magnesium on the structure of biological apatites. Calcif. Tissue Int. 1992, 50, 439–444. [Google Scholar] [CrossRef] [PubMed]
  65. Kalvoda, J.; Novak, M.; Bábek, O.; Brzobohatý, R.; Holá, M.; Holoubek, I.; Kanický, V.; Škoda, R. Compositional changes in fish scale hydroxylapatite during early diagenesis; an example from an abandoned meander. Biogeochemistry 2009, 94, 197–215. [Google Scholar] [CrossRef]
  66. Holá, M.; Kalvoda, J.; Nováková, H.; Škoda, R.; Kanický, V. Possibilities of LA-ICP-MS technique for the spatial elemental analysis of the recent fish scales: Line scan vs. depth profiling. Appl. Surf. Sci. 2011, 257, 1932–1940. [Google Scholar] [CrossRef]
  67. Bostick, W.D.; Stevenson, R.J.; Harris, L.A.; Peery, D.; Hall, J.R.; Shoemaker, J.L.; Jarabek, R.J.; Munday, E.B. Use of Apatite for Chemical Stabilization of Subsurface Contaminants; National Energy Technology Laboratory: Pittsburgh, PA, USA, 2003. [Google Scholar]
  68. Goto, T.; Sasaki, K. Effects of trace elements in fish bones on crystal characteristics of hydroxyapatite obtained by calcination. Ceram. Int. 2014, 40, 10777–10785. [Google Scholar] [CrossRef]
  69. Campana, S.E. Chemistry and composition of fish otoliths: Pathways, mechanisms and applications. Mar. Ecol.-Prog. Ser. 1999, 188, 263–297. [Google Scholar] [CrossRef] [Green Version]
  70. Veinott, G.; Northcote, T.; Rosenau, M.; Evans, R.D. Concentrations of strontium in the pectoral fin rays of the white sturgeon (Acipenser transmontanus) by laser ablation sampling-inductively coupled plasma- mass spectrometry as an indicator of marine migrations. Can. J. Fish. Aquat. Sci. 1999, 56, 1981–1990. [Google Scholar] [CrossRef]
  71. Clarke, A.D.; Telmer, K.H.; Shrimpton, J.M. Elemental analysis of otoliths, fin rays and scales: A comparison of bony structures to provide population and life-history information for the Arctic grayling (Thymallus arcticus). Ecol. Freshw. Fish. 2007, 16, 354–361. [Google Scholar] [CrossRef]
  72. Hammond, M.P.; Savage, C. Use of regenerated scales and scale marginal increments as indicators of recent dietary history in fish. Estuar. Coast. 2009, 32, 340–349. [Google Scholar] [CrossRef]
  73. Adey, E.A.; Black, K.D.; Sawyer, T.; Shimmield, T.M.; Trueman, C.N. Scale microchemistry as a tool to investigate the origin of wild and farmed Salmo salar. Mar. Ecol. Prog. Ser. 2009, 390, 225–235. [Google Scholar] [CrossRef]
Figure 1. The map of the Krka River with indicated sampling locations (1—Krka River source; 2—Krka Knin) and its position in the Republic of Croatia.
Environments 09 00014 g001
Figure 2. Calcified structures of one analyzed fish observed under the light microscope and prepared for LA ICP-MS: (a) grinded and polished otolith; (b) cleaned and mounted scales.
Environments 09 00014 g002
Figure 3. Calcified structures after LA ICP-MS measurements observed under the light microscope: cross-sectional lines through the whole lengths and core of: (a) otolith; (b) selected scale with most visible growth zones.
Environments 09 00014 g003
Table 1. Biometric characteristics (mean ± S.D.) of S. trutta caught in the Krka River at two sampling sites (reference site: Krka River source; contaminated site: Krka Knin) and epidemiological characteristics of acanthocephalans D. truttae hosted in S. trutta: prevalence (number and percentage of infected fish), mean intensity of infection (average ± S.E.) and total number of parasite individuals.
Krka River Source
n = 18
Krka Knin
n = 17
Point Sources of PollutionReference Site—Unknown Pollution SourcesContaminated Site—Screw Factory, Industrial and Municipal Wastewaters, Agricultural Runoff
Total length (cm)20.4 ± 4.224.4 ± 13.5
Body mass (g)114.4 ± 81.2339.4 ± 601.4
HSI (%)1.3 ± 0.51.3 ± 0.6
GSI (%)0.37 ± 0.240.25 ± 0.16
FCI (g cm−3 × 100)1.2 ± 0.41.1 ± 0.3
Sex (M/F/ND *)9/9/05/10/2
Prevalence (number and % of
trout infected with parasites)
17; 94%13; 76%
Mean intensity of infection (mean ± S.E.)40.3 ± 8.932.1 ± 11.3
Total number of parasite
individuals in sampled fish
685417
* M—male, F—female, ND—not determined.
Table 2. Elemental content (mean ± S.D.) in the water (μg L−1) of the Krka River at two sampling sites (reference site: Krka River source; contaminated site: Krka Knin).
Krka River Source
n = 3
Krka Knin
n = 3
Ba (µg L−1)4.38 ± 0.11 *5.69 ± 0.10 *
Fe (µg L−1)0.340 ± 0.060 *11.62 ± 1.89 *
Mg (µg L−1)11630 ± 130 *11100 ± 180 *
Mn (µg L−1)0.010 ± 0.004 *6.73 ± 0.10 *
Rb (µg L−1)0.280 ± 0.005 *0.460 ± 0.001 *
Sr (µg L−1)88.42 ± 1.72 *186.2 ± 1.0 *
Tl (µg L−1)0.006 ± 0.0000.005 ± 0.000
Zn (µg L−1)3.57 ± 0.62 *30.03 ± 4.53 *
Statistically significant differences (Mann–Whitney U test, p < 0.05) between the two sites are assigned with asterisk (*).
Table 3. Elemental content (mean ± S.D., μg g−1 w.m.) in soft tissues (liver, muscle) and intestinal parasites (acanthocephalans) of brown trout from the Krka River at two sampling sites (reference site: Krka River source; contaminated site: Krka Knin).
LiverMuscleAcanthocephalans
µg g−1 w.m.Krka River Source
n = 18
Krka Knin
n = 15
Krka River Source
n = 6
Krka Knin
n = 6
Krka River Source
n = 10
Krka Knin
n = 10
Ba0.311 ± 0.0880.365 ± 0.1090.013 ± 0.001 *0.021 ± 0.08 *0.325 ± 0.160 *0.592 ± 0.255 *
Fe27.79 ± 9.2533.60 ± 13.714.74 ± 1.42 *2.98 ± 0.62 *13.04 ± 3.75 ***50.70 ± 26.05 ***
Mg93.02 ± 5.3691.56 ± 8.15300.3 ± 14.2 *328.8 ± 17.8 *197.9 ± 21.9235.2 ± 61.4
Mn0.716 ± 0.1150.785 ± 0.1240.111 ± 0.0240.170 ± 0.0903.25 ± 0.304.56 ± 2.02
Rb4.93 ± 2.023.73 ± 1.794.12 ± 0.404.13 ± 1.322.27 ± 0.37 *1.74 ± 0.59 *
Sr0.013 ± 0.010 *0.037 ± 0.048 *0.079 ± 0.0890.189 ± 0.2041.15 ± 0.92 **3.50 ± 2.07 **
Tl0.192 ± 0.0990.164 ± 0.0960.016 ± 0.005 *0.009 ± 0.005 *1.49 ± 1.221.07 ± 0.83
Zn19.44 ± 3.9220.72 ± 5.182.11 ± 0.602.23 ± 0.8439.95 ± 14.38 *128.6 ± 151.9 *
Statistically significant differences (Mann–Whitney U test) between the two sites are assigned with asterisk (p < 0.05 *, p < 0.01 **, p < 0.001 ***).
Table 4. Elemental content (mean ± S.D.) in hard tissues (scales, otoliths; μg g−1) of brown trout from the Krka River at two sampling sites (reference site: Krka River source; contaminated site: Krka Knin).
ScalesOtoliths
µg g−1Krka River Source
n = 3
Krka Knin
n = 3
Krka River Source
n = 3
Krka Knin
n = 3
Ban.d.n.d.0.910 ± 0.2200.980 ± 0.100
Fe69.14 ± 27.9476.60 ± 38.12n.d.n.d.
Mg4300 ± 4694094 ± 31780.75 ± 2.2977.51 ± 6.17
Mn9.26 ± 3.1420.81 ± 10.160.860 ± 0.2101.57 ± 0.81
Rbn.d.n.d.1.64 ± 0.681.23 ± 0.46
Sr87.84 ± 22.76205.7 ± 74.4335.0 ± 56.6789.2 ± 563.3
Tln.d.n.d.0.400 ± 0.0600.230 ± 0.020
Zn72.15 ± 25.36113.8 ± 29.820.97 ± 7.8326.43 ± 6.85
Publisher’s Note: MDPI stays neutral with regard to jurisdictional claims in published maps and institutional affiliations.

